Embed Size (px)
Citation preview

Colorado Health Care
Reform: The Path
Ahead
Senator Irene Aguilar, MD

Where we’ve been

Distribution of Health Plan Enrollment for Covered Workers, by Plan Type, 1988-2012
Note: Information was not obtained for POS plans in 1988. A portion of the change in plan type enrollment for 2005 is likely attributable to incorporating more recent Census Bureau estimates of the number of state and local government workers and removing federal workers from the weights. See the Survey Design and Methods section from the 2005 Kaiser/HRET Survey of Employer-Sponsored Health Benefits for additional information.
Source: Kaiser/HRET Survey of Employer-Sponsored Health Benefits, 1999-2012; KPMG Survey of Employer-Sponsored Health Benefits, 1993, 1996; The Health Insurance Association of America (HIAA), 1988.
2%
<1%
1%
1%
1%

Average Annual Premiums for Single and Family Coverage,
1999-2012
* Estimate is statistically different from estimate for the previous year shown (p<.05).
Source: Kaiser/HRET Survey of Employer-Sponsored Health Benefits, 1999-2012.
$15,745*

Cumulative Increases in Health Insurance Premiums, Workers’ Contributions to Premiums, Inflation, and
Workers’ Earnings, 1999-2011
Source: Kaiser/HRET Survey of Employer-Sponsored Health Benefits, 1999-2011. Bureau of Labor Statistics, Consumer Price Index, U.S. City Average of Annual Inflation (April to April), 1999-2011; Bureau of Labor Statistics, Seasonally Adjusted Data from the Current Employment Statistics Survey, 1999-2011 (April to April).
Job-based health insurance premiums rise sharplyBy Tony Pugh, McClatchy NewspapersPosted: 09/28/2011

Government Insurance
4 Million
CO Medicaid = 560,722
CHP + = 69,008
Government Insurance
4 Million
CO Medicaid = 560,722
CHP + = 69,008
2011: 48.6 Million Uninsured2011: 48.6 Million Uninsured
2011 Colorado:
829,180 uninsured
16% of population
2011 Colorado:
829,180 uninsured
16% of population
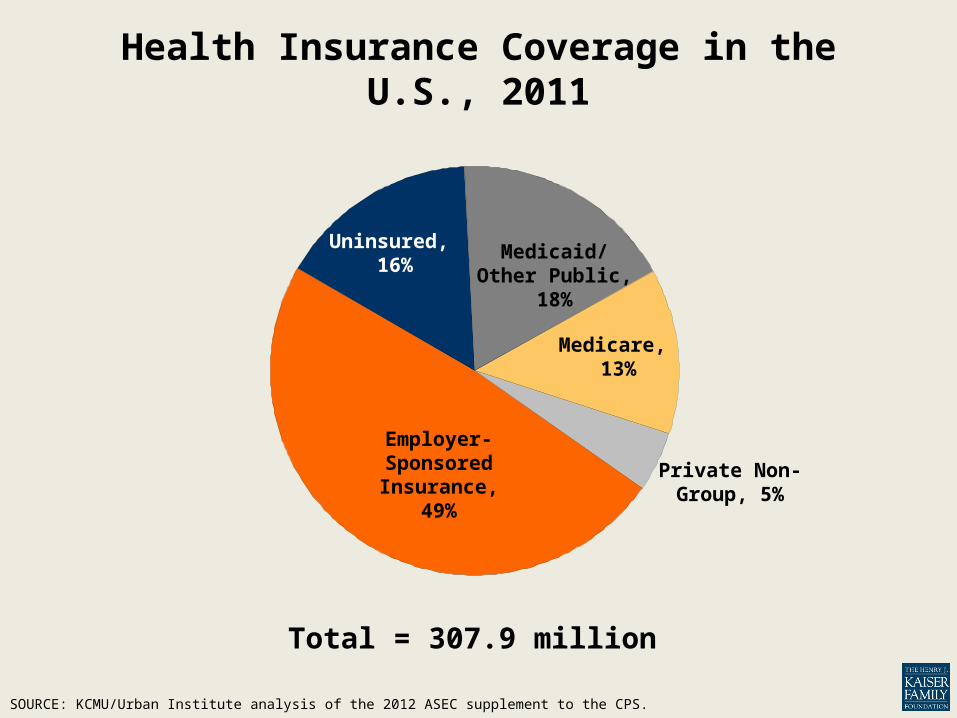
Health Insurance Coverage in the U.S., 2011
SOURCE: KCMU/Urban Institute analysis of the 2012 ASEC supplement to the CPS.
Total = 307.9 million
Employer-Sponsored Insurance,
49%
Medicaid/Other Public,
18%
Medicare, 13%
Private Non-Group, 5%
Uninsured, 16%

Where we’re going

PATIENT PROTECTION AND AFFORDABLE CARE ACT
2010Prohibited RescissionProhibited denial of coverage to children with
pre-existing conditionsEliminated lifetime limits on coverageRequired Free Preventive CareAllowed children under 26 to stay on parents’
plans
PATIENT PROTECTION AND AFFORDABLE CARE ACT
2010Medicare donut hole rebate of $250 Required insurance companies to justify
premium increases

PATIENT PROTECTION AND AFFORDABLE CARE ACT
2011Implemented Medical Loss Ratio of 80/85%Prescription drug discounts for seniorsFree preventive care for seniorsCenter for Medicaid & Medicare InnovationIndependent Payment Advisory BoardCommunity First Choice Program
PATIENT PROTECTION AND AFFORDABLE CARE ACT
2012-2013Streamline Administrative FunctionPayment reformIncrease Medicaid payment for Primary Care
and preventive health services

PATIENT PROTECTION AND AFFORDABLE CARE ACT
2014Prohibits discrimination due to pre-existing
conditions or genderRequires the purchase of Insurance (individual
mandate) Eliminate annual limits on insurance coveragePremiums in the individual and small group markets
may vary only by family structure, geography, the actuarial value of the benefit, age (3:1) and tobacco use (1.5:1)

2013 Federal Poverty Levels

PATIENT PROTECTION AND AFFORDABLE CARE ACT
2014 (continued)Allows expansion of Medicaid to 133% FPLPremium Tax credits for 133 – 400% FPLCost sharing subsidies for those at < 250% FPLInsurance Exchanges are source for premium
assistance : Connect for Health Colorado1-855-PLANS-4-You
www.ConnectforHealthCO.com
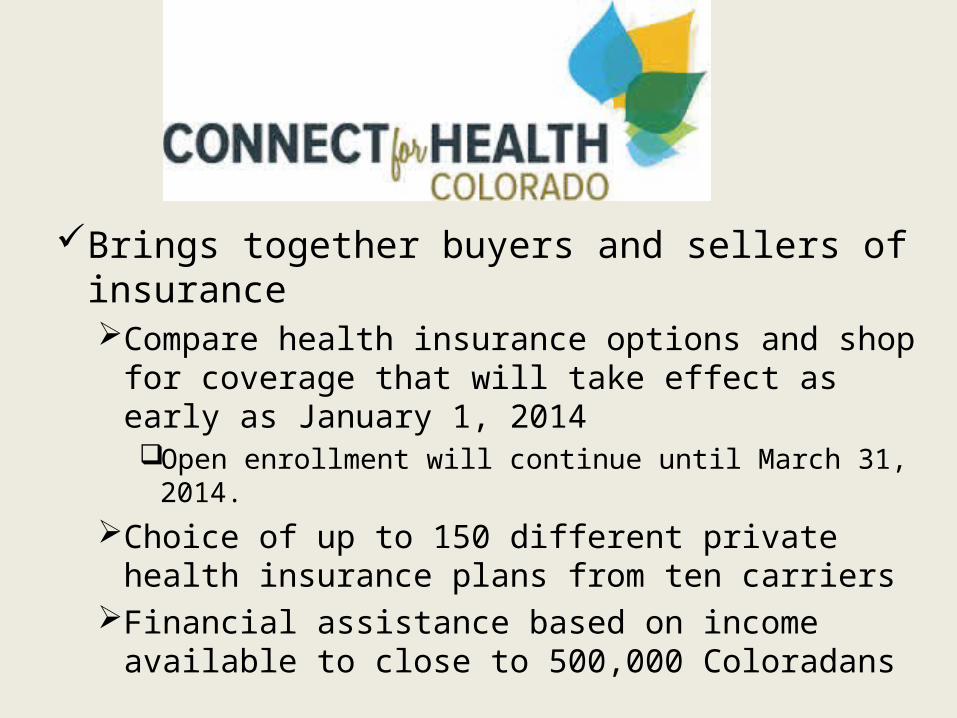
Brings together buyers and sellers of insuranceCompare health insurance options and shop for
coverage that will take effect as early as January 1, 2014Open enrollment will continue until March 31, 2014.
Choice of up to 150 different private health insurance plans from ten carriers
Financial assistance based on income available to close to 500,000 Coloradans
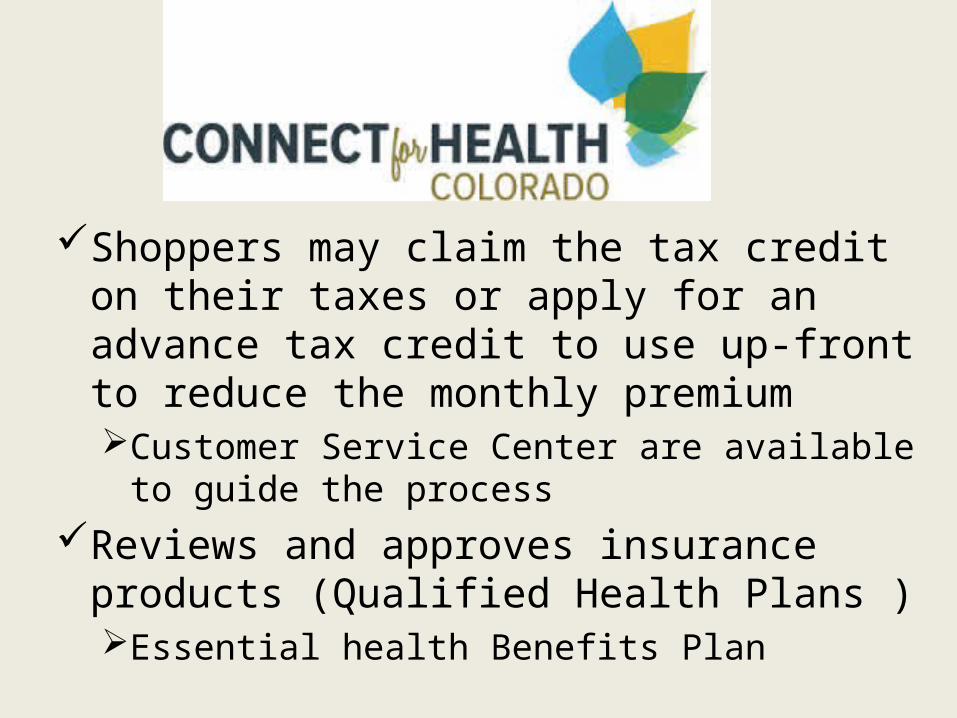
Shoppers may claim the tax credit on their taxes or apply for an advance tax credit to use up-front to reduce the monthly premium Customer Service Center are available to guide the
processReviews and approves insurance products
(Qualified Health Plans )Essential health Benefits Plan

Small employers can create small group plans from as many as 92 health insurance plans provided by six carriers
For the first time, they can offer their employees a choice of health insurance carriers and health plans
Small employers can apply for tax credits based on the size and average wages of the business, to help cover the cost of health insurance premiums
Customer service representatives are available to help

As of October 4th
Over 15,000 accounts created
8,781 calls and chats in the Service Center
145,000 unique visitors

Colorado’s Next Steps:
1. Connect for Health Colorado – opened 10.1.13 Monitor for “gaming” of exchange
2. Medicaid will be expanded to 133% of FPL Identify ways to reduce Medicaid “churn”
3. Continue to work on Cost Control

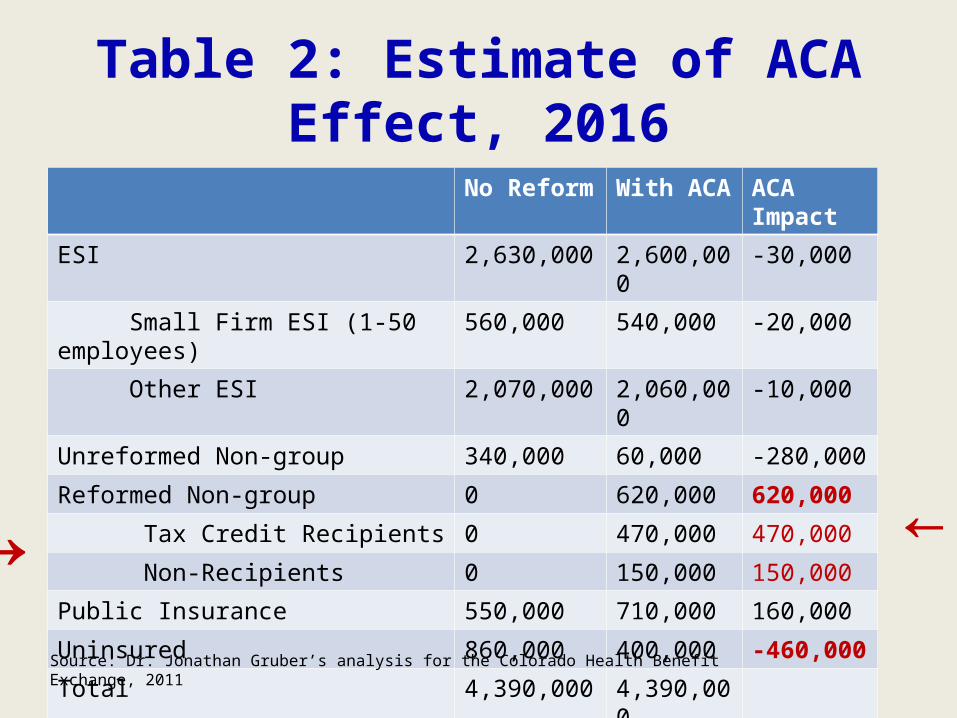
Table 2: Estimate of ACA Effect, 2016
No Reform With ACA ACA Impact
ESI 2,630,000 2,600,000 -30,000
Small Firm ESI (1-50 employees) 560,000 540,000 -20,000
Other ESI 2,070,000 2,060,000 -10,000
Unreformed Non-group 340,000 60,000 -280,000
Reformed Non-group 0 620,000 620,000
Tax Credit Recipients 0 470,000 470,000
Non-Recipients 0 150,000 150,000
Public Insurance 550,000 710,000 160,000
Uninsured 860,000 400,000 -460,000
Total 4,390,000 4,390,000→ →
→
Source: Dr. Jonathan Gruber’s analysis for the Colorado Health Benefit Exchange, 2011

Dr. Jonathan Gruber 9/16/11
22%
39%
10%
29%
24

Since 2006, the cost of the state’s insurance program has increased by 42 percent, or almost $600 million. According to an analysis by the Rand Corporation, “in the absence of policy change, health care spending in Massachusetts is projected to nearly double to $123 billion in 2020, increasing 8 percent faster than the state’s gross domestic product (GDP).”


ORIGINAL BY: John A. Nyman, PhDUniversity of Minnesota
27
US v. Other G7 Countries Updated
Canada France Germ. Italy Japan UK Avg USA
MD visits (2009)per capita
6.5 6.9 8.2 NA 13.2* 5.0 6.3 3.9
Hosp dischargesper 100 pop (2009)
8.4 17.0 26.3 NA NA 13.3 16.0 13.1
Avg hospitalLOS (2009)
7.7 5.2 7.5 NA NA 6.8 5.9 5.4
Hospital days per 100 population
144.0 83.2
HC spending (2010)
per capita (PPP)
$4,445
$3,974
$4,338
$2,964
NA $3,433
$3,831
$8,232
HC spending as % of GDP (2010)
11.4 11.6 11.6 9.3 NA 9.6 10.6 15.8
LE at birth (2010)
80.8 (08)
80.2 80.5 82 (09) 83 80 81.1 78.7
Infant deaths per 1000 live births (2010)
NA 3.6 3.4 3.4 2.3 4.2 3.4 6.1OECD website : http://stats.oecd.org/index.aspx
The spending per capita numbers were converted from the currency of the country to US dollars by a PPP index.

American Ingenuity at Work


Drug Prices for 30 Most Commonly Prescribed Drugs, 2006–07
US is set at 1.0
0.34
0.440.450.490.51
0.63
0.760.77
1.00
0.0
0.2
0.4
0.6
0.8
1.0
US CAN GER SWIZ UK AUS NETH FR NZ
Source: IMS Health.

New HampshireInsurers Disparate Payments
What is the Price? Range for What Insurance Pays to Health Care Provider Per Procedure
Colonoscopy Mammogram MRI (back)(Outpatient)
Insurer A 1,353 - 4,611 227 - 881 645 - 2,790
Insurer B 1,270 - 3,121 161 - 564 640 – 2,292
Insurer C 1,195 - 3,524 129 - 612 732 - 2,659
Source: CMWF analysis of data retrieved October 2010 from: http://www.nhhealthcost.org/costByProcedure.aspx
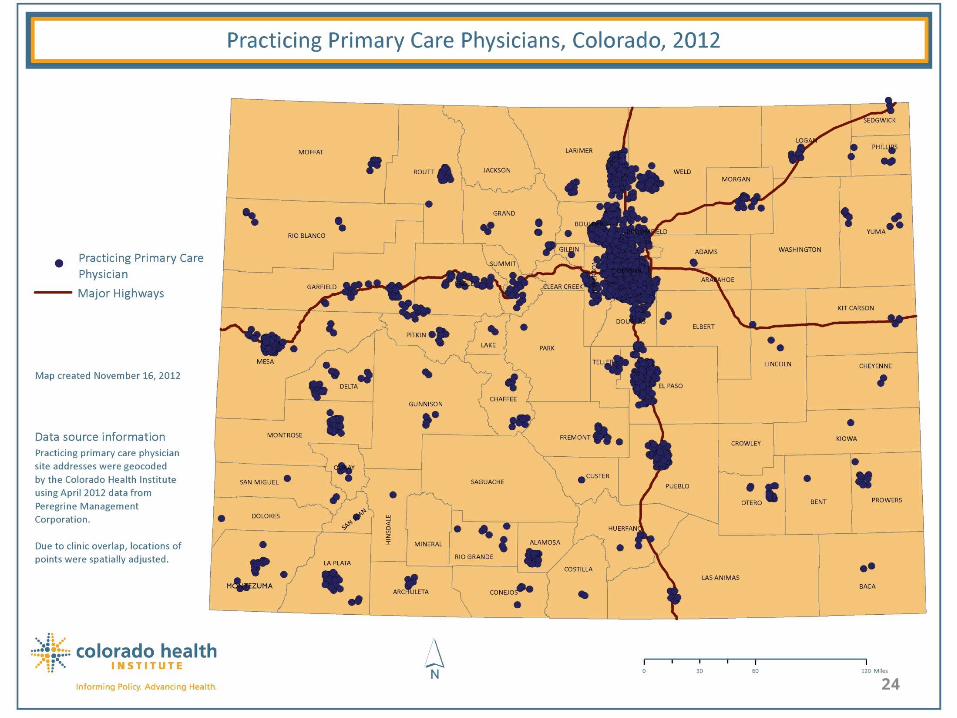
Advanced primary care networks


Variations Among Academic Medical CentersUCLA Mass
General Mayo Clinic
CMS Inpatient Quality Score
81.5 85.9 90.4
Source: Elliot Fisher, Dartmouth Medical School
Care Delivery & Spending, last 6 months of life
Total Medicare Spending
$50,522 $40,181 $26,330
Hospital Days
Physician Visits19.2
52.1
17.7
42.2
12.9
23.9Specialist/ Primary Care Ratio
2.9 1.0 1.0

Source: The Dartmouth Atlas of Health Care.
DENOMINATOR DEFINITION:A 20% random sample of the enrollment file for beneficiaries age 65-99 enrolled in both Medicare Parts A and B, selected on the basis of the terminal digits in the Social Security number. Patients enrolled in risk-bearing health maintenance organizations (HMOs) are excluded.ADJUSTMENTS:Rates are adjusted for age, sex and race using the indirect method, using the U.S. Medicare population as the standard. Gender-specific rates are age and race adjusted; race-specific rates are age and sex adjusted.
Medicare Payments per Enrollee, by Hospital Referral Region, 2009
Research shows significant variation in health care spending.

Massachusetts: Private, Medicare & Medicaid Payment for Professional Procedures
MinPrice
Max Price
Office Visit
$45 $330
MRI Brain
$104 $646
Colon-oscopy
$203 $1,045
Private Payer Payment Variation
Source: Massachusetts Division of Health Care Finance and Policy, Massachusetts Health Care Cost Trends: Price Variation in Massachusetts Health Care Services, May 2011.

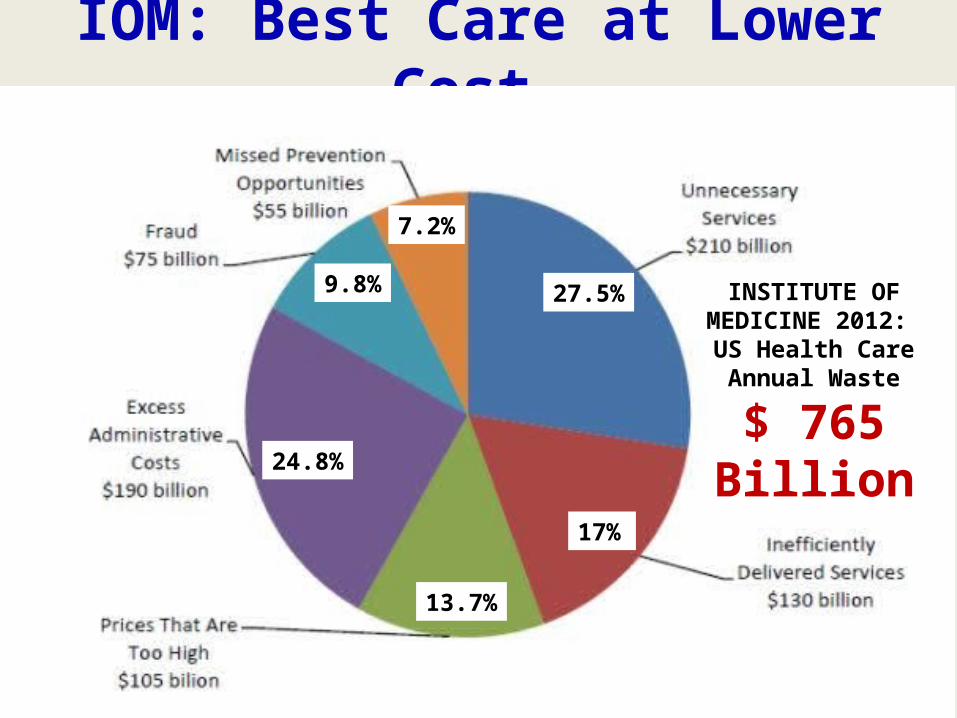
IOM: Best Care at Lower Cost
9.8%
7.2%
27.5%
17%
13.7%
24.8%
INSTITUTE OF MEDICINE 2012: US Health Care Annual Waste
$ 765 Billion

Determinants of Health
2011 U.S.
Healthcare Spending:
$2.7 Trillion

Number of U.S. Deaths from Behavioral Causes

Note: Dollar amounts in parentheses are the annual expenses per person in each percentile. Population is the civilian noninstitutionalized population, including those without any health care spending. Health care spending is total payments from all sources (including direct payments from individuals and families, private insurance, Medicare, Medicaid, and miscellaneous other sources) to hospitals, physicians, other providers (including dental care), and pharmacies; health insurance premiums are not included.
Source: Kaiser Family Foundation calculations using data from U.S. Department of Health and Human Services, Agency for Healthcare Research and Quality, Medical Expenditure Panel Survey (MEPS), Household Component, 2009.
Concentration of Health Care Spending in the U.S. Population, 2009
(≥$51,951) (≥$17,402) (≥$9,570) (≥$6,343) (≥$4,586) (≥$851) (<$851)
Perc
ent o
f Tot
al H
ealth
Car
e Sp
endi
ng

Distribution of Medicaid enrollment & expenditures by eligibility category,
FY 2010-2011

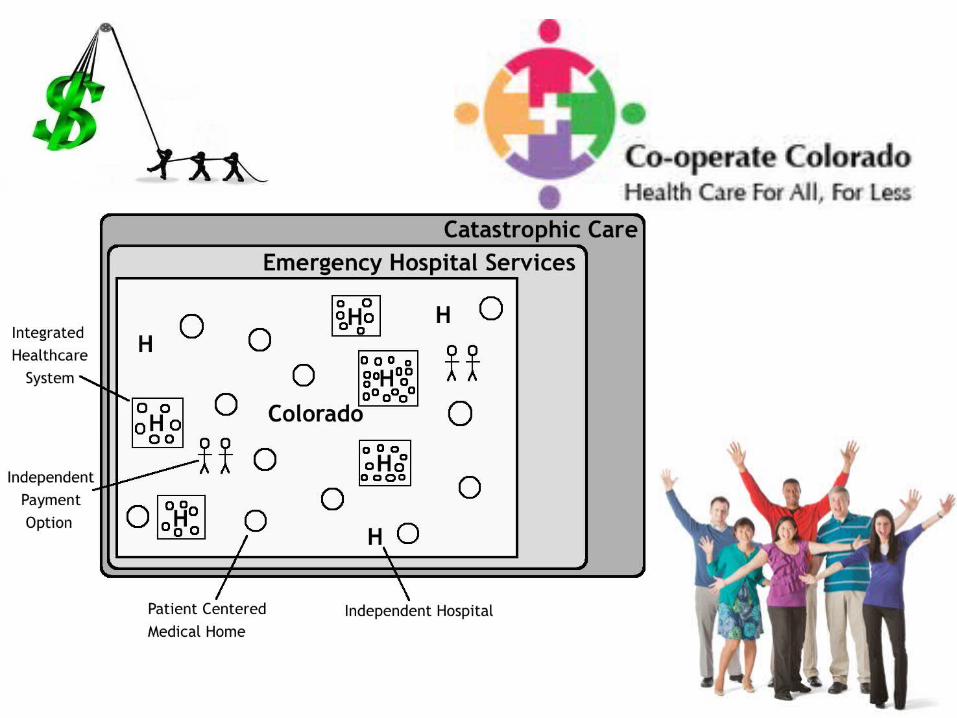

Figure 4. Share of Colorado population without health insurance coverage, alternative funding
programs, 2015-24.
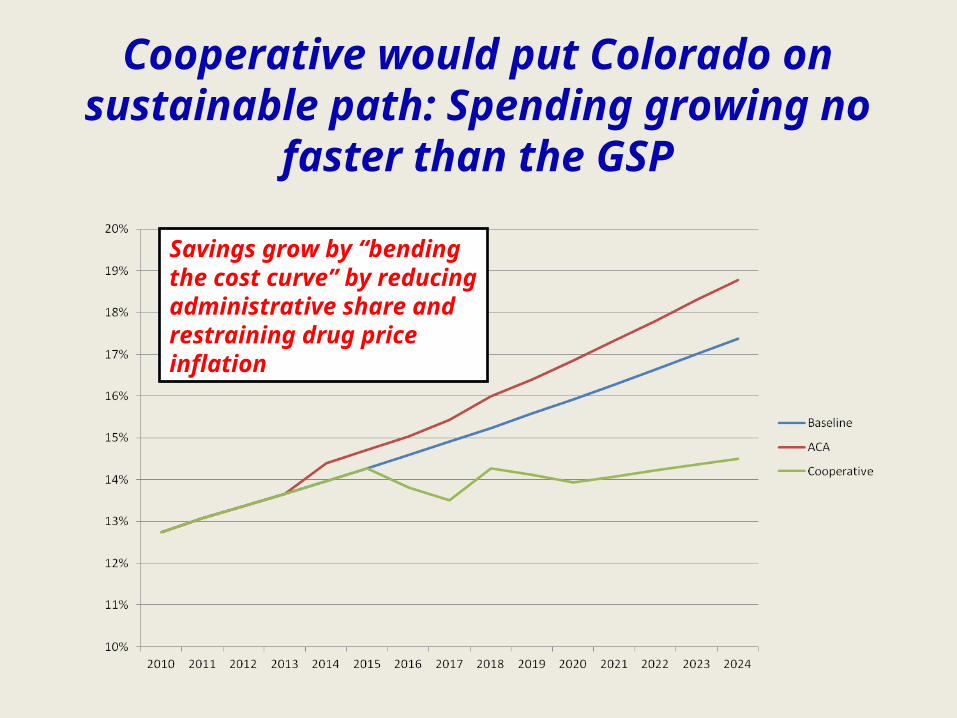
Cooperative would put Colorado on sustainable path: Spending growing no
faster than the GSP
Savings grow by “bending the cost curve” by reducing administrative share and restraining drug price inflation

Savings under the Cooperative come from reducing administrative waste
SAVINGS: 2016: $7.7 billion @ 16% 2024: $ 24 billion @ 28%