Embed Size (px)
Citation preview

Colorado Agricultural Statistics
2014
National Agricultural Statistics Service Colorado Field Office


United States Department of Agriculture National Agricultural Statistics Service
Joseph Reilly, Administrator ___________________________________________________________________________________________
Prepared and Published by
USDA NASS Mountain Regional Office
PO Box 150969
Lakewood, Colorado 80215
303-236-2300 / 800-392-3202
e-Mail: [email protected]
This report is also available on the Internet at : www.nass.usda.gov/co
William Meyer Regional Director
Rodger Ott Regional Deputy Director
Estimate Group
Leslee Lohrenz Regional Deputy Director
Survey Group
Steve Gunn Cody Brokmeyer Kerry McBride Julie Schmidt Group Leader Group Leader Group Leader Group Leader
*Cover photo courtesy of Colorado Department of Agriculture 2013 photo contest winner Jim Cox of Palisade, CO. Photo taken in Palisade, CO.
COLORADO AGRICULTURAL STATISTICS
305 Interlocken Parkway, Broomfield, CO 80021 P 303.869.9000 F 303.466.2867
www.colorado.gov/ag
September 2014
Dear Friends,
I am pleased to introduce the 2014 Colorado Agricultural Statistics Bulletin. Within these pages is information that can help shape Colorado’s future. The Colorado
Agricultural Statistics Service (CASS) offers statistics that provide a current snapshot of our agricultural community and will allow you to make decisions based off of solid data.
As a $40 billion industry, Colorado’s ag industry provides a safe, abundant food supply while generating economic activity that is essential to this state’s vitality. Tracking
this information is important, not only in showing the value of our industry, but to assist in making informed decisions that will affect us all.
The Colorado Department of Agriculture is dedicated to promoting agriculture on the local, state, national, and global level and consider these statistics a valuable resource in that effort.
I would like to thank CASS, the National Agricultural Statistics Service, and all of the farmers and ranchers who make this book possible.
Sincerely,
John T. Salazar Commissioner
The Colorado Agricultural Statistics publication is compiled by the Colorado Agricultural Statistics Service, which is an agency within the U.S. Department of
Agriculture, in cooperation with the Colorado Department of Agriculture.
United States Department of Agriculture National Agricultural Statistics Service
___________________________________________________________________________________________
September 2014
Dear Friends of Agriculture:
What a difference a year makes. Growing conditions for much of the state were much better in
2014 than last year. Welcome rains and adequate water storage were a vast improvement in
many areas compared to 2013. There are still pockets of the state that are suffering from drought
which hopefully the cycle will change for them. This year brought better conditions for much of
the nation, improving the prospects for a large crop, which has caused pressure on commodity
prices. The livestock sector continues to see very good prices, but the cost of production remains
high.
In an environment like this year, and in any year, good information is needed to make good
decisions. Therefore, I am pleased to present the 2014 Colorado Agricultural Statistics Bulletin
made available through the Mountain Regional Field Office of USDA’s National Agricultural
Statistics Service in cooperation with the Colorado State Department of Agriculture. The
estimates available in this bulletin and what we publish throughout the year are valuable tools for
the producer and the agricultural industry to make sound decisions. This information is used for
marketing decisions, planning, research, insurance and disaster programs, and policy decisions.
Thank you to the farmers and ranchers for taking time out of their busy schedules to provide the
data needed to produce these statistics. I also want to thank all the agribusinesses, extension
educators and USDA's Farm Service Agency for contributing information for this bulletin and
providing support for our programs.
This report would not be possible without the dedicated effort of field and telephone interviewers
who collect this data and the office staff that compiles it. I would like to thank Jim Cox of
Palisades, CO for the cover photography, and a special thanks to the Colorado Department of
Agriculture for covering the costs of printing this bulletin.
Finally, USDA NASS released the 2012 Census of Agriculture last February. The Census of
Agriculture is the most comprehensive set of county data in the nation. Please visit
www.agcensus.usda.gov to see all the products and information available.
Sincerely,
William Meyer
Director
USDA NASS Mountain Regional Field Office

USDA, NASS · COLORADO FIELD OFFICE STAFF
Management
Director William Meyer Deputy Director Leslee Lohrenz, Survey Group Deputy Director Rodger Ott, Estimate Group
Administration
Michele Burger · Jeff Claxton · Greg Ellis · Maureen Kruse · Lori Mendoza
Survey Group
Group Leader Cody Brokmeyer Group Leader Kerry Mc Bride
Statisticians
Jose Acosta · Andrew Cochran · Rhonda Dinan · Julie Meining · Renee Cochran Paul Post · Angela Umlauf Statistical Assistant · Roseann Monge
Estimate Group
Group Leader Group Leader
Steve Gunn Julie Schmidt
Statisticians
Maria Bautista · Sean De Roon · Mark Johnson · Jenny Matthies · Christel Pachl · Lisa Prickett · Tom Sabel · Evan Swindall · Tom Vesey
Statistical Assistant · Sharon Cochrane
NATIONAL ASSOCIATION OF STATE DEPARTMENTS OF AGRICULTURE (NASDA) STAFF
Office Enumerators
Supervisor Cecilia Boucher Albert Bollwerk · Gayle Drager · Dee Ann Gill · Tina Logsdon · Michelle Naish
Field Enumerators
Supervisors Bonnie Egan, Greeley · Bette Hertneky, Calhan · Smiley Shawcroft, Alamosa David Abbott, Kremmling · Kris Crump, Rocky Ford · Talana Davis, Burlington Nancy Beattie, Longmont · Jennifer Blair, Craig · Diane Coggin, Edwards Kenneth Eberhardt, Loveland · Debra Ellison, Eads · Janorah Forrar, Yoder Steve Ganitsch, Holyoke · Beverly Glover, Avondale · Julie Hansen, Cope Denise Jenkins, Campo · Mary Kindall, Grand Junction · Linda Larsen, Manassa Deborah Locke, Mack · Don Mitchell, Brush · Pete Mitchell, Brush Donna Mosier, Burlington · Donna Musgrave, Wiggins · Carrie Rehor, Vona
Judy Reyher, La Junta · Lu Stofer, Denver · Tamara Tamburelli, Boncarbo Bill VanWell, Akron · Marilynn VanWell, Akron

AGRICULTURAL STATISTICS DISTRICTS
ASD by Number: Northwest and Mountains = 10; Northeast = 20; East Central = 60; Southwest = 70;
San Luis Valley = 80; Southeast = 90
COLORADO The Centennial State, admitted to the Union in 1876, is the eighth largest state in area and has the highest average
elevation. The highest point is at Mount Elbert, 14,433 feet above sea level, one of the 53 "fourteeners" rising above
14,000 feet. The lowest elevation is 3,350 feet in extreme eastern Prowers County.
Approximate Land Area: 66.3 Million Acres
Approximate Cropland Area: 10.6 Million Acres*
Approximate Irrigated Area: 2.6 Million Acres*
Number of Farms and Ranches (2013): 35,600
Average Size of Farm and Ranch (2013): 890 Acres
Farms by Type* Farms by Tenure* Farms by Class*
81.2% Individual 72% Full Owners 56.1% Livestock & Poultry 8.9% Partnership 22% Part Owners 43.9% Crops 7.0% Corporate 6% Tenants 2.9% Other
Farm Marketing Receipts (2012): $7,638,232 Million
Livestock & Livestock Products: $4,739,833 Million (62% of the total)
Field, Fruit & Vegetable Crops: $2,898,399 Million (38% of the total)
* 2012 Census of Agriculture
NORTHWEST
& MOUNTAINSNORTHEAST
EAST CENTRAL
SOUTHWEST
SAN LUIS
VALLEYSOUTHEAST

Colorado Agricultural Statistics 2014 1
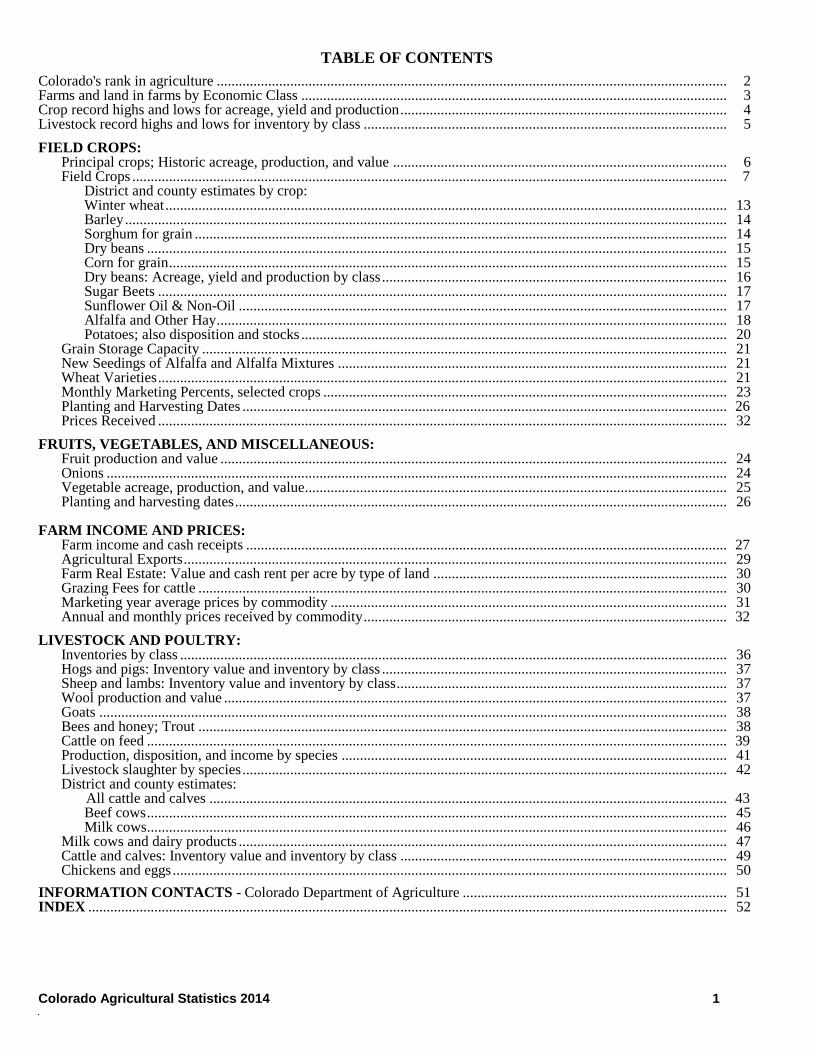
TABLE OF CONTENTS
Colorado's rank in agriculture ........................................................................................................................................... 2 Farms and land in farms by Economic Class .................................................................................................................... 3 Crop record highs and lows for acreage, yield and production ......................................................................................... 4 Livestock record highs and lows for inventory by class ................................................................................................... 5 FIELD CROPS: Principal crops; Historic acreage, production, and value ........................................................................................... 6 Field Crops .................................................................................................................................................................. 7 District and county estimates by crop: Winter wheat ......................................................................................................................................................... 13 Barley .................................................................................................................................................................... 14 Sorghum for grain ................................................................................................................................................. 14 Dry beans .............................................................................................................................................................. 15 Corn for grain ........................................................................................................................................................ 15 Dry beans: Acreage, yield and production by class .............................................................................................. 16 Sugar Beets ........................................................................................................................................................... 17 Sunflower Oil & Non-Oil ..................................................................................................................................... 17 Alfalfa and Other Hay ........................................................................................................................................... 18 Potatoes; also disposition and stocks .................................................................................................................... 20 Grain Storage Capacity ............................................................................................................................................... 21 New Seedings of Alfalfa and Alfalfa Mixtures .......................................................................................................... 21 Wheat Varieties ........................................................................................................................................................... 21 Monthly Marketing Percents, selected crops .............................................................................................................. 23 Planting and Harvesting Dates .................................................................................................................................... 26 Prices Received ........................................................................................................................................................... 32 FRUITS, VEGETABLES, AND MISCELLANEOUS: Fruit production and value .......................................................................................................................................... 24 Onions ......................................................................................................................................................................... 24 Vegetable acreage, production, and value................................................................................................................... 25 Planting and harvesting dates ...................................................................................................................................... 26 FARM INCOME AND PRICES: Farm income and cash receipts ................................................................................................................................... 27 Agricultural Exports .................................................................................................................................................... 29 Farm Real Estate: Value and cash rent per acre by type of land ................................................................................ 30 Grazing Fees for cattle ................................................................................................................................................ 30 Marketing year average prices by commodity ............................................................................................................ 31 Annual and monthly prices received by commodity ................................................................................................... 32 LIVESTOCK AND POULTRY: Inventories by class ..................................................................................................................................................... 36 Hogs and pigs: Inventory value and inventory by class .............................................................................................. 37 Sheep and lambs: Inventory value and inventory by class .......................................................................................... 37 Wool production and value ......................................................................................................................................... 37 Goats ........................................................................................................................................................................... 38 Bees and honey; Trout ................................................................................................................................................ 38 Cattle on feed .............................................................................................................................................................. 39 Production, disposition, and income by species ......................................................................................................... 41 Livestock slaughter by species .................................................................................................................................... 42 District and county estimates: All cattle and calves ............................................................................................................................................. 43 Beef cows .............................................................................................................................................................. 45 Milk cows .............................................................................................................................................................. 46 Milk cows and dairy products ..................................................................................................................................... 47 Cattle and calves: Inventory value and inventory by class ......................................................................................... 49 Chickens and eggs ....................................................................................................................................................... 50 INFORMATION CONTACTS - Colorado Department of Agriculture ........................................................................ 51 INDEX .............................................................................................................................................................................. 52

2 Colorado Agricultural Statistics 2014
Rank in Agriculture: Colorado's rank among states, 2013
Commodity
Unit
Colorado Leading State United States
Rank Production State Production
FIELD CROPS: Barley ............................................ 1,000 bu. 6 7,714 Idaho 55,800 215,078
Beans, dry edible ........................... 1,000 cwt. 9 540 North Dakota 7,095 24,486
Corn, grain .................................... 1,000 bu. 18 129,690 Iowa 2,161,500 13,925,147
Corn, silage .................................... 1,000 tons 15 2,300 Wisconsin 16,170 117,851
Hay, all ........................................... 1,000 tons 19 2,941 Texas 8,880 135,946
Hay, alfalfa ..................................... 1,000 tons 15 1,885 California
Dakota
6,120 57,581
Hay, other...................................... 1,000 tons 24 1,056 Texas 8,250 78,365
Oats ............................................... 1,000 bu. 22 780 South Dakota 9,240 65,879
Potatoes, fall ................................. 1,000 cwt. 6 20,279 Idaho 131,131 398,106
Proso millet ................................... 1,000 bu. 1 8,250 Colorado 8,250 18,436
Sorghum, grain .............................. 1,000 bu. 9 5,760 Kansas 165,200 389,046
Sorghum, silage ............................ 1,000 tons 3 390 Texas 1,800 5,420
Sugarbeets .................................... 1,000 tons 9 861 Minnesota 11,076 32,813
Sunflower, all ................................. 1,000 lbs. 7 47,200 South Dakota 996,800 2,032,725
Sunflower, oil varieties ................... 1,000 lbs. 7 31,200 South Dakota 820,800 1,646,805
Sunflower, non-oil varieties ............ 1,000 lbs. 6 16,000 South Dakota 176,000 385,920
Wheat, all 1/ .................................. 1,000 bu. 16 45,018 Kansas 319,200 2,129,695
Wheat, other spring ...................... 1,000 bu. 8 738 North Dakota 235,290 533,529
Wheat, winter ................................ 1,000 bu. 14 44,280 Kansas 319,200 1,534,253
VEGETABLES: 2/ Cabbage ............................................................................................................................................................................................................................. 1,000 cwt. 11 564 California 5,670 22,065
Cantaloupe .......................................................................................................................................................................................................................... 1,000 cwt. 8 120 California 12,750 18,134
Corn, sweet ......................................................................................................................................................................................................................... 1,000 cwt. 9 656 California 6,120 29,880
Onions (summer storage) .................................................................................................................................................................................................... 1,000 cwt. 5 1,700 California 11,700 50,820
FRUITS: Apples ................................................................................................................................................................................................................................. Mil lbs 28 5,600 Washington 5,950,000 10,051,700
Peaches .............................................................................................................................................................................................................................. Tons 11 7,330 California 648,000 901,728
LIVESTOCK: 3/ All cattle & calves ................................................................................................................................................................................................................ 1,000 head 11 2,480 Texas 10,900 87,730
All cows 4/ ........................................................................................................................................................................................................................... 1,000 head 17 840 Texas 4,350 38,251
All chickens ......................................................................................................................................................................................................................... 1,000 head 20 5,994 Iowa 65,830 464,328
All hogs & pigs..................................................................................................................................................................................................................... 1,000 head 16 690 Iowa 20,200 64,775
All layers.............................................................................................................................................................................................................................. 1,000 head 20 5,030 Iowa 54,089 352,638
All sheep & lambs ................................................................................................................................................................................................................ 1,000 head 3 365 Texas 740 5,210
Beef cows 4/ ........................................................................................................................................................................................................................ 1,000 head 14 700 Texas 3,910 29,042.4
Breeding hogs & pigs .......................................................................................................................................................................................................... 1,000 head 13 150 Iowa 970 5,757
Breeding sheep & lambs...................................................................................................................................................................................................... 1,000 head 8 170 Texas 590 3,880
Calf crop, 2013 .................................................................................................................................................................................................................... 1,000 head 18 740 Texas 3,850 33,930
Cattle on feed 5/ ................................................................................................................................................................................................................. 1,000 head 5 990 Nebraska/Texas
2,450 12,695.3
Egg production, 2013 .......................................................................................................................................................................................................... Million eggs 20 1,282 Iowa 14,815 95,176
Market hogs & pigs .............................................................................................................................................................................................................. 1,000 head 16 540 Iowa 19,230 59,018
Milk cows 4/ ......................................................................................................................................................................................................................... 1,000 head 15 140 California 1,780 9,208.6
Milk production, 2013 .......................................................................................................................................................................................................... Million lbs. 15 3,322 California 41,256 201,218
Market sheep & lambs ......................................................................................................................................................................................................... 1,000 head 2 195 California 255 1,330
Pig crop, 2013 ..................................................................................................................................................................................................................... 1,000 head 12 2,670 Iowa 20,030 116,410.4
Wool production, 2013 ......................................................................................................................................................................................................... 1,000 lbs. 5 2,100 California 2,600 27,000
MISCELLANEOUS:
Farms, 2013 ........................................................................................................................................................................................................................ Number 25 35,600 Texas 248,500 2,103,210
Land in farms, 2013 ............................................................................................................................................................................................................. 1,000 acres 9 31,700 Texas 130,100 914,240
Average size of farm, 2013 .................................................................................................................................................................................................. Acres 10 890 Wyoming 2,626 435
1/ Excludes Durum wheat for Colorado. 2/ Fresh market. 3/ Inventory January 1, 2014 for cattle and sheep; December 1, 2013 for hogs and chickens. 4/ Cows and heifers that have calved. 5/ Feedlots greater than 1,000 head.

Colorado Agricultural Statistics 2014 3
Farms: Number of farms, land in farms and average size, Colorado and U. S. 2004-2013
Colorado United States
Year Farms 1/
Land in farms
Average size
Farms 1/
Land in farms
Average Size
Number
1,000 Acres Acres Number 1,000 Acres Acres
2004 ............................. 30,900 31,100 1,006 2,112,970 932,260 441
2005 ............................. 30,500 31,100 1,020 2,098,690 927,940 442
2006 ............................. 30,700 31,300 1,020 2,088,790 925,790 443
2007 ............................. 36,900 31,400 851 2,204,950 921,460 418
2008 ............................. 36,500 31,400 860 2,184,500 918,600 421
2009 ............................. 36,100 31,300 867 2,169,660 917,590 423
2010 ............................. 36,300 31,500 868 2,149,520 915,660 426
2011 ............................. 36,600 31,600 863 2,131,240 914,420 429
2012 ............................. 36,200 31,900 881 2,109,810 914,600 433
2013 ............................. 35,600 31,700 890 2,103,210 914,240 435
1/ Places with annual sales of agricultural products of $1,000 or more.
Number of Farms: Economic sales class, Colorado and United States, 2004-2013
Colorado United States
Year Economic Sales Class Economic Sales Class
$1,000- $9,999
$10,000- $99,999
$100,000- $249,999
$250,000- $499,999
$500,000 & Over
$1,000- $9,999
$10,000- $99,999
$100,000- $249,999
$250,000- $499,999
$500,000 & Over
Number Number
2004 ............................. 17,400 9,600 2,000 900 1,000 1,181,190 599,280 167,030 88,980 76,490
2005 ............................. 17,100 9,300 2,100 900 1,100 1,166,320 596,040 167,080 89,840 79,410
2006 ............................. 17,300 9,100 2,100 1,000 1,200 1,153,310 595,950 166,220 90,960 82,350
2007 ............................. 21,000 10,600 2,500 1,300 1,500 1,228,560 608,670 150,300 97,230 120,190
2008 ............................. 20,700 10,200 2,600 1,250 1,750 1,203,020 608,390 148,000 97,020 128,070
2009 ............................. 19,700 10,900 2,650 1,150 1,700 1,193,040 603,440 146,770 96,950 129,460
2010................ 20,000 10,800 2,450 1,300 1,750 1,173,300 602,740 144,270 95,610 133,600
2011................ 20,300 10,600 2,550 1,300 1,850 1,134,210 614,800 141,830 96,110 144,290
2012................ 20,000 10,200 2,500 1,600 1,900 1,090,330 620,640 143,280 96,220 159,340
2013................ 19,500 10,000 2,550 1,650 1,900 1,080,380 620,640 144,320 96,640 161,230
Land In Farms: Economic sales class, Colorado and United States, 2004-2013
Colorado United States
Year Economic Sales Class Economic Sales Class
$1,000- $9,999
$10,000- $99,999
$100,000- $249,999
$250,000- $499,999
$500,000 & Over
$1,000- $9,999
$10,000- $99,999
$100,000- $249,999
$250,000- $499,999
$500,000 & Over
1,000 Acres 1,000 Acres
2004 ............................. 3,100 10,400 7,000 4,600 6,000 120,872 264,810 191,736 148,315 206,527
2005 ............................. 2,900 10,400 6,800 4,700 6,300 117,850 258,230 189,106 148,226 214,528
2006 ............................. 2,800 10,100 7,000 4,900 6,500 114,610 252,180 185,336 149,316 224,348
2007 ............................. 2,900 8,600 6,000 6,100 7,800 107,870 228,220 153,407 145,725 286,238
2008 ............................. 2,700 7,800 6,000 5,600 9,300 106,790 221,420 149,840 140,500 300,050
2009 ............................. 2,500 8,200 5,900 5,400 9,300 104,690 217,600 145,910 144,140 305,250
2010 ............................. 2,500 7,700 5,300 5,600 10,400 103,350 211,190 140,390 139,490 321,240
2011 ............................. 2,600 7,200 5,500 5,700 10,600 100,740 204,530 135,100 134,260 339,790
2012 ............................. 2,400 6,700 5,600 6,000 11,200 96,020 195,340 131,230 126,930 365,080
2013 ............................. 2,500 6,800 5,400 6,000 11,000 94,570 194,400 131,590 125,450 368,230

4 Colorado Agricultural Statistics 2014
Crop Record Highs and Lows for Acreage, Yield and Production, Colorado
Commodity
Record High
Year
Record Low
Year
Year Records Began
All Barley
Acres Harvested ................... 791,000 acres 1945 4,000 acres 1879/1880 1879
Yield per Acre ........................ 135.0 bu 2009 15.0 bu 1925 1879
Production ............................. 22,544,000 bu 1945 104,000 bu 1879 1879
Corn for Grain
Acres Harvested ................... 1,527,000 acres 1933 23,000 acres 1879 1879
Yield per Acre ........................ 160.0 bu 1988 6.6 bu 1934 1879
Production ............................. 182,710,000 bu 2010 400,000 bu 1881 1879
Corn for Silage
Acres Harvested ................... 299,000 acres 1972 30,000 acres 1928 1919
Yield per Acre ........................ 24.5 tons 2010 2.5 tons 1934 1919
Production ............................. 5,233,000 tons 1972 127,000 tons 1925 1919
All Dry Beans
Acres Harvested ................... 460,000 acres 1943 5,000 acres 1909 1909
Yield per Acre ........................ 2,170 pounds 2002 187 pounds 1932 1909
Production ............................. 4,275,000 cwt 1990 29,000 cwt 1909 1909
All Hay
Acres Harvested ................... 1,680,000 acres 1923 1,170,000 acres 1910 1909
Yield per Acre ........................ 3.26 tons 1998 1.16 tons 1934 1909
Production ............................. 4,780,000 tons 2001 1,452,000 tons 1934 1909
Onions
Acres Harvested ................... 17,800 acres 1995 700 acres 1918 1918
Yield per Acre ........................ 500 cwt 2004 120 cwt 1934 1918
Production ............................. 6,141,000 cwt 1995 97,000 cwt 1918 1918
All Potatoes
Acres Harvested ................... 136,000 acres 1922 6,000 acres 1879/1880 1879
Yield per Acre ........................ 401 cwt 2009 33 cwt 1889 1879
Production ............................. 32,556,000 cwt 1996 216,000 cwt 1880 1879
Sugarbeets
Acres Harvested ................... 242,000 acres 1930 2,500 acres 1985 1924
Yield per Acre ........................ 33.5 tons 2013 9.3 tons 1934 1924
Production ............................. 3,312,000 tons 1930 46,000 tons 1985 1924
All Wheat
Acres Harvested ................... 3,522,000 acres 1985 11,000 acres 1869 1869
Yield per Acre ........................ 45.5 bu 2010 8.8 bu 1934 1869
Production ............................. 139,302,000 bu 1985 275,000 bu 1869 1869

Colorado Agricultural Statistics 2014 5
Livestock Record Highs and Lows: Colorado
Item
Record High Record Low Year Records Began
Number of Head
Year
Number of Head
Year
CATTLE 1/
1,000 1,000
All Cattle .................................................................... 3,756 1973 147 1867 1867
Beef cows ................................................................. 1,125 1974 406 1927 1920
Milk cows .................................................................. 300 1934 2 1867 1867
Annual Calf Crop ...................................................... 1,120 1973 482 1927 1924
All Cattle on Feed ..................................................... 1,230 2001 87 1935 1928
HOGS 2/
All Hogs...................................................................... 910 1999 2 1866 1866
Breeding Hogs ........................................................... 210 1999 20 1984 1963
Market Hogs .............................................................. 705 2005 143 1965 1963
Annual Pig Crop ........................................................ 2,957 2000 377 1988 1988
SHEEP AND LAMBS 1/
All Sheep and Lambs ................................................ 3,750 1930 360 2004 1920
Market sheep and lambs ........................................... 335 1998 165 2002 1994
Breeding sheep and lambs ........................................ 1,889 1942 170 2014 1920
Lamb Crop ................................................................ 1,375 1943 170 2010 1924
1/ As of January 1, 2014. 2/ As of December 1, 2013.

6 Colorado Agricultural Statistics 2014
Field Crops: Acreage, production and value, Colorado, 2012-2013
Year and Crop Acreage
planted
Acreage
harvested
Yield per acre
Total production
Unit
Value per unit
Total value 2012 Acres Acres Unit Units Dollars 1,000 Dollars
All wheat ............................ 2,363,000 2,182,000 34.3 74,848,000 Bu 7.75 579,784
Winter wheat .................. 2,350,000 2,170,000 34.0 73,780,000 Bu 7.75 571,795
Spring wheat .................. 13,000 12,000 89.0 1,068,000 Bu 7.48 7,989
Corn, all purposes .............. 1,420,000 … … … … … … …
Corn for grain ................. … 1,010,000 133.0 134,330,000 Bu 6.86 921,504
Corn for silage ................ … 160,000 20.0 3,200,000 Tons 3/ 3/
Sorghum, all purposes ........ 245,000 … … … … … …
Sorghum for grain ........... … 150,000 20.0 3,000,000 Bu 12.50 4/
20,328
Sorghum for silage ......... … 20,000 7.0 140,000 Tons 3/ 3/
Barley ................................. 58,000 55,000 123.0 6,765,000 Bu 6.72 45,461
Oats ................................... 55,000 6,000 70.0 420,000 Bu 4.22 1,772
Proso millet ........................ 210,000 120,000 14.0 1,680,000 Bu 16.40 27,552
Dry beans 1/ ....................... 50,000 45,000 18.4 828,000 Cwt 39.00 32,292
Sugarbeets ......................... 31,200 29,700 31.8 944,000 Tons 55.40 52,298
Sunflower ........................... 86,000 70,000 788 55,160,000 Lbs 31.10 4/ 15,515
Oil varieties ..................... 75,000 61,000 680 41,480,000 Lbs D/ D/
Non-oil varieties .............. 11,000 9,000 1,520 13,680,000 Lbs D/ D/
All hay ................................ … 1,460,000 2.58 3,761,000 Tons 237.00 873,887
Alfalfa hay ....................... … 750,000 3.50 2,625,000 Tons 239.00 627,375
All other hay ................... … 710,000 1.60 1,136,000 Tons 217.00 246,512
Summer potatoes ............... 5,400 5,300 450 2,385,000 Cwt 6.70 15,980
Fall potatoes ....................... 55,100 54,000 370 19,980,000 Cwt 6.30 145,854
Total Field Crops .............. … 5,367,000 … … … … 2,732,899
2013 Acres Acres Unit Units Dollars 1,000 Dollars
All wheat ............................ 2,310,000 1,649,000 27.3 45,018,000 Bu 6.97 314,255
Winter wheat .................. 2,300,000 1,640,000 27.0 44,280,000 Bu 6.99 309,517
Spring wheat .................. 10,000 9,000 82.0 738,000 Bu 6.42 4,738
Corn, all purposes .............. 1,220,000 … … … … … …
Corn for grain ................. … 990,000 131.0 129,690 Bu 4.65 603,059
Corn for silage ................ … 100,000 23.0 2,300,000 Tons 3/ 3/
Sorghum, all purposes ........ 400,000 … … … … … …
Sorghum for grain ........... … 240,000 24.0 5,760,000 Bu 7.50 4/ 24,192
Sorghum for silage ......... … 30,000 13.0 390,000 Tons 3/ 3/
Barley ................................. 63,000 58,000 133.0 7,714,000 Bu 5.73 44,201
Oats ................................... 55,000 12,000 65.0 780,000 Bu 4.91 3,830
Proso millet ........................ 370,000 330,000 25.0 8,250,000 Bu 9.25 76,313
Dry beans 1/ ....................... 39,000 36,000 15.0 540,000 Cwt 41.90 22,626
Sugarbeets ……………….. . 26,800 25,700 33.5 861,000 Tons 5/ 5/
Sunflower ........................... 67,000 55,000 858 47,200,000 Lbs 27.20 11,364
Oil varieties ..................... 50,000 39,000 800 31,200,000 Lbs D/ D/
Non-oil varieties .............. 17,000 16,000 1,000 16,000,000 Lbs D/ D/
All hay ................................ … 1,310,000 2.25 2,941 Tons 236.00 686,829
Alfalfa hay ....................... … 650,000 2.90 1,885 Tons 237.00 446,745
All other hay ................... … 660,000 1.60 1,056 Tons 228.00 240,684
Summer Potatoes 2/ ………….
Fall Potatoes…………………. ...........................................
54,800 54,600 371.0 20,279 Cwt 10.50 212,930
San Luis Valley……………. 49,700 49,600 365.0 18,104 Cwt … …
All other areas 5,100 5,000 435.0 2,175 Cwt … …
Total Field Crops .............. … 4,890,300 … … … … 1,999,599 6/
1/ Yield, production, price, and value on clean basis. 2/ Included in Fall Potatoes beginning in 2013. 3/ Discontinued in 2010. 4/ Dollars per hundredweight. 5/ Available February 2015. 6/Total excluding sugarbeets. D/ Withheld to avoid disclosure for individual operators.

Colorado Agricultural Statistics 2014 7
Field Crops: Acreage, production and value, Colorado, 2004-2013
Year Acreage Yield per acre
Production Value per unit Total value Planted Harvested Planted 1/ Harvested
All Wheat
1,000 Acres Bushels 1,000 Bushels Dollars Per Bu 1,000 Dollars
2004 ............... 2,315 1,714 20.3 27.4 46,880 3.25 152,399 2005 ............... 2,570 2,219 21.0 24.4 54,035 3.43 185,921 2006 ............... 2,170 1,919 19.1 21.6 41,515 4.54 189,027 2007 ............... 2,520 2,369 36.9 39.2 92,980 6.01 561,326 2008 ............... 2,190 1,936 27.3 30.8 59,700 6.62 397,140 2009 ............... 2,630 2,479 38.3 40.6 100,610 4.57 459,776 2010 ............... 2,478 2,377 43.7 45.5 108,234 5.54 600,600 2011 ............... 2,345 2,044 34.9 40.0 81,828 6.60 539,878 2012 ............... 2,363 2,182 31.7 34.3 74,848 7.75 579,784 2013 ............... 2,310 1,649 19.5 27.3 45,018 6.90 310,181
Winter Wheat
1,000 Acres Bushels 1,000 Bushels Dollars Per Bu 1,000 Dollars
2004 ............... 2,300 1,700 20.0 27.0 45,900 3.25 149,175 2005 ............... 2,550 2,200 20.5 24.0 52,800 3.43 181,104 2006 ............... 2,150 1,900 18.5 21.0 39,900 4.54 181,146 2007 ............... 2,500 2,350 36.5 39.0 91,650 5.99 548,984 2008 ............... 2,150 1,900 26.5 30.0 57,000 6.47 368,790 2009 ............... 2,600 2,450 37.5 40.0 98,000 4.58 448,840 2010 ............... 2,450 2,350 43.0 45.0 105,750 5.55 586,913 2011 ............... 2,300 2,000 34.0 39.0 78,000 6.63 517,140 2012 ............... 2,350 2,170 31.5 34.0 73,780 7.75 571,795 2013 ............... 2,300 1,640 19.0 27.0 44,280 6.90 305,532
Spring Wheat
1,000 Acres Bushels 1,000 Bushels Dollars Per Bu 1,000 Dollars
2004 ............... 15 14 65.5 70.0 980 3.29 3,224 2005 ............... 20 19 62.0 65.0 1,235 3.90 4,817 2006 ............... 20 19 81.0 85.0 1,615 4.88 7,881 2007 ............... 20 19 66.5 70.0 1,330 9.28 12,342 2008 ............... 40 36 67.5 75.0 2,700 10.50 28,350 2009 ............... 30 29 87.0 90.0 2,610 4.19 10,936 2010 ............... 28 27 89.0 92.0 2,484 5.51 13,687 2011 ............... 45 44 85.0 87.0 3,828 5.94 22,738 2012 ............... 13 12 82.0 89.0 1,068 7.48 7,989 2013 ............... 10 9 74.0 82.0 738 6.30 4,649
Barley
1,000 Acres Bushels 1,000 Bushels Dollars Per Bu 1,000 Dollars
2004 ............... 80 77 113.5 118.0 9,086 2.82 25,623 2005 ............... 60 59 128.0 130.0 7,670 2.98 22,857 2006 ............... 47 42 103.0 115.0 4,830 2.48 11,978 2007 ............... 60 58 116.0 120.0 6,960 3.51 24,430 2008 ............... 80 72 108.0 120.0 8,640 5.18 44,755 2009 ............... 78 77 133.0 135.0 10,395 5.27 54,782 2010 ............... 64 63 131.0 133.0 8,379 3.79 31,756 2011 ............... 66 63 120.0 126.0 7,938 5.23 41,516 2012 ............... 58 55 116.5 123.0 6,765 6.72 45,461
2013 ............... 63 58 122.5 133.0 7,714 5.85 45,127
1 1 1 A1dg’m[m
1/ All yields/planted acre except All Wheat are rounded to the nearest half bushel.

8 Colorado Agricultural Statistics 2014
Field Crops: Acreage, production and value, Colorado 2004-2013
Year Acreage Yield per acre
Production Value per
unit Total value
Planted Harvested Planted Harvested
Oats
1,000 Acres Bushels 1,000 Bushels
Dollars per Bu.
1,000 Dollars
2004……….. 75 20 14.7 55.0 1,100 2.02 2,222 2005……….. 75 15 15.0 75.0 1,125 2.33 2,621
2006……….. 85 10 8.2 70.0 700 2.70 1,890
2007……….. 75 10 7.3 55.0 550 3.25 1,788
2008……….. 45 7 10.9 70.0 490 3.30 1,617
2009……….. 60 9 9.8 65.0 585 2.36 1,381
2010……….. 55 9 10.6 65.0 585 3.50 2,048
2011……….. 45 10 15.6 70.0 700 4.59 3,213
2012……….. 55 6 7.6 70.0 420 4.22 1,772
2013……….. 55 12 14.2 65.0 780 4.20 3,276
Dry Beans 1/
1,000 Acres Hundredweight
1,000 Hundredweight
Dollars per Cwt.
1,000 Dollars
2004……….. 67 60 13.95 15.60 935 28.00 26,180 2005……….. 83 73 13.20 15.00 1,095 18.70 20,477 2006……….. 63 54 16.30 19.00 1,026 22.50 23,085 2007……….. 48 46 15.30 16.00 736 31.20 22,963 2008……….. 48 44 13.80 15.00 660 35.80 23,628 2009……….. 57 53 14.90 16.00 848 30.40 25,779 2010……….. 70 66 17.90 19.00 1,254 26.60 33,356 2011……….. 38 37 15.40 15.80 585 47.40 27,729 2012……….. 50 45 16.60 18.40 828 39.00 32,292 2013……….. 39 36 13.85 15.00 540 41.90 22,626
Corn for Grain 2/
1,000 Acres Bushels 1,000 Bushels
Dollars per Bu.
1,000 Dollars
2004……….. 1,200 1,040 135.0 140,400 2.23 313,092 2005……….. 1,100 950 148.0 140,600 2.23 313,538 2006……….. 1,000 860 156.0 134,160 3.02 405,163 2007……….. 1,200 1,060 140.0 148,400 3.96 587,664 2008……….. 1,250 1,010 137.0 138,370 4.14 572,852 2009……….. 1,100 990 153.0 151,470 3.68 557,410 2010……….. 1,330 1,210 151.0 182,710 4.98 909,896 2011……….. 1,500 1,300 133.0 172,900 6.15 1,063,335 2012……….. 1,420 1,010 133.0 134,330 6.86 921,504 2013……….. 1,220 990 131.0 129,690 4.65 603,059
Sorghum for Grain 2/
1,000 Acres Bushels 1,000 Bushels
Dollars per Bu.
1,000 Dollars
2004……….. 280 180 30.0 5,400 1.77 9,556 2005……….. 160 110 31.0 3,410 1.69 5,767 2006……….. 280 130 26.0 3,380 3.18 10,732 2007……….. 220 150 37.0 5,550 3.93 21,787 2008……….. 230 150 30.0 4,500 3.30 14,868 2009……….. 180 150 45.0 6,750 2.96 19,958 2010……….. 210 160 40.0 7,520 5.04 37,901 2011……….. 220 140 35.0 4,900 5.99 29,361 2012……….. 245 150 20.0 3,000 7.00 21,000 2013……….. 400 240 24.0 5,760 4.20 24,192
1/ Yield and production on clean basis. 2/ “Planted Acres” for corn and sorghum pertain to acreage planted for all purposes.

Colorado Agricultural Statistics 2014 9
Field Crops: Acreage, production and value, Colorado, 2004-2013
Corn for Silage
Year
Irrigated Non-Irrigated Total
Harvested Yld/Ac Production Harvested Yld/Ac Production Harvested Yld/Ac Production Value/Unit Total value
1,000 Acres
Tons
1,000 Tons
1,000 Acres
Tons
1,000 Tons
1,000 Acres
Tons
1,000 Tons
Dollars Per Ton
1,000 Dollars
2004 ..... 100 24.0 2,405 10 7.0 70 110 22.5 2,475 22.00 54,450 2005 ..... 100 24.5 2,450 10 8.0 80 110 23.0 2,530 21.00 53,130 2006 ..... 75 23.0 1,725 15 8.0 120 90 20.5 1,845 24.00 44,280 2007 ..... 100 24.0 2,400 10 7.5 75 110 22.5 2,475 32.00 79,200
2008 ..... 105 23.5 2,460 15 8.0 120 120 21.5 2,580 36.00 92,880
2009 ..... 1/ 1/ 1/ 1/ 1/ 1/ 85 23.5 1,998 28.00 55,944
2010 ..... 1/ 1/ 1/ 1/ 1/ 1/ 100 24.5 2,450 2/ 2/
2011 ..... 1/ 1/ 1/ 1/ 1/ 1/ 105 23.0 2,415 2/ 2/
2012 ..... 1/ 1/ 1/ 1/ 1/ 1/ 160 20.0 3,200 2/ 2/
2013 ..... 1/ 1/ 1/ 1/ 1/ 1/ 100 23.0 2,300 2/ 2/
Sorghum for Silage
Area Harvested Yield Per Harvested Acre Production Value per unit Total value
1,000 Acres Tons 1,000 Tons Dollars Per Ton 1,000 Dollars
2004 ..... 19 14.0 266 19.50 5,187 2005 ..... 22 13.0 286 16.00 4,576 2006 ..... 17 18.0 306 20.00 6,120 2007 ..... 15 13.0 195 20.00 3,900 2008 ..... 12 13.0 156 20.00 3,120 2009 ..... 7 14.0 98 24.50 2,401
2010 ..... 20 13.0 260 2/ 2/ 2011 ..... 14 13.0 182 2/ 2/ 2012 ..... 20 7.0 140 2/ 2/ 2013 ..... 30 13.0 390 2/ 2/
Sunflower, Oil
Planted Harvested Yield
Planted Yield
Harvested Production Value/Unit Total Value
1,000 Acres Pounds 1,000 Pounds Dollars Per Cwt 1,000 Dollars
2004 ............... 90 80 1,200 1,350 108,000 11.00 11,880 2005 ............... 150 145 1,210 1,250 181,250 10.20 18,488 2006 ............... 80 75 1,030 1,100 82,500 12.50 10,313 2007 ............... 105 100 1,050 1,100 110,000 18.10 19,910 2008 ............... 170 143 760 900 128,700 21.90 28,185 2009 ..... 70 68 1,280 1,320 89,760 N/A N/A 2010 ..... 95 92 1,310 1,350 124,200 N/A N/A 2011 ............... 110 97 880 1,000 97,000 N/A N/A 2012 ..... 75 61 550 680 41,480 N/A N/A 2013 ..... 50 39 620 800 31,200 N/A N/A
Sunflower, Non-Oil 1,000 Acres Pounds 1,000 Pounds Dollars Per Cwt 1,000 Dollars 2004 ............... 45 43 860 900 38,700 16.30 6,308 2005 ............... 65 60 1,250 1,350 81,000 18.40 14,904 2006 ............... 20 18 1,310 1,450 26,100 16.50 4,307 2007 ............... 14 13 1,390 1,500 19,500 20.20 3,939 2008 ............... 24 19 1,030 1,300 24,700 30.00 7,410 2009 ..... 21 19 1,540 1,700 32,300 N/A N/A 2010 ..... 37 35 1,180 1,250 43,750 N/A N/A 2011 ............... 18 16 1,510 1,700 27,200 N/A N/A 2012 ..... 11 9 1,240 1,520 13,680 N/A N/A 2013 ..... 17 16 940 1,000 16,000 N/A N/A
1/ Irrigated and non-irrigated not estimated separately after 2008. 2/ Prices no longer published. N/A Not available.
10 Colorado Agricultural Statistics 2014
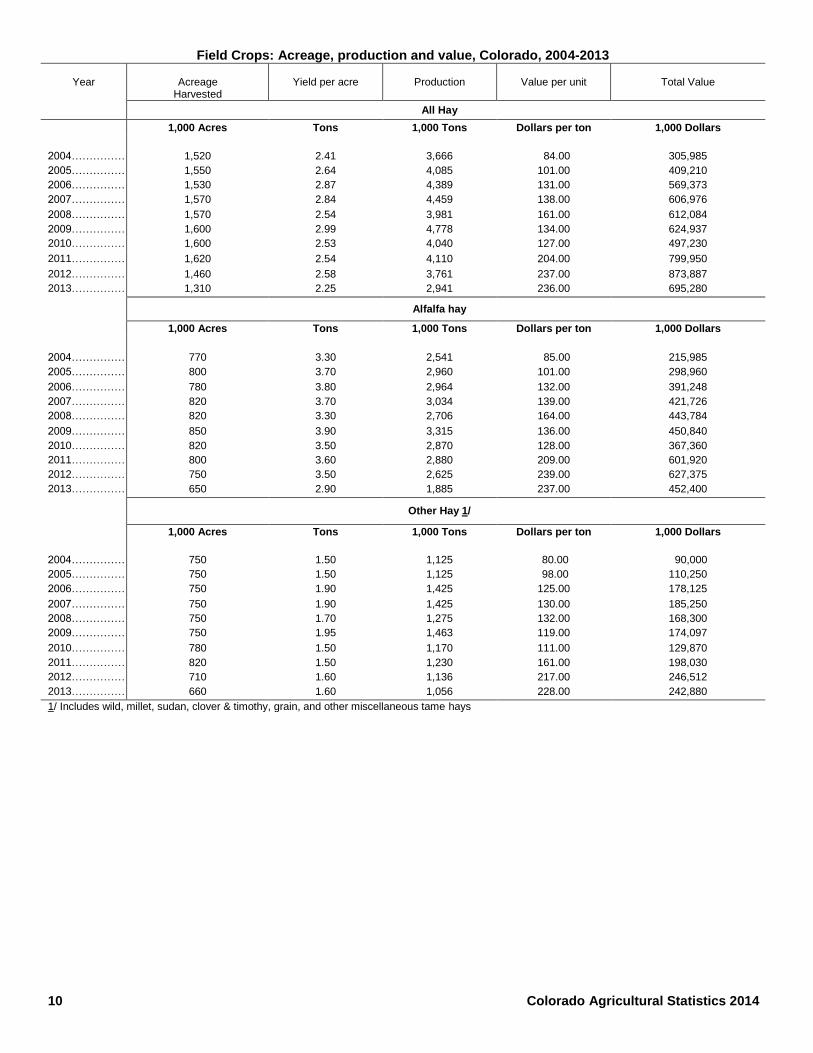
Field Crops: Acreage, production and value, Colorado, 2004-2013
Year
Acreage Harvested
Yield per acre
Production
Value per unit
Total Value
All Hay
1,000 Acres Tons 1,000 Tons Dollars per ton 1,000 Dollars
2004…………… 1,520 2.41 3,666 84.00 305,985
2005…………… 1,550 2.64 4,085 101.00 409,210
2006…………… 1,530 2.87 4,389 131.00 569,373
2007…………… 1,570 2.84 4,459 138.00 606,976
2008…………… 1,570 2.54 3,981 161.00 612,084
2009…………… 1,600 2.99 4,778 134.00 624,937
2010…………… 1,600 2.53 4,040 127.00 497,230
2011…………… 1,620 2.54 4,110 204.00 799,950
2012…………… 1,460 2.58 3,761 237.00 873,887
2013…………… 1,310 2.25 2,941 236.00 695,280
Alfalfa hay
1,000 Acres Tons 1,000 Tons Dollars per ton 1,000 Dollars
2004…………… 770 3.30 2,541 85.00 215,985
2005…………… 800 3.70 2,960 101.00 298,960
2006…………… 780 3.80 2,964 132.00 391,248
2007…………… 820 3.70 3,034 139.00 421,726
2008…………… 820 3.30 2,706 164.00 443,784
2009…………… 850 3.90 3,315 136.00 450,840
2010…………… 820 3.50 2,870 128.00 367,360
2011…………… 800 3.60 2,880 209.00 601,920
2012…………… 750 3.50 2,625 239.00 627,375
2013…………… 650 2.90 1,885 237.00 452,400
Other Hay 1/
1,000 Acres Tons 1,000 Tons Dollars per ton 1,000 Dollars
2004…………… 750 1.50 1,125 80.00 90,000
2005…………… 750 1.50 1,125 98.00 110,250
2006…………… 750 1.90 1,425 125.00 178,125
2007…………… 750 1.90 1,425 130.00 185,250
2008…………… 750 1.70 1,275 132.00 168,300
2009…………… 750 1.95 1,463 119.00 174,097
2010…………… 780 1.50 1,170 111.00 129,870
2011…………… 820 1.50 1,230 161.00 198,030
2012…………… 710 1.60 1,136 217.00 246,512
2013…………… 660 1.60 1,056 228.00 242,880
1/ Includes wild, millet, sudan, clover & timothy, grain, and other miscellaneous tame hays
Colorado Agricultural Statistics 2014 11
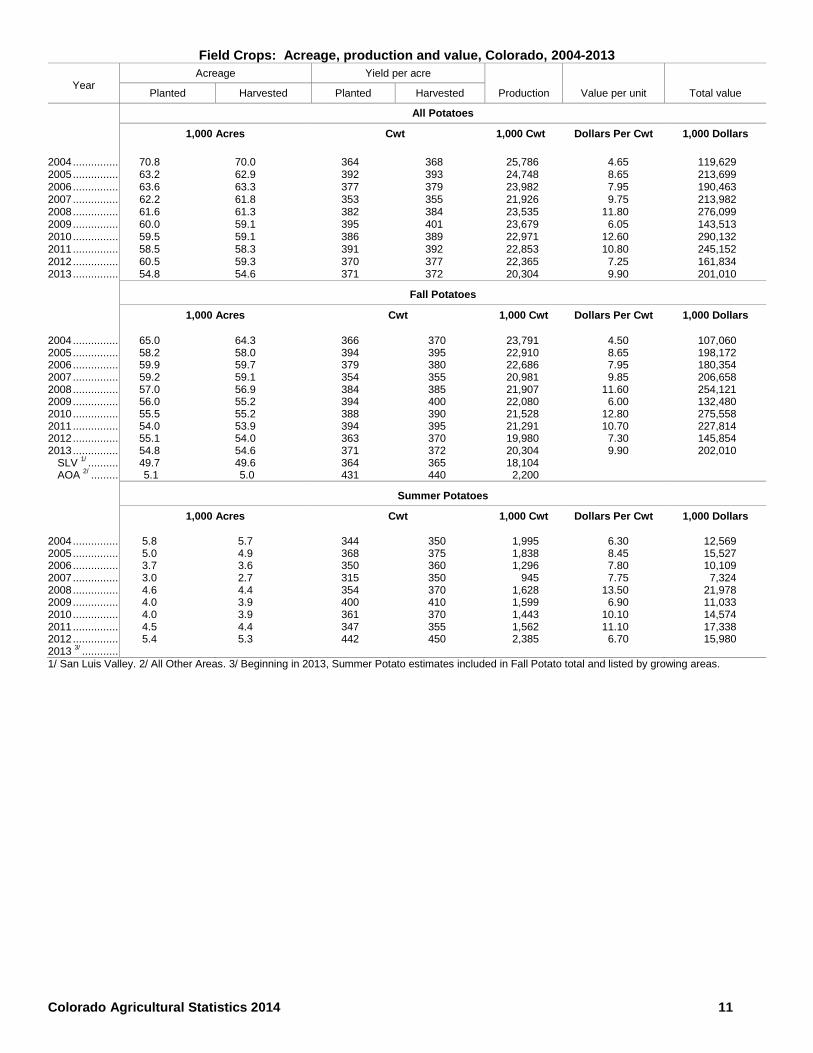
Field Crops: Acreage, production and value, Colorado, 2004-2013
Year
Acreage Yield per acre
Planted Harvested Planted Harvested Production Value per unit Total value
All Potatoes
1,000 Acres Cwt 1,000 Cwt Dollars Per Cwt 1,000 Dollars
2004 ............... 70.8 70.0 364 368 25,786 4.65 119,629 2005 ............... 63.2 62.9 392 393 24,748 8.65 213,699 2006 ............... 63.6 63.3 377 379 23,982 7.95 190,463 2007 ............... 62.2 61.8 353 355 21,926 9.75 213,982 2008 ............... 61.6 61.3 382 384 23,535 11.80 276,099 2009 ............... 60.0 59.1 395 401 23,679 6.05 143,513 2010 ............... 59.5 59.1 386 389 22,971 12.60 290,132 2011 ............... 58.5 58.3 391 392 22,853 10.80 245,152 2012 ............... 60.5 59.3 370 377 22,365 7.25 161,834 2013 ............... 54.8 54.6 371 372 20,304 9.90 201,010
Fall Potatoes
1,000 Acres Cwt 1,000 Cwt Dollars Per Cwt 1,000 Dollars
2004 ............... 65.0 64.3 366 370 23,791 4.50 107,060 2005 ............... 58.2 58.0 394 395 22,910 8.65 198,172 2006 ............... 59.9 59.7 379 380 22,686 7.95 180,354 2007 ............... 59.2 59.1 354 355 20,981 9.85 206,658 2008 ............... 57.0 56.9 384 385 21,907 11.60 254,121 2009 ............... 56.0 55.2 394 400 22,080 6.00 132,480 2010 ............... 55.5 55.2 388 390 21,528 12.80 275,558 2011 ............... 54.0 53.9 394 395 21,291 10.70 227,814 2012 ............... 55.1 54.0 363 370 19,980 7.30 145,854 2013 ............... 54.8 54.6 371 372 20,304 9.90 202,010
SLV 1/ .......... 49.7 49.6 364 365 18,104
AOA 2/ ......... 5.1 5.0 431 440 2,200
Summer Potatoes
1,000 Acres Cwt 1,000 Cwt Dollars Per Cwt 1,000 Dollars 2004 ............... 5.8 5.7 344 350 1,995 6.30 12,569 2005 ............... 5.0 4.9 368 375 1,838 8.45 15,527 2006 ............... 3.7 3.6 350 360 1,296 7.80 10,109 2007 ............... 3.0 2.7 315 350 945 7.75 7,324 2008 ............... 4.6 4.4 354 370 1,628 13.50 21,978 2009 ............... 4.0 3.9 400 410 1,599 6.90 11,033 2010 ............... 4.0 3.9 361 370 1,443 10.10 14,574 2011 ............... 4.5 4.4 347 355 1,562 11.10 17,338 2012 ............... 5.4 5.3 442 450 2,385 6.70 15,980 2013
3/ ............
1/ San Luis Valley. 2/ All Other Areas. 3/ Beginning in 2013, Summer Potato estimates included in Fall Potato total and listed by growing areas.

12 Colorado Agricultural Statistics 2014
Field Crops: Acreage, production and value, Colorado, 2004-2013 1/
Year
Acreage Yield per acre
Planted Harvested Planted Harvested Production Value per unit Total value
Proso Millet
1,000 Acres Bushels 1,000 Bushels Dollars Per Bu 1,000 Dollars
2004 ............... 370 330 21.5 24.0 7,920 2.70 21,384 2005 ............... 290 275 19.0 20.0 5,500 3.10 17,050 2006 ............... 290 255 18.5 21.0 5,355 4.00 21,420 2007 ............... 270 260 32.0 33.0 8,580 4.50 38,610 2008 ............... 270 230 28.0 33.0 7,590 3.25 24,668 2009 ............... 170 150 31.0 35.0 5,250 2.90 15,225 2010 ............... 220 215 32.5 33.0 7,095 4.60 32,637 2011…………. 250 230 25.0 27.0 6,210 5.90 36,639 2012…………. 210 120 8.0 14.0 1,680 16.40 27,552 2013…………. 370 330 22.5 25.0 8,250 9.25 76,313
Sugarbeets
1,000 Acres
Tons
1,000 Tons
Dollars Per Ton
1,000 Dollars
2004 ............... 36.0 33.5 23.3 25.0 838 36.30 30,419 2005 ............... 36.4 34.3 22.9 24.3 833 40.70 33,903 2006 ............... 42.1 38.0 21.1 23.4 889 42.20 37,516 2007 ............... 32.0 29.2 23.9 26.2 765 36.00 27,540 2008 ............... 33.8 28.6 22.4 26.5 758 47.80 36,232 2009 ............... 35.1 35.0 27.4 27.5 963 53.30 51,328 2010 ............... 28.9 27.9 28.5 29.5 823 68.90 56,705 2011…………. 29.4 28.7 28.2 28.9 829 68.40 56,704 2012…………. 31.2 29.7 30.3 31.8 944 55.40 52,298 2013…………. 26.8 25.7 32.1 33.5 861 1/ 1/
1/ Not available at time of publication
Colorado Agricultural Statistics 2014 13
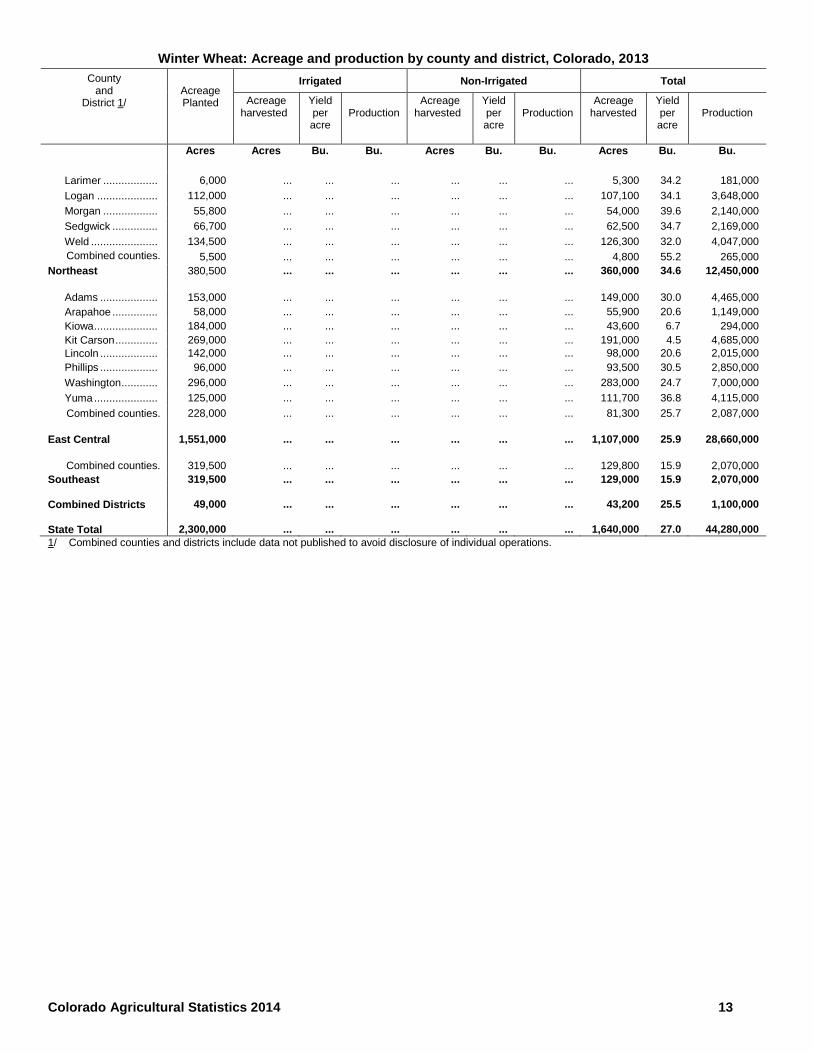
Winter Wheat: Acreage and production by county and district, Colorado, 2013
County and
District 1/
Acreage Planted
Irrigated
Non-Irrigated
Total
Acreage
harvested
Yield per acre
Production
Acreage
harvested
Yield per acre
Production
Acreage
harvested
Yield per acre
Production
Acres
Acres
Bu.
Bu.
Acres
Bu.
Bu.
Acres
Bu.
Bu.
Larimer .................. 6,000 ... ... ... ... ... ... 5,300 34.2 181,000
Logan .................... 112,000 ... ... ... ... ... ... 107,100 34.1 3,648,000
Morgan .................. 55,800 ... ... ... ... ... ... 54,000 39.6 2,140,000
Sedgwick ............... 66,700 ... ... ... ... ... ... 62,500 34.7 2,169,000
Weld ...................... 134,500 ... ... ... ... ... ... 126,300 32.0 4,047,000 Combined counties.
5,500 ... ... ... ... ... ... 4,800 55.2 265,000
Northeast 380,500 ... ... ... ... ... ... 360,000 34.6 12,450,000
Adams ................... 153,000 ... ... ... ... ... ... 149,000 30.0 4,465,000 Arapahoe ............... 58,000 ... ... ... ... ... ... 55,900 20.6 1,149,000 Kiowa ..................... 184,000 ... ... ... ... ... ... 43,600 6.7 294,000 Kit Carson .............. 269,000 ... ... ... ... ... ... 191,000 4.5 4,685,000 Lincoln ................... 142,000 ... ... ... ... ... ... 98,000 20.6 2,015,000 Phillips ................... 96,000 ... ... ... ... ... ... 93,500 30.5 2,850,000
Washington ............ 296,000 ... ... ... ... ... ... 283,000 24.7 7,000,000
Yuma ..................... 125,000 ... ... ... ... ... ... 111,700 36.8 4,115,000
Combined counties. 228,000 ... ... ... ... ... ... 81,300 25.7 2,087,000
East Central
1,551,000 ... ... ... ... ... ... 1,107,000 25.9 28,660,000
Combined counties. 319,500 ... ... ... ... ... ... 129,800 15.9 2,070,000
Southeast 319,500 ... ... ... ... ... ... 129,000 15.9 2,070,000
Combined Districts 49,000 ... ... ... ... ... ... 43,200 25.5 1,100,000
State Total 2,300,000 ... ... ... ... ... ... 1,640,000 27.0 44,280,000
1/ Combined counties and districts include data not published to avoid disclosure of individual operations.

14 Colorado Agricultural Statistics 2014
Barley: Acreage & Production by county & district, Colorado, 2012-2013 County
& District 1/
2012 2013
Planted Harvested Yield Production Planted Harvested Yield Production
Acres Acres Bu/Acre Bu Acres Acres Bu/Acre Bu
Alamosa……………. 7,800 7,500 134.1 1,006,000 10,100 9,900 135.9 1,345,000 Conejos..................... 5,500 5,300 132.5 702,000 5,300 4,900 143.5 703,000 Costilla...................... 4,000 4,000 121.0 484,000 5,600 5,500 139.8 769,000 Rio Grande................ 14,300 13,900 139.1 1,934,000 15,500 14,300 155.2 2,220,000 Saguache………….. 12,500 12,400 146.4 1,815,000 12,800 12,000 145.0 1,740,000 San Luis Valley 44,100 43,100 137.8 5,941,000 49,300 46,600 145.4 6,777,000 Other districts 3,700 2,100 40.0 84,000 13,700 11,400 82.2 937,000 State Total 58,000 55,000 123.0 6,765,000 63,000 58,000 133.0 7,714,000
1/ Combined counties and districts include data not published to avoid disclosure of individual operations.
Sorghum for Grain: Acreage & Production by county & district, Colorado, 2012-2013 County
& District 1/
2012 2013
Planted 2/
Harvested Yield Production Planted 2/ Harvested Yield Production
Acres Acres Bu/Acre Bu Acres Acres Bu/Acre Bu
Kit Carson.................. 10,300 4,100 32.0 131,000 19,300 17,500 28.6 500,000 Kiowa......................... … … … … 106,500 56,000 27.7 1,550,000 Lincoln....................... … … … … 13,900 6,000 11.0 66,000 Washington............... 4,500 2,500 35.9 89,800 10,500 8,100 19.5 158,000 Yuma......................... ... ... ... ... 10,900 7,900 25.9 205,000 Combined counties.. 105,200 61,100 18.3 1,119,200 74,400 52,000 25.4 1,319,000 East Central 120,000 67,700 19.8 1,340,000 235,500 147,500 25.7 3,798,000 Prowers..................... 28,600 17,600 24.4 430,000 … … … … Combined counties.. 88,400 61,800 18.6 1,152,000 … … … … Southeast 117,000 79,400 19.9 1,582,000 … … … … Other districts 8,000 2,900 26.9 78,000 164,500 92,500 21.2 1,962,000 State Total 245,000 150,000 20.0 3,000,000 400,000 240,000 24.0 5,760,000
1/ Combined counties and districts include data not published to avoid disclosure of individual operations. 2/ Planted for all purposes.

Colorado Agricultural Statistics 2014 15
Dry Beans: Acreage & Production by county and district, Colorado, 2012-2013 County
& District 1/
2012 2013
Planted 2/ Harvested Yield Production Planted 2/ Harvested Yield Production
Acres Acres Lbs/ Acre Cwt Acres Acres Lbs/ Acre Cwt
Phillips ..................... 2,200 2,000 2,680 53,500 … … … … Yuma ....................... 11,600 10,700 2,340 250,000 8,400 8,100 2,400 194,000 Combined counties .. 2,600 2,300 2,150 49,500 2,400 2,400 1,540 37,000 East Central 16,400 15,000 2,350 353,000 10,800 10,500 2,200 231,000 Dolores ................... 7,000 4,900 500 24,700 … … … … Montezuma ............. 8,500 8,300 960 80,000 7,700 7,400 340 25,000 Montrose ................. ... ... .. ... Combined counties . 6,200 6,000 2,460 147,300 12,100 11,100 1,370 152,000 Southwest 21,700 19,200 1,310 252,000 19,800 18,500 960 177,000
Combined counties . … … … … … … … … Southeast … … … … … … … … Other districts 11,900 10,800 2,060 223,000 8,400 7,000 1,890 132,000
State 50,000 45,000 1,840 828,000 39,000 36,000 1,500 540,000
1/ Combined counties and districts include data not published to avoid disclosure of individual operations. 2/ Planted for all purposes.
Corn: Acreage & Production by county & district, Colorado, 2013 County
& District 1/
Acreage Planted 2/
Irrigated Non-Irrigated Total
Harvested Yield Production Harvested Yield Production Harvested Yield Production
Acres Acres Bu/
Acre Bu Acres
Bu/ Acre
Bu Acres Bu/
Acre Bu
Larimer .................... 11,900 … ... ... ... ... ... 4,200 132.0 555
Logan ....................... 89,000 … ... ... ... ... ... 80,500 129.8 10,450
Morgan .................... 63,200 … ... ... ... ... ... 48,600 167.8 8,157
Sedgwick ................. 57,800 … ... ... ... ... ... 54,000 117.8 6,361
Weld ........................ 107,500 … ... ... ... ... ... 65,700 162.2 10,659
Combined counties ... 4,600 … ... ... ... ... ... 2,500 112.0 280
Northeast 334,000 … ... ... ... ... ... 255,500 142.7 36,461
Adams ..................... 25,800 … … … … … … 24,400 61.8 1,509
Cheyenne ................ 58,200 14,400 193.2 2,782 15,000 14.1 211 29,400 101.8 2,993
Kiowa ....................... 21,900 … … … … … … 13,500 59.6 804
Kit Carson ................ 196,400 78,900 162.8 12,847 83,500 32.1 2,682 162,400 95.6 15,529
Lincoln ..................... 34,600 … … … … … … 27,300 32.6 891
Phillips ..................... 116,000 60,200 194.0 11,680 49,600 35.1 1,740 109,800 122.2 13,420
Yuma ....................... 242,000 … … … … … … 225,500 185.8 41,903
Combined counties ... 94,100 241,500 193.8 46,811 131,900 31.2 4,111 82,700 70.3 5,815
East Central 789,000 395,000 187.6 74,120 280,000 31.2 8,744 675,000 122.8 82,864
Combined counties ... 72,400 ... ... ... ... ... ... 41,500 177.9 7,383
Southeast 72,400 ... ... ... ... ... ... 41,500 177.9 7,383
Other districts 24,600 255,000 176.6 45,030 60,000 29.2 1,796 18,000 165.7 2,982
State 1,220,000 650,000 183.3 119,150 340,000 31.0 10,540 990,000 131.0 129,690
1/ Combined counties and districts include data not published to avoid disclosure of individual operations. 2/ Planted for all purposes.

16 Colorado Agricultural Statistics 2014
Dry Beans: Acreage, yield and production by class, Colorado, 2004-2013
Acreage planted Acreage harvested Yield per acre Production
Year Acres Acres Pounds 1/ Hundredweight 1/
Light Red Kidney
2004……………………..
5,000 4,000 1,750 70,000
2005……………………..
7,000 6,000 1,700 102,000
2006……………………..
5,000 4,600 1,800 83,000
2007……………………..
6,000 5,800 2,190 127,000
2008…………………….. 8,000 7,000 1,660 116,000
2009…………………….. 9,000 8,000 2,000 160,000
2010…………………….. 6,000 5,000 2,060 103,000
2011…………………….. 4,000 3,700 2,000 74,000
2012…………………….. 3,600 3,600 2,250 81,000
2013…………………….. 3,000 3,000 1,880 56,000
Pinto
2004……………………..
58,000 53,000 1,530 811,000
2005…………………….. 70,000 62,000 1,500 928,000
2006…………………….. 53,000 45,000 1,900 855,000
2007……………………..
37,000 36,000 1,560 562,000
2008…………………….. 36,000 34,000 1,460 496,000
2009…………………….. 43,000 41,000 1,530 628,000
2010…………………….. 57,000 55,000 1,880 1,034,000
2011…………………….. 29,000 28,300 1,520 430,000
2012…………………….. 43,000 38,000 1,790 680,000
2013…………………….. 31,000 28,000 1,370 384,000
Other
2004……………………..
4,000 3,000 1,800 54,000
2005……………………..
6,000 5,000 1,300 65,000
2006……………………..
5,000 4,400 2,000 88,000
2007……………………..
5,000 4,200 1,120 47,000
2008…………………….. 4,000 3,000 1,600 48,000
2009…………………….. 5,000 4,000 1,500 60,000
2010…………………….. 7,000 6,000 1,950 117,000
2011…………………….. 5,000 5,000 1,620 81,000
2012…………………….. 3,400 3,400 1,970 67,000
2013…………………….. 5,000 5,000 2,000 100,000
Total
2004……………………..
67,000 60,000 1,560 935,000
2005…………………….. 83,000 73,000 1,500 1,095,000
2006…………………….. 63,000 54,000 1,900 1,026,000
2007……………………..
48,000 46,000 1,600 736,000
2008…………………….. 48,000 44,000 1,500 660,000
2009…………………….. 57,000 53,000 1,600 848,000
2010…………………….. 70,000 66,000 1,900 1,254,000
2011…………………….. 38,000 37,000 1,580 585,000
2012…………………….. 50,000 45,000 1,840 828,000
2013…………………….. 39,000 36,000 1,500 540,000
1/ Clean basis.
Colorado Agricultural Statistics 2014 17
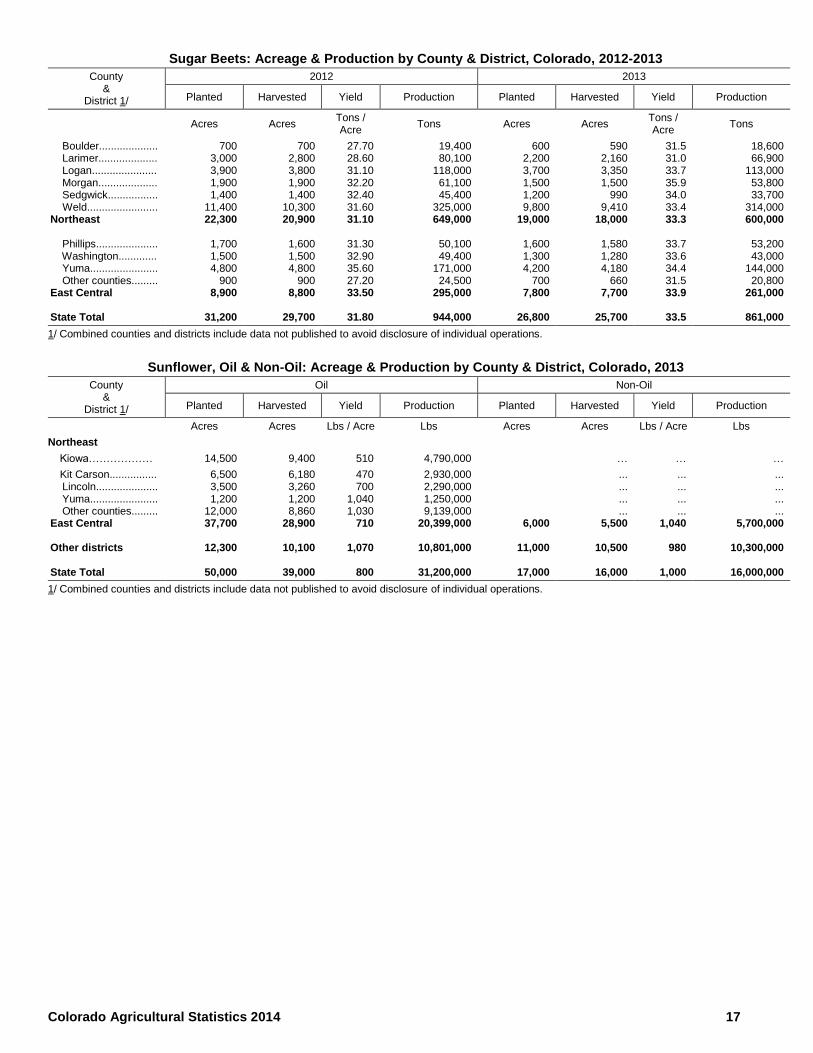
Sugar Beets: Acreage & Production by County & District, Colorado, 2012-2013
County &
District 1/
2012 2013
Planted Harvested Yield Production Planted Harvested Yield Production
Acres Acres Tons / Acre
Tons Acres Acres Tons / Acre
Tons
Boulder.................... Larimer.................... Logan...................... Morgan.................... Sedgwick................. Weld........................ Northeast Phillips..................... Washington............. Yuma....................... Other counties......... East Central State Total
700 3,000 3,900 1,900 1,400
11,400 22,300
1,700 1,500 4,800
900 8,900
31,200
700 2,800 3,800 1,900 1,400
10,300 20,900
1,600 1,500 4,800
900 8,800
29,700
27.70 28.60 31.10 32.20 32.40 31.60 31.10
31.30 32.90 35.60 27.20 33.50
31.80
19,400 80,100
118,000 61,100 45,400
325,000 649,000
50,100 49,400
171,000 24,500
295,000
944,000
600 2,200 3,700 1,500 1,200 9,800
19,000
1,600 1,300 4,200
700 7,800
26,800
590 2,160 3,350 1,500
990 9,410
18,000
1,580 1,280 4,180
660 7,700
25,700
31.5 31.0 33.7 35.9 34.0 33.4 33.3
33.7 33.6 34.4 31.5 33.9
33.5
18,600 66,900
113,000 53,800 33,700
314,000 600,000
53,200 43,000
144,000 20,800
261,000
861,000
1/ Combined counties and districts include data not published to avoid disclosure of individual operations.
Sunflower, Oil & Non-Oil: Acreage & Production by County & District, Colorado, 2013
County &
District 1/
Oil Non-Oil
Planted Harvested Yield Production Planted Harvested Yield Production
Acres Acres Lbs / Acre Lbs Acres Acres Lbs / Acre Lbs
Northeast
Kiowa……………… 14,500 9,400 510 4,790,000 … … …
Kit Carson................ Lincoln..................... Yuma....................... Other counties......... East Central Other districts State Total
6,500 3,500 1,200
12,000 37,700
12,300
50,000
6,180 3,260 1,200 8,860
28,900
10,100
39,000
470 700
1,040 1,030
710
1,070
800
2,930,000 2,290,000 1,250,000 9,139,000
20,399,000
10,801,000
31,200,000
6,000
11,000
17,000
...
...
...
... 5,500
10,500
16,000
...
...
...
... 1,040
980
1,000
...
...
...
... 5,700,000
10,300,000
16,000,000
1/ Combined counties and districts include data not published to avoid disclosure of individual operations.

18 Colorado Agricultural Statistics 2014
Alfalfa and Other Hay: Acreage and production by county and district, Colorado, 2013
Alfalfa Hay Total Other Hay Total
County
and District 1/
Acreage Harvested
Yield per acre
Production
Acreage Harvested
Yield per acre
Production
Acres
Tons
Tons
Acres
Tons
Tons
Chaffee.......................
.. 3,300 2.20 7,200 5,700 1.85 10,500
Eagle..........................
..
5,500 1.50 8,300 5,500 1.75 9,500
Grand...........................
...
...
... 22,600 1.20 27,600
Gunnison....................
. … … … 24,700 1.40 34,400
Jackson......................
.
...
...
... 57,000 1.55 87,500
Moffat..........................
25,000 1.10 27,500 11,900 1.25 14,600
Park............................ … … … 6,900 0.55 3,700
Pitkin........................... 2,300 1.75 4,000 1,500 0.75 1,100
Rio Blanco.................. 5,500 1.45 8,100 20,200 1.50 30,100
Routt........................... 11,000 1.15 12,500 32,800 1.70 55,500
Summit....................... ... ... ... 4,300 0.95 4,100
Teller..........................
...
...
... 1,000 0.70 700
Combined counties... 3,400 1.60 5,400 900 0.80 700
NW & Mountain 56,000 1.30 73,000 195,000 1.45 280,000
Boulder..................... … … … 13,700 1.75 24,300
Jefferson................... 1,300 0.85 1,100 2,000 0.70 1,400
Larimer..................... 13,000 2.55 33,000 13,100 1.20 15,700
Logan........................ 19,000 5.00 95,000 6,100 1.50 9,100
Morgan...................... 18,000 5.10 92,000 9,500 1.90 18,000
Weld.......................... 58,000 3.80 221,000
61,000 2.45 150,800
Combined counties... 23,700 4.75 112,900 1,600 1.70 2,700 Northeast 133,000 4.15 555,000 107,000 2.05 222,000
Adams....................... 6,000 2.80 16,700 … … …
Arapahoe................... 1,400 2.20 3,100 2,500 0.40 1,000
Cheyenne..................
...
...
... 11,800 1.65 19,400
Douglas……………... 3,100 0.30 900 … … …
El Paso...................... … … … 7,900 0.85 6,700
Elbert......................... 14,000 0.90 12,400 19,800 1.10 21,600
Kit Carson.................. 4,400 4.50 19,900 21,000 2.35 49,000
Lincoln....................... … … … 21,500 1.50 31,800
Phillips....................... 500 3.60 1,800 1,600 2.15 3,400
Washington.......................
5,300 4.10 21,800 … … …
Combined counties... 21,300 3.75 80,400 70,900 1.65 116,100 East Central 56,000 2.80 157,000 157,000 1.60 249,000
Archuleta................... 2,500 1.80 4,500 2,700 1.55 4,200
Delta......................... 23,000 2.45 56,900 10,600 1.45 15,500
Dolores..................... 5,000 1.35 6,800 … … …
Garfield..................... 26,100 2.20 57,000 13,700 1.85 25,500
La Plata.................... 7,600 1.65 12,700 15,500 1.70 26,300
Mesa......................... 29,200 2.90 85,400 … … …
Montezuma............... 32,100 1.80 58,000 7,900 1.70 13,400
Montrose................... 26,500 2.65 70,000 15,300 2.05 31,000
Ouray........................
...
...
... 7,000 1.35 9,300
San Miguel................ … … … 2,800 0.70 2,000
Combined counties... 3,000 2.25 6,700 14,500 1.65 23,800 Southwest 155,000 2.30 358,000 90,000 1.70 151,000
Alamosa.................... 23,000 3.70 85,000
7,600 0.90 7,000
Conejos..................... 46,000 3.20 148,000 22,000 1.10 23,900
Costilla...................... 25,000 3.45 86,000 … … …
Rio Grande...............
26,000 4.25 111,000 12,000 2.55 30,300
Saguache.................. 17,000 3.95 67,000 22,900 1.05 23,800
Combined counties...
...
...
... 4,500 2.45 11,000 San Luis Valley 137,000 3.65 497,000 69,000 1.40 96,000

Colorado Agricultural Statistics 2014 19
Alfalfa and Other Hay: Acreage and production by county and district, Colorado, 2013, continued
Alfalfa Hay Total Other Hay Total
County and District 1/
Acreage
Harvested
Yield per acre
Production
Acreage
Harvested
Yield per acre
Production
Acres
Tons
Tons
Acres
Tons
Tons
Baca......................... … … … 7,900 1.55 12,400
Bent.......................... 21,000 1.70 35,500 1,500 1.85 2,800
Crowley .................... 3,200 1.70 5,400 900 1.00 900 Custer ...................... 1,500 0.55 800 9,000 0.85 7,500 Huerfano .................. 2,900 0.90 2,600 1,600 0.55 900 Las Animas .............. 9,100 1.35 12,100 3,300 0.85 2,800 Otero ........................ 22,500 3.05 68,500 1,000 2.50 2,500 Prowers .................... 42,000 2.30 97,000 … … … Pueblo ...................... … … … 3,800 1.60 6,100 Combined counties ... 10,800 2.15 23,100 13,000 1.70 22,100
Southeast
113,000 2.15 245,000 42,000 1.40 58,000 State Total 650,000 2.90 1,885,000 660,000 1.60 1,056,000
1/ Other counties and districts include data not published to avoid disclosure of individual operations.
20 Colorado Agricultural Statistics 2014
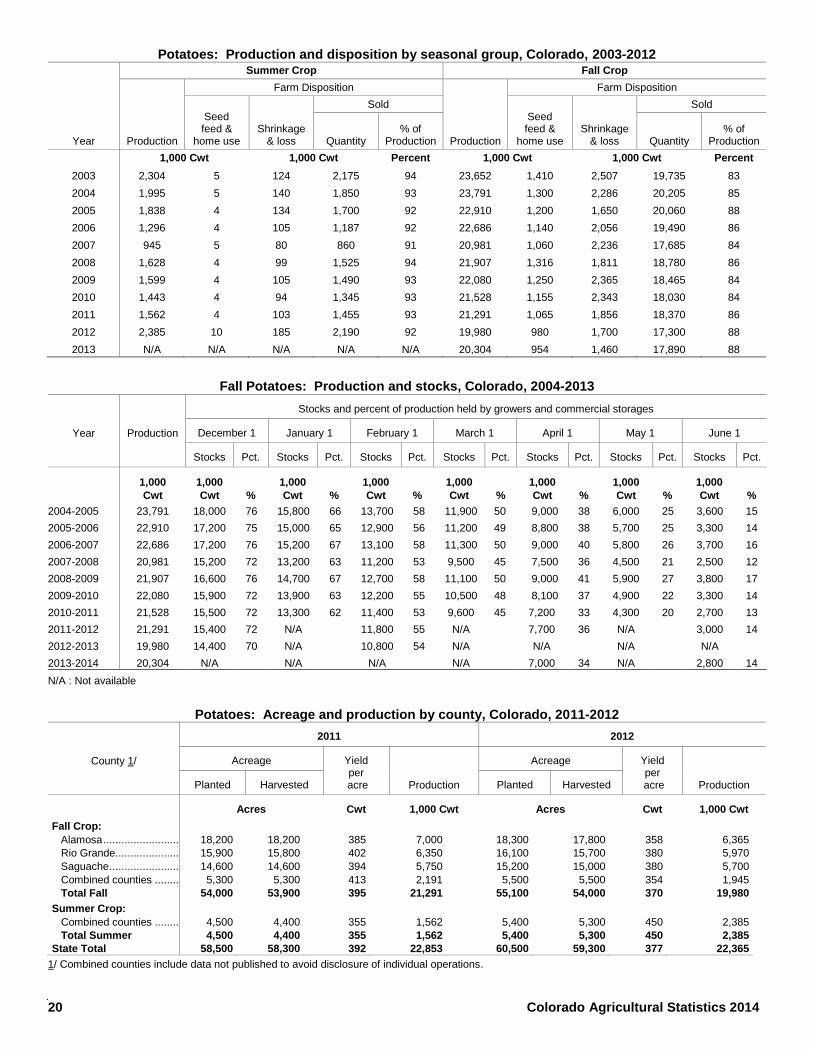
Potatoes: Production and disposition by seasonal group, Colorado, 2003-2012
Year
Summer Crop Fall Crop
Production
Farm Disposition
Production
Farm Disposition
Seed feed &
home use
Shrinkage & loss
Sold Seed feed &
home use
Shrinkage & loss
Sold
Quantity
% of Production
Quantity
% of Production
1,000 Cwt 1,000 Cwt Percent 1,000 Cwt 1,000 Cwt Percent
2003 2,304 5 124 2,175 94 23,652 1,410 2,507 19,735 83
2004 1,995 5 140 1,850 93 23,791 1,300 2,286 20,205 85
2005 1,838 4 134 1,700 92 22,910 1,200 1,650 20,060 88
2006 1,296 4 105 1,187 92 22,686 1,140 2,056 19,490 86
2007 945 5 80 860 91 20,981 1,060 2,236 17,685 84
2008 1,628 4 99 1,525 94 21,907 1,316 1,811 18,780 86
2009 1,599 4 105 1,490 93 22,080 1,250 2,365 18,465 84
2010 1,443 4 94 1,345 93 21,528 1,155 2,343 18,030 84
2011 1,562 4 103 1,455 93 21,291 1,065 1,856 18,370 86
2012 2,385 10 185 2,190 92 19,980 980 1,700 17,300 88
2013 N/A N/A N/A N/A N/A 20,304 954 1,460 17,890 88
Fall Potatoes: Production and stocks, Colorado, 2004-2013
Year
Production
Stocks and percent of production held by growers and commercial storages
December 1 January 1 February 1 March 1 April 1 May 1 June 1
Stocks Pct. Stocks Pct. Stocks Pct. Stocks Pct. Stocks Pct. Stocks Pct. Stocks Pct.
1,000
Cwt
1,000
Cwt
%
1,000
Cwt
%
1,000
Cwt
%
1,000
Cwt
%
1,000
Cwt
%
1,000
Cwt
%
1,000
Cwt
%
2004-2005 23,791 18,000 76 15,800 66 13,700 58 11,900 50 9,000 38 6,000 25 3,600 15
2005-2006 22,910 17,200 75 15,000 65 12,900 56 11,200 49 8,800 38 5,700 25 3,300 14
2006-2007 22,686 17,200 76 15,200 67 13,100 58 11,300 50 9,000 40 5,800 26 3,700 16
2007-2008 20,981 15,200 72 13,200 63 11,200 53 9,500 45 7,500 36 4,500 21 2,500 12
2008-2009 21,907 16,600 76 14,700 67 12,700 58 11,100 50 9,000 41 5,900 27 3,800 17
2009-2010 22,080 15,900 72 13,900 63 12,200 55 10,500 48 8,100 37 4,900 22 3,300 14
2010-2011 21,528 15,500 72 13,300 62 11,400 53 9,600 45 7,200 33 4,300 20 2,700 13
2011-2012 21,291 15,400 72 N/A 11,800 55 N/A 7,700 36 N/A 3,000 14
2012-2013 19,980 14,400 70 N/A 10,800 54 N/A N/A N/A N/A
2013-2014 20,304 N/A N/A N/A N/A 7,000 34 N/A 2,800 14
N/A : Not available
Potatoes: Acreage and production by county, Colorado, 2011-2012
County 1/
2011 2012
Acreage Yield per
acre
Production
Acreage Yield per
acre
Production Planted Harvested Planted Harvested
Acres Cwt 1,000 Cwt Acres Cwt 1,000 Cwt
Fall Crop:
Alamosa ........................................................................................................................................................................................................................... 18,200 18,200 385 7,000 18,300 17,800 358 6,365
Rio Grande....................................................................................................................................................................................................................... 15,900 15,800 402 6,350 16,100 15,700 380 5,970
Saguache ......................................................................................................................................................................................................................... 14,600 14,600 394 5,750 15,200 15,000 380 5,700
Combined counties .......................................................................................................................................................................................................... 5,300 5,300 413 2,191 5,500 5,500 354 1,945
Total Fall 54,000 53,900 395 21,291 55,100 54,000 370 19,980
Summer Crop:
Combined counties .......................................................................................................................................................................................................... 4,500 4,400 355 1,562 5,400 5,300 450 2,385
Total Summer 4,500 4,400 355 1,562 5,400 5,300 450 2,385
State Total 58,500 58,300 392 22,853 60,500 59,300 377 22,365
1/ Combined counties include data not published to avoid disclosure of individual operations.
Colorado Agricultural Statistics 2014 21
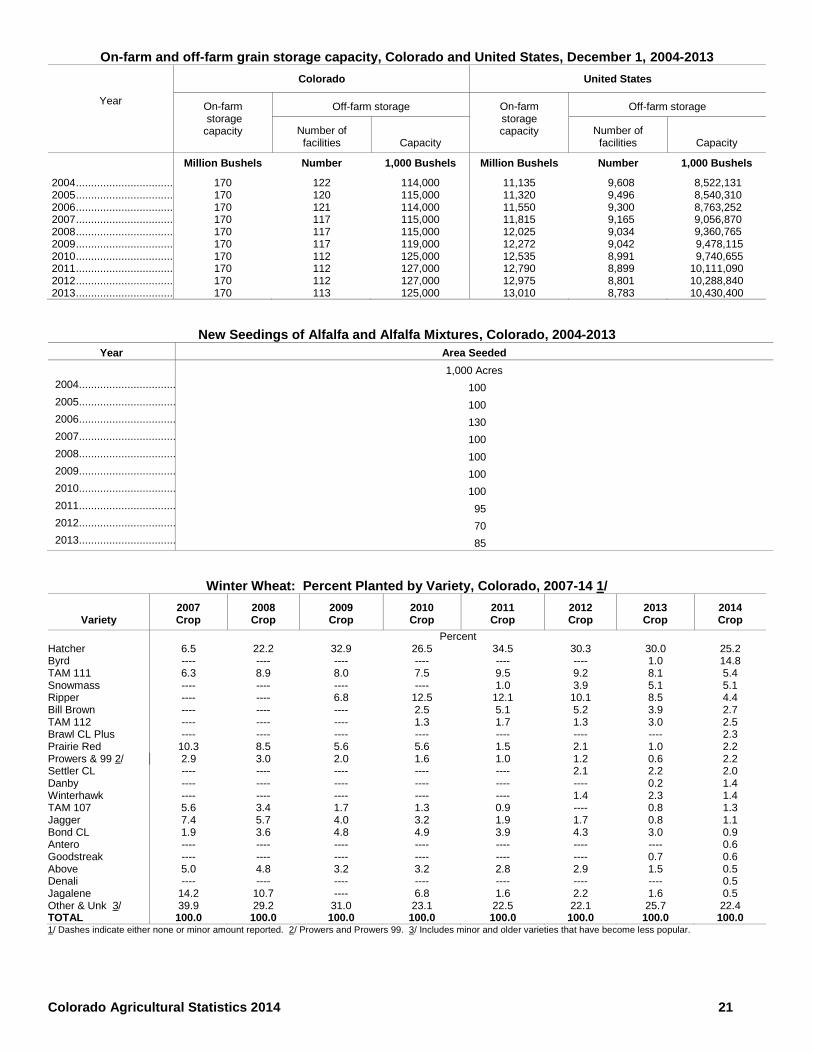
On-farm and off-farm grain storage capacity, Colorado and United States, December 1, 2004-2013
Year
Colorado United States
On-farm storage capacity
Off-farm storage On-farm storage capacity
Off-farm storage
Number of facilities
Capacity
Number of facilities
Capacity
Million Bushels Number 1,000 Bushels Million Bushels Number 1,000 Bushels
2004 .................................................................................................................................................................................................................................... 170 122 114,000 11,135 9,608 8,522,131 2005 .................................................................................................................................................................................................................................... 170 120 115,000 11,320 9,496 8,540,310 2006 .................................................................................................................................................................................................................................... 170 121 114,000 11,550 9,300 8,763,252 2007 .................................................................................................................................................................................................................................... 170 117 115,000 11,815 9,165 9,056,870 2008 .................................................................................................................................................................................................................................... 170 117 115,000 12,025 9,034 9,360,765 2009 .................................................................................................................................................................................................................................... 170 117 119,000 12,272 9,042 9,478,115 2010 .................................................................................................................................................................................................................................... 170 112 125,000 12,535 8,991 9,740,655 2011 .................................................................................................................................................................................................................................... 170 112 127,000 12,790 8,899 10,111,090 2012 .................................................................................................................................................................................................................................... 170 112 127,000 12,975 8,801 10,288,840 2013 .................................................................................................................................................................................................................................... 170 113 125,000 13,010 8,783 10,430,400
New Seedings of Alfalfa and Alfalfa Mixtures, Colorado, 2004-2013
Year Area Seeded
1,000 Acres
2004 ..................................... 100
2005 ................................... 100
2006 ................................... 130
2007 ................................... 100
2008 ................................... 100
2009 ................................... 100
2010 ................................... 100
2011 ................................... 95
2012 ................................... 70
2013 ................................... 85
Winter Wheat: Percent Planted by Variety, Colorado, 2007-14 1/
Variety
2007 Crop
2008 Crop
2009 Crop
2010 Crop
2011 Crop
2012 Crop
2013 Crop
2014 Crop
Percent Hatcher 6.5 22.2 32.9 26.5 34.5 30.3 30.0 25.2 Byrd ---- ---- ---- ---- ---- ---- 1.0 14.8 TAM 111 6.3 8.9 8.0 7.5 9.5 9.2 8.1 5.4 Snowmass ---- ---- ---- ---- 1.0 3.9 5.1 5.1 Ripper ---- ---- 6.8 12.5 12.1 10.1 8.5 4.4 Bill Brown ---- ---- ---- 2.5 5.1 5.2 3.9 2.7 TAM 112 ---- ---- ---- 1.3 1.7 1.3 3.0 2.5 Brawl CL Plus ---- ---- ---- ---- ---- ---- ---- 2.3 Prairie Red 10.3 8.5 5.6 5.6 1.5 2.1 1.0 2.2 Prowers & 99 2/ 2.9 3.0 2.0 1.6 1.0 1.2 0.6 2.2 Settler CL ---- ---- ---- ---- ---- 2.1 2.2 2.0 Danby ---- ---- ---- ---- ---- ---- 0.2 1.4 Winterhawk ---- ---- ---- ---- ---- 1.4 2.3 1.4 TAM 107 5.6 3.4 1.7 1.3 0.9 ---- 0.8 1.3 Jagger 7.4 5.7 4.0 3.2 1.9 1.7 0.8 1.1 Bond CL 1.9 3.6 4.8 4.9 3.9 4.3 3.0 0.9 Antero ---- ---- ---- ---- ---- ---- ---- 0.6 Goodstreak ---- ---- ---- ---- ---- ---- 0.7 0.6 Above 5.0 4.8 3.2 3.2 2.8 2.9 1.5 0.5 Denali ---- ---- ---- ---- ---- ---- ---- 0.5 Jagalene 14.2 10.7 ---- 6.8 1.6 2.2 1.6 0.5 Other & Unk 3/ 39.9 29.2 31.0 23.1 22.5 22.1 25.7 22.4 TOTAL 100.0 100.0 100.0 100.0 100.0 100.0 100.0 100.0 1/ Dashes indicate either none or minor amount reported. 2/ Prowers and Prowers 99. 3/ Includes minor and older varieties that have become less popular.
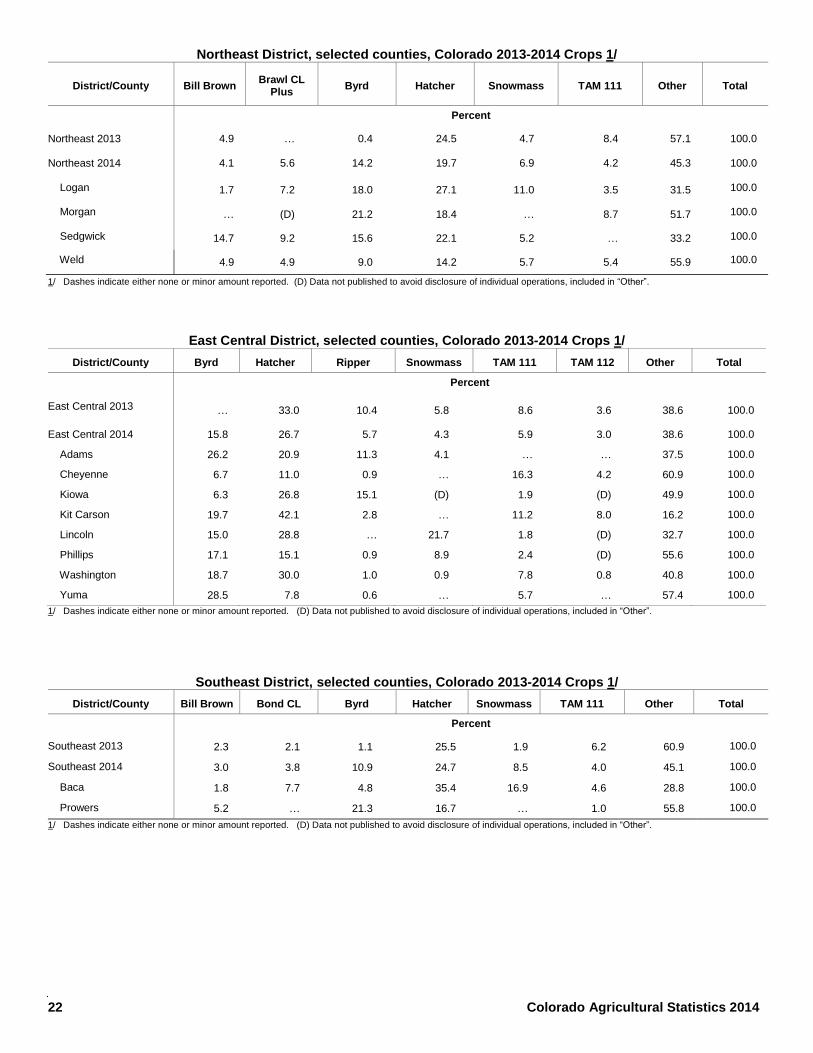
22 Colorado Agricultural Statistics 2014
Northeast District, selected counties, Colorado 2013-2014 Crops 1/
District/County Bill Brown Brawl CL
Plus Byrd Hatcher Snowmass TAM 111 Other Total
Percent
Northeast 2013 4.9 … 0.4 24.5 4.7 8.4 57.1 100.0
Northeast 2014 4.1 5.6 14.2 19.7 6.9 4.2 45.3 100.0
Logan 1.7 7.2 18.0 27.1 11.0 3.5 31.5 100.0
Morgan … (D) 21.2 18.4 … 8.7 51.7 100.0
Sedgwick 14.7 9.2 15.6 22.1 5.2 … 33.2 100.0
Weld 4.9 4.9 9.0 14.2 5.7 5.4 55.9 100.0
1/ Dashes indicate either none or minor amount reported. (D) Data not published to avoid disclosure of individual operations, included in “Other”.
East Central District, selected counties, Colorado 2013-2014 Crops 1/
District/County Byrd Hatcher Ripper Snowmass TAM 111 TAM 112 Other Total
Percent
East Central 2013 … 33.0 10.4 5.8 8.6 3.6 38.6 100.0
East Central 2014 15.8 26.7 5.7 4.3 5.9 3.0 38.6 100.0
Adams 26.2 20.9 11.3 4.1 … … 37.5 100.0
Cheyenne 6.7 11.0 0.9 … 16.3 4.2 60.9 100.0
Kiowa 6.3 26.8 15.1 (D) 1.9 (D) 49.9 100.0
Kit Carson 19.7 42.1 2.8 … 11.2 8.0 16.2 100.0
Lincoln 15.0 28.8 … 21.7 1.8 (D) 32.7 100.0
Phillips 17.1 15.1 0.9 8.9 2.4 (D) 55.6 100.0
Washington 18.7 30.0 1.0 0.9 7.8 0.8 40.8 100.0
Yuma 28.5 7.8 0.6 … 5.7 … 57.4 100.0
1/ Dashes indicate either none or minor amount reported. (D) Data not published to avoid disclosure of individual operations, included in “Other”.
Southeast District, selected counties, Colorado 2013-2014 Crops 1/
District/County Bill Brown Bond CL Byrd Hatcher Snowmass TAM 111 Other Total
Percent
Southeast 2013 2.3 2.1 1.1 25.5 1.9 6.2 60.9 100.0
Southeast 2014 3.0 3.8 10.9 24.7 8.5 4.0 45.1 100.0
Baca 1.8 7.7 4.8 35.4 16.9 4.6 28.8 100.0
Prowers 5.2 … 21.3 16.7 … 1.0 55.8 100.0
1/ Dashes indicate either none or minor amount reported. (D) Data not published to avoid disclosure of individual operations, included in “Other”.

Colorado Agricultural Statistics 2014 23
Field Crops: Monthly marketing percents, selected crops, Colorado, 2005-2012 crops 1/
Crop Year
All Wheat
Jul Aug Sep Oct Nov Dec Jan Feb Mar Apr May Jun
2005-06 ............ 18 14 21 6 2 9 9 7 4 3 3 4
2006-07 ............ 31 9 5 13 3 5 6 4 5 4 4 11
2007-08 ............ 47 16 9 3 1 3 8 3 4 3 1 2
2008-09 ............ 32 11 5 5 3 8 6 3 7 5 11 4
2009-10 ............ 25 13 5 13 7 5 6 5 3 5 4 7
2010-11 ............ 38 13 8 4 3 6 8 6 6 4 2 2
2011-12 ............ 17 17 10 3 2 9 8 6 6 3 5 14
2012-13 ............ 42 9 7 4 4 5 7 4 6 7 3 2
Barley
Jul Aug Sep Oct Nov Dec Jan Feb Mar Apr May Jun
2005-06 ............ 4 40 19 14 1 1 1 20 --- --- --- ---
2006-07 ............ 31 24 7 11 4 2 3 4 5 5 4 ---
2007-08 ............ 34 16 32 9 7 2 --- --- --- --- --- ---
2008-09 ............ 25 26 7 14 25 2 --- 1 --- --- --- ---
2009-10 ............ 2 22 14 33 5 14 2 8 --- --- --- ---
2010-11 ............ 5 23 11 11 8 7 18 11 2 2 1 1
2011-12 ............ 5 15 13 6 6 12 3 21 15 1 1 2
2012-13 ............ 9 23 15 29 2 21 --- --- --- --- --- 1
Corn for Grain
Oct Nov Dec Jan Feb Mar Apr May Jun Jul Aug Sep
2005-06 ............ 13 18 21 12 7 5 5 3 3 4 4 5
2006-07 ............ 12 26 21 9 6 6 4 4 3 3 3 3
2007-08 ............ 16 19 14 16 5 6 5 3 5 5 4 2
2008-09 ............ 3 16 26 13 5 11 5 7 6 3 2 3
2009-10 ............ 7 15 25 11 6 7 5 4 4 4 4 8
2010-11 ............ 20 16 18 15 5 6 5 4 5 3 1 2
2011-12 ............ 12 15 18 18 10 11 4 3 2 3 2 2
2012-13 ............ 16 16 16 17 5 11 5 5 3 2 2 2
Dry Beans
Sep Oct Nov Dec Jan Feb Mar Apr May Jun Jul Aug
2005-06 ............ 20 11 6 9 8 7 8 8 5 5 5 8
2006-07 ............ 23 9 4 14 10 4 5 7 6 7 4 7
2007-08 ............ 24 14 7 8 10 4 9 6 6 4 6 2
2008-09 ............ 42 9 4 6 8 9 3 4 7 5 2 1
2009-10 ............ 40 5 5 9 13 5 5 3 2 2 1 10
2010-11 ............ 30 5 6 14 8 8 5 8 4 6 4 2
2011-12 ............ 14 16 10 7 13 15 14 3 4 1 1 2
2012-13 ............ 10 4 4 21 11 9 4 2 2 6 6 21
All Hay
May Jun Jul Aug Sep Oct Nov Dec Jan Feb Mar Apr
2005-06 .............. 3 8 10 12 9 12 8 9 9 9 6 5
2006-07 .............. 6 9 18 11 12 11 8 8 5 5 5 2
2007-08 .............. 3 9 11 10 10 13 13 8 7 6 5 5
2008-09 .............. 2 9 17 13 12 12 9 7 6 5 5 3
2009-10 .............. 4 9 16 11 11 12 10 8 6 5 5 3
2010-11 .............. 3 9 11 12 12 11 7 10 7 5 7 6
2011-12 .............. 3 9 15 13 12 11 9 8 6 5 5 4
2012-13 .............. 3 9 14 13 12 11 9 9 6 5 5 4
1/ Dashes indicate only minor amount sold.

24 Colorado Agricultural Statistics 2014
Fruits: Production, price and value, Colorado, 2004-2013
Year
Bearing acres
Yield per bearing
acre
Production Price per
pound
Value of utilized production
Total Utilized
Apples Acres Pounds Million Pounds Cents 1,000 Dollars
2004 ......................................... 1,600 17,500 28.0 27.0 15.40 4,171
2005 ......................................... 1,500 20,700 31.0 27.0 17.90 4,824
2006 ......................................... 1,500 10,000 15.0 14.0 27.00 3,780
2007 ......................................... 1,600 8,130 13.0 13.0 21.50 2,790
2008 ......................................... 1,400 12,900 18.0 17.0 23.40 3,970
2009 ......................................... 1,500 10,700 16.0 15.0 25.80 3,870
2010 ......................................... 1,400 10,000 14.0 14.0 21.60 3,020
2011 ......................................... 1,300 6,920 9.0 8.0 29.30 2,340
2012 ......................................... 1,200 14,200 17.0 16.0 30.40 4,860
2013 ......................................... 1,200 4,670 5.6 5.3 36.30 1,923
Peaches
Bearing
acres
Yield per
bearing
acre
Production Price
per
ton
Value
of utilized
production Total Utilized
Acres Tons Tons Dollars 1,000 Dollars
2004 ......................................... 2,000 6.50 13,000 12,000 944.00 11,328
2005 ......................................... 2,100 5.71 12,000 11,000 1,080.00 11,880
2006 ......................................... 2,300 6.09 14,000 13,000 1,310.00 17,030
2007 ......................................... 2,300 5.65 13,000 11,000 1,550.00 17,080
2008 ......................................... 2,300 6.09 14,000 13,000 1,430.00 18,540
2009 ......................................... 2,300 5.65 13,000 11,000 1,660.00 18,300
2010 ......................................... 2,400 5.83 14,000 12,000 1,870.00 22,440
2011 ......................................... 2,400 5.00 12,000 11,200 2,000.00 22,400
2012 ......................................... 2,500 6.80 17,000 16,000 1,580.00 25,280
2013 ......................................... 2,500 2.93 7,330 7,080 1,870.00 13,263
Onions: Acreage, production and value, Colorado, 2004-2013
Year
Acreage planted
Acreage harvested
Yield per acre
Production
Loss
Sales
Value per cwt
Total value
Acres Acres Cwt 1,000 Cwt 1,000 Cwt Dollars 1,000 Dollars
2004 ................... 12,500 11,000 500 5,500 1,400 4,100 12.20 50,020
2005 ................... 10,000 9,500 440 4,180 500 3,680 17.70 55,568
2006 ................... 10,000 9,500 400 3,800 380 3,420 18.40 62,928
2007 ................... 9,000 7,700 410 3,157 470 2,687 9.70 26,064
2008 ................... 8,000 7,500 380 2,850 400 2,450 17.60 43,120
2009 ................... 8,000 6,600 415 2,739 300 2,439 12.60 30,731
2010 ................... 7,500 7,200 400 2,880 300 2,580 17.70 45,666
2011 ................... 7,500 6,900 415 2,864 330 2,534 13.80 34,462
2012 ................... 6,500 6,200 420 2,604 290 2,314 17.10 39,569
2013 ................... 6,000 4,000 425 1,700 190 1,510 18.90 28,539

Colorado Agricultural Statistics 2014 25
Vegetables: Acreage, production and value, Colorado, 2004-2013
Year Acreage
planted
Acreage
harvested
Yield
per acre
Production
Value
per unit
Total
value
Cabbage
Acres Acres Cwt 1,000 Cwt Dollars 1,000 Dollars
2004 ........................................... 3,400 3,300 480 1,584 9.70 15,365
2005 ........................................... 3,500 3,400 480 1,632 9.50 15,504
2006 ........................................... 3,500 3,100 430 1,333 9.80 13,063
2007 ........................................... 2,500 2,400 380 912 10.90 9,941
2008 ........................................... 2,400 2,300 400 920 10.60 9,752
2009 ........................................... 3,000 2,700 470 1,269 11.00 13,959
2010 ........................................... 3,100 2,900 460 1,334 11.50 15,341
2011 ........................................... 2,900 2,800 460 1,288 13.60 17,517
2012 ........................................... 2,500 2,400 450 1,080 14.70 15,876
2013 ........................................... 1,300 1,200 470 564 16.40 9,250
Cantaloupe
Acres Acres Cwt 1,000 Cwt Dollars 1,000 Dollars
2004 ........................................... 2,300 1,700 160 272 14.50 3,944
2005 ........................................... 2,000 1,600 190 304 13.60 4,134
2006 ........................................... 1,700 1,600 170 272 18.40 5,005
2007 ........................................... 1,900 1,800 190 342 15.00 5,130
2008 ........................................... 2,300 2,100 210 441 20.40 8,996
2009 ........................................... 2,400 2,200 270 594 21.60 12,830
2010 ........................................... 2,300 2,200 190 418 19.10 7,984
2011 ........................................... 2,200 2,100 190 399 23.00 9,177
2012 ........................................... 1,000 900 250 225 32.30 7,268
2013 ........................................... 600 600 200 120 40.00 4,800
Sweet Corn for Fresh Market
Acres Acres Cwt 1,000 Cwt Dollars 1,000 Dollars
2004 ........................................... 9,400 9,300 150 1,395 11.70 16,322
2005 ........................................... 10,000 9,700 150 1,455 13.70 19,934
2006 ........................................... 10,000 9,000 150 1,350 14.70 19,845
2007 ........................................... 8,000 7,500 140 1,050 11.70 12,285
2008 ........................................... 7,400 7,300 170 1,241 15.60 19,360
2009 ........................................... 8,000 6,800 160 1,088 13.70 14,906
2010 ........................................... 8,000 7,500 150 1,125 14.50 16,313
2011 ........................................... 7,600 7,400 180 1,332 16.90 22,511
2012 ........................................... 6,900 6,800 150 1,020 16.60 16,932
2013 ........................................... 4,200 4,100 160 656 18.70 12,267

26 Colorado Agricultural Statistics 2014
Field Crops: Usual planting and harvest dates, Colorado
Crop Usual planting dates
Usual harvesting dates Principal producing districts 1/ Begin Most active End
Barley:
Fall sown………..…….. Sep. 1 - Oct. 15 Jun. 20 Jul 1 - Jul. 20 Aug. 5 20, 60, 90
Spring sown……….….. Mar. 26 - May 5 Jul. 20 Jul. 29 - Sep. 6 Sep. 14 10, 20, 70, 80
Beans, dry………….…… May 28 – Jun. 18 Aug. 25 Sep. 5 - Sep. 15 Oct. 10 20, 60, 70, 90
Corn:
Grain…….…………….. Apr. 28 - May 20 Sep. 28 Oct. 8 - Nov. 13 Nov. 22 20, 60, 70, 90
Silage…….……………. Apr. 28 – May. 20 Aug. 28 Sep. 5 - Sep. 30 Oct. 10 20, 60, 70, 90
Hay:
Alfalfa……….…………. … May 23 May 30 -Oct. 6 Nov. 9 Statewide
Other……..……………. … Jun. 20 Jul. 5 - Aug. 10 Sep. 15 Statewide
Oats……..………………. Mar. 28 - May 14 Jul. 13 Jul. 19 - Sep. 13 Sep. 25 Statewide
Potatoes:
Fall…….………………. May 6 - May 25 Sep. 6 Sept. 15 - Oct. 11 Oct. 17 80
Summer…….………… Apr. 14 - May 18 Aug. 6 Aug. 17 - Sep. 25 Oct. 20 20
Sorghum:
Grain…….…………….. May 19 – Jun. 23 Sep. 29 Oct. 11 - Nov. 18 Nov. 29 60, 90
Silage…….……………. May 5 - Jun. 20 Sep. 1 Sep. 5 - Sep. 20 Oct. 1 60, 90
Sugar beets…….………. Mar. 30 - May 10 Sep. 30 Oct. 10 – Nov. 4 Nov. 10 20
Sunflower……..………… May 19 – Jun. 23 Sep. 27 Oct. 6 - Nov. 15 Nov. 26 20, 60
Wheat:
Winter…….……………. Sep. 11 - Oct. 2 Jun. 27 Jul. 2 - Jul. 21 Jul. 29 20, 60, 90
Spring…….……………. Apr. 9 - May 16 Jul. 23 Aug. 3 - Sep. 17 Sep. 29 10, 80
1/ See footnotes at bottom of page.
Fruit Crops: Usual bloom and harvest dates, Colorado Crop
Usual blooming dates Usual harvesting dates Principal producing counties
Begin Most active End
Apples……………..…… Apr. 20 - May 10 Aug. 15 Sep. 5 - Oct. 30 Nov. 15 Delta, Mesa, Montrose, Fremont
Peaches………....…....... Apr. 5 - Apr. 25 Jul. 15 Aug. 1 - Sep. 15 Sep. 30 Delta, Mesa
Vegetable Crops: Usual planting and harvesting dates, Colorado Crop
Usual planting dates Usual harvesting dates Principal producing
districts 1/ Begin Most active End
Cabbage………….……. Jun. 1 - Jun. 15 Sep. 5 Sep. 20 - Oct. 20 Nov. 1 20, 60, 90
Cantaloupe…………….. Apr. 15 - May 15 Jul. 25 Aug. 10 – Aug. 31 Sep. 30 90
Carrots………….…….… Apr. 15 - Jun. 30 Aug. 1 Aug. 15 - Oct. 10 Oct. 31 20, 60, 80
Lettuce…………..……… Apr. 1 - Jul. 10 Jun. 15 Jun. 20 - Sep. 20 Oct. 15 20, 60, 70, 80
Onions…………..……… Mar. 10 - May 10 Jul. 15 Aug. 1 - Sep. 20 Oct. 31 20, 70, 90
Sweet corn………….….. May 1 - Jun. 30 Jun. 5 Jul. 20 - Sep. 20 Oct. 10 20, 60, 70, 90
1/ For districts, see map on inside of front cover as follows: 10 – Northwest and Mountains; 20 – Northeast; 60 – East Central; 70 – Southwest; 80 – San Luis Valley; 90 – Southeast.

Colorado Agricultural Statistics 2014 27
Farm income indicators, Colorado, 2008-2013 1/
Item 2008 2009 2010 2011 2012 2013 2/
Thousand Dollars
Total Agricultural Sector Output ...................................................................................................................................................................................... 7,008,405 6,603,162 6,919,278 8,240,080 8,425,756
Final Crop Output ........................................................................................................................................................................................................... 2,231,336 2,324,121 2,341,006 2,881,396 2,727,533
Final Animal Output ........................................................................................................................................................................................................ 3,892,116 3,338,178 3,819,378 4,301,061 4,550,190
Services and Forestry .................................................................................................................................................................................................... 884,953 940,863 758,894 1,057,623 1,148,033
Net Government Transactions ............................................................................................................................................................................................. 49,404 -3,885 72,961 32,224 -7,754
Total Production Expenses ................................................................................................................................................................................................. 4,586,248 4,509,872 4,429,818 5,105,778 5,199,889
Farm Origin ................................................................................................................................................................................................................ 2,322,196 2,324,237 2,409,351 2,870,324 2,881,244
Feed Purchased ....................................................................................................................................................................................................... 1,006,654 1,050,880 1,004,639 1,419,273 1,370,454
Livestock and Poultry Purchased .............................................................................................................................................................................. 1,158,308 1,101,829 1,227,058 1,255,019 1,306,590
Seed Purchased ........................................ 157,234 171,528 177,654 196,032 204,200
Manufactured Inputs .................................................................................................................................................................................................... 818,180 702,301 720,662 913,451 879,231
Fertilizers & Lime ...................................................................................................................................................................................................... 258,930 233,889 228,632 313,006 311,430
Pesticides ................................................................................................................................................................................................................. 114,416 107,606 111,692 113,054 126,675
Petroleum Fuel and Oils ............................ 307,839 238,796 255,460 326,119 283,262
Electricity .................................................................................................................................................................................................................. 136,995 122,010 124,878 161,272 157,864
Other Purchased Inputs ............................................................................................................................................................................................... 1,445,872 1,483,334 1,299,805 1,322,003 1,439,414
Repair & Maintenance .............................................................................................................................................................................................. 270,498 297,688 248,797 276,246 275,332
Machine Hire & Custom Work .................................................................................................................................................................................. 92,376 102,383 111,349 62,531 99,141
Marketing, Storage &Transportation .......... 231,962 245,842 201,268 187,865 193,873
Contract Labor ......................................................................................................................................................................................................... 50,140 54,354 31,571 33,269 40,361
Miscellaneous Other ................................................................................................................................................................................................. 800,896 783,067 706,820 762,092 830,707
Payments to Stakeholders .................................................................................................................................................................................................. 870,602 932,145 890,308 870,751 870,214
Employee Compensation (Hired Labor) ...................................................................................................................................................................... 479,579 517,051 465,064 446,739 481,303
Net Rent to Non-Operator Landlords .......................................................................................................................................................................... 43,076 49,526 76,656 93,976 58,388
Real Estate/Non-Real Estate Interest ......................................................................................................................................................................... 347,947 365,568 348,588 330,036 330,523
Capital Consumption ........................................................................................................................................................................................................... 499,488 522,237 533,334 559,573 594,557
Net Farm Income .............................................................................................................................................................................................................. 1,101,471 635,023 1,138,779 1,736,202 1,753,342
Number of Farms .............................................................................................................................................................................................................. 36,500 36,100 36,300 36,600 36,200 35,600
1/ Totals may not add due to rounding. 2/ Available November 25, 2014. Data Source: USDA Economic Research Service. http://www.ers.usda.gov

28 Colorado Agricultural Statistics 2014
Farm Income: Cash receipts by commodity, Colorado, 2009-2013 1/
Commodity
2009 2010 2011 2012 2013 4/
Cash Receipts
Cash Receipts
Cash Receipts
Cash Receipts
Cash Receipts
$ 1,000 $ 1,000 $ 1,000 $ 1,000 $1,000
All commodities ...................................... 5,568,440 6,090,462 6,992,320 7,638,232
Livestock and products ......................... 3,338,161 3,760,711 4,157,502 4,739,833
Meat animals .......................................... 2,856,110 3,056,985 3,298,166 3,888,253
Cattle and calves ..................................... 2,614,352 2,863,144 3,061,811 3,663,259
Hogs ........................................................ 136,458 193,841 236,355 224,724
Sheep and lambs 2/ ................................. 105,300 2/ 2/ 2/
Dairy (Milk) ............................................. 358,912 456,740 594,200 593,526
Poultry/eggs........................................... 77,162 85,701 93,051 106,209
Chicken and eggs ................................ 70,308 77,131 85,801 96,215
Farm chickens ..................................... 480 610 426 663
Miscellaneous livestock ........................ 45,977 161,285 172,085 151,845
Honey ...................................................... 2,122 2,894 3,410 2,646
Trout ........................................................ 1,685 1,467 1,844 1,734
Wool ........................................................ 1,804 3,725 5,590 5,000
Crops ...................................................... 2,230,279 2,329,751 2,834,818 2,898,399
Food grains ............................................ 436,463 500,892 514,628 532,398
Wheat ...................................................... 436,463 500,892 514,628 532,398
Feed crops .............................................. 934,381 988,306 1,389,079 1,493,719
Barley ...................................................... 44,809 22,344 32,540 39,769
Corn, grain .............................................. 493,504 652,585 869,490 939,395
Hay .......................................................... 361,699 266,626 422,761 461,743
Millet, proso ............................................. 19,946 23,931 34,638 29,744
Oats ........................................................ 541 821 1,630 1,455
Sorghum grain ......................................... 13,881 21,999 28,021 21,615
Oilcrops .................................................. 36,919 41,043 40,320 24,724
Sunflower ................................................ 35,855 39,928 38,841 23,185
Vegetables and melons ......................... 381,601 376,488 442,994 376,056
Beans, dry ............................................... 23,993 26,492 29,340 31,606
Cabbage .................................................. 13,959 15,341 17,517 15,876
Cantaloupe .............................................. 12,830 7,984 9,177 7,268
Corn, sweet ............................................. 14,906 16,313 22,511 16,932
Onions ..................................................... 35,751 48,112 42,628 38,367
Potatoes .................................................. 196,678 169,996 232,840 180,338
Fall ........................................................ 186,378 156,452 216,715 166,899
Summer ................................................. 10,300 13,544 16,125 13,439
Fruits/nuts .............................................. 27,906 32,106 30,533 37,505
Apples ..................................................... 3,776 3,356 1,323 4,675
Apples, Fresh .......................................... 3,408 2,820 764 4,194
Apples, Processing .................................. 368 536 560 482
Peaches .................................................. 18,300 22,440 22,400 25,280
Pears ....................................................... N/A N/A N/A N/A
All other crops ........................................ 413,009 390,916 417,264 433,997
Sugarbeets .............................................. 51,328 56,705 56,704 64,570
Greenhouse/nursery 3/ ............................ 276,430 254,270 253,765 253,265
1/ Totals may not add due to rounding; sub categories may not add to total. 2/ Beginning in 2011, sheep and lambs are included in miscellaneous livestock. 3/ Floriculture included in other greenhouse/nursery beginning in 2006. 4/ Available November 25, 2014.
Data Source: USDA Economic Research Service. http://www.ers.usda.gov Cash receipt data reflect income derived from the sale of agricultural commodities during a calendar year for only that portion of the commodity that is sold. Released August 2014.

Colorado Agricultural Statistics 2014 29
Agricultural Exports: Estimated value, Colorado by commodity group (Calendar Year), 2005 - 2012
Colorado
Commodity 2005 2006 2007 2008 2009 2010 2011 2012
Million Dollars
Beef and Veal ..................................................................................................................................................................................................................... 87.7 134.5 167.1 195.7 183.8 226.8 263.6 297.0
Pork .................................................................................................................................................................................................................................... 32.7 36.6 42.9 52.2 39.8 51.6 66.4 64.1
Hides and skins ................................................................................................................................................................................................................... 113.1 135.4 138.0 126.4 87.4 127.0 129.4 149.6
Dairy products ..................................................................................................................................................................................................................... 21.1 25.6 43.3 57.5 33.0 53.7 71.9 82.2
Chicken meat ...................................................................................................................................................................................................................... ... ... ... ... ... ... ... …
Vegetables, fresh ................................................................................................................................................................................................................ 30.8 29.4 33.6 40.8 34.9 38.4 46.8 38.7
Vegetables, processed ........................................................................................................................................................................................................ 40.4 38.7 46.1 66.1 56.3 59.8 75.9 72.6
Fruits, fresh ......................................................................................................................................................................................................................... 6.6 7.7 8.1 10.0 10.7 11.3 11.3 13.1
Fruits, processed ................................................................................................................................................................................................................. 3.8 4.8 5.4 6.5 6.9 7.0 7.2 7.6
Tree nuts ............................................................................................................................................................................................................................. ... ... ... ... ... ... ... …
Wheat ................................................................................................................................................................................................................................. 114.2 100.6 331.1 298.7 200.4 306.6 413.1 283.3
Rice .................................................................................................................................................................................................................................... ... ... ... ... ... ... ... …
Corn .................................................................................................................................................................................................................................... 72.9 92.0 103.1 139.6 101.5 135.4 188.6 126.7
Grain products .................................................................................................................................................................................................................... 69.6 80.1 90.6 84.5 91.7 102.2 116.6 122.9
Feeds and fodder ................................................................................................................................................................................................................ 48.6 62.0 57.1 68.2 77.0 92.7 110.9 121.4
Soybeans ............................................................................................................................................................................................................................ ... ... ... ... ... ... ... …
Soybean meal ..................................................................................................................................................................................................................... ... ... ... ... ... ... ... …
Vegetable oils ..................................................................................................................................................................................................................... 2.0 2.3 2.0 3.8 3.2 4.3 4.4 2.3
Sugar and products ............................................................................................................................................................................................................. 13.1 15.1 14.2 20.0 23.8 26.4 31.7 33.3
Cotton ................................................................................................................................................................................................................................. ... ... ... ... ... ... ... …
Tobacco, unmanufactured ................................................................................................................................................................................................... ... ... ... ... ... ... ... …
Planting seeds .................................................................................................................................................................................................................... 1.5 2.6 1.4 1.6 1.5 1.7 1.8 1.9
Other products1/ ................................................................................................................................................................................................................. 274.0 328.6 365.9 434.5 376.2 473.8 558.7 551.9
Total agricultural exports ..................................................................................................................................................................................................... 932.1 1,095.9 1,449.9 1,606.0 1,328.1 1,718.6 2,097.8 1,968.4
Agricultural Exports: Estimated value, United States by commodity group (Calendar Year), 2005 - 2012
United States
Commodity 2005 2006 2007 2008 2009 2010 2011 2012
Million Dollars
Beef and Veal ..................................................................................................................................................................................................................... 1,377.2 2,031.4 2,623.6 3,195.7 3,081.5 4,078.6 5,419.0 5,508.8
Pork .................................................................................................................................................................................................................................... 2,638.5 2,856.1 3,155.5 4,795.9 4,284.2 4,779.3 6,107.5 6,320.7
Hides and skins ................................................................................................................................................................................................................... 1,776.6 2,045.5 2,165.9 2,064.1 1,464.9 2,284.3 2,661.4 2,774.6
Dairy products ..................................................................................................................................................................................................................... 1,628.9 1,832.0 2,978.2 3,752.7 2,235.1 3,689.3 4,779.1 5,123.9
Chicken meat ...................................................................................................................................................................................................................... 2,116.2 1,849.6 2,738.2 3,514.3 3,293.0 3,124.9 3,644.9 4,179.1
Vegetables, fresh ................................................................................................................................................................................................................ 1,545.2 1,689.2 1,815.4 1,955.1 1,917.9 2,102.0 2,220.8 2,158.9
Vegetables, processed ........................................................................................................................................................................................................ 2,025.7 2,223.7 2,491.5 3,168.7 3,090.3 3,273.4 3,600.5 4,052.5
Fruits, fresh ......................................................................................................................................................................................................................... 2,696.6 2,870.8 3,140.0 3,622.3 3,513.2 3,980.9 4,497.2 4,936.3
Fruits, processed ................................................................................................................................................................................................................. 1,546.5 1,811.2 2,078.6 2,373.0 2,248.1 2,469.8 2,869.3 2,883.1
Tree nuts ............................................................................................................................................................................................................................. 2,801.7 2,948.6 3,151.0 3,483.6 3,802.4 4,524.0 5,415.6 6,506.4
Wheat ................................................................................................................................................................................................................................. 4,357.4 4,194.5 8,364.7 11,290.3 5,375.5 6,763.6 11,140.2 8,158.0
Rice .................................................................................................................................................................................................................................... 1,277.2 1,270.8 1,392.4 2,205.2 2,175.9 2,334.7 2,109.6 2,062.3
Corn .................................................................................................................................................................................................................................... 4,788.8 6,991.7 9,762.6 13,431.0 8,746.0 9,792.0 13,643.3 9,338.3
Grain products .................................................................................................................................................................................................................... 3,267.7 3,538.8 4,181.8 4,763.8 4,368.8 4,729.1 5,422.0 5,902.2
Feeds and fodder ................................................................................................................................................................................................................ 2,281.2 2,620.0 3,191.0 4,161.8 4,162.6 5,138.0 5,758.3 6,417.2
Soybeans ............................................................................................................................................................................................................................ 6,273.6 6,935.6 9,992.1 15,430.9 16,423.2 18,610.8 17,590.0 24,605.7
Soybean meal ..................................................................................................................................................................................................................... 1,488.0 1,666.5 2,164.6 3,200.9 3,500.6 3,515.5 3,218.6 4,864.7
Vegetable oils ..................................................................................................................................................................................................................... 1,655.7 1,831.5 2,502.8 3,899.9 3,091.7 3,903.1 4,015.8 4,164.5
Sugar and products ............................................................................................................................................................................................................. 775.5 933.8 1,143.4 1,188.2 1,132.1 1,537.6 1,805.5 2,029.6
Cotton ................................................................................................................................................................................................................................. 3,929.4 4,514.4 4,588.7 4,811.9 3,365.5 5,890.2 8,466.3 6,254.9
Tobacco, unmanufactured ................................................................................................................................................................................................... 989.6 1,141.4 1,207.9 1,238.0 1,159.0 1,167.6 1,148.8 1,101.2
Planting seeds .................................................................................................................................................................................................................... 922.8 869.7 1,019.7 1,277.3 1,150.4 1,252.4 1,410.7 1,521.7
Other products1/ ................................................................................................................................................................................................................. 11,022.2 12,283.6 14,142.1 15,936.9 14,872.3 16,878.9 19,424.3 20,405.2
Total agricultural exports .................................................................................................................................................................................................... 63,182.3 70,950.4 89,991.8 114,761.4 98,453.9 115,820.1 136,368.9 141,269.8
1/ Includes live animals, other meats, animal parts, eggs, wine, beer, other beverages, coffee, cocoa, hops, nursery crops, inedible materials, and prepared foods. Data Source: Economic Research Service http://www.ers.usda.gov/data-products/state-export-data.aspx

30 Colorado Agricultural Statistics 2014
Farm Real Estate: Average value per acre by type of land, Colorado and United States, 2004-2013
Year
Colorado United States
All Land
All Cropland
Irrigated Cropland
Non-Irrigated Cropland
Pasture All
Land All
Cropland
Pasture
Dollars per Acre Dollars per Acre
2004 .................. 760 891 2,050 570 460 1,340 1,750 630
2005 .................. 900 1,000 2,380 620 590 1,610 2,060 740
2006 .................. 1,020 1,170 2,700 740 740 1,830 2,300 960
2007 .................. 1,130 1,270 2,900 820 730 2,010 2,530 1,030
2008 .................. 1,150 1,310 3,100 890 710 2,170 2,760 1,090
2009 .................. 1,100 1,300 3,150 840 670 2,090 2,640 1,060
2010 .................. 1,080 1,290 3,100 840 650 2,150 2,700 1,060
2011 .................. 1,100 1,340 3,160 880 640 2,300 2,980 1,070
2012 .................. 1,170 1,450 3,400 960 640 2,520 3,350 1,110
2013 .................. 1,280 1,770 4,100 1,200 680 2,730 3,810 1,170
Farm Real Estate: Average cash rent per acre by type of land, Colorado and United States, 2004-2013
Year
Colorado United States
Irrigated Cropland
Non-Irrigated Cropland
Pasture All Cropland
Pasture
Dollars per Acre Dollars per Acre
2004 .............................. 91.00 22.00 3.70 76.50 9.60
2005 .............................. 100.00 23.00 4.30 78.00 10.30
2006 .............................. 100.00 23.00 4.00 79.50 10.80
2007 .............................. 100.00 22.00 5.50 77.50 10.00
2008 .............................. 110.00 24.00 5.50 85.50 10.50
2009 .............................. 110.00 24.00 5.50 99.00 11.00
2010 .............................. 110.00 23.00 5.00 102.00 11.00
2011 .............................. 115.00 23.00 4.50 111.00 11.50
2012 .............................. 125.00 26.00 4.60 125.00 11.50
2013 .............................. 125.00 27.00 4.60 136.00 12.00
Grazing Fees: Rates for cattle, Colorado and seventeen States, 2004-2013
Colorado Seventeen States 1/
Year Per Animal Unit
Per Cow-Calf
Per Head
Per Animal Unit
Per Cow-Calf
Per Head
Dollars per Month Dollars per Month
2004 .................. 13.50 15.00 14.00 13.10 15.30 13.70
2005 .................. 14.50 16.00 14.30 13.20 15.20 14.00
2006 .................. 14.50 16.00 15.00 13.80 15.80 14.40
2007 .................. 15.00 16.70 15.10 14.50 16.90 14.80
2008 .................. 14.50 16.00 14.50 14.70 17.00 15.60
2009 .................. 14.70 16.30 15.20 14.60 17.00 15.50
2010 .................. 15.00 17.10 16.50 15.30 17.90 16.60
2011 .................. 15.30 17.50 16.60 17.00 19.20 17.60
2012 .................. 17.00 19.00 18.50 17.80 20.00 18.40
2013 .................. 17.50 20.00 19.00 18.30 21.40 18.90
1/ The seventeen states include: AZ, CA, CO, ID, KS, MT, NE, NV, NM, ND, OK, OR, SD, TX, UT, WA, and WY.
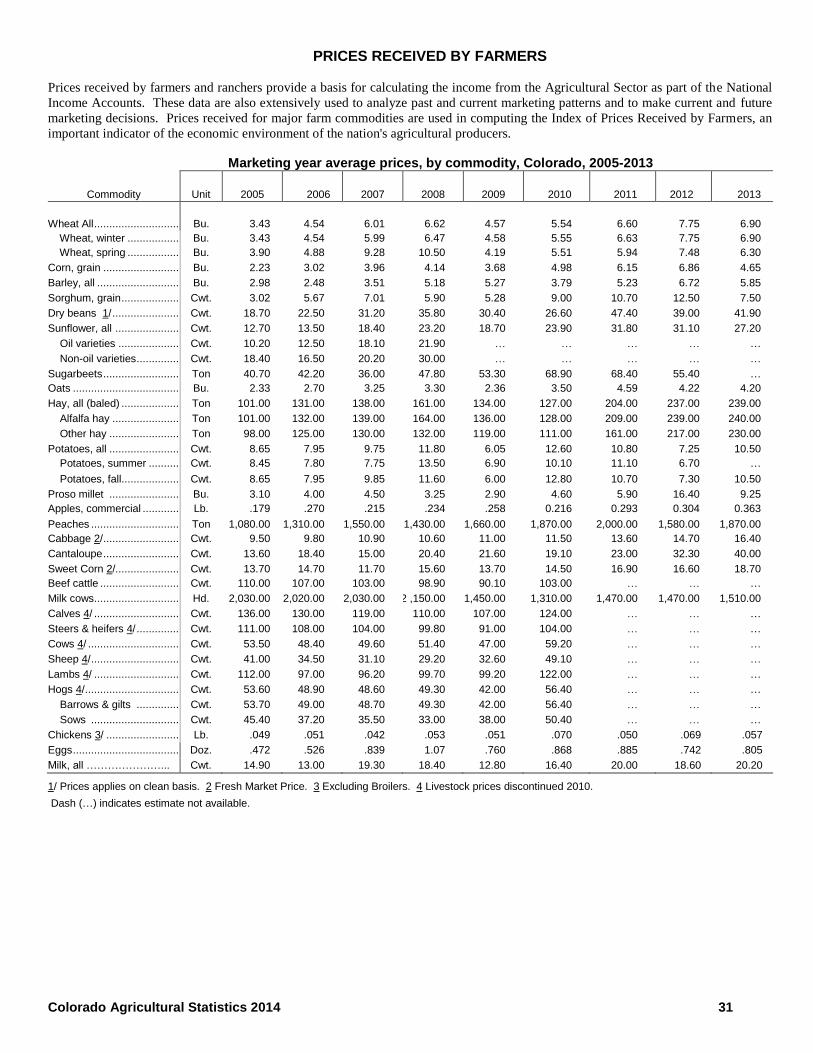
Colorado Agricultural Statistics 2014 31
PRICES RECEIVED BY FARMERS
Prices received by farmers and ranchers provide a basis for calculating the income from the Agricultural Sector as part of the National
Income Accounts. These data are also extensively used to analyze past and current marketing patterns and to make current and future
marketing decisions. Prices received for major farm commodities are used in computing the Index of Prices Received by Farmers, an
important indicator of the economic environment of the nation's agricultural producers.
Marketing year average prices, by commodity, Colorado, 2005-2013
Commodity Unit 2005 2006 2007 2008 2009 2010 2011 2012 2013
Wheat All ............................ Bu. 3.43 4.54 6.01 6.62 4.57 5.54 6.60 7.75 6.90
Wheat, winter ................. Bu. 3.43 4.54 5.99 6.47 4.58 5.55 6.63 7.75 6.90
Wheat, spring ................. Bu. 3.90 4.88 9.28 10.50 4.19 5.51 5.94 7.48 6.30
Corn, grain ......................... Bu. 2.23 3.02 3.96 4.14 3.68 4.98 6.15 6.86 4.65
Barley, all ........................... Bu. 2.98 2.48 3.51 5.18 5.27 3.79 5.23 6.72 5.85
Sorghum, grain ................... Cwt. 3.02 5.67 7.01 5.90 5.28 9.00 10.70 12.50 7.50
Dry beans 1/ ...................... Cwt. 18.70 22.50 31.20 35.80 30.40 26.60 47.40 39.00 41.90
Sunflower, all ..................... Cwt. 12.70 13.50 18.40 23.20 18.70 23.90 31.80 31.10 27.20
Oil varieties .................... Cwt. 10.20 12.50 18.10 21.90 … … … … …
Non-oil varieties .............. Cwt. 18.40 16.50 20.20 30.00 … … … … …
Sugarbeets ......................... Ton 40.70 42.20 36.00 47.80 53.30 68.90 68.40 55.40 …
Oats ................................... Bu. 2.33 2.70 3.25 3.30 2.36 3.50 4.59 4.22 4.20
Hay, all (baled) ................... Ton 101.00 131.00 138.00 161.00 134.00 127.00 204.00 237.00 239.00
Alfalfa hay ...................... Ton 101.00 132.00 139.00 164.00 136.00 128.00 209.00 239.00 240.00
Other hay ....................... Ton 98.00 125.00 130.00 132.00 119.00 111.00 161.00 217.00 230.00
Potatoes, all ....................... Cwt. 8.65 7.95 9.75 11.80 6.05 12.60 10.80 7.25 10.50
Potatoes, summer .......... Cwt. 8.45 7.80 7.75 13.50 6.90 10.10 11.10 6.70 …
Potatoes, fall................... Cwt. 8.65 7.95 9.85 11.60 6.00 12.80 10.70 7.30 10.50
Proso millet ....................... Bu. 3.10 4.00 4.50 3.25 2.90 4.60 5.90 16.40 9.25
Apples, commercial ............ Lb. .179 .270 .215 .234 .258 0.216 0.293 0.304 0.363
Peaches ............................. Ton 1,080.00 1,310.00 1,550.00 1,430.00 1,660.00 1,870.00 2,000.00 1,580.00 1,870.00
Cabbage 2/ ......................... Cwt. 9.50 9.80 10.90 10.60 11.00 11.50 13.60 14.70 16.40
Cantaloupe ......................... Cwt. 13.60 18.40 15.00 20.40 21.60 19.10 23.00 32.30 40.00
Sweet Corn 2/..................... Cwt. 13.70 14.70 11.70 15.60 13.70 14.50 16.90 16.60 18.70
Beef cattle .......................... Cwt. 110.00 107.00 103.00 98.90 90.10 103.00 … … …
Milk cows............................ Hd. 2,030.00 2,020.00 2,030.00 2 ,150.00 1,450.00 1,310.00 1,470.00 1,470.00 1,510.00
Calves 4/ ............................ Cwt. 136.00 130.00 119.00 110.00 107.00 124.00 … … …
Steers & heifers 4/ .............. Cwt. 111.00 108.00 104.00 99.80 91.00 104.00 … … …
Cows 4/ .............................. Cwt. 53.50 48.40 49.60 51.40 47.00 59.20 … … …
Sheep 4/ ............................. Cwt. 41.00 34.50 31.10 29.20 32.60 49.10 … … …
Lambs 4/ ............................ Cwt. 112.00 97.00 96.20 99.70 99.20 122.00 … … …
Hogs 4/ ............................... Cwt. 53.60 48.90 48.60 49.30 42.00 56.40 … … …
Barrows & gilts .............. Cwt. 53.70 49.00 48.70 49.30 42.00 56.40 … … …
Sows ............................. Cwt. 45.40 37.20 35.50 33.00 38.00 50.40 … … …
Chickens 3/ ........................ Lb. .049 .051 .042 .053 .051 .070 .050 .069 .057
Eggs ................................... Doz. .472 .526 .839 1.07 .760 .868 .885 .742 .805
Milk, all …………………... Cwt. 14.90 13.00 19.30 18.40 12.80 16.40 20.00 18.60 20.20
1/ Prices applies on clean basis. 2 Fresh Market Price. 3 Excluding Broilers. 4 Livestock prices discontinued 2010.
Dash (…) indicates estimate not available.

32 Colorado Agricultural Statistics 2014
Prices Received: Monthly averages selected commodities, Colorado, 2004-2013
Year Jan. Feb. Mar. Apr. May June July Aug. Sep. Oct. Nov. Dec.
All Barley
Dollars Per Bushel
2004 ................... 3.03 2.96 (S) (S) (S) (S) 2.19 2.56 3.11 2.69 2.99 2.84 2005 ................... 2.81 2.34 2.51 (S) (S) (S) (S) 2.74 3.12 3.13 2.15 (S) 2006 ................... (S) (S) (S) (S) (S) (S) (S) (S) (S) 2.47 3.35 (S) 2007 ................... (S) (S) (S) (S) (S) (S) 3.75 3.39 3.37 3.44 3.45 3.43 2008 ................... (S) (S) (S) (S) (S) (S) 5.49 (S) 5.43 5.00 5.21 (S) 2009 ................... (S) (S) (S) (S) (S) (S) (S) 5.32 4.51 5.38 5.22 5.15 2010 ................... (S) (S) (S) (S) (D) (D) 4.22 2.78 3.86 4.12 4.13 (D) 2011 ................... (D) 4.08 2.93 (D) (D) (D) (D) 5.25 (D) (D) 5.30 4.78 2012 ................... 5.22 5.27 5.28 (D) (D) 6.48 6.53 6.71 6.65 6.74 6.61 6.83 2013 ................... (S) (D) (D) (S) (S) (D) 6.52 (D) 6.26 (D) (D) (D)
All Wheat
Dollars Per Bushel
2004 ................... 3.68 3.61 3.74 3.79 3.69 3.51 3.31 3.06 3.19 3.17 3.36 3.31 2005 ................... 3.31 3.25 3.31 3.19 3.12 3.22 3.06 2.96 3.46 3.42 3.29 3.54 2006 ................... 3.48 3.76 3.82 4.10 4.26 4.20 4.32 4.20 4.28 4.82 4.74 4.51 2007 ................... 4.55 4.46 4.61 4.63 4.63 5.13 5.00 5.56 6.63 6.91 6.57 7.25 2008 ................... 7.39 8.82 8.79 8.06 7.38 7.63 7.31 7.50 6.64 5.88 6.51 6.27 2009 ................... 5.98 6.49 5.94 5.72 6.02 5.49 5.38 4.64 4.20 4.15 4.59 4.47 2010 ................... 4.57 4.29 4.37 4.05 3.98 3.75 4.34 5.44 5.67 5.83 5.83 6.18 2011 ................... 6.33 6.88 6.91 7.71 7.96 7.80 6.64 7.17 6.84 5.83 6.18 6.34 2012 ................... 6.48 6.44 6.40 6.02 5.97 6.65 7.68 7.91 8.26 8.24 8.31 7.73 2013 ................... 7.88 7.72 7.22 7.43 7.40 7.16 7.30 6.96 6.76 7.30 6.94 6.73
Corn for Grain
Dollars Per Bushel
2004 ................... 2.51 2.61 2.71 2.85 2.98 2.97 2.90 2.75 2.72 2.36 2.42 2.22 2005 ................... 2.22 2.03 2.21 2.11 2.16 2.17 2.28 2.22 2.21 2.28 2.19 2.11 2006 ................... 2.16 2.18 2.19 2.26 2.34 2.44 2.44 2.48 2.43 2.68 2.80 2.88 2007 ................... 3.13 3.27 3.20 3.15 3.43 3.56 3.48 3.54 3.61 3.43 3.51 3.60 2008 ................... 3.91 4.36 4.33 4.70 4.55 5.04 4.71 4.59 4.50 4.10 4.50 4.21 2009 ................... 4.37 3.97 3.86 3.87 3.97 4.02 3.74 3.62 3.51 3.82 3.79 3.69 2010 ................... 3.73 3.56 3.62 3.31 3.45 3.50 3.48 3.68 3.97 4.23 4.33 4.66 2011 ................... 4.77 5.36 5.21 6.05 6.55 6.57 6.60 7.06 6.61 5.78 5.85 6.09 2012 ................... 6.05 6.30 6.37 6.34 6.21 6.37 6.98 7.60 6.67 6.45 6.69 7.01 2013 ................... 6.86 7.26 7.21 7.00 6.98 7.30 7.06 6.80 6.07 5.02 4.71 4.58
Milk 1/
Dollars Per Cwt.
2006 ................... 14.20 14.00 12.90 12.00 12.00 12.00 11.90 12.20 13.20 13.90 14.20 14.30 2007 ................... 14.90 14.80 15.50 16.70 18.00 20.20 21.00 22.00 22.40 21.90 21.80 21.30 2008 ................... 20.30 19.30 17.80 18.50 18.00 18.80 19.80 18.90 18.50 17.80 17.10 15.90 2009 ................... 13.70 11.80 11.70 12.10 11.80 11.60 11.50 12.00 12.70 14.00 14.90 16.40 2010 ................... 16.20 15.90 15.00 14.70 15.20 15.60 15.90 16.60 17.70 18.50 18.20 16.80 2011 ................... 16.70 18.90 20.30 19.70 19.60 20.80 21.60 22.00 21.30 19.70 19.90 19.10 2012 ................... 19.30 18.10 17.50 17.10 16.50 16.20 16.80 18.10 19.50 21.20 22.20 21.40 2013 ................... 20.30 19.80 19.50 19.50 19.70 19.60 19.30 20.00 20.30 21.20 21.80 21.90
1/ Monthly milk price estimates for Colorado began 2005. (S) Insufficient number of reports to establish an estimate. (D) Withheld to avoid disclosing data for individual operations.

Colorado Agricultural Statistics 2014 33
+Prices Received: Monthly averages selected commodities, Colorado, 2004-2013
Year Jan. Feb. Mar. Apr. May June July Aug. Sep. Oct. Nov. Dec.
All Hay, Baled
Dollars Per Ton
2004 ................... 82.00 83.00 83.00 81.00 81.00 82.00 82.00 85.00 85.00 85.00 85.00 85.00 2005 ................... 84.00 85.00 85.00 83.00 77.00 87.00 98.00 105.00 106.00 104.00 100.00 100.00 2006 ................... 103.00 103.00 102.00 102.00 102.00 120.00 135.00 132.00 129.00 134.00 136.00 138.00 2007 ................... 137.00 138.00 139.00 139.00 140.00 135.00 135.00 139.00 139.00 134.00 138.00 138.00 2008 ................... 138.00 138.00 142.00 145.00 147.00 149.00 158.00 167.00 162.00 161.00 166.00 166.00 2009 ................... 166.00 166.00 161.00 159.00 158.00 154.00 140.00 134.00 133.00 133.00 128.00 128.00 2010 ................... 127.00 124.00 120.00 124.00 124.00 125.00 125.00 125.00 124.00 124.00 123.00 128.00 2011 ……………. 128.00 132.00 136.00 135.00 148.00 169.00 178.00 188.00 196.00 214.00 228.00 223.00 2012 ................... 232.00 237.00 243.00 242.00 247.00 233.00 233.00 233.00 232.00 233.00 234.00 244.00 2013 ................... 244.00 244.00 243.00 243.00 243.00 244.00 249.00 244.00 234.00 237.00 234.00 230.00
Alfalfa Hay, Baled
Dollars Per Ton
2004 ................... 83.00 84.00 84.00 81.00 82.00 82.00 83.00 86.00 86.00 86.00 86.00 86.00 2005 ................... 86.00 85.00 84.00 84.00 78.00 87.00 99.00 105.00 106.00 104.00 101.00 100.00 2006 ................... 103.00 103.00 102.00 102.00 102.00 120.00 135.00 133.00 130.00 135.00 138.00 140.00 2007 ................... 140.00 140.00 140.00 140.00 140.00 135.00 135.00 140.00 140.00 135.00 140.00 140.00 2008 ................... 140.00 140.00 145.00 147.00 150.00 150.00 160.00 170.00 165.00 165.00 170.00 170.00 2009 ................... 170.00 170.00 165.00 165.00 160.00 155.00 140.00 135.00 135.00 135.00 130.00 130.00 2010 ................... 130.00 125.00 120.00 125.00 125.00 125.00 125.00 125.00 125.00 125.00 125.00 130.00 2011 ……………. 130.00 135.00 140.00 140.00 150.00 170.00 180.00 190.00 200.00 220.00 235.00 230.00 2012 ................... 240.00 245.00 255.00 255.00 255.00 235.00 235.00 235.00 235.00 235.00 235.00 245.00 2013 ................... 245.00 245.00 245.00 245.00 245.00 245.00 250.00 245.00 235.00 238.00 235.00 230.00
All Other Hay, Baled
Dollars Per Ton
2004 ................... 73.00 70.00 79.00 78.00 74.00 74.00 75.00 80.00 80.00 80.00 81.00 81.00 2005 ................... 81.00 73.00 90.00 90.00 65.00 75.00 87.00 105.00 105.00 100.00 95.00 99.00 2006 ................... 99.00 101.00 97.00 98.00 98.00 115.00 130.00 125.00 123.00 124.00 124.00 125.00 2007 ................... 126.00 127.00 130.00 135.00 145.00 135.00 135.00 135.00 135.00 130.00 125.00 125.00 2008 ................... 125.00 125.00 125.00 130.00 130.00 130.00 135.00 145.00 135.00 130.00 125.00 130.00 2009 ................... 130.00 125.00 125.00 125.00 125.00 120.00 140.00 125.00 120.00 115.00 110.00 110.00 2010 ................... 110.00 115.00 120.00 120.00 115.00 120.00 120.00 115.00 110.00 105.00 105.00 105.00 2011 ……………. 105.00 105.00 115.00 115.00 125.00 145.00 155.00 170.00 160.00 160.00 160.00 160.00 2012 ................... 165.00 165.00 170.00 170.00 170.00 190.00 200.00 210.00 205.00 210.00 220.00 235.00 2013 ................... 235.00 235.00 230.00 230.00 225.00 230.00 235.00 230.00 230.00 229.00 230.00 230.00

34 Colorado Agricultural Statistics 2014
Prices Received: Monthly averages selected commodities, Colorado, 2004-2013
Year Jan. Feb. Mar. Apr. May June July Aug. Sep. Oct. Nov. Dec.
Dry Beans
Dollars Per Cwt
2004 ................... 18.20 16.30 17.70 18.20 18.80 19.60 19.80 20.70 26.10 25.90 28.70 30.20 2005 ................... 29.00 29.80 29.20 27.80 28.70 30.70 30.10 25.00 19.70 18.50 18.10 17.70 2006 ................... 19.30 17.60 18.10 18.40 18.40 17.30 20.00 19.90 19.60 19.70 20.50 20.70 2007 ................... 21.20 24.20 25.00 24.60 25.10 26.20 28.50 27.90 27.90 27.80 28.20 30.40 2008 ................... 30.80 32.20 35.40 36.70 36.90 33.00 36.80 35.70 38.30 35.90 40.30 36.80 2009 ................... 35.40 32.00 33.10 30.70 30.90 30.90 38.50 31.30 30.20 37.50 30.40 32.40 2010 ................... 31.30 33.00 31.50 31.30 31.60 29.90 30.30 22.80 24.00 23.70 24.50 22.50 2011 ................... 24.90 27.50 29.40 29.90 29.70 35.10 36.70 41.10 44.70 44.40 44.70 44.10 2012 ................... 48.20 50.30 50.50 50.70 51.80 (D) 54.00 47.10 41.70 45.40 38.50 36.70 2013 ................... 36.50 36.00 35.50 35.30 36.40 39.60 (D) (D) 39.60 50.40 (S) 38.90
All Potatoes
Dollars Per Cwt
2004 ................... 4.95 4.70 5.00 4.65 4.00 3.70 3.45 7.05 6.00 5.40 4.80 4.55 2005 ................... 4.65 4.30 4.50 4.65 4.25 4.10 4.70 7.65 10.10 9.00 8.10 8.30 2006 ................... 8.55 8.75 8.80 8.85 8.30 8.20 9.15 10.10 8.25 8.45 7.95 7.85 2007 ................... 7.90 8.25 8.10 7.75 7.85 7.60 7.25 9.45 7.65 7.45 7.75 8.35 2008 ................... 9.00 9.70 10.20 9.90 10.90 13.40 16.10 21.30 20.50 19.10 14.80 14.40 2009 ................... 13.20 10.60 10.40 9.65 8.05 7.70 7.45 9.90 7.45 6.40 6.25 6.30 2010 ................... 5.65 5.45 5.65 5.40 5.25 5.40 7.90 10.80 11.00 10.80 10.70 11.30 2011 ……..…….. 12.10 12.50 13.10 13.10 13.00 14.10 18.90 19.10 12.10 10.20 10.30 11.00 2012 ……..…….. 11.00 11.10 11.10 11.20 10.60 9.30 9.05 6.95 6.85 5.85 6.50 6.50 2013 ……..…….. 6.85 6.50 6.90 6.50 6.60 8.65 14.10 22.20 12.60 10.20 10.10 8.75
Sheep 1/
Dollars Per Cwt
2004 ................... 35.10 33.10 33.10 37.30 33.90 30.50 43.70 40.60 44.40 39.90 43.00 44.00 2005 ................... 46.60 43.50 40.40 36.80 38.40 37.20 37.90 41.70 42.20 42.40 43.60 44.40 2006 ................... 46.00 43.00 38.00 38.00 34.00 31.00 32.00 33.00 35.00 32.00 30.00 32.00 2007 ................... 32.00 34.00 34.00 34.00 32.00 30.00 31.00 32.00 31.00 29.00 28.00 30.00 2008 ................... 30.00 31.00 30.00 30.00 30.00 26.00 28.00 30.00 30.00 27.00 30.00 32.00 2009 ................... 31.00 34.00 36.00 37.00 31.00 30.00 31.00 33.00 30.00 29.00 34.00 40.00 2010 ................... 45.00 55.00 51.00 48.00 52.00 51.00 50.00 47.00 51.00 47.00 46.00 55.00
Lambs 1/
Dollars Per Cwt
2004 ................... 103.00 107.00 100.00 101.00 106.00 111.00 109.00 96.50 96.60 95.20 98.90 102.00 2005 ................... 114.00 115.00 116.00 120.00 115.00 117.00 117.00 111.00 109.00 109.00 105.00 102.00 2006 ................... 103.00 105.00 98.00 97.00 95.00 97.00 97.00 96.00 98.00 95.00 94.00 95.00 2007 ................... 94.00 96.00 94.00 97.00 100.00 98.00 98.00 96.00 95.00 95.00 95.00 100.00 2008 ................... 100.00 98.00 99.00 104.00 104.00 100.00 100.00 99.00 99.00 97.00 99.00 100.00 2009 ................... 100.00 100.00 100.00 98.00 100.00 103.00 103.00 100.00 98.00 96.00 95.00 100.00 2010 ................... 101.00 106.00 115.00 118.00 128.00 120.00 123.00 124.00 130.00 133.00 136.00 145.00
1/ Sheep and lamb discontinued beginning in 2011. (S) Insufficient number of reports to establish an estimate. (D) Withheld to avoid disclosing data for individual operations.

Colorado Agricultural Statistics 2014 35
Prices Received: Monthly averages selected commodities, Colorado, 2001-2010, 1/
Year Jan. Feb. Mar. Apr. May June July Aug. Sep. Oct. Nov. Dec.
Beef Cattle
Dollars Per Cwt
2001 ................... 79.00 77.20 79.40 77.30 74.70 76.40 72.20 70.90 69.70 67.00 64.00 66.60 2002 ................... 72.90 74.70 80.00 75.90 74.50 76.50 76.70 76.20 77.60 80.40 80.60 82.70 2003 ................... 81.50 78.50 76.50 79.50 84.70 83.00 88.70 92.30 96.30 99.50 101.00 101.00 2004 ................... 93.60 89.50 91.50 94.80 104.00 107.00 112.00 114.00 110.00 110.00 109.00 105.00 2005 ................... 107.00 105.00 109.00 111.00 110.00 108.00 107.00 107.00 111.00 115.00 118.00 118.00 2006 ................... 118.00 114.00 105.00 101.00 100.00 103.00 111.00 111.00 115.00 108.00 100.00 98.30 2007 ................... 94.10 95.90 103.00 106.00 104.00 100.00 99.10 102.00 108.00 107.00 105.00 105.00 2008 ................... 98.90 100.00 100.00 97.60 103.00 102.00 102.00 103.00 103.00 94.10 93.10 86.40 2009 ................... 89.10 88.60 89.10 95.30 95.10 91.10 89.20 89.70 90.10 89.10 89.10 86.20 2010 ................... 91.70 95.20 101.00 107.00 103.00 99.20 100.00 102.00 104.00 105.00 110.00 115.00
Cows
Dollars Per Cwt
2001 ................... 39.90 44.80 43.70 45.20 47.10 47.10 46.80 47.40 45.10 40.60 38.20 38.00 2002 ................... 39.60 41.90 43.50 40.90 40.00 40.00 35.90 37.70 36.30 32.40 33.10 34.40 2003 ................... 39.40 41.10 40.50 41.00 43.70 44.90 47.50 47.80 49.10 48.50 51.70 51.80 2004 ................... 45.40 46.70 46.40 51.70 54.10 57.00 61.00 56.20 56.10 51.00 49.60 49.00 2005 ................... 52.30 56.10 57.80 57.80 59.60 56.10 52.60 51.40 52.40 49.50 48.20 46.80 2006 ................... 48.70 52.40 51.00 49.70 48.20 48.40 46.70 47.80 49.80 47.70 43.60 43.40 2007 ................... 45.90 48.50 47.80 51.00 53.20 51.70 54.20 54.00 52.70 48.90 43.30 45.20 2008 ................... 46.90 52.50 53.90 52.20 55.80 55.60 56.80 58.80 55.20 47.50 42.30 40.50 2009 ................... 43.50 45.50 46.20 50.50 51.00 49.00 50.00 48.00 47.00 45.00 43.50 45.60 2010 ................... 48.50 54.20 56.00 61.00 63.50 62.00 64.00 63.00 61.50 57.10 56.40 61.50
Steers and Heifers
Dollars Per Cwt
2001 ................... 82.40 79.60 81.70 79.30 76.80 77.90 73.30 71.90 70.50 68.40 66.90 69.10 2002 ................... 73.20 75.00 80.40 76.20 74.80 76.90 77.10 76.60 78.00 80.90 81.10 83.20 2003 ................... 81.90 78.90 76.90 79.90 85.10 83.40 89.10 92.80 96.80 100.00 101.00 101.00 2004 ................... 94.10 89.90 92.00 95.20 104.00 108.00 113.00 115.00 111.00 111.00 110.00 106.00 2005 ................... 108.00 105.00 110.00 112.00 111.00 109.00 108.00 108.00 112.00 116.00 119.00 119.00 2006 ................... 119.00 115.00 106.00 102.00 101.00 104.00 112.00 112.00 116.00 109.00 101.00 98.90 2007 ................... 95.10 96.90 104.00 107.00 105.00 101.00 100.00 103.00 109.00 108.00 106.00 106.00 2008 ................... 100.00 101.00 101.00 98.50 104.00 103.00 103.00 104.00 104.00 95.00 94.10 87.30 2009 ................... 90.00 89.50 90.00 96.20 96.00 92.00 90.00 90.50 91.00 90.00 90.00 87.00 2010 ................... 92.60 96.00 102.00 108.00 104.00 100.00 101.00 103.00 105.00 106.00 111.00 116.00
Calves
Dollars Per Cwt
2001 ................... 109.00 110.00 112.00 111.00 111.00 107.00 104.00 103.00 94.70 88.20 86.30 92.00 2002 ................... 94.40 98.40 95.70 93.30 89.00 90.00 91.80 91.90 90.10 87.90 87.30 92.30 2003 ................... 92.00 90.30 91.60 96.80 101.00 104.00 107.00 109.00 112.00 114.00 113.00 118.00 2004 ................... 114.00 115.00 117.00 117.00 121.00 130.00 145.00 139.00 135.00 128.00 127.00 126.00 2005 ................... 128.00 131.00 135.00 139.00 141.00 144.00 136.00 135.00 133.00 133.00 137.00 137.00 2006 ................... 144.00 141.00 132.00 130.00 120.00 131.00 144.00 141.00 132.00 124.00 112.00 112.00 2007 ................... 110.00 110.00 127.00 124.00 121.00 121.00 122.00 122.00 120.00 118.00 116.00 117.00 2008 ................... 116.00 117.00 117.00 114.00 115.00 114.00 109.00 111.00 103.00 102.00 102.00 98.50 2009 ................... 105.00 105.00 105.00 108.00 113.00 112.00 113.00 114.00 106.00 100.00 101.00 106.00 2010 ................... 114.00 115.00 119.00 128.00 127.00 126.00 126.00 128.00 117.00 120.00 128.00 139.00
1/Discontinued as of 2010

36 Colorado Agricultural Statistics 2014
Livestock: Inventory by class, Colorado, January 1, 2007-2014
Class 2007 2008 2009 2010 2011 2012 2013 2014
Thousands
All cattle and calves .......................................... 2,700 2,750 2,600 2,600 2,650 2,750 2,600 2,480
All cows & heifers that have calved .................. 840 850 850 830 850 890 850 840
Beef cows & heifers ..................................... 725 724 720 714 727 759 715 700
Milk cows & heifers ..................................... 115 126 130 116 123 131 135 140
Heifers 500 lbs & over ..................................... 735 790 710 690 705 740 735 710
For beef cow replacement .......................... 115 130 120 120 120 155 130 140
For milk cow replacement ........................... 60 70 60 70 75 75 85 100
Other heifers ................................................ 560 590 530 500 510 510 520 470
Steers 500 lbs & over ...................................... 930 890 770 860 910 930 840 760
Bulls 500 lbs & over ........................................ 45 50 50 45 50 50 45 45
Steers, heifers, & bulls under 500 lbs .............. 150 170 220 175 135 140 130 125
Cattle on feed 1/ .................................................. 1,130 1,140 1,020 1,020 1,100 1,170 1,030 990
Calf crop, annual ................................................. 790 780 780 780 800 760 740 ---
All sheep and lambs .......................................... 400 420 410 370 370 460 435 365
Breeding sheep & lambs .................................. 200 210 205 185 175 190 195 170
Ewes one year old & older ........................... 162 170 166 150 142 154 162 142
Rams one year old & older .......................... 6 6 6 5 5 5 6 5
Replacement lambs ..................................... 32 34 34 30 28 31 27 23
Market sheep & lambs ..................................... 200 210 205 185 195 270 240 195
Sheep .......................................................... 2 2 2 1 2 1 5 5
Lambs ......................................................... 198 208 203 184 193 269 235 193
Under 65 lbs ............................................ 1 4 3 2 2 3 2 3
65-84 lbs .................................................. 20 22 10 7 10 14 11 12
85-105 lbs ................................................ 37 41 25 17 42 85 24 60
Over 105 lbs ............................................
140 141 165 158 139 167 198 118
Lamb crop, annual ............................................... 210 210 180 170 190 175 175 ---
All hogs and pigs 2/ ........................................... 860 730 710 730 720 720 690 ---
Breeding .......................................................... 160 150 150 150 150 145 150 ---
Market .......................................................... 700 580 560 580 570 575 540 ---
Under 50 lbs 4/ ........................................ 360 285 270 275 265 270 260 ---
50-119 lbs 4/ ............................................ 90 100 115 105 105 85 95 ---
120-179 lbs .............................................. 90 70 50 70 65 85 75 ---
180 lbs & over .......................................... 160 125 125 130 135 135 110 ---
Sows farrowed, annual .......................................... 329 312 288 287 286 273 283 ---
Pig crop, annual 2/ .............................................. 2,952 2,778 2,633 2,810 2,811 2,688 2,689 ---
All goats 3/ ....................................................... (D) (D) (D) (D) (D) (D) (D) (D)
Angora goats ................................................ 1.2 1.4 1.0 (D) 1.0 1.0 (D) (D)
Milk goats ..................................................... 8.0 8.0 8.3 8.4 8.2 11.0 12.2 9
Meat and other goats .................................... 35 39 34 38 35 39 32 30
All chickens 2/ ................................................. 4,887 4,711 4,669 4,752 5,641 5,126 --- ---
Total layers ................................................... 3,875 3,872 3,820 3,681 4,684 4,171 5,030 ---
Total pullets .................................................. 943 774 784 1,018 884 906 912 ---
Other chickens ............................................. 69 65 65 53 73 49 52 ---
1/ Included in other classes. 2/ December 1. 3/ Estimates began in 2005. 4/ Prior to 2008 market hogs and pigs categories were under 60lbs. and 60-119 lbs. (D) Withheld to avoid disclosure

Colorado Agricultural Statistics 2014 37
Hogs and Pigs: Inventory by class, Colorado, December 1, 2004-2013
Total
Inventory
Inventory Value Inventory by class
Year
Market
Per Head
Total Value
Breeding
Total Market
Under 50 Pounds 1/
50-119 Pounds 1/
120-179 pounds
180 lbs & over
1,000 Head Dollars 1,000 Dollars 1,000 Head 1,000 Head 1,000 Head 1,000 Head 1,000 Head 1,000 Head
2004 ........... 800 96.00 76,800 140 660 355 100 75 130
2005 ........... 850 85.00 72,250 145 705 390 95 85 135
2006 ........... 840 81.00 68,040 155 685 380 80 85 140
2007 ........... 860 76.00 65,360 160 700 360 90 90 160
2008 ........... 730 90.00 65,700 150 580 285 100 70 125
2009 ........... 710 88.00 62,480 150 560 270 115 50 125
2010 ........... 730 100.00 73,000 150 580 275 105 70 130
2011 ........... 720 120.00 86,400 150 570 265 105 65 135
2012 ........... 720 110.00 79,200 145 575 270 85 85 135
2013 ........... 690 130.00 89,700 150 540 260 95 75 110
1/ Prior to 2008, market hogs and pigs categories were under 60 lbs. and 60-119 lbs.
Sheep and Lambs: Total inventory and value and inventory by class, Colorado, January 1, 2004-2014
Year
Total Inventory
Inventory Value Inventory by class
Per Head
Total Value
Market sheep and
lambs
Breeding sheep and lambs
Total
Replacement lambs
Ewes 1 year old & older
Rams 1 year old & older
1,000 Head Dollars $1,000 Dollars 1,000 Head 1,000 Head 1,000 Head 1,000 Head 1,000 Head
2004 ........... 360 117.00 42,120 180 180 26 149 5
2005 ........... 365 127.00 46,355 185 180 30 145 5
2006 ........... 390 137.00 53,430 190 200 36 158 6
2007 ........... 400 125.00 50,000 200 200 32 162 6
2008 ........... 420 143.00 60,060 210 210 34 170 6
2009 ........... 410 128.00 52,480 205 205 32 167 6
2010 ........... 370 133.00 49,210 185 185 30 150 5
2011 ........... 370 163.00 60,310 195 175 28 142 5
2012 ........... 460 226.00 130,960 270 190 31 154 5
2013 ........... 435 159.00 69,165 240 195 27 162 6
2014 ........... 365 197.00 71,905 195 170 23 142 5
Wool: Production and value, Colorado, 2004-2013 1/
Year
All sheep shorn
Weight per fleece
Production
Price per pound
Total value
1,000 Head Pounds 1,000 Pounds Dollars 1,000 Dollars
2004 ................................. 390 6.6 2,570 .85 2,185
2005 ................................. 420 6.3 2,650 .63 1,670
2006 ................................. 380 6.8 2,600 .75 1,950
2007 ................................. 400 6.8 2,700 1.00 2,700
2008 ................................. 380 6.8 2,600 1.12 2,912
2009 ................................. 300 7.3 2,200 .82 1,804
2010 ................................. 345 7.2 2,500 1.49 3,725
2011 ................................. 370 7.0 2,600 2.15 5,590
2012 ................................. 305 6.9 2,100 2.00 4,200
2013 ................................. 310 6.8 2,100 1.90 3,990
1/ Includes wool shorn from stock sheep and from sheep and lambs on feed.

38 Colorado Agricultural Statistics 2014
Goats: Total inventory by class, Colorado, January 1, 2009-2014
Year Total Inventory Inventory by Class
Angora
Milk
Meat
Number 2009 ................... (D) 1,000 8,300 34,000 2010 ................... (D) (D) 8,400 38,000 2011 ................... (D) 1,000 8,200 35,000 2012 ……………. (D) 1,000 11,000 39,000 2013 ……………. (D) (D) 12,200 32,000 2014 ……………. (D) (D) 9,000 30,000
(D) Withheld to avoid disclosing data for individual operations.
Bees and Honey: Colorado, 2004-2013
Year
Number of Colonies
Yield per Colony
Production
Producer Stocks
Avg. Price Per Pound
Value of Production
1,000 Pounds 1,000 Pounds Dollars 1,000 Dollars
2004 ................. 23 80 1,840 791 1.35 2,484
2005 ................. 28 70 1,960 902 0.97 1,901
2006 ................. 36 75 2,700 1,458 1.04 2,808
2007 ................. 31 51 1,581 838 1.15 1,818
2008 ................. 27 45 1,215 656 1.51 1,835
2009 ................. 28 53 1,484 326 1.43 2,122
2010 ................. 34 56 1,904 533 1.52 2,894
2011 ………….. 31 55 1,705 443 2.00 3,410
2012 ………….. 25 48 1,200 468 2.07 2,484
2013 ………….. 26 43 1,118 324 2.10 2,348
Trout: Operations, sales and value, Colorado, 2011-2013
Item Unit
2011 2012 2013
Trout Sales
Distributed Trout
Trout Sales
Distributed Trout
Trout Sales
Distributed Trout
N Number of Operations…………… Number 4/ 4/ 4/ 4/ 4/ 4/ V Value of Sales/Distributed Trout… 1,000 Dollars 1,844 5,018 1,718 6,546 1,669 7,522 Foodsize: 1/ Number Sold….……….…..….. Thousands 260 35 220 85 175 130 Pounds Sold……………….….. Thousands 410 63 393 120 348 191 Value Per Pound……………… Dollars 4.08 3.46 3.75 3.52 3.75 3.90 Total Value of Sales………..… 1,000 Dollars 1,673 218 1,474 422 1,305 745 Stockers: 2/ Number Sold….......….………. Thousands 4/ 4,030 4/ 3,350 190 4,170 Pounds Sold……………….….. Thousands 4/ 1,510 4/ 1,310 92 1,530 Value Per Pound……………… Dollars 4/ 2.79 4/ 4.26 3.69 4.13 Total Value of Sales…..……… 1,000 Dollars 4/ 4,213 4/ 5,581 339 6,319 Fingerlings: 3/ Number Sold………….………. Thousands 4/ 16,300 4/ 16,100 55 14,600 Pounds Sold……………….….. Thousands 4/ 145 4/ 132 2 117 Value Per 1,000 Fish…….…… Dollars 4/ 36 4/ 34 451 33 Total Value of Sales……..…… 1,000 Dollars 4/ 587 4/ 543 25 488
1/ Defined as fish being 12 inches or longer. 2/ Defined as fish being from 6-12 inches in length. 3/ Defined as fish being from 1-6 inches in length. 4/ Not published separately to avoid disclosure of individual operations.

Colorado Agricultural Statistics 2014 39
Cattle and Calves: Number on feed, placements, marketings and other disappearance, 1,000 + capacity feedlots, by month, Colorado, 2004-2014 1/
Month
Year
2004 2005 2006 2007 2008 2009 2010 2011 2012 2013 2014
1,000 Head
January
Number on feed, January 1 ........................ 1,040 1,080 1,080 1,100 1,100 1,000 1,010 1,080 1,150 1,000 960
Placed on feed during January ................... 165 175 225 155 180 200 130 185 190 190 190
Marketed during January ............................ 160 185 185 200 185 170 170 190 190 175 170
Other disappearance during January .......... 5 10 10 15 5 10 10 5 10 5 10
February
Number on feed, February 1 ....................... 1,040 1,060 1,110 1,040 1,090 1,020 960 1,070 1,140 1,010 970
Placed on feed during February .................. 155 175 140 140 155 190 160 215 165 155 135
Marketed during February .......................... 165 185 155 160 190 165 175 210 200 165 155
Other disappearance during February ........ 10 10 5 10 5 5 5 5 15 10 10
March
Number on feed, March 1 ........................... 1,020 1,040 1,090 1,010 1,050 1,040 940 1,070 1,090 990 940
Placed on feed during March ...................... 150 165 155 160 135 165 185 215 160 165 165
Marketed during March ............................... 190 175 165 140 160 155 190 190 175 165 130
Other disappearance during March............. 10 10 10 10 5 10 5 5 5 10 5
April
Number on feed, April 1 .............................. 970 1,020 1,070 1,020 1,020 1,040 930 1,090 1,070 980 970
Placed on feed during April ......................... 150 120 130 150 115 150 170 165 120 140 130
Marketed during April ................................. 170 150 130 130 165 165 145 150 150 150 130
Other disappearance during April ............... 10 20 10 20 20 15 15 5 10 10 10
May
Number on feed, May 1 .............................. 940 970 1,060 1,020 950 1,010 940 1,100 1,030 960 960
Placed on feed during May ......................... 270 165 165 175 150 140 185 140 180 170 140
Marketed during May .................................. 185 150 175 155 170 145 135 150 170 150 145
Other disappearance during May ................ 15 15 20 20 10 25 20 10 20 20 25
June
Number on feed, June 1 ............................. 1,010 970 1,030 1,020 920 980 970 1,080 1,020 960 930
Placed on feed during June ........................ 145 130 170 120 85 125 125 105 125 115 95
Marketed during June ................................. 205 190 210 190 175 190 170 175 170 145 150
Other disappearance during June ............... 10 10 10 10 10 5 5 10 5 10 5
July
Number on feed, July 1 .............................. 940 900 980 940 820 910 920 1,000 970 920 870
Placed on feed during July ......................... 145 125 145 115 110 125 140 170 155 120 90
Marketed during July .................................. 200 200 175 175 175 180 165 195 180 165 145
Other disappearance during July ................ 5 5 10 10 5 5 5 5 5 5 5
August
Number on feed, August 1 .......................... 880 820 940 870 750 850 890 970 940 870 810
Placed on feed during August ..................... 205 155 200 170 190 205 190 230 190 145 145
Marketed during August ............................. 150 200 175 185 165 190 185 205 195 180 150
Other disappearance during August ........... 5 5 5 5 5 5 5 5 5 5 5
September
Number on feed, September 1.................... 930 770 960 850 770 860 890 990 930 830 800
Placed on feed during September .............. 265 280 240 260 255 260 295 275 225 190
Marketed during September ....................... 170 145 135 160 150 155 180 185 150 145
Other disappearance during September ..... 5 5 5 5 5 5 5 10 5 5
October
Number on feed, October 1 ........................ 1,020 900 1,060 940 870 960 1,000 1,070 1,000 870
Placed on feed during October ................... 260 285 215 260 245 245 270 230 195 230
Marketed during October ............................ 185 150 135 165 150 160 170 155 160 145
Other disappearance during October .......... 5 5 10 5 5 5 10 5 5 5
November
Number on feed, November 1..................... 1,090 1,030 1,130 1,030 960 1,040 1,090 1,140 1,030 950
Placed on feed during November ............... 175 165 145 190 185 165 155 175 150 165
Marketed during November ........................ 155 115 145 145 130 140 150 145 155 140
Other disappearance during November ...... 10 10 10 5 5 5 5 10 5 5
December
Number on feed, December 1..................... 1,100 1,070 1,120 1,070 1,010 1,060 1,090 1,160 1,020 970
Placed on feed during December ............... 135 155 135 170 150 110 160 160 140 150
Marketed during December ........................ 145 140 150 135 155 155 165 160 155 150
Other disappearance during December ...... 10 5 5 5 5 5 5 10 5 10
1/ “Other disappearance” includes death losses, movement from feedlots to pastures, and shipments to other feedlots for further feeding.
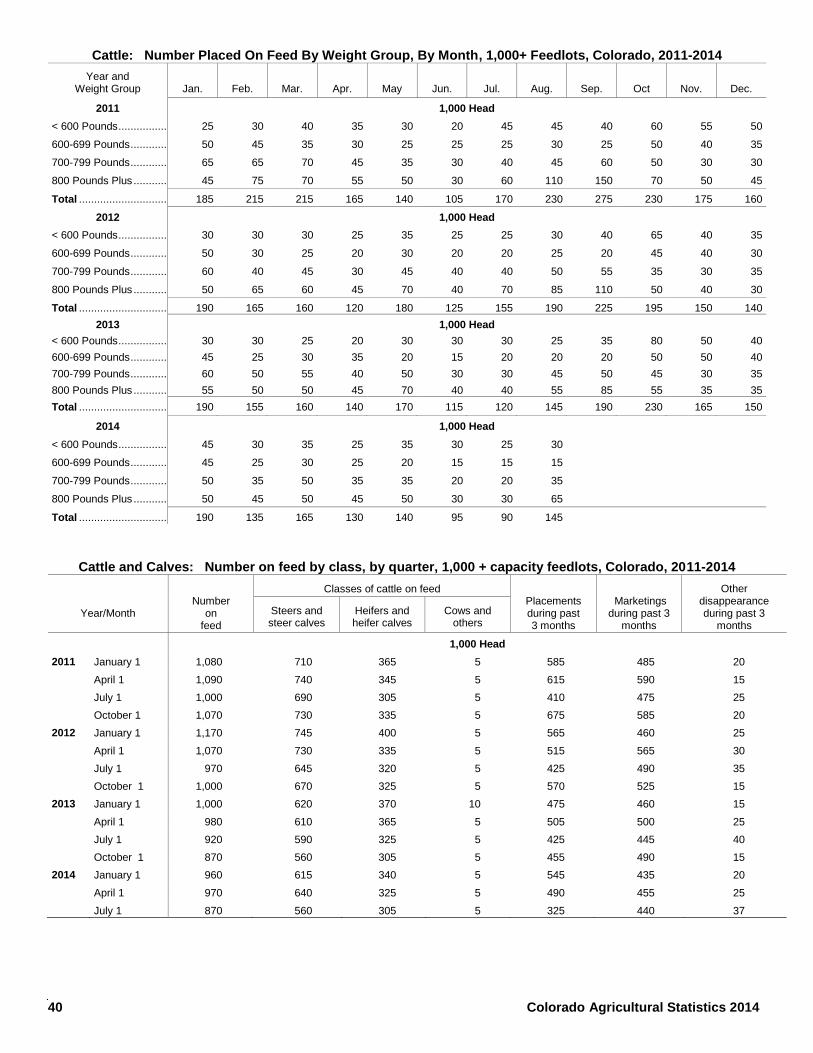
40 Colorado Agricultural Statistics 2014
Cattle: Number Placed On Feed By Weight Group, By Month, 1,000+ Feedlots, Colorado, 2011-2014
Year and Weight Group
Jan.
Feb.
Mar.
Apr.
May
Jun.
Jul.
Aug.
Sep.
Oct
Nov.
Dec.
2011 1,000 Head
< 600 Pounds ................ 25 30 40 35 30 20 45 45 40 60 55 50
600-699 Pounds ............ 50 45 35 30 25 25 25 30 25 50 40 35
700-799 Pounds ............ 65 65 70 45 35 30 40 45 60 50 30 30
0 800 Pounds Plus ........... 45 75 70 55 50 30 60 110 150 70 50 45
Total ............................. 185 215 215 165 140 105 170 230 275 230 175 160
2012 1,000 Head
< 600 Pounds ................ 30 30 30 25 35 25 25 30 40 65 40 35
600-699 Pounds ............ 50 30 25 20 30 20 20 25 20 45 40 30
700-799 Pounds ............ 60 40 45 30 45 40 40 50 55 35 30 35
800 Pounds Plus ........... 50 65 60 45 70 40 70 85 110 50 40 30
Total ............................. 190 165 160 120 180 125 155 190 225 195 150 140
2013 1,000 Head
< 600 Pounds ................ 30 30 25 20 30 30 30 25 35 80 50 40
600-699 Pounds ............ 45 25 30 35 20 15 20 20 20 50 50 40
700-799 Pounds ............ 60 50 55 40 50 30 30 45 50 45 30 35
800 Pounds Plus ........... 55 50 50 45 70 40 40 55 85 55 35 35
Total ............................. 190 155 160 140 170 115 120 145 190 230 165 150
Cattle and Calves: Number on feed by class, by quarter, 1,000 + capacity feedlots, Colorado, 2011-2014
Year/Month
Number
on feed
Classes of cattle on feed Placements during past 3 months
Marketings
during past 3 months
Other disappearance during past 3
months
Steers and steer calves
Heifers and heifer calves
Cows and others
1,000 Head
2011 January 1 1,080 710 365 5 585 485 20
April 1 1,090 740 345 5 615 590 15
July 1 1,000 690 305 5 410 475 25
October 1 1,070 730 335 5 675 585 20
2012 January 1 1,170 745 400 5 565 460 25
April 1 1,070 730 335 5 515 565 30
July 1 970 645 320 5 425 490 35
October 1 1,000 670 325 5 570 525 15
2013 January 1 1,000 620 370 10 475 460 15
April 1 980 610 365 5 505 500 25
July 1 920 590 325 5 425 445 40
October 1 870 560 305 5 455 490 15
2014 January 1 960 615 340 5 545 435 20
April 1 970 640 325 5 490 455 25
July 1 870 560 305 5 325 440 37
2014 1,000 Head
< 600 Pounds ................ 45 30 35 25 35 30 25 30
600-699 Pounds ............ 45 25 30 25 20 15 15 15
700-799 Pounds ............ 50 35 50 35 35 20 20 35
800 Pounds Plus ........... 50 45 50 45 50 30 30 65
Total ............................. 190 135 165 130 140 95 90 145

Colorado Agricultural Statistics 2014 41
Livestock: Production, Disposition and Value Cattle and Calves: Production, Disposition and Value, Colorado, 2004-2013
Year
Calf crop
Inshipments
Marketings 1/ Farm
slaughter
Deaths
Production
Marketings
2/
Cash
receipts
Value of home
consumption Cattle Calves Cattle Calves
1,000 Head 1,000 Head 1,000 Head 1,000 Pounds 1,000 Dollars
2004 ......... 720 2,130 2,443 95.0 2.0 55 55 1,854,785 3,057,400 3,188,056 11,684
2005 ......... 760 1,810 2,213 100.0 2.0 50 55 1,796,815 2,842,890 3,137,579 10,093
2006 ......... 780 1,790 2,303 100.0 2.0 60 55 1,921,464 3,029,100 3,251,027 9,538
2007 ......... 790 1,850 2,338 100.0 2.0 80 70 1,898,352 3,075,600 3,174,908 9,324
2008 ......... 780 1,615 2,328 100.0 2.0 60 55 1,782.971 2,998,856 2,970,753 7,927
2009 ......... 780 1,647 2,215 100.0 2.0 55 55 1,816,730 2,896,810 2,617,411 7,161
2010 ......... 780 1,623 2,140 100.0 3.0 55 55 1,724,746 2,771,800 2,863,144 9,030
2011……..
2012 .........
800
760
1,550
1,500
2,031
2,197
101.5
101.0
2.5
2.5
65
60
50
50
1,677,345
1,764,583
2,651,540
2,916,535
3,061,811
3,577,933
10,480
14,601
2013 ......... 740 1,565 2,205 102.0 2.5 60 55 1,757,016 2,932,315 3,717,137 11,952
1/ Includes custom slaughter for use on farms where produced, but excludes inter-farm sales within the state. 2/ Live weight. Excludes custom slaughter for use on farms where produced and inter-farm sales within the state.
Sheep and Lambs: Production, Disposition and Value, Colorado, 2004-2013*
Year
Lamb crop
Inshipments
Marketings 1/ Farm
slaughter
Deaths
Production
Marketings
2/
Cash
receipts
Value of home
consumption Sheep Lambs Sheep Lambs
1,000 Head 1,000 Head 1,000 Head 1,000 Pounds 1,000 Dollars
2004 ......... 200 645 55.0 759 2.0 5 19 71,578 117,205 113,908 240
2005 ......... 225 665 48.0 789 2.0 6 20 76,131 120,645 130,692 275
2006 ......... 215 710 49.0 835 2.0 9 20 78,418 127,690 119,725 246
2007 ......... 210 726 49.0 835 2.0 11 19 73,728 123,270 114,439 248
2008 ......... 210 639 51.5 776 2.5 12 17 73,010 119,473 114,213 272
2009 ......... 180 526 62.5 655 2.5 9 17 69,532 111,490 105,270 268
2010……..
2011……..
2012 .........
170
190
175
479 46.5 576 2.5 9 15 60,300 94,517 111,073 342
2013 ......... 175
1/ Includes custom slaughter for use on farms where produced, but excludes inter-farm sales within the state. 2/ Live weight. Excludes custom slaughter for use on farms where produced and inter-farm sales within the state. *Discontinued in 2011
Hogs and Pigs: Production, Disposition and Value, Colorado, 2004-2013
Year
Pig crop (pigs saved) Inshipments
Marketings
1/
Farm
slaughter
Deaths
Production
Marketings
2/
Cash
receipts
Value of home
consumption Spring Fall Total
1,000 Head 1,000 Head 1,000 Head 1,000 Pounds 1,000 Dollars
2004 ........... 1,189 1,205 2,394 195 2,437.0 1.0 101 377,834 388,875 207,243 267
2005 ........... 1,319 1,426 2,745 215 2,814.0 1.0 95 315,655 324,595 185,659 285
2006 ........... 1,434 1,477 2,911 188 3,020.0 1.0 88 335,987 342,760 180,686 251
2007 ........... 1,442 1,510 2,952 149 2,967.0 1.0 113 365,132 366,930 200,591 247
2008 ........... 1,477 1,301 2,778 111 2,883.0 1.0 135 281,303 304,329 174,640 249
2009 ........... 1,293 1,340 2,633 108 2,673.0 1.0 87 265,861 277,944 136,458 220
2010 ........... 1,395 1,415 2,810 60 2,763.0 1.0 86 297,691 299,160 193,841 288
2011……….
2012 ...........
1,399
1,384
1,412
1,304
2,811
2,688
140
220
2,867.5
2,818.0
1.5
1.0
92
89
300,949
278,891
306,745
288,304
236,355
218,444
507
504
2013 ........... 1,342 1,328 2,670 160 2,750.0 1.0 109 258,047 272,197 217,819 349
1/ Includes custom slaughter for use on farms where produced, but excludes inter-farm sales within the state. 2/ Live weight. Excludes custom slaughter for use on farms where produced and inter-farm sales within the state.

42 Colorado Agricultural Statistics 2014
Livestock slaughter by species, Colorado, 2006-2013 1/
Year
Cattle Hogs
Number
slaughtered
Total
live weight
Average
live weight
Number
slaughtered
Total
live weight
Average
live weight
Head 1,000 Pounds Pounds Head 1,000 Pounds Pounds
2006 ......................... 2,116,200 2,753,082 1,302 12,400 3,193 259
2007 ......................... 2,209,800 2,861,668 1,296 10,100 2,580 255
2008 ......................... 2,509,200 3,271,616 1,305 10,300 2,610 254
2009 ......................... 2,356,900 3,119,244 1,324 10,100 2,599 257
2010 ......................... 2,507,300 3,268,633 1,304 9,200 2,350 255
2011 ......................... 2,499,700 3,277,812 1,312 9,800 2,481 252
2012 ......................... 2,500,600 3,346,708 1,339 15,000 3,429 228
2013 ......................... 2,574,300 3,456,587 1,344 17,300 3,829 222
Sheep and Lambs Goats 2/
2006 ......................... 1,053,600 160,272 152 5,932
2007 ......................... 1,047,200 159,279 152 7,294
2008 ......................... 955,200 149,115 156 8,420
2009 ......................... 917,800 145,350 159 8,719
2010 ......................... 899,900 138,978 155 7,986
2011 ......................... 952,900 152,077 160 5,671
2012 ......................... 960,400 165,554 173 8,556
2013 ......................... 935,800 148,212 159 6,879
1/ Excludes farm slaughter.
2/ Federally inspected only.
Livestock slaughter by species, by month, Colorado, 2006-2013 1/
Year Jan. Feb. Mar. Apr. May June July Aug. Sep. Oct. Nov. Dec.
1,000 Head
Cattle
2006 ......... 168.8 157.1 173.1 170.8 206.9 213.5 195.3 195.1 151.7 173.2 171.3 139.2
2007 ......... 171.8 165.3 169.3 162.4 195.4 210.0 190.4 194.5 181.0 210.9 186.9 171.8
2008 ......... 208.3 201.5 196.5 217.6 242.4 236.0 232.5 209.0 205.2 201.1 171.5 187.4
2009 ......................... 192.4 185.9 189.6 199.5 197.2 211.6 209.7 202.4 195.9 205.3 174.9 192.4
2010 ......... 204.3 195.7 225.6 205.4 201.5 233.7 213.3 215.5 209.6 198.5 195.8 208.4
2011 ......................... 193.4 196.6 223.7 189.3 205.8 236.3 211.0 233.8 211.1 201.9 194.6 202.3
2012 ......... 201.2 195.8 209.6 196.6 215.2 220.3 215.2 231.7 187.8 221.9 219.4 186.1
2013 ......... 217.5 195.4 201.6 207.8 223.4 227.1 238.5 232.0 206.2 228.1 189.9 206.6
Sheep and Lambs
2006 ......... 82.3 80.0 101.9 91.7 91.2 86.3 81.0 87.1 82.1 93.4 91.4 85.3 2007 ......... 86.9 87.7 122.4 83.4 89.2 79.9 71.5 79.8 74.6 93.5 95.9 82.5 2008 ......... 84.5 90.2 89.7 82.3 85.9 68.7 68.3 65.4 75.5 87.5 75.0 82.2 2009 ......... 77.3 73.9 92.7 83.8 70.1 63.6 67.5 64.8 80.2 79.9 79.4 84.5 2010 ......... 71.4 71.9 103.9 72.5 67.1 65.0 62.9 64.7 70.7 74.4 85.4 89.9
2011 ......................... 61.0 67.6 92.7 86.3 77.4 73.3 69.2 83.9 84.3 83.1 88.5 85.7 2012 ......... 79.1 82.9 92.1 75.5 77.8 73.6 76.1 84.3 75.0 85.9 77.5 80.7 2013 ......... 73 70.6 85.8 73.3 78.9 72.8 81.5 83.5 73.1 80.3 78.9 84.0
Hogs
2006 ......... 1.0 0.9 1.0 0.9 1.0 0.9 1.0 2.0 1.2 1.1 0.8 0.7
2007 ......... 0.8 0.8 0.9 0.6 0.7 0.6 0.9 1.5 1.0 1.0 0.8 0.5
2008 ......... 0.8 0.7 0.7 0.6 0.6 0.6 6
0.9 1.7 1.1 1.0 0.8 0.7
2009 ......... 0.7 0.6 0.6 0.7 0.6 0.8 0.8 1.7 1.3 0.8 0.8 0.6
2010 ......... 0.7 0.7 0.7 0.6 0.6 0.5 0.7 1.7 1.0 0.8 0.7 0.6
2011……....
0.6 0.6 0.8 0.6 0.7 0.5 0.5 1.8 1.0 1.1 0.9 0.8
2012……....
1.0 0.8 0.8 0.9 1.1 0.9 1.3 2.3 1.5 1.6 1.4 1.4
2013……....
1.2 1.1 1.1 1.2 1.4 1.2 1.6 2.3 1.6 1.7 1.4 1.5
1/ Excludes farm slaughter.

Colorado Agricultural Statistics 2014 43
All Cattle and Calves: Inventory by county, Colorado, 2009-2013
County 2009 2010 2011 2012 2013
Number Number Number Number Number
Chaffee ............................ 7,500 7,500 7,700 7,900 7,500
Eagle ................................ 5,900 5,900 6,000 6,200 5,800
Grand ............................... 13,100 13,200 13,400 13,900 13,000
Gunnison .......................... 14,600 14,600 14,800 15,400 15,000
Jackson ............................ 32,000 32,000 32,500 34,000 33,000
Lake ................................. 500 500 500 500 500
Moffat ............................... 24,500 24,500 25,000 26,000 24,500
Park .................................. 8,200 8,200 8,400 8,700 8,200
Pitkin ................................. 2,400 2,400 2,500 2,500 2,400
Rio Blanco ........................ 22,500 22,500 23,000 23,500 22,500
Routt ................................ 21,000 21,500 21,500 22,500 21,000
Summit ............................. 1,700 1,700 1,700 1,800 1,600
Teller ................................ 2,200 2,200 2,200 2,300 2,100
NW & Mountain ... ... ... ... ...
Boulder ............................. 10,200 10,200 10,400 10,800 10,000
Broomfield ........................ 300 300 300 300 300
Jefferson .......................... 2,300 2,300 2,400 2,400 2,400
Larimer ............................. 49,000 48,500 49,000 51,000 48,000
Logan ............................... 185,000 185,000 190,000 195,000 185,000
Morgan ............................. 215,000 215,000 220,000 230,000 215,000
Sedgwick .......................... 13,700 13,600 13,900 14,400 13,600
Weld ................................. 535,000 535,000 545,000 565,000 535,000
Northeast ... ... ... ... ...
Adams .............................. 14,400 14,500 14,700 15,300 14,400
Arapahoe .......................... 6,300 6,300 6,400 6,500 6,300
Cheyenne ......................... 33,000 33,000 33,000 34,500 32,500
Douglas ............................ 5,900 5,900 6,000 6,200 5,900
Elbert ................................ 43,000 43,000 44,000 45,500 43,000
El Paso ............................. 25,000 25,000 25,000 26,000 24,500
Kiowa ............................... 17,400 17,400 17,700 18,400 17,400
Kit Carson ........................ 160,000 160,000 165,000 170,000 160,000
Lincoln .............................. 49,000 49,000 50,000 52,000 49,000
Phillips .............................. 33,000 33,000 33,500 35,000 33,000
Washington ...................... 57,000 57,000 58,000 60,000 57,000
Yuma ................................ 250,000 250,000 255,000 265,000 250,000
East Central ... ... ... ... ...
Archuleta .......................... 6,000 6,000 6,100 6,300 5,900
Delta ................................. 32,000 32,000 32,500 34,000 32,000
Dolores ............................. 4,300 4,300 4,400 4,500 4,200
Garfield............................. 18,300 18,200 18,700 19,200 18,200
Hinsdale ........................... 1,200 1,200 1,300 1,300 1,200
La Plata ............................ 20,500 21,000 21,000 22,000 20,500
Mesa ................................ 32,500 32,500 33,000 34,000 32,500
Montezuma ...................... 19,100 19,100 19,500 20,000 19,000
Montrose .......................... 45,000 45,000 45,500 47,500 46,000
Ouray ............................... 5,800 5,700 5,900 6,100 5,700
San Miguel ....................... 6,700 6,700 6,800 7,100 6,700
Southwest ... ... ... ... ...

44 Colorado Agricultural Statistics 2014
All Cattle and Calves: Inventory by county, Colorado, 2009-2013 1/, continued
County 2009 2010 2011 2012 2013
Number Number Number Number Number
Alamosa ........................... 11,100 11,000 11,300 11,600 11,000
Conejos ............................ 30,000 30,000 30,500 32,000 30,000
Costilla ............................. 7,500 7,500 7,600 7,900 7,500
Mineral ............................. 200 200 200 200 200
Rio Grande ....................... 13,500 13,400 13,700 14,200 13,400
Saguache ......................... 19,600 19,500 19,900 20,500 20,000
San Luis Valley … … … … …
Baca ................................. 54,000 54,000 55,000 57,000 54,000
Bent .................................. 47,000 47,000 48,000 50,000 47,000
Crowley ............................ 68,000 68,000 69,000 72,000 68,000
Custer .............................. 6,200 6,200 6,400 6,600 6,200
Fremont ............................ 14,600 14,500 14,900 15,300 14,500
Huerfano .......................... 13,200 13,200 13,600 14,000 13,200
Las Animas ...................... 46,500 46,500 47,500 49,000 46,500
Otero ................................ 72,000 72,000 73,000 76,000 72,000
Prowers ............................ 99,000 99,000 100,000 105,000 99,000
Pueblo .............................. 45,500 45,500 46,000 48,000 46,000
Southeast … … … … …
Combined Counties Total 1/ 100 100 200 200 200
State Total 2,600,000 2,600,000 2,650,000 2,750,000 2,600,000
1/ All unpublished counties will be collapsed into Combined Counties Total.

Colorado Agricultural Statistics 2014 45
All Beef Cows: Inventory by county, Colorado, 2009-2013 1/
County 2009 2010 2011 2012 2013
Number Number Number Number Number
Eagle ................................ 3,300 3,300 3,300 3.500 3,300
Lake ................................. 400 400 400 400 400
Moffat ............................... 17,100 16,900 17,200 18,000 17,000
Park .................................. 4,600 4,600 4,700 4,900 4,600
Pitkin ................................ 1,500 1,500 1,600 1,600 1,500
Rio Blanco ........................ 14,800 14,700 15,000 15,500 14,700
Routt ................................ 14,500 14,400 14,600 15,300 14,400
Summit ............................. 1,100 1,100 1,200 1,200 1,000
NW & Mountain
Boulder ............................. 4,400 4,400 4,400 4,600 4,400
Jefferson .......................... 1,400 1,400 1,400 1,500 1,400
Larimer ............................. 11,400 11,300 11,500 12,000 11,300
Morgan ............................. 18,100 17,900 18,200 19,100 18,000
Sedgwick .......................... 5,300 5,300 5,300 5,600 5,300
Weld ................................. 47,500 47,000 48,000 50,000 48,000
Northeast
Adams .............................. 4,300 4,300 4,300 4,500 4,300
Arapahoe .......................... 4,300 4,300 4,300 4,600 4,000
El Paso ............................. 15,500 15,400 15,700 16,400 15,400
Kiowa ............................... 10,000 9,900 10,100 10,600 9,900
Lincoln .............................. 24,000 24,000 24,500 25,500 24,000
East Central
Delta ................................. 16,600 16,500 16,800 17,500 16,500
Garfield............................. 11,700 11,600 11,800 12,400 11,600
Hinsdale ........................... 500 500 500 500 500
La Plata ............................ 13,000 12,900 13,200 13,800 13,500
Montezuma ...................... 12,600 12,500 12,700 13,300 12,500
Montrose .......................... 20,000 19,800 20,000 21,000 19,800
Ouray ............................... 4,300 4,300 4,300 4,500 4,000
Southwest
Conejos ............................ 19,600 19,400 19,700 20,500 19,400
Costilla ............................. 5,000 5,000 5,100 5,300 5,000
Mineral ............................. 100 100 100 100 100
Saguache ......................... 11,200 11,100 11,300 11,800 11,200
San Luis Valley
Crowley ............................ 10,400 10,300 10,500 11,000 10,300
Fremont ............................ 6,900 6,800 7,000 7,300 6,900
Las Animas ...................... 29,500 29,000 30,000 31,000 29,000
Otero ................................ 18,600 18,400 18,800 19,600 18,500
Prowers ............................ 18,000 17,800 18,200 19,000 17,900
Combined Counties Total 1/ 318,500 315,900 321,300 335,600 315,400
State Total 720,000 714,000 727,000 759,000 715,000
1/ All unpublished counties will be collapsed into Combined Counties Total.

46 Colorado Agricultural Statistics 2014
All Milk Cows: Inventory by county, Colorado, 2009-2013 1/
County 2009 2010 2011 2012 2013
Number Number Number Number Number
Larimer ............................. 12,100 11,500 11,600 12,000 12,000
Morgan ............................. 26,500 25,500 27,000 30,000 31,000
Weld ................................ 71,000 62,000 66,000 70,000 73,000
Adams.............................. 2,000 1,600 1,800 1,500 1,500
Arapahoe………………….. 100 … … … …
El Paso ............................ 600 500 500 500 …
Delta ................................ 1,600 1,400 1,400 1,600 1,600
La Plata ............................ 100 100 100 100 100
Montrose .......................... 2,600 1,600 1,600 1,900 2,000
Conejos ............................ 400 300 300 400 300
Fremont ........................... 2,600 2,200 2,300 2,600 2,200
Combined Counties Total 1/ 10,400 9,300 10,400 10,400 11,300
State Total 130,100 116,000 123,000 131,000 135,000
1/ All unpublished counties will be collapsed into Combined Counties Total.

Colorado Agricultural Statistics 2014 47
Milk cows, milk and milkfat production, Colorado, 2004-2013
Year
Number of milk cows
on farms 1/
Production per milk cow 2/
Milk
Milk fat Total production on farms Milk used on farms where produced
Production
Percentage of milkfat in milk
Milk
Milkfat
Fed to calves
Used in the farm
household
Total
Thousand Pounds Pounds Percent Million Pounds Million Pounds
2004 ............. 102 21,412 758 3.54 2,184 77.3 22 3 25
2005 ............. 104 22,577 804 3.56
3.56 2,348 83.6 27 3 30
2006 ............. 110 23,155 822 3.56
3.55 2,547 90.4 30 3 33
2007 ............. 118 22,932 809 3.53 2,706 95.5 30 3 33
2008 ............. 128 22,930 805 3.51 2,935 103.0 30 3 33
2009 ............. 123 23,081 803 3.48 2,839 98.8 32 3 35
2010 ............. 119 23,664 826 3.49 2,816 98.3 28 3 31
2011 ……….. 128 23,430 834 3.56 2,999 106.8 26 2 28
2012 ……….. 134 23,978 846 3.53 3,213 113.4 21 1 22
2013 ……….. 137 24,248 863 3.56 3,322 118.3 21 1 22 1/ Average number on farms during year, excluding heifers not yet fresh. 2/ Excludes milk sucked by calves.
Milk sales, price and value, Colorado, 2004-2013
Year
Combined marketings of milk and cream sold to plants and dealers and directly to consumers 1/
Milk utilized
Average returns 2/
Cash receipts
Value of milk consumed on farms where produced 3/
Gross income dairy
products 4/
Per 100 lbs. milk
Per lb. milkfat
Million Pounds Dollars Dollars 1,000 Dollars 1,000 Dollars 1,000 Dollars
2004 ....................... 2,159 15.90 4.49 343,281 477 343,758
2005 ....................... 2,318 14.90 4.19 345,382 447 345,829
2006 ....................... 2,514 13.00 3.66 326,820 390 327,210
2007 ....................... 2,673 19.30 5.47 515,889 579 516,468
2008 ....................... 2,902 18.40 5.24 533,968 552 534,520
2009 ....................... 2,804 12.80 3.68 358,912 384 359,296
2010 ....................... 2,785 16.40 4.70 456,740 492 457,232
2011 ………………. 2,971 20.00 5.62 594,200 400 594,600
2012 ………………. 3,191 18.60 5.27 593,526 186 593,712
2013 ………………. 3,300 20.20 5.67 666,600 202 666,802 1/ Also includes milk produced by institutional herds. 2/ Cash receipts divided by milk or milkfat represented in combined marketings. 3/Valued at average
returns per 100 pounds of milk listed under combined marketings of milk and cream. 4/Cash receipts from marketings of milk and cream plus value of milk used for home consumption

48 Colorado Agricultural Statistics 2014
Milk cows and milk production by quarter, Colorado, 2004-2013 1/
Year January-March April-June July-September October-December Annual
Number of Milk Cows
Number Number Number Number Number
2004 ................... 100,000 102,000 103,000 103,000 102,000
2005 ................... 101,000 104,000 105,000 105,000 104,000
2006 ................... 106,000 110,000 112,000 113,000 110,000
2007 ................... 115,000 116,000 119,000 123,000 118,000
2008 ................... 126,000 127,000 130,000 130,000 128,000
2009 ................... 128,000 127,000 121,000 116,000 123,000
2010 ................... 116,000 117,000 120,000 122,000 119,000
2011 ................... 124,000 126,000 129,000 131,000 128,000
2012 ................... 133,000 132,000 134,000 135,000 134,000
2013 ................... 3/ 3/ 137,000 138,000 3/
Milk Production Per Cow
Pounds Pounds Pounds Pounds Pounds
2004 ................... 5,320 5,380 5,340 5,370 21,410
2005 ................... 5,490 5,720 5,830 5,590 22,630
2006 ................... 5,710 5,850 5,840 5,700 23,100
2007 ................... 5,430 5,870 5,890 5,680 22,870
2008 ................... 5,630 5,860 5,720 5,680 22,890
2009 ................... 5,710 5,870 5,820 5,680 23,080
2010 ................... 5,730 6,050 6,030 5,890 23,700
2011 ................... 5,770 6,030 5,940 5,780 23,520
2012 ................... 5,860 6,170 6,060 5,980 24,070
2013 ................... 3/ 3/ 6,160 6,080 3/
Milk Production 2/
Million Pounds Million Pounds Million Pounds Million Pounds Million Pounds
2004 ................... 532 549 550 553 2,184
2005 ................... 554 595 612 587 2,348
2006 ................... 605 644 654 644 2,547
2007 ................... 625 681 701 699 2,706
2008 ................... 709 744 744 738 2,935
2009 ................... 731 746 704 659 2,840
2010 ................... 665 708 724 719 2,816
2011 ................... 716 760 766 757 2,999
2012 ................... 780 814 812 807 3,213
2013 ................... 806 833 844 839 3,322
1/ Quarterly estimates are as follows: Jan. - March; April - June; July - Sept.; Oct.- Dec. Milk cows are the average for the quarter; milk production is total for the quarter; production per cow for the quarter is derived by dividing total production by average number of cows for the quarter. 2/ Excludes milk sucked by calves 3/ Data not available

Colorado Agricultural Statistics 2014 49
Milk cows and milk production by month, Colorado, 2005-2014 Year Jan. Feb. Mar. Apr. May June July Aug. Sep. Oct. Nov. Dec.
Number of Milk Cows
1,000 Head
2005 ................... 100 100 102 103 104 105 105 105 106 106 105 105 2006 ................... 106 106 107 108 110 111 112 112 112 112 113 114 2007 ................... 115 115 115 115 116 118 119 119 120 121 122 125 2008 ................... 126 126 126 127 127 128 129 130 130 130 130 130 2009 ................... 129 128 128 128 128 126 124 123 117 116 116 116 2010 ................... 116 116 116 117 117 118 119 120 122 122 122 123 2011 ................... 123 123 125 126 126 127 128 129 130 131 131 131 2012 ................... 133 133 132 132 132 133 133 134 135 135 135 135 2013 ……………. 135 135 1/ 1/ 1/ 1/ 137 137 137 137 138 140 2014 ……………. 140 140 141 143 144 145 145 145
Milk Production Per Cow
2005 ................... 1,860 1,720 1,925 1,865 1,950 1,905 1,960 1,970 1,875 1,870 1,820 1,890 2006 ................... 1,935 1,775 1,980 1,910 2,000 1,965 1,980 1,950 1,910 1,920 1,870 1,910 2007 ................... 1,855 1,670 1,910 1,900 1,990 1,960 2,000 1,975 1,900 1,930 1,870 1,895 2008 ................... 1,880 1,800 1,945 1,910 1,990 1,940 1,950 1,930 1,850 1,890 1,845 1,940 2009 ................... 1,940 1,780 1,980 1,920 2,000 1,940 1,960 1,950 1,880 1,920 1,860 1,900 2010 ................... 1,930 1,800 2,000 1,975 2,050 2,010 2,050 2,025 1,945 1,975 1,920 1,985 2011 ................... 1,975 1,795 2,015 1,985 2,040 1,990 2,010 2,000 1,930 1,955 1,870 1,955 2012 ……………. 1,970 1,865 2,045 2,030 2,105 2,015 2,050 2,050 1,955 2,015 1,940 2,020 2013 ……………. 2,040 1,865 1/ 1/ 1/ 1/ 1/ 2,095 1,965 2,030 1,975 2,055 2014 ……………. 2,080 1,885 2,100 2,070 2,165 2,110 2,150 2,135
Milk Production
Million Pounds
2005 ................... 186 172 196 192 203 200 206 207 199 198 191 198 2006 ................... 205 188 212 206 220 218 222 218 214 215 211 218 2007 ................... 213 192 220 219 231 231 238 235 228 234 228 237 2008 ................... 237 227 245 243 253 248 252 251 241 246 240 252 2009 ................... 250 228 253 246 256 244 243 240 220 223 216 220 2010 ................... 224 209 232 231 240 237 244 243 237 241 234 244 2011 ................... 243 221 252 250 257 253 257 258 251 256 245 256 2012 ................... 262 248 270 268 278 268 273 275 264 272 262 273 2013 ................... 275 252 279 271 283 279 288 287 269 278 273 288 2014 ................... 291 264 296 296 312 305 312 310
1/ Suspended due to NASS budget cuts
Cattle and Calves: Total inventory and value and inventory by class, Colorado, January 1, 2005-2014
Inventory by class
Year
Total Inventory
Inventory Value
Cows and heifers that have calved
Heifers 500 lbs. and over
Steers 500 lbs. and over
Bulls 500 lbs. and over
Steers heifers,
and bulls under
500 lbs. Per Head
Total Value
Beef Cows
Milk Cows
Beef cow replace-ments
Milk cow replace-ments
Other
1,000 Head
Dollars
1,000 Dollars
1,000 Head
1,000 Head
1,000 Head
1,000 Head
1,000 Head
2005 ........... 2,500 1,000 2,500,000 639 101 130 50 570 840 40 130
2006 ........... 2,650 1,110 2,941,500 675 105 115 55 580 920 45 155
2007 ........... 2,700 970 2,619,000 725 115 115 60 560 930 45 150
2008 ........... 2,750 1,030 2,832,500 724 126 130 70 590 890 50 170
2009 ........... 2,600 880 2,288,000 720 130 120 60 530 770 50 220
2010 ........... 2,600 850 2,210,000 714 116 120 70 500 860 45 175
2011 ........... 2,650 1,080 2,862,000 727 123 120 75 510 910 50 135
2012 ........... 2,750 1,250 3,437,500 759 131 155 75 510 930 50 140
2013 ……… 2,600 1,280 3,328,000 715 135 130 85 520 840 45 130
2014 ……… 2,480 1,320 3,273,600 700 140 140 100 470 760 45 125

50 Colorado Agricultural Statistics 2014
Chickens: Inventory by class and total value, Colorado, December 1, 2006-2013
Year All Layers Pullets Other
chickens
All chickens
Number Value per head Total Value
2006………… 3,735 792 69 4,596 1.80 8,273 2007………… 3,875 943 69 4,887 2.30 11,240 2008………… 3,872 774 65 4,711 2.10 9,893 2009………… 3,820 784 65 4,669 2.30 10,739 2010………… 3,681 1,018 53 4,752 2.80 13,306 2011………… 4,684 884 73 5,641 2.30 12,974 2012………… 4,171 906 49 5,126 2.20 11,277 2013………… 5,030 912 52 5,994 2.30 13,786
Chickens: Number lost, number sold and value of sales, Colorado, 2006-2013
Year Number lost Number sold Pounds sold Price per pound 2/ Value 1,000 Head 1,000 Head 1,000 Pounds Cents 1,000 Dollars
2006……………….. 1,005 1,968 9,446 5.1 482 2007……………….. 626 2,195 10,097 4.2 424 2008……………….. 1,151 1,646 8,230 5.3 486 2009……………….. 884 2,139 9,412 5.1 480 2010……………….. 1,065 1,816 8,717 7.0 610 2011……………….. 1,138 2,027 8,513 5.0 426 2012……………….. 1,015 2,135 9,608 6.9 663 2013……………….. 461 2,956 12,120 5.7 691
Layers and egg production, Colorado 2006-2013
Year
Dec. 1/ Jan. Feb. March April May June July Aug. Sep. Oct. Nov.
Average number of layers
Thousand
2006………… 3,889 3,818 3,731 3,633 3,635 3,791 3,725 3,703 3,868 3,851 3,790 3,746 2007………… 3,721 3,776 3,825 3,750 3,737 3,777 3,725 3,685 3,721 3,755 3,830 3,886 2008………… 3,863 3,927 3,905 3,895 3,894 3,706 3,716 3,817 3,793 3,667 3,726 3,882 2009………… 3,955 3,971 3,890 3,854 3,772 3,721 3,601 3,628 3,645 3,575 3,680 3,770 2010………… 3,701 3,589 3,571 3,702 3,766 3,636 3,575 3,589 3,605 3,560 3,586 3,659 2011………… 3,628 3,613 3,705 3,816 3,987 3,943 4,042 4,386 4,511 4,625 4,718 4,712 2012………… 4,778 4,792 4,764 4,782 4,734 4,503 4,240 4,201 4,221 4,197 4,173 4,178 2013………… 4,117 4,107 4,183 4,238 3,990 4,103 4,513 4,678 4,667 4,750 4,882 4,965
Number of eggs produced
Million 2006………… 94 94 82 89 86 91 90 93 95 92 92 85 2007………… 87 88 84 93 87 89 88 91 87 83 91 91 2008………… 92 93 88 96 91 89 83 93 95 88 91 91 2009………… 98 99 89 98 93 96 89 89 92 86 90 91 2010………… 93 90 80 92 89 89 85 90 91 90 91 86 2011………… 89 88 78 90 91 96 97 104 103 103 112 112 2012………… 119 116 108 117 112 112 102 106 106 98 102 99 2013………… 97 97 89 99 100 105 101 111 120 118 123 122
Eggs: Production and income, Colorado, 2006-2013
Year Average number
of layers Eggs per layer Total produced Price per dozen 2/ Value of Production
Thousand Number Millions Dollars 1,000 Dollars 2006……………….. 3,765 288 1,083 0.526 47,452 2007……………….. 3,766 281 1,059 0.839 74,074 2008……………….. 3,816 286 1,090 1.066 96,842 2009……………….. 3,755 296 1,110 0.760 70,308 2010……………….. 3,628 294 1,066 0.868 77,131 2011……………….. 4,141 281 1,163 0.885 85,801 2012……………….. 4,464 291 1,297 0.890 96,215 2013……………….. 4,438 289 1,282 0.967 103,258 1/ December preceding year. 2/ No longer published.

Colorado Agricultural Statistics 2014 51
Colorado Department of Agriculture Office of the Commissioner 305 Interlocken Parkway, Broomfield, CO 80021
Commissioner of Agriculture, John Salazar…………………………………… (303) 869-9000
Public Information…………………………………………………………….. (303) 869-9000
Administrative Services……………………………………………………….. (303) 869-9020
Human Resources……………………………………………………………… (303) 869-9002
Media Relations……………………………………………………………….. (303) 869-9005
Animal Industry Division 305 Interlocken Parkway, Broomfield, CO 80021
Main Number………………………………………………………………...... (303) 869-9130
State Veterinarian, Keith Roehr DVM……………………………………..….. (303) 869-9130
Animal ID.………………………………………….………..………….……... (303) 869-9134
Aquaculture Program…………………………………………………………... (303) 869-9143
Bureau of Animal Protection………………………………………….……….. (303) 869-9145
Livestock Disease Program………………………………………….……….... (303) 869-9130
Pet Animal Care Facilities……………………………………………………... (303) 869-9144
RMRAHL--- Rocky Mountain Regional Animal Health Laboratory…..……... (303) 477-0049
Rodent/Predator Control Section………………………………………………. (303) 869-9141
Brand Inspection Division 305 Interlocken Parkway, Broomfield, CO 80021
Brand Commissioner, Chris Whitney………………………………………… (303) 869-9160
Conservation Services Division 305 Interlocken Parkway, Broomfield, CO 80021
Director, Eric Lane ……………………………………………………………. (303) 869-9030
Palisade Insectary, Dan Bean
750 37 8/10 Road, Palisade, CO 81526 ……………………………………….. (970) 464-7916
Inspection and Consumer Services Division 2331 West 31
st. Avenue, Denver, CO 80211
Director, Steve Bornmann……..……………………………………………… (303) 477-0076
Measurement Standards
3125 Wyandot Street, Denver, CO 80211…………………………………….. (303) 477-4220
Markets Division 305 Interlocken Parkway, Broomfield, CO 80021
Director, Tom Lipetzky……………………………………………………….. (303) 869-9170
Wine Development Board, Doug Caskey …………………………………….. (303) 869-9177
Fruit & Vegetable Section
P.O Box 407, Monte Vista, CO 81144………………….…………………….. (719) 852-4749
Plant Industry Division 305 Interlocken Parkway, Broomfield, CO 80021
Director, Mitch Yergert……………………………………………………….. (303) 869-9050
State Fair State Fairgrounds, Pueblo, Colorado 81004
Director, Chris Wiseman………………………………………………………. (719)-561-8484

52 Colorado Agricultural Statistics 2014
INDEX
Apples: Cash receipts 28
Prices 24
Production 24
Value 24
Barley: Acreage 6, 7, 14
Cash receipts 28
County estimates 14
District estimates 14
Monthly marketing percents 23
Prices 6, 7, 31, 32
Production 6, 7, 14
Value 6, 7
Yield 6, 14
Beans, dry edible: Acreage 6, 8, 15
Cash receipts 28
Class 16
County estimates 15
District estimates 15
Monthly marketing percents 23
Prices 6, 8, 31, 34
Production 6, 8, 15
Value 6, 8
Yield 6, 8, 15
Beef cattle: Inventory 36, 49
Prices 31, 35
County estimates 45, 46
District estimates 45, 46
Bees: 38
Cabbage: Acreage 25
Cash receipts 28
Prices 25, 31
Production 25
Value 25
Yield 25
Cantaloupe: Acreage 25
Cash receipts 28
Prices 25
Production 25
Value 25
Yield 25
Cattle and calves: Calf crop 36, 41
Cash receipts 28, 41
County estimates 43, 44
Disposition 41
District estimates 43, 44
Inshipments 41
Inventory by class 36, 49
Inventory, state 36, 49
Marketings 41
On feed by class 40
On feed by month 39, 40
Placements by weight group 40
Prices 31, 35
Production 41
Slaughter 41, 42
Value 49
Chickens: Inventory 36, 50
Hens and pullets 36, 50
Prices 31, 50
Value 50
Corn, all: 6
Corn, grain: Acreage 6, 8, 15
Cash receipts 28
County estimates 15
District estimates 15
Monthly marketing percents 23
Prices 6, 8, 31, 32
Production 6, 8, 15
Value 6, 8
Yield 6, 8, 15

Colorado Agricultural Statistics 2014 53
Corn, silage: Acreage 6, 9
Prices 6, 9
Production 6, 9
Value 6, 9
Yield 6, 9
Crops: Cash receipts 28
County estimates 13-15, 17-19
District estimates 13-15, 17-19
Monthly marketing percents 23
Planting and harvesting dates 26
Prices 6, 31-34
Value of production 6, 7-12
Record high and lows 4
See also - Specific crop
Dairy: Cash receipts 28, 47
Milk disposition 47
Milk prices 31, 32, 47
Milk production 47-49
Eggs: Cash receipts 28
Prices 31
Expenses, farm production: 27
Exports: 29
Farms and land in farms: 3
Farm income: Farm income indicators 27
Farm real estate values 30
Goats: 36, 38, 42
Grain Storage Capacity: 21
Grazing Fees: 30
Government transactions: 27
Hay crops: Acreage 6, 10, 18, 19
Cash receipts 28
County estimates 18, 19
District estimates 18, 19
Monthly marketing percents 23
New Seeding of Alfalfa and Mixtures 21
Prices 6, 10, 31, 33
Production 6, 10, 18, 19
Value 6, 10
Yield 6, 10, 18, 19
Hogs and pigs: Cash receipts 28, 41
Disposition 41
Inventory by class 36, 37
Inventory, state 36, 37
Marketings 41
Pig crop 36, 41
Prices 31
Production 41
Slaughter 41, 42
Sows farrowed 36
Value 37
Honey: Cash receipts 28
Prices 38
Production 38
Stocks 38
Lambs: Inventory 36
Lamb crop 36, 41
Marketings 41
Replacement lambs 36
Prices 31, 34
Land in farms: 3
Livestock: Cash receipts 28, 41
Disposition 41
Inshipments 41
Inventory by class 36, 37, 38
Prices 31, 34, 35
Production and disposition 41
Record high and lows 5
Slaughter 41, 42
See also - Individual species

54 Colorado Agricultural Statistics 2014
Milk cows: Cash receipts 28, 47
County estimates 46
District estimates 46
Disposition 47
Prices 31, 32, 47
Production 47, 48, 49
Value 47
Millet, Proso: Acreage 6, 12
Cash Receipts 28
Prices 6, 12
Production 6, 12
Value 6, 12
Monthly marketing percents: 23
Oats: Acreage 6, 8
Cash receipts 28
Prices 6, 8
Production 6, 8
Value 6, 8
Yield 6, 8
Onions: Acreage 24
Cash receipts 28
Prices 24, 31
Production 24
Value 24
Yield 24
Peaches: Cash receipts 28
Prices 24, 31
Production 24
Value 24
Potatoes: Acreage 6, 11, 20
Cash receipts 28
County estimates 20
Disposition 20
Prices 6, 11, 31, 34
Production 6, 11, 20
Stocks 20
Value 6, 11
Yield 6, 11, 20
Poultry: Cash receipts 28
Inventory 50
Prices received: 31-35
Sheep and Lambs: Cash receipts 28, 41
Disposition 41
Inshipments 41
Inventory by class 36, 37
Inventory, state 36, 37
Lamb crop 36, 41
Market sheep and lambs 36, 37
Marketings 41
Number shorn 37
Prices 31, 34
Production 41
Slaughter 41, 42
Value 37
Slaughter, livestock: 41, 42
Sorghum, all: 6
Sorghum, grain: Acreage 6, 8, 14
Cash receipts 28
County estimates 14
Districts estimates 14
Prices 6, 8, 31
Production 6, 8, 14
Value 6, 8
Yield 6, 8, 14
Sorghum, silage: Acreage 6, 9
Prices 6, 9, 31
Production 6, 9
Value 6, 9
Yield 6, 9
Sugarbeets: Acreage 6, 12, 17
Cash receipts 28
County estimates 17
District estimates 17
Prices 6, 12
Production 6, 12, 17
Value 6
Yield 6

Colorado Agricultural Statistics 2014 55
Sunflower: Acreage 6, 9, 17
Cash receipts 28
County estimates 17
District estimates 17
Prices 6, 9
Production 6, 9, 17
Value 6, 9
Yield 6, 9, 17
Sweet corn: Acreage 25
Cash receipts 28
Prices 25, 31
Production 25
Value 25
Yield 25
Trout: Cash receipts 28
Distributed 38
Operations 38
Sales 38
Value 38
Wheat, all: Acreage 6, 7
Cash receipts 28
Monthly marketing percents 23
Prices 6, 7, 31, 32
Production 6, 7
Value 6, 7
Yield 6, 7
Wheat, spring: Acreage 6, 7, 12
County estimates 12
District estimates 12
Prices 6, 7, 31
Production 6, 7, 12
Value 6, 7
Yield 6, 7, 12
Wheat, winter: Acreage 6, 7, 13
County estimates 13
District estimates 13
Prices 6, 7, 31
Production 6, 7, 13
Value 6, 7
Varieties 21, 22
Yield 6, 7, 13
Wool: Cash receipts 28
Prices 37
Production 37
Value 37
Weight per fleece 37