Embed Size (px)
Citation preview

Region of Waterloo 2014.10.30
DOCS# 1495211 1
Collision Estimation and Cost Calculation
Table of Contents
Introduction ................................................................................................................... 3
Rates Based Method ..................................................................................................... 4
20-Year Collision Cost Procedure .............................................................................. 4
Safety Performance Function Method ......................................................................... 7
Important notes when applying SPFs ........................................................................ 7
Safety Performance Functions for Regional Road Intersections ................................ 7
Empirical Bayes Weighting Method ........................................................................... 8
Roundabout Conflicts Method ..................................................................................... 9
Total Daily Conflict Roundabout Collision Prediction Model ...................................... 9
Total Daily Conflicts Example Calculations .............................................................. 10
Multi-Lane Roundabouts .................................................................................... 10
Single-lane Roundabouts ................................................................................... 11
Validation of Collision Prediction Model ................................................................... 11
Collision Data Tables .................................................................................................. 14
Social Collision Cost ................................................................................................ 14
Direct Human Capital Costs ............................................................................... 14
Comprehensive Social Costs.............................................................................. 14
Collision Rates ......................................................................................................... 14
Fatal Collision Ratio ................................................................................................. 16
SPF Crash Coefficients ............................................................................................ 16
Urban - Total Crash Coefficients ........................................................................ 16
Urban - PDO Crash Coefficients ......................................................................... 16
Rural - Total Crash Coefficients .......................................................................... 16
Rural - PDO Crash Coefficients .......................................................................... 17
Collision Modification Factors .................................................................................. 17
Left-turn Lane Collision Modification Factors for Intersections (CMF) ................ 17
Right-turn Lane Collision Modification Factors for Intersections (CMF) .............. 18
Presence of Illumination CMF............................................................................. 18
Presence of Fully-Protected Left-turn (FPLT) Signal Phase Operation CMF .................................................................................................................... 18
SPF Calibration Factors ........................................................................................... 19

Region of Waterloo 2014.10.30
DOCS# 1495211 2

Region of Waterloo 2014.10.30
DOCS# 1495211 3
Introduction
This document serves as a technical guide for calculating collision cost for use in
transportation studies in the Region of Waterloo. The two main assessments that will
rely on these methods are an Intersection Control Study (ICS) and the Roundabout
Screening Tool (RST). Three methodologies are presented to calculate expected
collision frequencies:
A Rates Based Method based on Region of Waterloo data and appropriate for
estimating collisions at a signalized, stop controlled or roundabout controlled
intersection for the initial assessment required as part of the RST
A Safety Performance Function Method derived from Highway Safety Manual
(HSM) and appropriate for estimating collisions at a signalized or stop controlled
intersection for use in either an ICS or the RST
A Roundabout Conflicts Method based on Region of Waterloo data and
appropriate for estimating collisions at a roundabout for either an ICS or the RST
Subsequent sections of this guide document provide a detailed description of each of
the three methods. In addition, a collection of Collision Data Tables is provided. These
data tables are referenced throughout the descriptions of the three methods.
Once the expected annual collision frequencies have been calculated the following
general formula can be used to establish the associated 20-year collision cost:
( ) [( )
( ) ]
Where:
= Social Collision Cost obtained from the data table below
= discount rate (6% or 0.06)
This general calculation is appropriate for use with the Safety Performance Function
Method and the Roundabout Conflicts Method. The Rates Based Method uses this
approach but includes some minor variations as described below.

Region of Waterloo 2014.10.30
DOCS# 1495211 4
Rates Based Method
To determine 20-Year Collision Costs for a study area intersection follow the procedure
outlined below. This description outlines the rates based method described in
Section 6.1 of the Region’s “Blue Book” as of October 24, 2013.
It is also acceptable to use either of the other methods described below as a substitute
when determining collision frequencies for the purposes of a Roundabout Screening
Tool.
20-Year Collision Cost Procedure
Step 1
a Obtain 5-year Collision Data (total non-injury collisions and total injury collisions)
b Obtain existing AADT
c Using this information calculate existing site specific collision rates (for total non-injury and injury collisions)
d
( )
( )
e
( )
( )
Step 2
a Obtain most applicable AVERAGE total and injury collision rates for potential traffic signals from the Collision Rates tables below
b Using this information, calculate expected average annual non-injury and injury collision frequencies for a potential signal:
c
d
Step 3
a Calculate Adjustment Factors
b
c
Region of Waterloo 2014.10.30
DOCS# 1495211 5
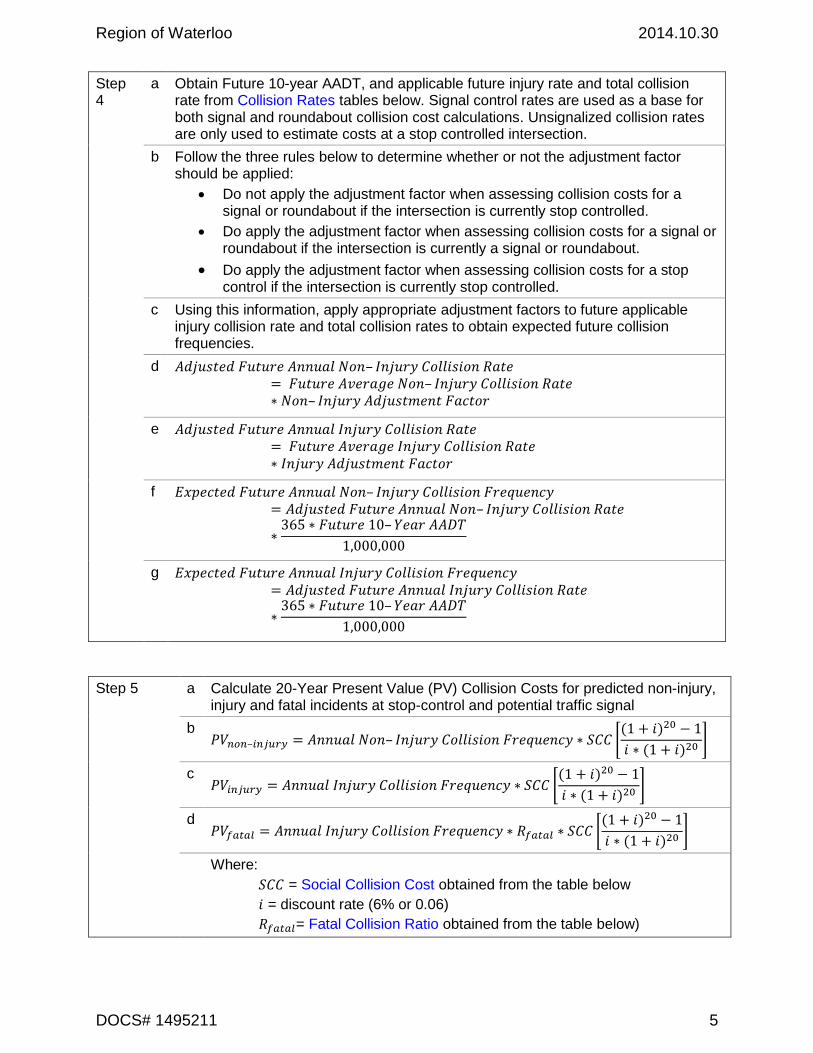
Step 4
a Obtain Future 10-year AADT, and applicable future injury rate and total collision rate from Collision Rates tables below. Signal control rates are used as a base for both signal and roundabout collision cost calculations. Unsignalized collision rates are only used to estimate costs at a stop controlled intersection.
b Follow the three rules below to determine whether or not the adjustment factor should be applied:
Do not apply the adjustment factor when assessing collision costs for a signal or roundabout if the intersection is currently stop controlled.
Do apply the adjustment factor when assessing collision costs for a signal or roundabout if the intersection is currently a signal or roundabout.
Do apply the adjustment factor when assessing collision costs for a stop control if the intersection is currently stop controlled.
c Using this information, apply appropriate adjustment factors to future applicable injury collision rate and total collision rates to obtain expected future collision frequencies.
d
e
f
g
Step 5 a Calculate 20-Year Present Value (PV) Collision Costs for predicted non-injury, injury and fatal incidents at stop-control and potential traffic signal
b [
( )
( ) ]
c [
( )
( ) ]
d [
( )
( ) ]
Where:
= Social Collision Cost obtained from the table below
= discount rate (6% or 0.06)
= Fatal Collision Ratio obtained from the table below)

Region of Waterloo 2014.10.30
DOCS# 1495211 6
Step 6 a Calculate Expected rates and PV Costs for Potential Roundabout
b
c
d
e
f [
( )
( ) ]
g [
( )
( ) ]
h
[( )
( ) ]
NB: is calculated in step 4f.
Region of Waterloo 2014.10.30
DOCS# 1495211 7
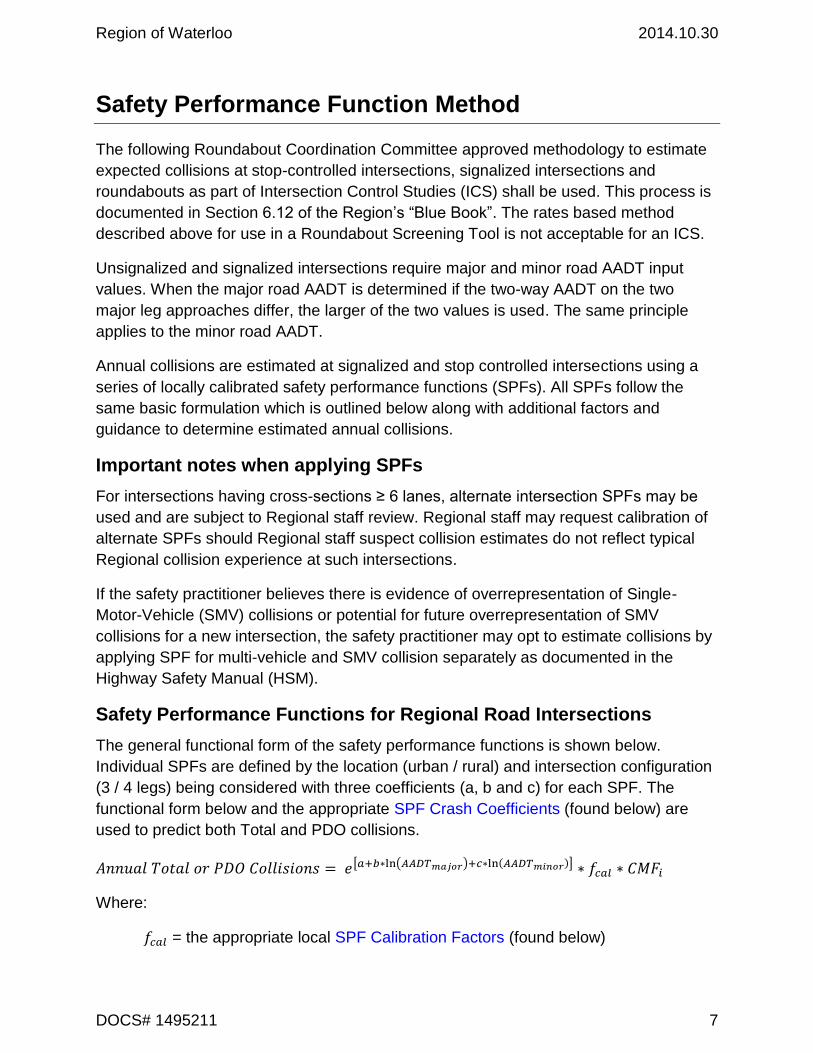
Safety Performance Function Method
The following Roundabout Coordination Committee approved methodology to estimate
expected collisions at stop-controlled intersections, signalized intersections and
roundabouts as part of Intersection Control Studies (ICS) shall be used. This process is
documented in Section 6.12 of the Region’s “Blue Book”. The rates based method
described above for use in a Roundabout Screening Tool is not acceptable for an ICS.
Unsignalized and signalized intersections require major and minor road AADT input
values. When the major road AADT is determined if the two-way AADT on the two
major leg approaches differ, the larger of the two values is used. The same principle
applies to the minor road AADT.
Annual collisions are estimated at signalized and stop controlled intersections using a
series of locally calibrated safety performance functions (SPFs). All SPFs follow the
same basic formulation which is outlined below along with additional factors and
guidance to determine estimated annual collisions.
Important notes when applying SPFs
For intersections having cross-sections ≥ 6 lanes, alternate intersection SPFs may be
used and are subject to Regional staff review. Regional staff may request calibration of
alternate SPFs should Regional staff suspect collision estimates do not reflect typical
Regional collision experience at such intersections.
If the safety practitioner believes there is evidence of overrepresentation of Single-
Motor-Vehicle (SMV) collisions or potential for future overrepresentation of SMV
collisions for a new intersection, the safety practitioner may opt to estimate collisions by
applying SPF for multi-vehicle and SMV collision separately as documented in the
Highway Safety Manual (HSM).
Safety Performance Functions for Regional Road Intersections
The general functional form of the safety performance functions is shown below.
Individual SPFs are defined by the location (urban / rural) and intersection configuration
(3 / 4 legs) being considered with three coefficients (a, b and c) for each SPF. The
functional form below and the appropriate SPF Crash Coefficients (found below) are
used to predict both Total and PDO collisions.
[ ( ) ( )]
Where:
= the appropriate local SPF Calibration Factors (found below)
Region of Waterloo 2014.10.30
DOCS# 1495211 8
= a series of appropriate Collision Modification Factors (found below) for
left and right turn lanes dependant on the configuration under consideration.
Once the Annual Total Collisions and Annual PDO Collisions have been predicted then
Injury and Fatal Collisions can be calculated as follows:
( )
( )
( )
Where the Fatal Collision Ratio is selected from the table below.
When historical information is available, the predicted collision frequency based on the
SPF above should be smoothed using the Empirical Bayes Weighting Method described
below. Apply Empirical Bayes procedure to future scenarios unless the number of
intersection legs change or control changes between present and future condition.
Empirical Bayes Weighting Method
The Empirical Bayes Weighting Method assigns a weight to balance the past collision
experience at an intersection against the prediction of the safety performance function.
To apply this weighting method an adjustment factor is calculated:
Where is an over-dispersion parameter based on the specific SPF being used. Please
reference the Highway Safety Manual (HSM) for the appropriate over-dispersion
parameter. For convenience, over-dispersion parameters for each SPF in this guide are
provided along with the SPF Crash Coefficients below.
The weighting factor is then applied to calculate the estimated annual collisions as
follows:
( )
(( ) )
Note that in this weighting calculation all collision frequencies are annual values.

Region of Waterloo 2014.10.30
DOCS# 1495211 9
Roundabout Conflicts Method
For roundabout collision estimates, the Region’s empirical collision prediction model
requires AADT for all movements. All movement AADTs are required to estimate total
daily conflicts (TDC) at roundabouts. TDC are used as a base condition to estimate total
collisions. See “Total Daily Conflicts Example Calculations” for more information on
determining total estimated daily conflicts.
The process outlined below is to be used when Total Daily Conflicts (TDC) are
estimated less than 100,000 per day. This process is documented in Section 36.10 of
the Region’s “Blue Book”.
If estimated TDC is greater than 100,000 per day you may estimate total collisions and
distribution of collision severities using the process below, NCHRP 572, and/or
Transport Canada collision prediction models. If necessary you may combine models to
more accurately reflect roundabout the configuration being assessed. Regional staff
may request calibration of these models or combination of models should Regional staff
suspect collision estimates do not reflect typical Regional collision experience.
Total Daily Conflict Roundabout Collision Prediction Model
Expected total annual collisions at a roundabout can be estimated more reliably by
applying estimated total potential conflicts per day versus overall average annual daily
traffic volume as a base condition. Logically, fewer collisions at a roundabout should be
expected if fewer conflicts arise throughout the day. The number of potential conflicts at
any roundabout is dependant on the roundabout configuration (number of legs,
permitted movements, etc.) and overall daily turning movements.
Potential conflicts are estimated by using AADT volumes. Two examples, in the next
section, illustrate the calculation of potential conflicts for one approach at a multi-lane
and single lane roundabout. Total potential conflicts at any given roundabout are
determined by evaluating all approaches and summing potential conflicts from all
approaches.
The final estimate of total annual collisions is calculated as follows:
( )
Injury collisions represent 10% of all collisions at roundabouts. All remaining collisions
are considered to be PDO. This ratio is based on all collisions occurring at Regional
roundabouts to date. When following this methodology the number of fatal collisions at a
roundabout is considered negligible.

Region of Waterloo 2014.10.30
DOCS# 1495211 10
Total Daily Conflicts Example Calculations
Multi-Lane Roundabouts
EBL conflicts = (Lesser of EBLT vs. SBL)
+ (Lesser of EBLT vs. SBT)
+ (Lesser of EBLT vs. NBL)
+ (Lesser of EBLT vs. NBT)
+ (Lesser of EBLT vs. WBL)
+ (Lesser of EBLT vs. WBT)
EBL conflicts = 1575 + 1636 + 938 + 1636 + 1366 + 1636 = 8787
EBT conflicts = (Lesser of EBT vs. SBL)
+ (Lesser of EBT vs. SBT)
+ (Lesser of EBT vs. NBL)
+ (Lesser of EBT vs. NBT)
+ (Lesser of EBT vs. NBR)
EBT conflicts = 1575 + 3435 + 938 + 3435 + 1001 = 10384
EBR conflicts = (Lesser of EBR vs. SBT)
EBR conflicts = 1538
EB TDC = 8787 + 10384 + 1538 = 20709
Region of Waterloo 2014.10.30
DOCS# 1495211 11
Single-lane Roundabouts
SB TDC = (Lesser of SBTOT vs. WBL+WBT)
+ (Lesser of SBT+SBL vs. EBTOT)
+ (Lesser of SBL vs. NBTOT)
SB TDC = (Lesser of 10014 vs. 4157)
+ (Lesser of 8486 vs. 6609)
+ (Lesser of 1575 vs. 8085)
SB TDC = 4157 + 6609 + 1575 = 12341
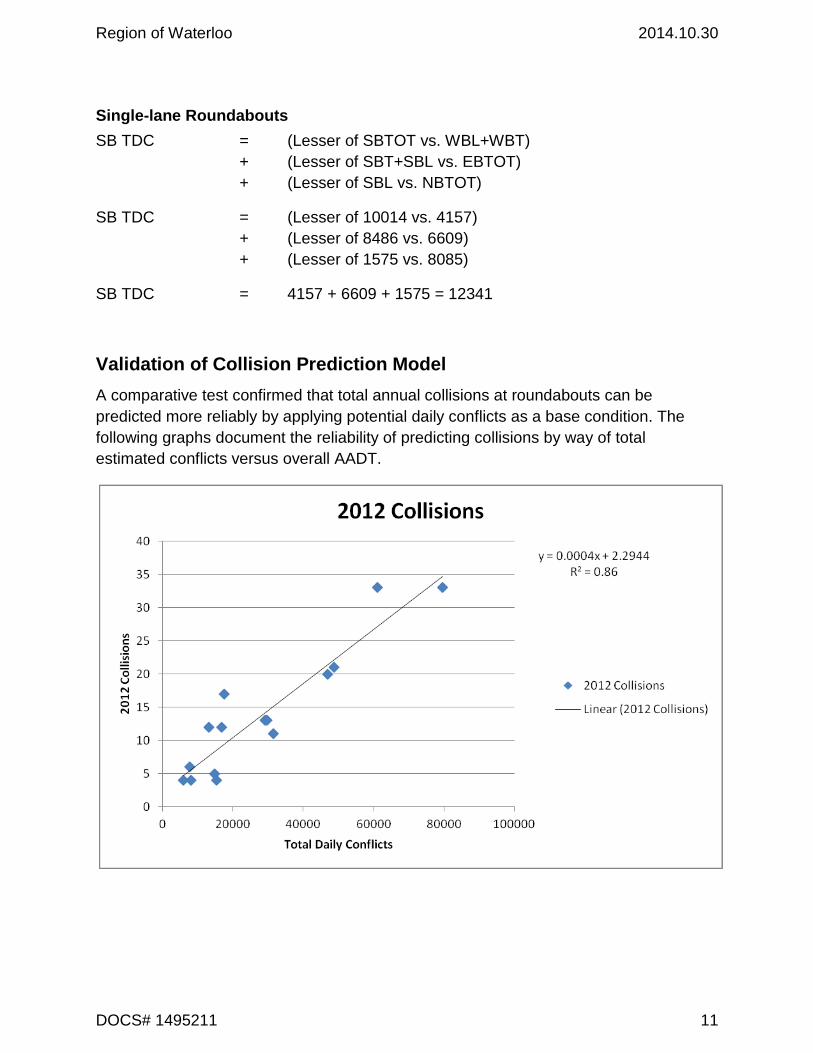
Validation of Collision Prediction Model
A comparative test confirmed that total annual collisions at roundabouts can be
predicted more reliably by applying potential daily conflicts as a base condition. The
following graphs document the reliability of predicting collisions by way of total
estimated conflicts versus overall AADT.

Region of Waterloo 2014.10.30
DOCS# 1495211 12
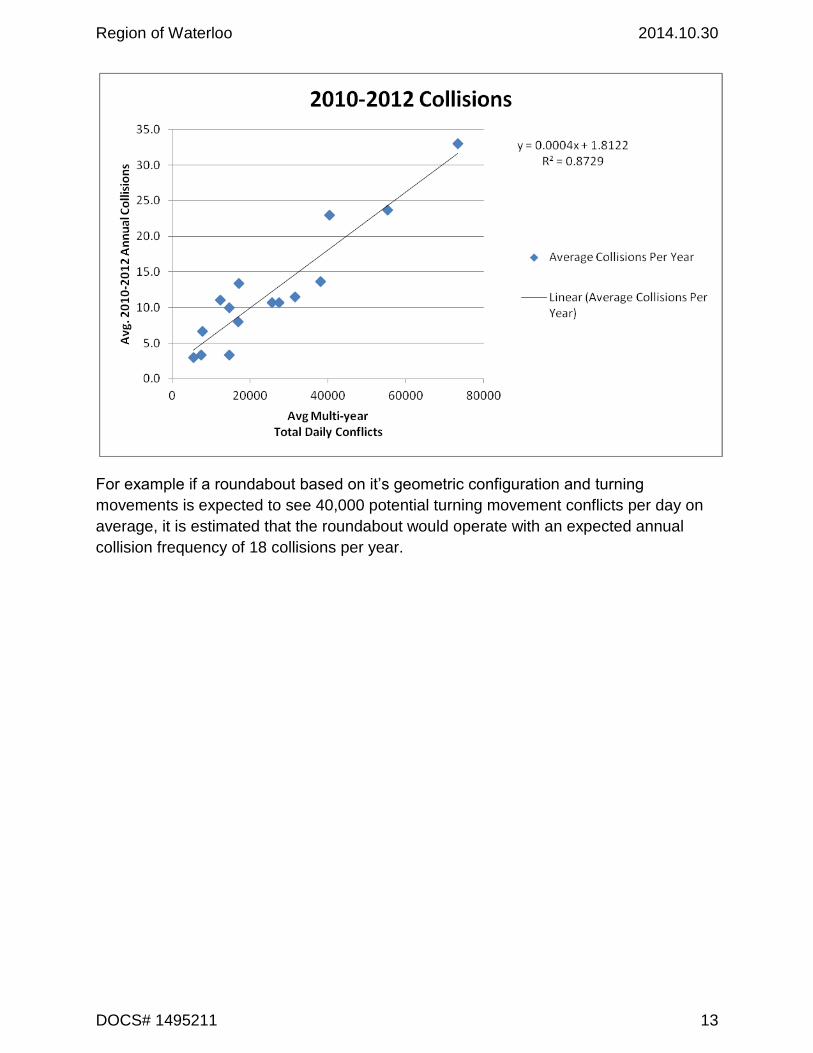
Expected annual roundabout collisions at any given location therefore may be estimated
more reliably using a model that applies total daily conflicts as a surrogate measure
rather than AADT.
Following discussions with a third party consultant, it was suggested to include
additional years of data to increase the reliability of the model. The model was therefore
updated to include additional data including roundabout locations having at least 2 or 3
years of data available (13 roundabouts with 3 years of collision data and 2 roundabouts
with 2 years of collision data). 2012 total daily conflicts were adjusted based on AADT
data recorded in previous years. The following graph represents the model with
additional data further confirming a solid relationship between total daily conflicts and
annual collisions. Estimating annual collisions using this model is considered quite
reliable as the R2 value signifying correlation strength increased. The standard error of
the model has been calculated at 3.11 collisions. Therefore the model can estimate
collisions within ± 6.1 collisions with 95% confidence. Therefore the equation given
above may be used to estimate expected annual collisions at roundabouts with some
reliability.
Region of Waterloo 2014.10.30
DOCS# 1495211 13
For example if a roundabout based on it’s geometric configuration and turning
movements is expected to see 40,000 potential turning movement conflicts per day on
average, it is estimated that the roundabout would operate with an expected annual
collision frequency of 18 collisions per year.

Region of Waterloo 2014.10.30
DOCS# 1495211 14
Collision Data Tables
All the data collected in the tables below is subject to being updated. Some, such as the
collision rates is updated annually. Other data may be updated on an ad-hoc basis.
Please ensure you are using the most recent data available.
Social Collision Cost
Social collision costs based on both Direct Human Capital and Comprehensive Social
costs should be calculated. These two different values should be provided in the
evaluation tables for the analysis.
Direct Human Capital Costs
Adjusted based on Consumer Price Index ratio per HSM
Fatal Collisions – $1,656,500
Injury Collisions – $60,500
Property Damage / Non-reportable – $5,000
Comprehensive Social Costs
Fatal Collisions – $13,600,000
Injury Collisions – $82,000
Property Damage / Non-reportable – $5,000
Collision Rates
2008 to 2012 average non-injury collision rates (PDO+NR)
AADT Entering
City Township
Signalized Signalized Signalized Signalized
(3-legged) (4-legged) (3-legged) (4-legged)
0 to 5,000 0.08 0.37 unavailable unavailable
5,001 to 10,000 0.23 0.28 0.43 0.38
10,001 to 15,000 0.26 0.34 0.08 0.31
15,001 to 20,000 0.38 0.41 0.32 0.39
20,001 to 25,000 0.38 0.47 0.19 0.35
25,001 or greater 0.46 0.68 0.26 0.33

Region of Waterloo 2014.10.30
DOCS# 1495211 15
2008 to 2012 average non-injury collision rates (PDO+NR)
AADT Entering
City Township
Stop Controlled Stop Controlled Stop Controlled Stop Controlled
(3-legged) (4-legged) (3-legged) (4-legged)
0 to 5,000 0.04 0.47 unavailable unavailable
5,001 to 10,000 0.08 0.20 0.08 0.14
10,001 to 15,000 0.07 0.17 0.06 0.07
15,001 to 20,000 0.09 0.17 0.14 0.05
20,001 to 25,000 0.07 0.14 0.01 0.04
25,001 or greater 0.06 0.14 0.06 0.04
2008 to 2012 average injury collision rates (Injury+Fatal)
AADT Entering
City Township
Signalized Signalized Signalized Signalized
(3-legged) (4-legged) (3-legged) (4-legged)
0 to 5,000 0.08 0.19 unavailable unavailable
5,001 to 10,000 0.11 0.13 0.07 0.10
10,001 to 15,000 0.10 0.15 0.07 0.13
15,001 to 20,000 0.12 0.17 0.22 0.12
20,001 to 25,000 0.13 0.19 0.04 0.10
25,001 or greater 0.15 0.22 0.08 0.13
2008 to 2012 average injury collision rates (Injury+Fatal)
AADT Entering
City Township
Stop Controlled Stop Controlled Stop Controlled Stop Controlled
(3-legged) (4-legged) (3-legged) (4-legged)
0 to 5,000 0.03 0.24 0.02 0.11
5,001 to 10,000 0.03 0.12 0.03 0.08
10,001 to 15,000 0.02 0.08 0.02 0.01
15,001 to 20,000 0.03 0.06 0.01 0.02
20,001 to 25,000 0.04 0.04 0.02 0.03
25,001 or greater 0.02 0.04 0.01 0.03
Region of Waterloo 2014.10.30
DOCS# 1495211 16
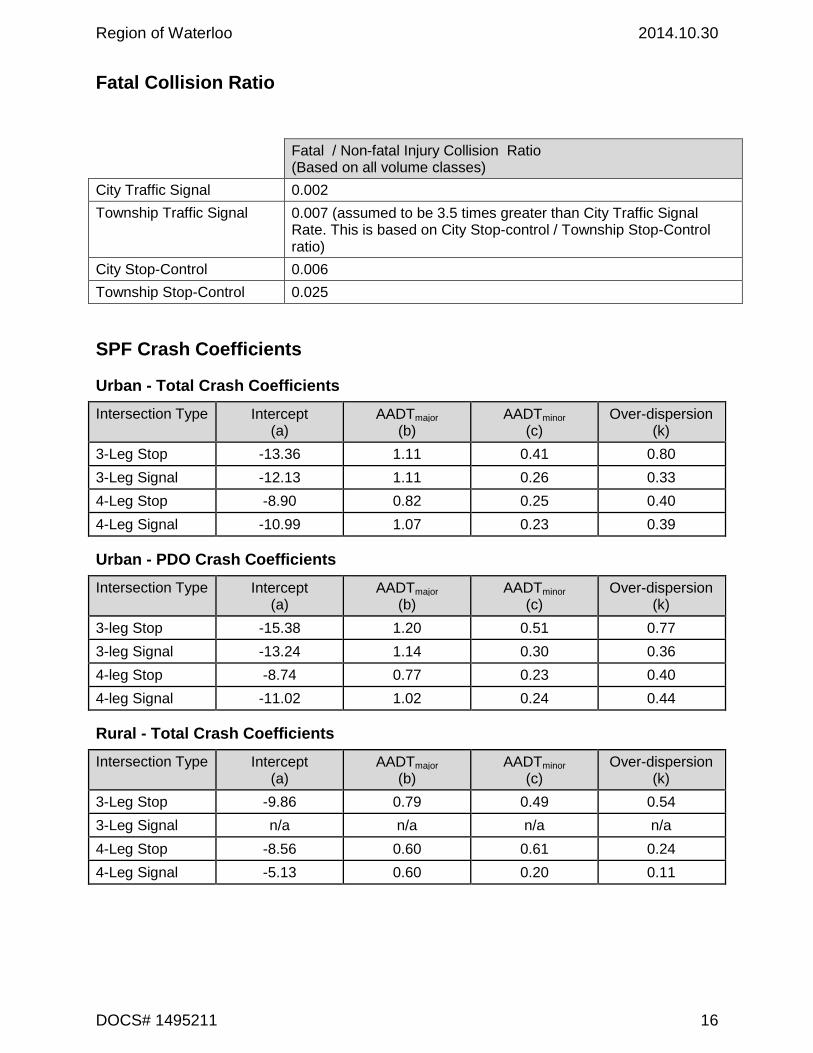
Fatal Collision Ratio
Fatal / Non-fatal Injury Collision Ratio (Based on all volume classes)
City Traffic Signal 0.002
Township Traffic Signal 0.007 (assumed to be 3.5 times greater than City Traffic Signal Rate. This is based on City Stop-control / Township Stop-Control ratio)
City Stop-Control 0.006
Township Stop-Control 0.025
SPF Crash Coefficients
Urban - Total Crash Coefficients
Intersection Type Intercept (a)
AADTmajor (b)
AADTminor (c)
Over-dispersion (k)
3-Leg Stop -13.36 1.11 0.41 0.80
3-Leg Signal -12.13 1.11 0.26 0.33
4-Leg Stop -8.90 0.82 0.25 0.40
4-Leg Signal -10.99 1.07 0.23 0.39
Urban - PDO Crash Coefficients
Intersection Type Intercept (a)
AADTmajor (b)
AADTminor (c)
Over-dispersion (k)
3-leg Stop -15.38 1.20 0.51 0.77
3-leg Signal -13.24 1.14 0.30 0.36
4-leg Stop -8.74 0.77 0.23 0.40
4-leg Signal -11.02 1.02 0.24 0.44
Rural - Total Crash Coefficients
Intersection Type Intercept (a)
AADTmajor (b)
AADTminor (c)
Over-dispersion (k)
3-Leg Stop -9.86 0.79 0.49 0.54
3-Leg Signal n/a n/a n/a n/a
4-Leg Stop -8.56 0.60 0.61 0.24
4-Leg Signal -5.13 0.60 0.20 0.11

Region of Waterloo 2014.10.30
DOCS# 1495211 17
Rural - PDO Crash Coefficients
In rural areas PDO Collisions are determined by factoring total collisions (calculated
using the crash coefficients above) based on the following formula:
Where is a PDO Factor taken from the table below:
Intersection Type PDO Factor
3-Leg Stop 0.585
3-Leg Signal n/a
4-Leg Stop 0.569
4-Leg Signal 0.660
Collision Modification Factors
Left-turn Lane Collision Modification Factors for Intersections (CMF)
City Approaches with left-turn lanes
Intersection Type Traffic Control 1 2 3 4
3-Leg Intersection
Minor road stop control
0.67 0.45
Traffic Signal 0.93 0.86 0.80
4-leg Intersection
Minor road stop control
0.73 0.53
Traffic Signal 0.90 0.81 0.73 0.66
Township Approaches with left-turn lanes
Intersection Type Traffic Control 1 2 3 4
3-Leg Intersection
Minor road stop control
0.56 0.31
Traffic Signal
4-leg Intersection
Minor road stop control
0.72 0.52
Traffic Signal 0.82 0.67 0.55 0.45

Region of Waterloo 2014.10.30
DOCS# 1495211 18
Right-turn Lane Collision Modification Factors for Intersections (CMF)
City Approaches with right-turn lanes
Intersection Type Traffic Control 1 2 3 4
3-Leg Intersection
Minor road stop control
0.86 0.74
Traffic Signal
4-leg Intersection
Minor road stop control
0.86 0.74
Traffic Signal 0.96 0.92 0.88 0.85
Township Approaches with right-turn lanes
Intersection Type Traffic Control 1 2 3 4
3-Leg Intersection
Minor road stop control
0.86 0.74
Traffic Signal
4-leg Intersection
Minor road stop control
0.86 0.74
Traffic Signal 0.96 0.92 0.88 0.85
Presence of Illumination CMF
City Location
Intersection Type Traffic Control City Township
3-Leg Intersection
Minor road stop control
0.91 0.91
Traffic Signal 0.91 0.90
4-leg Intersection
Minor road stop control
0.91 0.91
Traffic Signal 0.91 0.89
Presence of Fully-Protected Left-turn (FPLT) Signal Phase Operation CMF
Approaches with FPLT
1 2 3 4
0.94 0.88 0.83 0.78

Region of Waterloo 2014.10.30
DOCS# 1495211 19
SPF Calibration Factors
The method by which these calibration factors are determined is being further
developed and refined. Please ensure you have the most recent values for your
analysis.
Urban and Suburban Rural
Intersection Type
Stop Controlled Signalized Stop Controlled Signalized
3-Leg Intersection
0.61 1.59 0.47 n/a
4-leg Intersection
0.84 2.10 0.42 0.64