Embed Size (px)
Citation preview

Collision Cross Section:Ideal elastic hard sphere collision:
221 )( rr
Where is the collision cross-section
21
21 )(
rr
Where is the collision distance
These equations negate potential interactions between the two molecules (atoms), attractive and repulsive, and assume spherical geometry.
r2r1

Motion in an Applied Field(Maxwellian ions)KEv d
meK
vd=drift velocity(cm/sec)
K=mobility(cm2/Vsec)
E=applied field (V/cm)Langevin Equation:
Assumptions: ignoring coulombic interaction,Low field limit, close to thermal equilibrium.
e=ionic charge(Volts)=mean free path(m)

We then arrive at the Nernst-Townsend-Einstein Equation, sometimes referred to as the Einstein relation:
TkqDK
b
The main assumption of the Einstein relation is that mobility theory (motion acting on one species, but not the other) and diffusion theory are at equilibrium. Wannier no longer assumed that the applied field was weak and the ion mass was small.
qKE
MmMmm
qTkKD b
32
908.13
qKE
MmMmm
qTkKD b
32
|| 908.172.3
3

At this point we can solve the resolution using either the Einstein relation or Wannier’s relation. We will see from some of the future results that the maximum resolution is attained from systems that fit the Einstein relation. So, if we solve the resolution equation in terms of the Nernst-Townsend-Einstein equation:
o
b
KEL
qTKk
LR32.3
Simplifies to for single charges ions:
TLER o33.32
(2.8)
(2.9)

qKE
MmMmm
qTkKD b
z
32
908.172.3
3
MmMmm
w 908.12.3
3
2232.3 KETkqKtER
wb
d
Taking Wannier’s relation in the z direction:
Simplify the mass term in the relation:
Resolution for a broader range of fields:

0.00
0.05
0.10
0.15
0.20
0.25
0.30
0.35
0.40
0 2 4 6 8 10KO
(cm2/Vs)
Diff
usio
n (m
2 /s)
Wannier Relation, 15cm Drift Cell1 Torr
E=50V/cm
E=20V/cm
E=10V/cm
Nernst-Einstein Relation
0
10
20
30
40
50
60
0 5 10 15 20 25 30
KO(m2/Vs)
Res
olut
ion
E=50V/cm
E=20V/cm
E=10V/cm
Comparison of Reduced Mobility vs. Resolution1 Torr, 15cm Drift Cell

EI Source
Drift Cell
Liq. Flow Collar
4 ElementElectrostatic Lens
ChanneltronDetector
TOF Detector
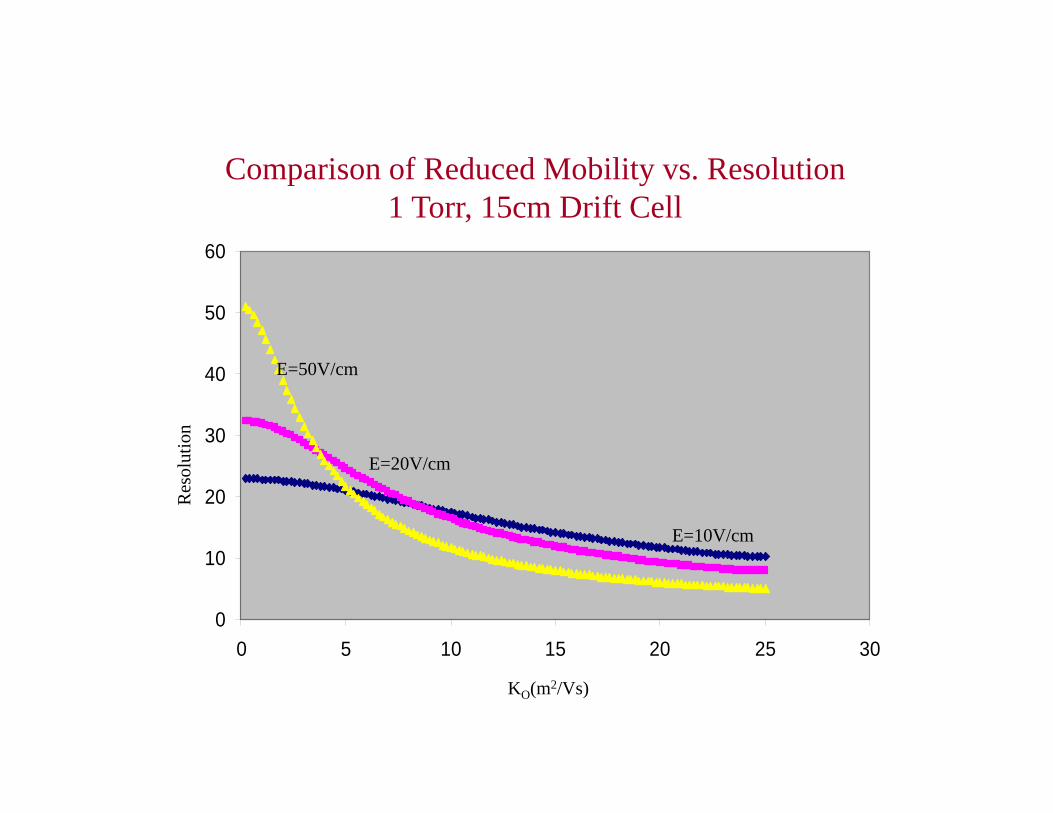
200 400 600 800 1000 1200 1400 1600
950
900
850
800
750
700
650
600
550
500
450
peptide line
carbon clusterline
Arrival Time (Ion Mobility) us
m/z

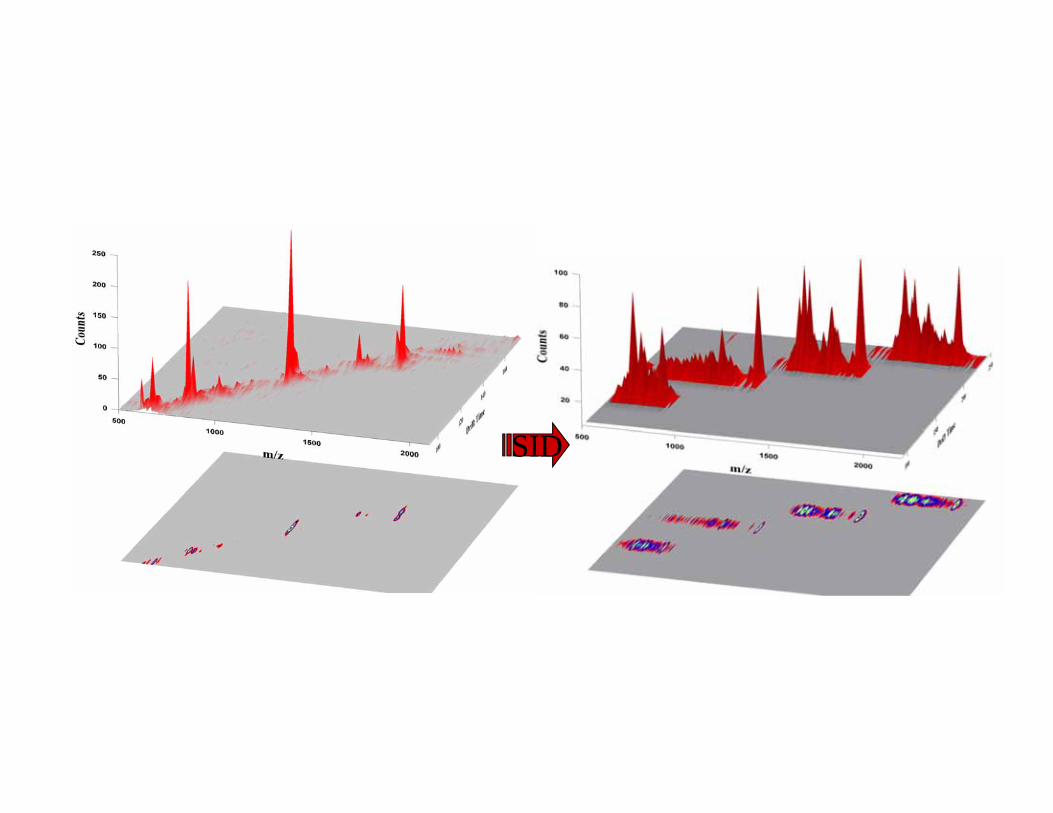
SID


Source Region
Drift Region
d = drift length
(Acceleration Region)E = V/d
E = 0
Time-of-Flight (TOF)
Es
Detector

2
21 mveV Kinetic Energy given to the Ion in the Source Region
21
2
meVv Solving for Velocity
tdv Solve for Flight Time d
eVmt
21
2
So, with a constant acceleration voltage and a known drift length, the drift time is proportional to the square root of the mass to charge ratio (m/e).
Time-of-Flight (TOF)

Time-of-Flight (TOF)
Mass spectrometrists define resolution as:
mm
In TOF we start from the drift time equation:
22
2 tdeVm
And the derivative is: tdt
deVdm 22
2
So,
dtt
dmm
2
So time-of-flight resolution is defined by:
tt
mmR
2
t is usually defined a peak width at half height.
zELR

Why is resolution so important?

2428.0 2435.2 2442.4 2449.6 2456.8 2464.0Mass (m/z)
5046.1
0
10
20
30
40
50
60
70
80
90
100
% In
tens
ity
Voyager Spec #1[BP = 1395.8, 5907]2452.2063
2453.1960
2454.1958
2435.1855
2434.1841
2451.20612436.18022455.1926

Time-Lag Focusing
Es Ea
Detector
E=0Field Free Drift Region
Low draw out voltageTo correct for randomDistribution of ion energy.Ex. ~300V
Acceleration region

r
ro
orr 148.1
22
8
o
yx mreUaa
22
4
o
yx mreVqq
Linear Quads
21
oz rL
ER

Quad Ion Traps
0
21
)2( 2222 zyx
ro
o
Transform into cylindrical coordinates:
)2sincos( 222222 zrr
ro
o )1sin(cos 22
)2( 222 zr
ro
o Geometrical constraints:
22 2 oo zr
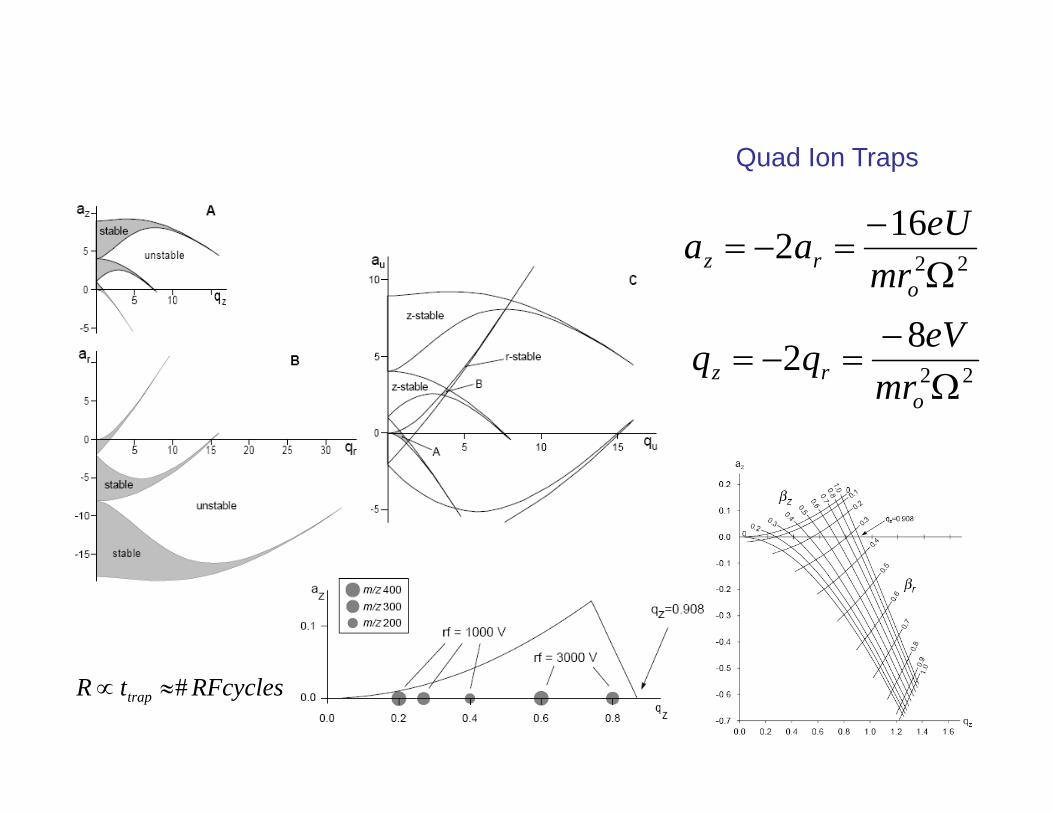
Quad Ion Traps
22
162
orz mr
eUaa
22
82
orz mr
eVqq
RFcyclestR trap #

Ion Motion in a Static Magnetic Field:
)(
BvqFLorentzian Force:
)(
Bvqam
Lets take a constant magnetic field in the direction z:
•The cross product states that the particles acceleration is always orthonormal to the direction of the magnetic field.
•This will be true even if B varies with position (r), but will change if B varies with time (t).
oBkB
Unit vector in the z-direction (k).
100)( zyxo vvv
kjiqBBkvqam
(1.1)
(1.2)
(1.3)
(1.4)

Cyclotron Motion:
rvxy Angular velocity
Substitute angular velocity:
rqBrm o 2
Simplify into the celebrated “ion cyclotron equation”:
mqBo
•This equation is the heart of ICR. It tells us that the cyclotron frequency is independent of the ions initial velocity, and all ions with the same mass/charge (m/q) will have the same frequency.
(2.5)
(2.6)
(2.7)

Cyclotron Motion:
BO
Z
X
Y
+•We can see from our equations that cations will cyclotron counter-clockwise to the in-the-plane magnetic field direction, while anions will cyclotron clockwise
100
1000
10000
100000
1000000
10000000
100000000
1000000000
1 10 100 1000 10000 100000m/z
v(Hz
)
3.0
7.0
9.4
20.0


Upper Mass Limit in FT-ICR MS:
Note: Magnetron motion and cell shapes:
TVBa
qm
4
22
So in a 7T field in a cylindrical trap of 2cm radius the mass limit will be about 250 kD.

Hitachi M8000 LC/MSn
QStar

ESI

38
Multidimensional Analyses
time
response
chromatogram
m/zm/z
m/z

39
Collision induced dissociation
• Collision conditions (FRAGMENTATION) is controlled by altering:
– The collision energy (speed of the ions as they enter the cell)– Number of collisions undertaken (collision gas pressure)
Argon gas
O
O
CH3
CH3CH3
Precursor ion Product ions
OCH
2
CH2
CH3
O
CH3
CH3
• In the collision cell, the TRANSLATIONAL ENERGY of the ions is converted to INTERNAL ENERGY.
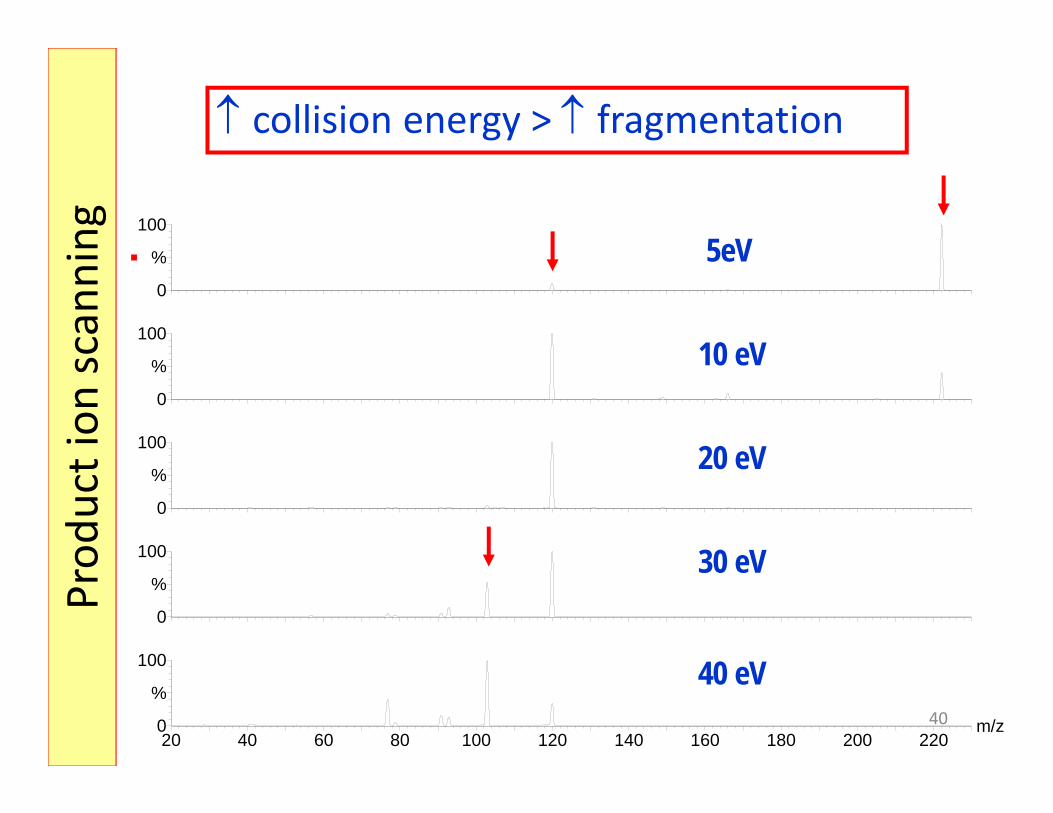
4020 40 60 80 100 120 140 160 180 200 220
m/z0
100
%
0
100
%
0
100
%
0
100
%
0
100
% 5eV
10 eV
30 eV
40 eV
20 eV
collision energy > fragmentationProd
uct ion
scanning

41
Product Ion Spectrum: Progesterone
300 305 310 315 320 325 330m/z0
100
%
315.1
316.1
Mass Spectrum from MS1
100 125 150 175 200 225 250 275 300 325m/z0
100
%
109.097.0
Product ion spectrum from MS2Prod
uct ion
scanning
Product ions
OCH
2
CH2
CH3
O
CH3
CH3
O
O
CH3
CH3CH3
Precursor ion

42
Sirolimus: MS Spectrum
790 795 800 805 810 815 820 825 830 835 840 845 850m/z0
100
%
821.5
810.5
822.5
826.5
827.5[M+H]+
[M+NH4]+
[M+Li]+
[M+Na]+
[M+K]+
Full Scan
Acquisition Mod
e

43
Sirolimus:LC-MS (SIM) vs LC-UV
0
100
%SIR m/z 821
30µg / L
1.5 min
HPLC‐UV
HPLC‐MS
Single ion mon
itorin
g (M
S)

44
Sirolimus: MS Spectrum
790 795 800 805 810 815 820 825 830 835 840 845 850m/z0
100
%
821.5
810.5
822.5
826.5
827.5[M+H]+
[M+NH4]+
[M+Li]+
[M+Na]+
[M+K]+
Full Scan
Acquisition Mod
e

45
MS1 MS2CollisionCell
Static (m/z 821.5) Scanning
The first quadrupole mass analyzer is fixed, or Static, at the mass-to-charge ratio (m/z) of the precursor ion to be interrogated while the second quadrupole is Scanning over a user-defined mass range.
The first quadrupole mass analyzer is fixed, or Static, at the mass-to-charge ratio (m/z) of the precursor ion to be interrogated while the second quadrupole is Scanning over a user-defined mass range.
Ar (2.5 – 3.0e-3mBar)Ar (2.5 – 3.0e-3mBar)
PrecursorPrecursorProductsProducts
Prod
uct ion
scanning

46
790 795 800 805 810 815 820 825 830 835 840 845 850m/z0
100
%
821.5
810.5
822.5
826.5827.5
Mass spectrum from MS1Mass spectrum from MS1
200 250 300 350 400 450 500 550 600 650 700 750 800 850 900m/z0
100
%
768
576
558548718 750
786821
Product ion spectrum from MS2Product ion spectrum from MS2
Prod
uct ion
scanning
NH4+

47
MS1 MS2CollisionCell
Static (m/z 821.5) Static (m/z 768.5)
Ar (2.5 – 3.0e-3mBar)Ar (2.5 – 3.0e-3mBar)
Precursor(s)Precursor(s)Product(s)Product(s)
MS/MS : Compound‐Specific Monitoring
Multip
le Reaction Mon
itorin
g
48
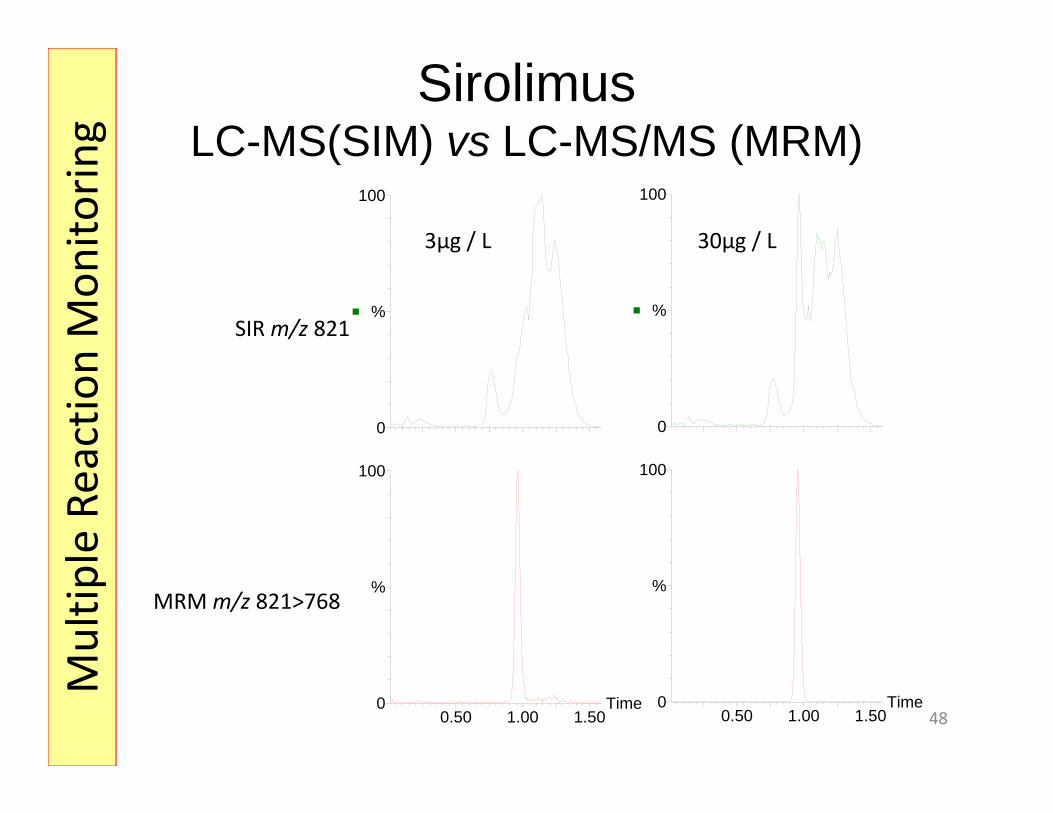
SirolimusLC-MS(SIM) vs LC-MS/MS (MRM)
SIR m/z 821
0.50 1.00 1.50Time0
100
%
0
100
%
0.50 1.00 1.50Time0
100
%
0
100
%
MRM m/z 821>768
3µg / L 30µg / L
Multip
le Reaction Mon
itorin
g


Amino Acid 3 Letter Code Single Letter Code Residue Mass
Monoisotopic Average
Glycine Gly G 57.02147 57.052
Alanine Ala A 71.03712 71.079
Serine Ser S 87.03203 87.078
Proline Pro P 97.05277 97.117
Valine Val V 99.06842 99.133
Threonine Thr T 101.04768 101.105
Cysteine Cys C 103.00919 103.144
Isoleucine Ile I 113.08407 113.160
Leucine Leu L 113.08407 113.160
Asparagine Asn N 114.04293 114.104
Aspartic Acid Asp D 115.02695 115.089
Glutamine Gln Q 128.05858 128.131
Lysine Lys K 128.09497 128.174
Glutamic Acid Glu E 129.04260 129.116
Methionine Met M 131.04049 131.198
Histidine His H 137.05891 137.142
Phenylalanine Phe F 147.06842 147.177
Arginine Arg R 156.10112 156.188
Tyrosine Tyr Y 163.06333 163.170
Tryptophan Try W 186.07932 186.213
Homoserine Lactone 83.03712 83.090
Homoserine 101.04768 101.105
Pyroglutamic acid 111.03203 111.100
Carboxyamidomethyl Cysteine 160.03065 160.197
Carboxymethylcysteine 161.01466 161.181
Pyridylethylcysteine 208.06703 208.284

Peptide Fragmentation

Peptide Fragmentation