Embed Size (px)
Citation preview

www.colliers.comwww.colliers.com
US Real Estate Review 2007
COLL IERS INTERNATIONAL

Colliers Research Services Group is recognized as a knowledge leader in thecommercial real estate industry, and provides clients with valuable marketintelligence to support business decisions. Colliers researchers provide multi-level support across all property types, ranging from data collection to comprehensive market analysis.
Colliers Research has developed powerful technological tools to provideclients with valuable market intelligence. Our expansive databases housedetailed information on properties nationwide, including historical supply,demand, absorption data, and transaction comparables. Research uses thisinformation to produce quarterly surveys of office and industrial markets in over 70 North American metropolitan areas.
Colliers research reports provide standardized information for each market.Market Highlights reports based upon quarterly surveys include inventory,vacancy, absorption and rental rates in side-by-side comparisons for North American markets as well as quarter-to-quarter comparisons and aggregated national statistics. Investment sales prices and cap rates are reported as well.
Research groups across the country also have expertise in location and site analysis, geographic information systems, and financial modeling. To ensure that our clients’ real estate decisions are thoroughly informed,our researchers perform numerous financial analyses. Options include comprehensive occupancy cost comparisons for potential lease locations and complex lease vs. own scenarios.
The information contained herein has been obtained from sources deemed reliable. While every reasonableeffort has been made to ensure its accuracy, we cannot guarantee it. No responsibility is assumed for any inaccuracies. Readers are encouraged to consult their professional advisors prior to acting on any of the material contained in this report.
COLLIERS RESEARCH

TABLE OF CONTENTS
UNITED STATES REAL ESTATE REVIEW
Letter from the President and CEO 1Letter from the Director of Market and Economic Research 2US Real Estate 3Linking Real Estate to Company Objectives – The Role of Personal Beliefs, Decision Context and Business Integration, Sven Govaars 9
Glossary 72Colliers USA Office Locations 73
US CITY ANALYSES AND FORECASTS
Atlanta, GA 13Bakersfield, CA 14Baltimore, MD 15Boise, ID 16Boston, MA 17Charleston, SC 18Charlotte, NC 19Chicago, IL 20Cincinnati, OH 21Cleveland, OH 22Columbia, SC 23Columbus, OH 24Dallas/Ft. Worth, TX 25Denver, CO 26Detroit, MI 27Ft. Lauderdale/Broward County, FL 28Fresno, CA 29Greenville, SC 30Hartford, CT 31Honolulu, HI 32Houston, TX 33Indianapolis, IN 34Jacksonville, FL 35Kansas City, MO-KS 36Las Vegas, NV 37Little Rock, AR 38Los Angeles, CA 39Los Angeles/Inland Empire, CA 40
Los Angeles/Orange County, CA 41Louisville, KY 42Memphis, TN 43Miami/Dade County, FL 44Milwaukee, WI 45Minneapolis, MN 46Nashville, TN 47New Jersey – Central 48New Jersey – Northern 49New York, NY 50 – 52Oakland, CA 53Orlando, FL 54Philadelphia, PA 55Phoenix, AZ 56Pleasanton/Walnut Creek, CA 57Portland, OR 58Raleigh/Durham, NC 59Reno, NV 60Sacramento, CA 61San Diego, CA 62San Francisco, CA 63San Francisco/San Mateo Peninsula, CA 64San Jose/Silicon Valley, CA 65Seattle/Puget Sound, WA 66St. Louis, MO 67Tampa Bay, FL 68Washington, DC 69 – 70West Palm Beach, FL 71
C O L L I E R S I N T E R N AT I O N A L l U S R E A L E S TAT E R E V I E W 2 0 0 7
www.colliers.com

To our clients and colleagues:
Colliers has long been recognized for its in-depth, forward looking market andeconomic information which provides a valuable vantage point in solvingcomplex real estate challenges. As such, I’m pleased to present the 2007 USReal Estate Review, an analysis of over 55 commercial real estate markets.
In addition to being an acknowledged leader in providing information,Colliers has built a powerful platform for achieving our clients’ goals. Our collaborative affiliation works like no other organization in the industry.We are an owner-managed company, which means that principals of Colliersfirms are deeply involved in our clients’ activities. Colliers is also recognizedwithin the industry as a leader and an innovator. Once again, Colliers hasbeen named to the prestigious Global Outsourcing 100 list of the country’stop outsourcing firms, one of the few commercial real estate firms to receive this honor.
2006 was a very robust year in nearly every commercial real estate market in the United States, and we expect most markets to maintain similar momentum in 2007, although there are increasing signs that economic growthwill be somewhat more sluggish. The labor market is expected to remainhealthy, and we expect commercial rents to rise in many markets as the inventory of available space continues to diminish. The retail sector will continue to drive the southern and western markets, and the appetite for Class A investment sales properties is set to continue unabated. We continueto believe the US real estate market offers many opportunities and we lookforward to helping you take advantage of what we consider very exciting timesfor our industry.
We wish you continued success and hope you enjoy the following report.
Margaret WigglesworthPresident and CEOColliers USA
LETTER FROM THE PRESIDENT
C O L L I E R S I N T E R N AT I O N A L l U S R E A L E S TAT E R E V I E W 2 0 0 7
www.colliers.com 1

LETTER FROM THE DIRECTOR OF RESEARCH
C O L L I E R S I N T E R N AT I O N A L l U S R E A L E S TAT E R E V I E W 2 0 0 7
2
A year ago I wrote how our industry was in store foranother very robust year marked by healthy levels ofleasing, development and investment activity. With 2006 behind us it is now safe to say that we didindeed enjoy a near perfect year, almost goldilocks like,not too hot and certainly not too cold. The vast majority of our projections were spot on with the exception of the investment sales market which wethought would cool, which of course it didn’t and marksthe second consecutive year where we got it wrong. The balance of this year’s letter is to try and explain whyour forecasts were right, and wrong, which will hopefullyshed some light on what we can expect in 2007 and perhaps more importantly what we can expect over thecoming two, three, four and five years – keeping in mindreal estate is a long term investment.
Let me start with what we got wrong. Our year-ago forecast was “With considerable trepidation our 2006forecast is that it (the investment sales market) will cool somewhat from 2005 as pricing appears to be discouraging new investment. This does not mark acomplete withdrawal of buyers from the marketplace butrather sufficient headwinds may now exist to keep someinvestors on the sidelines.” With hindsight it is nowobvious that the weight of money was far in excess of what we thought was the case. A relatively new phenomenon was at work, that being the private capitalcraze that is now prevalent in virtually all investmentarenas, whether it be equities, commodities, infrastructure investment or currencies. This thirst foryield has now reached a fevered pitch. Private capitalwas behind almost every large transaction and through abetter understanding and measurement of risk and moreuse of leverage these groups were able bid up prices tolevels unimaginable even 12 months ago. However, if we strip away some of the large portfolio sales and a few of the high profile Manhattan office transactions,investment actively and pricing did indeed plateau in2006 so at least we can take some comfort that our projections weren’t completely wrong.
If we now focus of what we got right, virtually everyother projection was on target. We anticipated a healthyeconomy, both domestic and global, a reasonably robust
labor market and continued low long-term interest rates.All of these key ingredients added up to healthy leasingmarkets for all the major real estate sectors and a corresponding increase in lease rates with rental spikesin a limited number of markets. Construction, as anticipated increased, but still not to dangerous levels.
Again, with hindsight this now appears somewhat obvious but as is always the case the future is never easyto forecast. Our view of the coming 12 months, andindeed for the next few years, is the real estate marketwill be the recipient of a relatively buoyant economyagainst still modest amounts of new construction. This does not mean certain markets will get overbuilt,but for the nation as whole we are not headed towardsan oversupply situation. An abundance of capital andrecord high sales prices normally leads to developmentbut many of the markets with these characteristics alsohave significant barriers to entry. Rising constructioncosts and a more difficult entitlement process will alsoslow development.
Against this rosy outlook are the usual concerns.Geopolitical issues, terrorism, an energy crisis, a hedgefund crisis, a debt crisis, a China crisis and the list goeson. The point to keep in mind is many of these possibleevents have been with us for some time, but the globaleconomy is experiencing a period of rapid growth almostunmatched in history. Federal regulators both here andabroad are far better equipped to keep the global economy chugging a long and in many respects theUnited States is better positioned to take advantage ofthis rapidly growing global economy than ever before.Real estate markets will ebb and flow over the comingyears but the general direction will be up as businessestake advantage of the many opportunities that are sureto come their way. The road ahead no doubt offersmany opportunities, but as always, keeping your eye onwhat could go wrong is always the best policy. We hopeyou enjoy this year’s Colliers US Real Estate Review.
Ross MooreSenior Vice President, Director of Market & Economic [email protected]
U.S. Real Estate Still Looks Like a Good Bet – With the Usual Caveats

www.colliers.com 3
US REAL ESTATE
C O L L I E R S I N T E R N AT I O N A L l U S R E A L E S TAT E R E V I E W 2 0 0 7
OfficeThose expecting a significant cool down in the officemarket were largely disappointed as demand for officespace remained relatively robust in 2006. To the surpriseof some, the year was characterized by significantly higheroffice rents although this was mostly the case in downtownmarkets. Though higher rents were anticipated, the sudden jump reflected sufficient tightening in a handfulof markets rather than a surge across all markets thatpushed up the national average. Still, rents are destinedto continue rising, with no downturn in sight. Office space is sure to become more expensive as demandremains strong, and supply relatively lean. Upcoming newconstruction deliveries could alter the course slightly as2007 plays out but for the immediate term more andmore markets will offer few alternatives for tenants.
A Quick Review of 2006Vacancy rates fell further in 2006 to finish the year at 12.56% down 103 basis points over the prior year’s13.59%. Vacant available sublease space moved marginally lower to 9.9% of total vacant space.Downtown and suburban markets both showed improvement during the year with the Central BusinessDistrict (CBD) vacancy rate falling to 11.50%, and non-CBD markets recorded vacancy at 13.08%.Absorption also followed suit with a fairly robust year,ending on a particularly high note with full year
downtown occupied space increasing by 32.3 millionsquare feet (MSF), and suburban office 63.1 MSF. These levels easily topped the ten year average of 70.5 MSFwith full year occupied space increasing by 95.4 MSF,which exceeded Colliers’ 90 million square feet forecast.
For the third consecutive year asking rents continued toclimb for downtown Class A space, while suburban ClassA space registered a second year of positive growth.Downtown Class A rents in particular increased duringall four 2006 quarters, with a substantial spike in thefourth quarter to $41.01 per square foot, a 6.6% rise.Comparatively, suburban Class A lease rates rose 3.6%to $25.83. For the year, downtown rents marked a substantial 18.2% increase over 2005, and suburbanrents registered 7.4%.
Construction activity continued unabated, with 2006bringing 58.6 million square feet of new space to themarket. This marked a substantial rise over 2005’s 46.7million square feet. The trend appears to be spillingheadlong into 2007 as evidenced by the amount of spacecurrently under construction. At year-end constructionactivity clocked 106.9 million square feet compared with73.2 million square feet at year-end 2005.
Executive SummaryU.S. real estate markets enjoyed yet another banner year and look set to put in a similar performance in 2007. A combination of healthy, but more importantly, sustainable economic growth and low long-term interest rates madealmost all forms of income producing real estate very attractive to investors. An abundance of capital, both debt andequity, continued to support record levels of investment transactions and valuations that even just a few years agoseemed in-comprehensible.
Office assets remained the most sought after, but industrial and retail were not far behind and multi-family was quicklyregaining its position as favored property type particularly amongst smaller investors. The coast markets remained highlysought after by a wide spectrum of investors including off-shore, institutional and perhaps most importantly private equity investors who continue to push up prices in these very liquid and dynamic markets.
Two trends worth watching were the rapid growth in “green” buildings, “green” leasing and “green” development andsecondly the substantial transfer of ownership from public to private hands. The “privatization” of real estate is discussedin detail in the following pages, but the trend towards green or sustainable development is something we have begun to monitor as all aspects of real estate are beginning to be affected by this global movement towards addressing globalwarming or climate change depending on your point of view.

C O L L I E R S I N T E R N AT I O N A L l U S R E A L E S TAT E R E V I E W 2 0 0 7
IndustrialThe industrial market closed 2006 on a slightly lowernote but the overall trend was still largely positive.Construction activity continued to push higher withcompletions anticipated to outpace demand as 2007unfolds. Industrial rents overall rose steadily during2006 increasing by 6.0% over the year with a similarincrease expected over the next 12 months.
The NumbersAbsorption for the year fell short of anticipated levels tototal 183.6 million square feet, somewhat shy of Colliers’projected 200 million square feet. This marked a substantial 17.6% drop over 2005’s 222.8 million squarefeet. Looking closer, the fourth quarter slide to just 36.9million square feet, down from the third quarter’s 48.4million square feet, and 20.6 million square feet lessthan year-end 2005, illustrated a substantial slowdown at year-end. The disappointing fourth quarter ended astring of robust quarters going back to 2004, whereabsorption had remained between 40 and 60 millionsquare feet.
New construction however, still crept upward registering184.1 million square feet for the year, a rise of
39.6 million square feet over 2005 levels. Quarterly numbers for new construction hovered around 50 million square feet. At year-end, new constructiondropped slightly to 48.8 million square feet from 49.4 million square feet in the third quarter. Still construction activity is expected to remain elevatedthroughout 2007. This was already impacting industrialvacancy rates with the fourth quarter seeing rates bumpupward for the first time in eleven quarters. The twobasis point rise left rates at 8.21% at year-end, the firstincrease since the first quarter of 2004. This rise wasanticipated, due to relatively high levels of constructionactivity and may suggest the low point for vacancy ratesin this cycle may now have been reached.
However, industrial rents forged ahead despite highervacancy and new availability. At year-end rents registered $5.28 per square foot, a 6% rise over year levels, and the highest level in four years. The most significant rent increases occurred in the second andthird quarters, with a marginal rise of 0.38% in the fourth.
Outlook 2007The slowing housing sector and a cutback in productionby the big three automakers foreshadows a mixed
Outlook 2007Demand for office space in 2007 is expected to almostmatch the robust levels seen in 2006 despite a softeningeconomy. The financial, professional, and business services sectors will again lead leasing activity. Rents areanticipated to increase significantly with central businessdistrict (CBD) lease rates set to jump 12 to 15 percent,due to several factors. Some of the rise is due to healthydemand and still only modest amounts of new construction, but spikes in expenses such as insurance,maintenance and property taxes also play a part. Indeed, four markets: Midtown Manhattan, San Francisco,Chicago and Seattle are expected to see rents rise byover twice the national average. Suburban rents will alsorise but at a more modest rate of five to seven percent.
Office construction is anticipated to jump 25 percentand should ultimately total approximately 75 millionsquare feet. Absorption is expected to remain flat, ordrop slightly to 90 to 95 million square feet, comparedwith 95 million square feet in 2006. The anticipatedrise in new construction will take the pressure off tenants, though demand is expected to remain strong for some time with the national vacancy rate remainingsteady with just half a percent decline to 12.5 percent by year-end 2007 at the outside.
4
DOWNTOWN OFFICE
Inventory New Absorption Vacancy Class A(SF) Supply (SF) (SF) Rate (%) Rent ($PSF)
1999 1,230,562,000 12,040,000 17,507,400 8.4 36.812000 1,370,397,508 15,689,000 27,008,000 7.5 42.832001 1,402,263,508 11,416,000 -51,353,000 11.8 38.102002 1,464,575,508 19,993,000 -18,255,000 14.3 33.202003 1,484,411,508 16,701,000 3,839,000 14.9 32.002004 1,521,648,508 9,946,000 14,311,000 14.4 33.252005 1,533,449,508 11,801,000 29,022,000 13.1 34.692006 1,545,443,508 11,994,000 32,282,000 11.5 41.01
Source: Colliers Research Services
SUBURBAN OFFICE
Inventory New Absorption Vacancy Class A(SF) Supply (SF) (SF) Rate (%) Rent ($PSF)
1999 2,385,032,000 113,452,000 88,330,000 10.0 26.532000 2,528,431,000 96,757,000 161,931,000 9.4 27.232001 2,838,532,000 114,955,000 -20,070,000 14.5 26.402002 2,979,709,000 70,243,000 -9,376,000 16.8 23.902003 3,024,817,000 38,617,000 21,830,000 17.2 23.602004 3,086,602,000 36,177,000 65,268,000 15.7 23.482005 3,119,305,000 33,491,000 75,703,000 13.7 24.042006 3,169,448,000 46,571,000 63,088,000 13.1 25.83
Source: Colliers Research Services

5
Retail Despite a year-end slump, retail sales grew by 6.0% in2006, and excluding motor vehicles and parts, that number jumps to 7.3%. Despite a soft finish for the year,2007 is anticipated to be another good year for retailersas the economy is set to post steady growth.
The Retail LandscapeThe retail landscape remained relatively benign withmarket fundamentals favoring neither retailers nor landlords. As is always the case, the demand side continues to change as consumer’s tastes change and onthe supply side, construction continues to move awayfrom large regional centers to lifestyle and urban infilldevelopment. Relative equilibrium continues to be thecase with only a limited number of exceptions.
For owners and developers of retail real estate the twomost pressing issues remain finding land available fordevelopment and second how the American consumerwill react to a pullback in the housing market and theresulting psychological “loss of wealth.” Added on top of this were high debt levels, which restrict furthergrowth in retail sales. Important to keep in mind, however, is continued healthy job creation, rising wages and still relatively low short-term and long-terminterest rates. The combined effect will leave retail salesgrowth at levels similar to that experienced in 2006 but
a more uneven retail landscape with more pronouncedwinners and losers.
Outlook 2007Looking ahead, all the gloom and doom talk about aslowing economy led by a slump in housing, plus themuch-publicized difficulties in the auto sector, mayprove much ado about nothing. The combined Januaryand February job reports were surprisingly good, theConference Board’s consumer confidence index hit a 56-month high, and the forecast is favorable for mostretail sectors.
Apparel sales should match 2006’s growth of 6.0% andFood Services along with Drinking Places are expectedto register another strong year, though may fall slightlyshy of 2006’s 8.1% growth. Spending trends seen overthe last several years, are expected to continue through2007 with the anticipated winners likely to remain discount retailers, luxury retailers, and lifestyle stores.Retailers such as Costco, Target, Nordstrom’s, NeimanMarcus, Starbucks and a multitude of restaurant groupsare the probable beneficiaries of both macro economicand demographic trends, which only show signs of persisting. This relatively healthy backdrop for retaillandlords will help to keep occupancies at healthy levelsand push lease rates upward.
upcoming year. Conversely, distribution should remain robust due to a rising trade sector and ensuingtransportation activity, plus manufacturing is expected to stay relatively buoyant through the year.
Industrial rents are again anticipated to increase in2007. A predicted 10 percent rise or $0.50 per squarefoot hike is likely on the way, with some of this increasedue to a higher percentage of first generation space listed for lease.
Absorption is not expected to keep pace with new supply, which will leave the year-end 2007 vacancy rateup a quarter of a percent, registering approximately8.5%. This will be the first increase since 2003. Still, steady absorption of on average 40-50 millionsquare feet per quarter is expected, as growing domesticand global economies will sustain strong leasing activity.
The main concern for forward-looking investors is construction. Both completions and projects under construction have been on the rise since 2005.Construction activity is expected to remain robust,
with an anticipated 15% increment over 2006 levelswith the year-end totals reaching approximately 205 million square feet. At year-end construction activity was up 25% relative to year-end 2005, so it isreasonable to expect a similar increase in completionsfor the year ahead. Such levels will likely leave 30 million square feet of excess space given currentdemand, triggering a rise in vacancy.
INDUSTRIAL
Inventory New Absorption Vacancy Warehouse Land(SF) Supply (SF) (SF) Rate (%) Rent ($PSF) ($PSF)
1999 8,981,911,000 201,510,000 177,676,000 6.8 4.81 3.382000 9,602,904,000 203,695,000 212,717,000 6.3 5.51 3.502001 9,954,236,000 221,336,000 6,312,000 8.9 4.90 4.74200210,692,426,000 129,084,000 13,016,000 10.1 4.63 4.82200310,793,452,000 101,027,000 84,917,000 10.1 4.72 5.96200410,973,029,000 131,822,000 193,883,000 9.5 4.74 6.17200511,115,743,000 154,433,000 242,905,000 8.4 5.00 8.03200611,335,815,000 184,853,000 183,571,000 8.2 5.28 9.94
Source: Colliers Research Services

C O L L I E R S I N T E R N AT I O N A L l U S R E A L E S TAT E R E V I E W 2 0 0 7
A two-tier market may ultimately emerge, where primestrips and high-end centers will enjoy strong sales andhealthy occupancies while more average properties willexperience only modest growth. Tourism fueled retailmarkets such as; Midtown Manhattan, San Francisco,Los Angeles, Chicago, Las Vegas and Honolulu areexpected to flourish with record rental rates.
The biggest success stories in the coming year are likelyto be high-end retailers and those with a strong brandimage, as well as apparel retailers, which should alsohave a solid year. Overall, owners of retail real estate canexpect another solid year, similar to 2006 – with steadyoccupancies and a 3-4 percent increase in rents.
Investment SalesNew investment capital continued to find a home inreal estate continuing a five-year trend. Though a slumphad been predicted for 2006, as the year unfolded, itbecame apparent the investment market would stayrobust for some time to come. Clearly, investorsremained attracted to real estate because of tighteningleasing markets and rising rents. This was reflected in a number of prime office buildings selling for theunprecedented level of over $1,000 per square foot.
In 2006 investment sales volume totaled $310 billion, adouble-digit increase of 11%. As predicted, long-terminterest rates remained steady and institutional investorscontinued to increase their real estate portfolios whenever and wherever possible. Rising constructioncosts and the increasingly difficult entitlement processremained favorable trends for the investment market.
Securitizing Begs PrivatizingOne of the major themes running throughout 2006 and into 2007 was the velocity of portfolio sales and privatizations. Most of the 11% rise in transaction
volume came through privatizations, which rose dramatically, from $7 billion in 2005 to $29 billion in2006. Even though portfolio sales garnered significantattention during the year, the year-end total of $52 billion was unchanged from 2005 levels. Still, therewas a massive abundance of capital, on both the debtand equity side, resulting in a blizzard of privatizations.Private investors seized the opportunity to arbitrage thepricing differential between the public and private markets. These portfolios or real estate companies,mainly listed on NYSE, were bought outright; privatecapital came in and purchased the whole companyrather than just the property. Upon taking ownership,many properties were then sold off, often with a substantial profit.
Historically, real estate has been a very inefficient market but over the last 15 years it has been securitized,and as a result it is now far more transparent. It hasbeen a natural evolution beginning with the savings and loans crisis of the early 90’s. Out of that downturncame real estate investment trusts, or REITs, and also apublic debt market, the commercial mortgage backed
6
YEAR-TO-DATE SALES ENDING DECEMBER 2006 2005 % CHANGE
All Stores 4,364,542 4,115,815 6.0%Motor Vehicle and Parts Dealers 909,127 895,250 1.6%Gasoline Stations 425,166 388,261 9.5%Food and Beverage Stores 544,581 519,292 4.9%Grocery Stores 482,797 463,905 4.1%Health and Personal Care Stores 224,341 208,376 7.7%Building Material and Garden Equipment Stores 355,002 326,993 8.6%General Merchandise Stores 553,191 525,726 5.2%Department Stores (excluding leased departments) 212,799 214,658 -0.9%Clothing and Accessories Stores 214,009 201,682 6.1%Furniture, Home Furnishings, Electronics and Appliance Stores 227,701 211,733 7.5%Furniture and Home Furnishing Stores 120,201 111,293 8.0%Electronics and Appliance Stores 107,500 100,440 7.0%Sporting Goods, Hobby, Book and Music Stores 86,684 81,853 5.9%Miscellaneous Store Retailers 118,833 111,001 7.1%Nonstore Retailers 277,064 249,011 11.3%Food Services and Drinking Places 428,843 396,637 8.1%
Source: US Census Bureau.All Values are expressed in millions of US dollars and are not seasonally adjusted.
7
securities market, or CMBS. Though 15 years in themaking, what is new is the enormous amount of privateequity targeting these public real estate vehicles with theintent of returning ownership to private hands.
Returning to the issue of transparency, these privateequity investors are very much aware that the tremendous abundance of readily available research anddata inherent in the securities market allowed risk to be more easily identified, and measured. In today’sinvestment world it is the ability to measure risk thatallows investors to pay prices that seemingly make littleor no sense. Investors and experts now measure risk in ways many people find difficult to comprehend. The result is prices that to many in the commercial real estate industry can’t make sense.
Examples of private equity transactions include the threetop portfolio sales in 2006. Trizec Properties was boughtby Blackstone Investors and Brookfield Properties for$7.2 billion, CarrAmerica sold for $5.6 billion, toBlackstone Investors and Tishman Speyer, and BeaconCapital Partners, went for $3.3 billion to Broadway RealEstate Partners. Also, following year-end 2006,Blackstone Investors acquired Equity Office Propertiesfor $39 billion including debt. The trend is clear – realestate is undergoing a change in ownership, transferringfrom public markets to private ownership, all driven bythe glut of investment capital available worldwide.
Real estate is now experiencing a whole new buyergroup and these private equity investors have a tremendous amount of capital to draw on. A new chapter in real estate investing is in progress, as privateequity is quickly becoming the most dominant force inreal estate investing. It was reported private equityinvestors poured nearly $60 billion into real estate fundsin 2006, with early indication that this was a record, butthe figure could be surpassed in 2007 if the funds raisingcapital for real estate meet their aggregate target: $80billion. Groups such as Blackstone were understood tobe raising a $10 billion fund and Morgan Stanley wasraising an $8 billion fund. And Lone Star was rumoredto be raising a $6 billion fund.
However, this trend also signifies a marked move towardless inefficiency in the overall market, which could spelldisappointment for more average investors. All this efficiency and transparency ultimately may mean it will become much more difficult to make super-normalprofits. So while real estate has returned to its place as a viable investment alternative for institutional investorsand offshore buyers, smaller investors could see dwindlingprofit margins as price discrepancies become more rare.
Cap Rates PlateauAfter coming down during the 2002-2005 period, caprates finally plateaued. With hindsight it is fair to saycap rate compression peaked in late 2005. Cap ratesremained steady through 2006, with numbers changingjust a couple of basis points.
Office cap rates, both CBD and suburban, finished the year up just 10 basis points to 7.0% and 7.6% respectively. Warehouse cap rates also increased duringthe year, increasing by 20 basis points to 7.1%. R&D caprates, however, bucked the trend, dropping by 20 basispoints to 7.6%. Cap rates for retail as demonstrated by neighborhood centers held steady at 6.8% whilemulti-family cap rates fell by 10 basis points to 6.20%.Many investors realized that with the privately ownedresidential market slowing, would-be buyers might opt to rent, making multi-family a strategic option. As apartment buildings fill up, owners can hike rents,allowing them to pay more with the anticipation of rising rent rolls in the future.
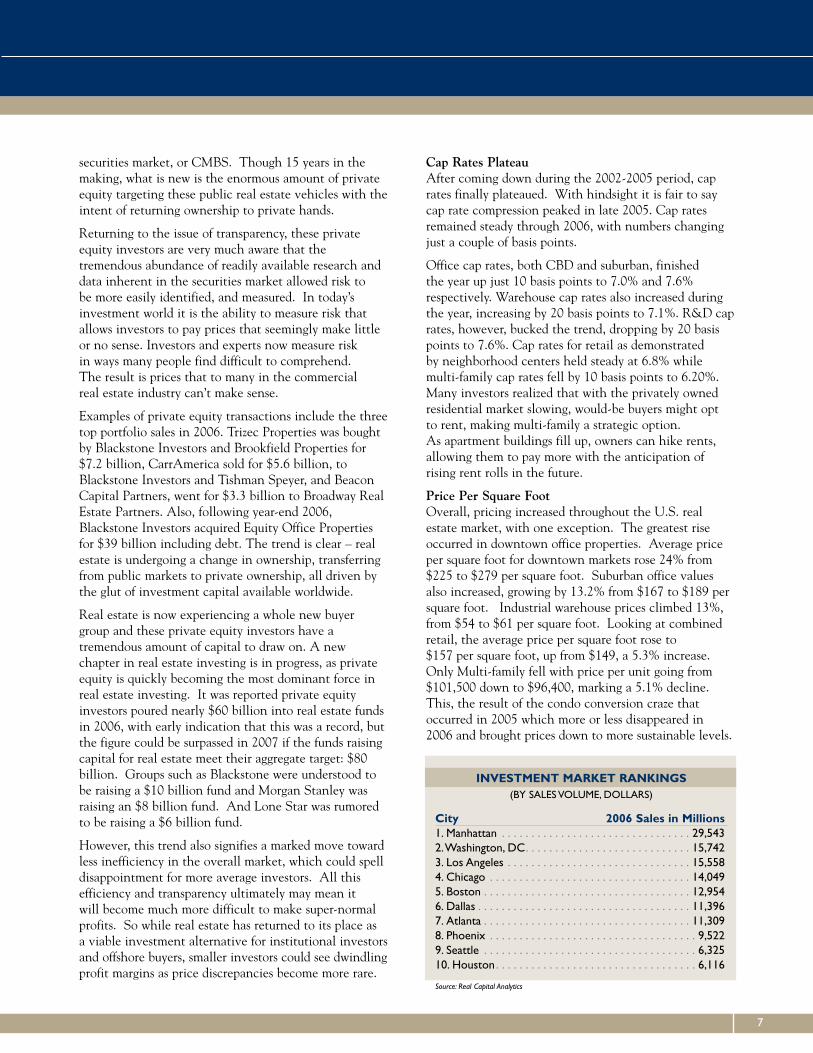
Price Per Square FootOverall, pricing increased throughout the U.S. realestate market, with one exception. The greatest riseoccurred in downtown office properties. Average priceper square foot for downtown markets rose 24% from$225 to $279 per square foot. Suburban office valuesalso increased, growing by 13.2% from $167 to $189 persquare foot. Industrial warehouse prices climbed 13%,from $54 to $61 per square foot. Looking at combinedretail, the average price per square foot rose to $157 per square foot, up from $149, a 5.3% increase.Only Multi-family fell with price per unit going from$101,500 down to $96,400, marking a 5.1% decline.This, the result of the condo conversion craze thatoccurred in 2005 which more or less disappeared in2006 and brought prices down to more sustainable levels.
INVESTMENT MARKET RANKINGS(BY SALES VOLUME, DOLLARS)
City 2006 Sales in Millions1. Manhattan . . . . . . . . . . . . . . . . . . . . . . . . . . . . . . . . 29,5432.Washington, DC. . . . . . . . . . . . . . . . . . . . . . . . . . . . 15,7423. Los Angeles . . . . . . . . . . . . . . . . . . . . . . . . . . . . . . . 15,5584. Chicago . . . . . . . . . . . . . . . . . . . . . . . . . . . . . . . . . . 14,0495. Boston . . . . . . . . . . . . . . . . . . . . . . . . . . . . . . . . . . . 12,9546. Dallas . . . . . . . . . . . . . . . . . . . . . . . . . . . . . . . . . . . . 11,3967. Atlanta . . . . . . . . . . . . . . . . . . . . . . . . . . . . . . . . . . . 11,3098. Phoenix . . . . . . . . . . . . . . . . . . . . . . . . . . . . . . . . . . . 9,5229. Seattle . . . . . . . . . . . . . . . . . . . . . . . . . . . . . . . . . . . . 6,32510. Houston . . . . . . . . . . . . . . . . . . . . . . . . . . . . . . . . . . 6,116
Source: Real Capital Analytics

C O L L I E R S I N T E R N AT I O N A L l U S R E A L E S TAT E R E V I E W 2 0 0 7
Outlook 20072007 looks set to be another robust year, with a continuing surge in M&A activity one of the the primary drivers. The mountain of private capital willcontinue to scour the world, looking for a home andmuch of it will see commercial real estate as an attractive home. The enormous interest by these relatively new investors will force many long-timeinvestors to think outside the box for opportunities.The days of easy investing in traditional institutional-grade real estate are dwindling. As long as REITs trade at a discount to net asset value, privatizations are likelyto occur – and as REITs begin trading in the UK andGermany, global investing is poised to grow exponentially.Going “global” will be the buzzword for 2007.
Interest in multi-family rental real estate will experiencea boost as the owner-occupied residential market softens. That said, with interest rates staying low andfundamentals improving, 2007 will be another year ofstrong performance by virtually all property types.
Coastal markets will again be the strongest performersbut even traditionally weak markets will benefit fromthe abundance of capital seeking to invest in real estate.Property values will increase, more due to a spike in netoperation income, rather than cap rate compression.Except for the very top tier, that dynamic is over.
Cross-border investment is expected to accelerate asdomestic investors seek superior returns abroad, and foreign investors view the weakened dollar as an opportunity to enter or expand their U.S. portfolios. All six major buyer groups (institutions, REITs, equityfunds, foreign investors, private investors and syndicators) will be active, with no one group accounting for more than 20 percent of the market. In addition, many pension funds will continue to growtheir real estate portfolio in 2007, and should be some of the most aggressive buyers in the coming year. A yearfrom now we will almost certainly be writing about howreal estate continues to be a preferred investment type.
8
10.00
9.75
9.50
9.25
9.00
8.75
8.50
8.25
8.00
7.75
7.50
7.25
7.00
6.75
6.50
6.25
6.00
Capi
taliz
atio
nRa
tes
(%)
Q1 Q2 Q3 Q4 Q1 Q2 Q3 Q4 Q1 Q2 Q3 Q4 Q1 Q2 Q3 Q4 Q1 Q2 Q3 Q4 Q1 Q2 Q3 Q4
2001 2002 2003 2004 2005 2006
Multi-Family Industrial Office-CBD Office-Sub Retail (Neighborhood)
CAP RATE TRENDS
Source: Real Estate Research Corp.

www.colliers.com 9
LINKING REAL ESTATE TO COMPANY OBJECTIVES –THE ROLE OF PERSONAL BELIEFS, DECISIONCONTEXT AND BUSINESS INTEGRATION
SVEN GOVAARS
C O L L I E R S I N T E R N AT I O N A L l U S R E A L E S TAT E R E V I E W 2 0 0 7
IntroductionIt is very difficult for an organization to consciouslychange how it makes real estate decisions. Millions ofdollars are spent every year in the pursuit of changethrough the hiring and firing of consultants, implementing training programs and undertaking corporate restructuring.
Decisions bring change and changing the way an organization does business is hard and we all know it.Without a systematic decision process throughout anorganization, a broad based business context, and understanding the role our personal beliefs play, corporate real estate risk will be controlled more by the risk tolerance of individuals than by the organization’s strategy.
By embracing change and understanding the influenceof these decision factors, we have a better chance ofresolving issues that reinforce company objectives andprovide future opportunities. These issues include thosematters relating to corporate real estate. Finding betterways to link real estate to a company’s overall objectivesis a critical success factor for many businesses today.
Personal BeliefsBy being aware of our personal limitations, especially our strongly held beliefs developed over a lifetime, we can hopefully avoid some common danger signs. Because real estate decisions often have long term outcomes and delayed feedback, it is important that the decisions be resolved correctly the first time. Just knowing how we personally influence the decisionprocess will make it easier to safeguard against and dispel potential mistakes.
BiasesEveryone has biases and companies display them as well.We have all witnessed well meaning individuals whoshow excessive optimism and enthusiasm for a solutiononly to realize the diagnosis was prepared too quicklyand not sufficiently verified. It is common for individuals and teams to develop over confidence without allowing sufficient time for important
information to surface. Sometimes data may be screened out by an unrealized bias and we inadvertentlyavoid data that may be present but did not support the business case. We sometimes make the choice toexclude information without consciously realizing it.
ShortcutsThe real estate environment today forces us to findfaster, better, and cheaper ways to make decisions.Those new to real estate decision support often look forshortcuts to speed up the process. At the other end ofthe spectrum, after years of experience we develop rulesof thumb and can move quickly through diagnosis andanalysis, sometimes second guessing the outcome. Many times we are wrong and we pay a high price when challenged and we realize it would have beenmore prudent to take the time to work through each step.
PerspectiveOne of the most powerful inhibitors to successful decision making is our personal point of view. Where acolleague can sometimes point out a bias before it unduly affects a decision, or a shortcut can be tested by alternative means to ensure its validity, the role ofperspective is more difficult to handle. How a project isposed influences the outcome. Think about what itwould take to change your view on a real estate decisionthat you have already made. We are also influenced by our organizational structure and experience communicating across departmental lines. Different personality types have different perspectivesand develop different problem statements depending ontheir role and position in the organization. The way a situation is described has an already embedded viewpoint and it is important to not let it drive the final result. We should explore multiple ways to thinkthrough a problem. We intuitively know we have apoint of view but we often fail to realize its impact onour decisions and resistance to change. We need tobroaden our analysis to create a larger context to address opportunities and constraints that we might otherwise miss.

C O L L I E R S I N T E R N AT I O N A L l U S R E A L E S TAT E R E V I E W 2 0 0 7
Decision ContextOne way to combat our long held beliefs is to use simpletools and apply them consistently in our decisionprocess. We tend to emphasize the outcome of the work and spend too little time gathering data to set the context for decision-making.
Our experience facilitating teams led us to use a simplefour square chart during discovery and diagnosis toassemble information and broaden the decision context.The chart is used from the outset and presented alongwith the final results. By categorizing information intohow we come to know it, we can better realize what wemay not know to provide clues for additional research.
Four areas are explored (see Figure 1):
(1) We begin with what we know from our information gathering,interviews, data researchand so on.
(2) Next we prepare a list ofwhat we do not know.Some of these items we will research and other items will remain unknown.
(3) As we probe deeper wediscover information anddata we did not know atthe beginning and chartit here, some from step 2.
(4) This square is usually not filled in.Sometimes referred to as a “wildcard,” it is an unexplained event that might change the course of any decision. We use scenario planning to thinkabout the implications.
We have used this chart as an internal tool and whenworking with external teams. In our alignment worksessions we present the chart early in the planning stageand encourage its use in later forecasting and decisionsupport. It also serves as a reminder that we may neverhave all the information we desire and that most decisions are made in a point in time and need to bereexamined periodically.
Business IntegrationSince real estate is often considered non-core, howevernecessary to a company’s mission, the decision processand business context employed typically falls short ofcurrent business practices. It is not uncommon for solutions reached by real estate professionals to end upbeing too narrow in scope and do not readily integratewith other critical business drivers. To avoid this, realestate professionals need to align real estate issues to thecompany objectives and bring an enterprise view to theirdiscussions. This linkage should be based on the degreeto which organizational, operational and capital factorsaffect and align with real estate decisions to serve the objectives of the company. It is not enough todemonstrate cost reduction benefits; these must be
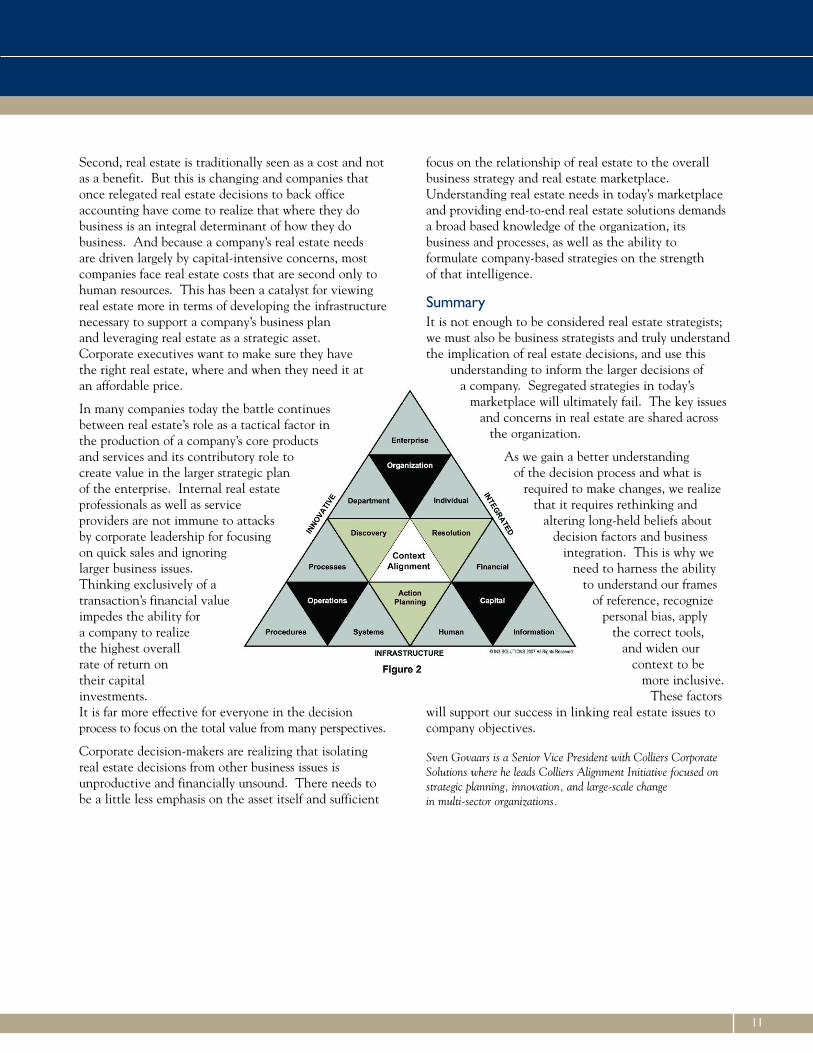
coupled with value-based initiatives that drive integratedresults. We use a simple context alignment model(Figure 2), which outlines first and second level factors to be considered in real estate decisions.
We know that decisions made today have tremendousconsequences for the future ofour organization. Given therapid changes in the businessclimate, a seemingly straightforward decisioninvolves balancing a multitudeof organizational, legal, financial, and stakeholder
risks. How we make decisions and the required changesthat follow those decisions force us to look closer at our choices.
So, what are the reasons that real estate has not beenbetter integrated into the overall business decisions of a company? First, the difficulty and complexity ofintegrating real estate is a direct result of marketplacecycles. When times are good, real estate is acquired and when times are tough real estate is disposed of orcommitted to some form of alternative use. This sets up a continued mismatch with the longer term businesscycles of most companies.
10
11
Second, real estate is traditionally seen as a cost and notas a benefit. But this is changing and companies thatonce relegated real estate decisions to back officeaccounting have come to realize that where they dobusiness is an integral determinant of how they do business. And because a company’s real estate needs are driven largely by capital-intensive concerns, mostcompanies face real estate costs that are second only tohuman resources. This has been a catalyst for viewingreal estate more in terms of developing the infrastructurenecessary to support a company’s business plan and leveraging real estate as a strategic asset. Corporate executives want to make sure they have the right real estate, where and when they need it at an affordable price.
In many companies today the battle continuesbetween real estate’s role as a tactical factor in the production of a company’s core products and services and its contributory role to create value in the larger strategic plan of the enterprise. Internal real estate professionals as well as service providers are not immune to attacks by corporate leadership for focusingon quick sales and ignoring larger business issues. Thinking exclusively of a transaction’s financial valueimpedes the ability for a company to realizethe highest overallrate of return ontheir capitalinvestments. It is far more effective for everyone in the decisionprocess to focus on the total value from many perspectives.
Corporate decision-makers are realizing that isolatingreal estate decisions from other business issues is unproductive and financially unsound. There needs tobe a little less emphasis on the asset itself and sufficient
focus on the relationship of real estate to the overallbusiness strategy and real estate marketplace.Understanding real estate needs in today’s marketplaceand providing end-to-end real estate solutions demandsa broad based knowledge of the organization, its business and processes, as well as the ability to formulate company-based strategies on the strength of that intelligence.
SummaryIt is not enough to be considered real estate strategists;we must also be business strategists and truly understandthe implication of real estate decisions, and use this
understanding to inform the larger decisions of a company. Segregated strategies in today’s
marketplace will ultimately fail. The key issuesand concerns in real estate are shared across
the organization.
As we gain a better understanding of the decision process and what is
required to make changes, we realizethat it requires rethinking and
altering long-held beliefs aboutdecision factors and business
integration. This is why weneed to harness the ability
to understand our frames of reference, recognize
personal bias, apply the correct tools,
and widen our context to be
more inclusive. These factors
will support our success in linking real estate issues tocompany objectives.
Sven Govaars is a Senior Vice President with Colliers CorporateSolutions where he leads Colliers Alignment Initiative focused onstrategic planning, innovation, and large-scale change in multi-sector organizations.

ATLANTA, GA
DOWNTOWN OFFICE
Inventory New Absorption Vacancy Class A(SF) Supply (SF) (SF) Rate (%) Rent ($PSF)
1999 46,943,000 290,000 -113,000 7.4 22.202000 47,593,000 650,000 1,405,000 5.7 24.202001 50,443,000 2,850,000 -164,000 11.4 24.902002 51,668,000 1,225,000 79,000 13.3 23.502003 52,156,000 488,000 187,000 13.8 23.302004 52,710,000 554,000 327,000 14.1 21.902005 53,029,000 319,000 695,000 13.3 21.702006 53,740,000 711,000 601,000 13.3 21.90
SUBURBAN OFFICE
Inventory New Absorption Vacancy Class A(SF) Supply (SF) (SF) Rate (%) Rent ($PSF)
1999 136,250,000 10,396,000 8,559,000 10.7 23.002000 143,995,000 7,745,000 6,724,000 10.8 23.302001 151,626,000 7,631,000 445,000 15.0 23.802002 155,856,000 4,230,000 281,000 17.1 22.502003 158,660,000 2,804,000 1,185,000 17.8 21.502004 159,845,000 1,185,000 3,872,000 16.0 21.402005 162,243,000 2,398,000 3,620,000 14.9 21.402006 164,651,000 2,408,000 3,470,000 14.0 22.00
INDUSTRIAL
Inventory New Absorption Vacancy Warehouse Land(SF) Supply (SF) (SF) Rate (%) Rent ($PSF) ($PSF)
1999 450,600,000 18,629,000 15,507,000 8.5 3.75 – 2000 467,289,000 16,689,000 16,064,000 8.3 3.70 – 2001 486,710,000 19,421,000 3,504,000 11.2 3.60 2.502002 493,957,000 7,247,000 -1,550,000 12.9 3.35 2.872003 496,986,000 3,029,000 1,369,000 13.1 3.30 3.802004 504,632,000 7,646,000 13,946,000 11.7 3.50 1.402005 514,033,000 9,401,000 11,800,000 11.0 3.75 1.852006 534,363,000 20,330,000 12,882,000 11.9 3.80 1.95
METROPOLITAN INDICATORS – 2007
• Gross Metro Product Percent Change: 3.4
• Total Employment Increase/Decrease: 41,900Percent Change: 1.8
• Unemployment Rate: 4.0
• Population (000): 5,137.8
Source: Moody’s Economy.com
C O L L I E R S I N T E R N AT I O N A L l U S R E A L E S TAT E R E V I E W 2 0 0 7
CONTACT: Mike Spears • [email protected] l RESEARCH: Scott Amoson • [email protected] 13
OFFICE
• Office absorption in 2006 reached 3.7 million SF, in line with levelsover past two years.
• Delivered office space totaled 3 million SF, second highest in four years.• Top three office leases were: CompuCredit consolidating into
400,000 SF in Central Perimeter; Newell Rubbermaid signing for350,000 SF headquarters expansion; and American Cancer Societymoving to 270,000 SF downtown.
• Rental rates on the rise. The market transitioning from tenant’s market to landlord’s market, however some pockets of tenant control remain.
• Atlanta experienced record investments with first ever Class A trophy tower topping $400 per SF and commercial land in midtownselling for over $12.8 million per acre.
Office Outlook• Atlanta will continue to add jobs at faster pace than nation.
Office absorption should remain steady at 3-4 million SF in 2007.• Service, hospitality, and technology industries will have greatest
impact on office market growth for 2007.• Like much of nation, housing market will experience downturn,
however effects will be shorter-lived and less damaging than overcooked markets.
• Population migration will continue into city’s urban core where mostcommercial development taking place.
• Investment activity for office buildings in Atlanta will remain solid in 2007.
INDUSTRIAL
• Absorption of 13 million SF consistent with previous two years, butstill off from levels reached in late 90s.
• Overall vacancy rate up from 2005 at 11.9% mainly due to slowdemand from big box users and 20 million SF of deliveries.
• Largest transactions were Kimberly-Clark leasing 1.3 million SF,PetSmart signing for 877,500 SF, and Progressive Lighting leasing 796,663 SF.
• Land scarcity and higher prices continue pushing development further from city.
• Investment activity remained strong with portfolio sales hottest investments.
Industrial Outlook• 2007 absorption will be between 6-8 million SF, slightly off
2006 levels.• Logistics companies could reemerge as major space users around
airport and multi-modal facilities as port activity, rail activity, andtrucking remain high.
• South Atlanta will experience greatest growth in 2007 and accountfor most of absorption.
• Construction levels declining, however funding available for development. Eight million SF expected to deliver in 2007 androughly 4-5 million SF expected next year.
• Two unknowns regard the Ford and GM plant closings and whattakes their place.
BAKERSFIELD, CAC O L L I E R S I N T E R N AT I O N A L l U S R E A L E S TAT E R E V I E W 2 0 0 7
DOWNTOWN OFFICE
Inventory New Absorption Vacancy Class A(SF) Supply (SF) (SF) Rate (%) Rent ($PSF)
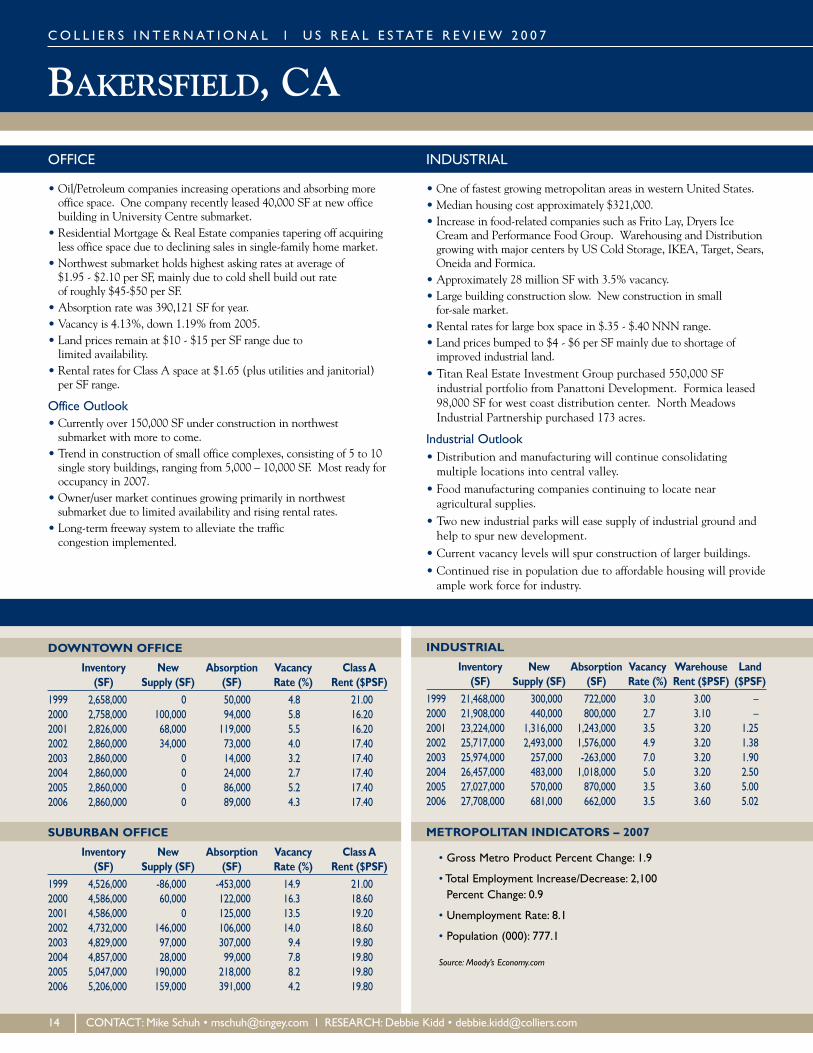
1999 2,658,000 0 50,000 4.8 21.002000 2,758,000 100,000 94,000 5.8 16.202001 2,826,000 68,000 119,000 5.5 16.202002 2,860,000 34,000 73,000 4.0 17.402003 2,860,000 0 14,000 3.2 17.402004 2,860,000 0 24,000 2.7 17.402005 2,860,000 0 86,000 5.2 17.402006 2,860,000 0 89,000 4.3 17.40
SUBURBAN OFFICE
Inventory New Absorption Vacancy Class A(SF) Supply (SF) (SF) Rate (%) Rent ($PSF)
1999 4,526,000 -86,000 -453,000 14.9 21.002000 4,586,000 60,000 122,000 16.3 18.602001 4,586,000 0 125,000 13.5 19.202002 4,732,000 146,000 106,000 14.0 18.602003 4,829,000 97,000 307,000 9.4 19.802004 4,857,000 28,000 99,000 7.8 19.802005 5,047,000 190,000 218,000 8.2 19.802006 5,206,000 159,000 391,000 4.2 19.80
INDUSTRIAL
Inventory New Absorption Vacancy Warehouse Land(SF) Supply (SF) (SF) Rate (%) Rent ($PSF) ($PSF)
1999 21,468,000 300,000 722,000 3.0 3.00 – 2000 21,908,000 440,000 800,000 2.7 3.10 – 2001 23,224,000 1,316,000 1,243,000 3.5 3.20 1.252002 25,717,000 2,493,000 1,576,000 4.9 3.20 1.382003 25,974,000 257,000 -263,000 7.0 3.20 1.902004 26,457,000 483,000 1,018,000 5.0 3.20 2.502005 27,027,000 570,000 870,000 3.5 3.60 5.002006 27,708,000 681,000 662,000 3.5 3.60 5.02
METROPOLITAN INDICATORS – 2007
• Gross Metro Product Percent Change: 1.9
• Total Employment Increase/Decrease: 2,100Percent Change: 0.9
• Unemployment Rate: 8.1
• Population (000): 777.1
Source: Moody’s Economy.com
14 CONTACT: Mike Schuh • [email protected] l RESEARCH: Debbie Kidd • [email protected]
OFFICE
• Oil/Petroleum companies increasing operations and absorbing moreoffice space. One company recently leased 40,000 SF at new officebuilding in University Centre submarket.
• Residential Mortgage & Real Estate companies tapering off acquiringless office space due to declining sales in single-family home market.
• Northwest submarket holds highest asking rates at average of $1.95 - $2.10 per SF, mainly due to cold shell build out rate of roughly $45-$50 per SF.
• Absorption rate was 390,121 SF for year.• Vacancy is 4.13%, down 1.19% from 2005. • Land prices remain at $10 - $15 per SF range due to
limited availability. • Rental rates for Class A space at $1.65 (plus utilities and janitorial)
per SF range.
Office Outlook• Currently over 150,000 SF under construction in northwest
submarket with more to come. • Trend in construction of small office complexes, consisting of 5 to 10
single story buildings, ranging from 5,000 – 10,000 SF. Most ready foroccupancy in 2007.
• Owner/user market continues growing primarily in northwest submarket due to limited availability and rising rental rates.
• Long-term freeway system to alleviate the traffic congestion implemented.
INDUSTRIAL
• One of fastest growing metropolitan areas in western United States. • Median housing cost approximately $321,000.• Increase in food-related companies such as Frito Lay, Dryers Ice
Cream and Performance Food Group. Warehousing and Distributiongrowing with major centers by US Cold Storage, IKEA, Target, Sears,Oneida and Formica.
• Approximately 28 million SF with 3.5% vacancy. • Large building construction slow. New construction in small
for-sale market. • Rental rates for large box space in $.35 - $.40 NNN range.• Land prices bumped to $4 - $6 per SF mainly due to shortage of
improved industrial land.• Titan Real Estate Investment Group purchased 550,000 SF
industrial portfolio from Panattoni Development. Formica leased98,000 SF for west coast distribution center. North MeadowsIndustrial Partnership purchased 173 acres.
Industrial Outlook• Distribution and manufacturing will continue consolidating
multiple locations into central valley. • Food manufacturing companies continuing to locate near
agricultural supplies.• Two new industrial parks will ease supply of industrial ground and
help to spur new development. • Current vacancy levels will spur construction of larger buildings.• Continued rise in population due to affordable housing will provide
ample work force for industry.

BALTIMORE, MD
DOWNTOWN OFFICE
Inventory New Absorption Vacancy Class A(SF) Supply (SF) (SF) Rate (%) Rent ($PSF)
1999 12,963,000 161,000 593,000 9.2 25.002000 13,187,000 224,000 171,000 9.3 26.502001 13,795,000 608,000 299,000 11.4 24.102002 15,485,000 1,690,000 33,000 19.6 21.402003 15,650,000 165,000 296,000 18.4 24.302004 16,031,000 381,000 294,000 17.7 24.002005 16,214,000 183,000 316,000 17.2 23.202006 16,739,000 525,000 511,000 17.0 23.80
SUBURBAN OFFICE
Inventory New Absorption Vacancy Class A(SF) Supply (SF) (SF) Rate (%) Rent ($PSF)
1999 30,598,000 1,856,000 1,400,000 8.4 23.502000 33,044,000 2,446,000 1,913,000 9.9 23.702001 35,252,000 2,208,000 418,000 14.6 22.502002 36,253,000 1,001,000 14,000 17.4 18.402003 36,902,000 649,000 1,114,000 16.0 21.302004 38,577,000 1,675,000 2,213,000 14.2 22.502005 40,641,000 2,064,000 1,797,000 14.0 24.302006 42,392,000 1,751,000 1,847,000 13.4 24.55
INDUSTRIAL
Inventory New Absorption Vacancy Warehouse Land(SF) Supply (SF) (SF) Rate (%) Rent ($PSF) ($PSF)
1999 75,749,000 2,529,000 2,608,000 11.6 4.75 – 2000 77,050,000 1,301,000 3,616,000 7.7 4.70 – 2001 80,951,000 3,901,000 917,000 13.3 4.50 3.452002 82,258,000 1,307,000 -322,000 16.8 5.00 6.002003 84,590,000 2,332,000 2,250,000 17.0 5.60 4.902004 85,728,000 1,138,000 -814,000 18.7 5.40 5.172005 88,255,000 2,527,000 3,924,000 16.5 5.90 5.752006 89,242,000 987,000 1,169,000 15.2 6.46 6.31
METROPOLITAN INDICATORS – 2007
• Gross Metro Product Percent Change: 1.9
• Total Employment Increase/Decrease: 9,800Percent Change: 0.8
• Unemployment Rate: 4.1
• Population (000): 2,677.9
Source: Moody’s Economy.com
C O L L I E R S I N T E R N AT I O N A L l U S R E A L E S TAT E R E V I E W 2 0 0 7
CONTACT: Peter McGill • [email protected] l RESEARCH: Jay Wellschlager • [email protected] 15
OFFICE
• Absorbed and built over 2 million SF for third consecutive year, surpassing any three-year period.
• Activity strong with absorption exceeding construction in most markets.
• Buyers looking for stabilized income and redevelopment opportunities. CBD properties, acquired for redevelopment to residential or hotel uses. Others acquired as income producing office buildings.
• Construction costs for new mid-rises exceed $200 per SF. Tenant improvement allowances for Class A range from $25-$35 per SF, depending on lease term and market.
• Operating expenses increasing, driven by rising utility costs, taxes,and services.
• Growing healthcare, educational, financial, and professional servicefirms drove performance.
Office Outlook• Positive, but demand likely to level off in 2007. Job growth
appears to be slowing for information, financial, professional and business services.
• Only 27% pre-leased of 2.19 million SF under construction.• 68% of deliveries expected in Baltimore-Washington corridor,
including largest project, Johns Hopkins’ 243,000 SF build-to-suit.
INDUSTRIAL
• Record absorption cooled. Two submarkets posted positive whileCorridor flat.
• bulk distribution, warehouse, and flex space absorption unremarkable,still exceeded new space. Vacancy rate dropped to 15.2%.
• Bulk distribution vacancy at 16.5%, down from 17.8%. Vacancy forindustrial flex (13.5%) and office warehouse (11.1%) also dropped for year.
• Robust investment sales. RREEF acquired Calpers’ eight buildingportfolio for $57 per SF; Patuxent Range LLC acquired portfolio inCorridor for $66 per SF.
• Port of Baltimore expanded capacity and warehousing. • Redevelopment of former General Motors site into port-related
multi-modal hub.
Industrial Outlook• Land more expensive with development options further north in
@ 95 Corridor. The GM site, the 1,000-acre Crossroads, andTradeCenter @ 95 highlight options.
• Three large distribution buildings under construction, 600,000 SF in TradeCenter at @ 95, two buildings in Corridor, plus 176,000 SF in Preston Gateway, and 215,000 SF in Lincoln Crossroads.
• Limited new construction, especially for bulk distribution warehouses. Slowing state economy, may continue to moderate leasing activity in 2007.

BOISE, IDC O L L I E R S I N T E R N AT I O N A L l U S R E A L E S TAT E R E V I E W 2 0 0 7
DOWNTOWN OFFICE
Inventory New Absorption Vacancy Class A(SF) Supply (SF) (SF) Rate (%) Rent ($PSF)
1999 1,935,000 242,000 181,000 8.9 19.002000 1,975,000 40,000 17,000 9.1 18.802001 – – – – –2002 – – – – –2003 3,210,000 75,000 -4,000 10.6 18.902004 3,462,000 252,000 187,000 11.7 18.802005 3,551,000 89,000 206,000 7.6 18.902006 3,731,000 180,000 88,000 9.7 20.00
SUBURBAN OFFICE
Inventory New Absorption Vacancy Class A(SF) Supply (SF) (SF) Rate (%) Rent ($PSF)
1999 4,833,000 331,000 244,000 15.3 17.002000 5,034,000 201,000 234,000 12.6 17.002001 – – – – –2002 – – – – –2003 6,933,000 442,000 323,000 15.6 16.602004 7,102,000 169,000 157,000 19.2 17.602005 7,981,000 879,000 1,068,000 13.4 16.902006 8,157,000 176,000 197,000 12.9 16.20
INDUSTRIAL
Inventory New Absorption Vacancy Warehouse Land(SF) Supply (SF) (SF) Rate (%) Rent ($PSF) ($PSF)
1999 20,858,000 396,000 345,000 2.3 4.90 – 2000 22,219,000 1,361,000 1,558,000 1.5 5.00 – 2001 22,300,000 81,000 -712,000 5.0 4.50 – 2002 22,445,000 145,000 -476,000 7.7 3.50 – 2003 22,532,000 87,000 -468,000 10.1 4.40 – 2004 22,669,000 137,000 146,000 10.0 4.60 5.002005 22,757,000 88,000 288,000 9.1 4.60 4.002006 22,937,000 180,000 754,000 5.7 6.03 3.94
METROPOLITAN INDICATORS – 2007
• Gross Metro Product Percent Change: 4.2
• Total Employment Increase/Decrease: 8,100Percent Change: 3.0
• Unemployment Rate: 2.7
• Population (000): 563.2
Source: Moody’s Economy.com
16 CONTACT: Pete Draper • [email protected] l RESEARCH: Cory Read • [email protected]
OFFICE
• Tenants are getting used to the $19 and above rents in Boise CBD,demonstrated by consistent downtown absorption.
• Office absorption backed down from high 2005 levels due mostly tosuburban slowdown, but still consistent and positive.
• National tenant activity has increased over the last year.• Building in downtown has returned with the completion of a
new 11 story 180,000 SF building during 2006 and the current construction of another large project.
• CBD will see most leasing activity in valley if current levels continuethrough 2007.
Office Outlook• Absorption should remain consistent and positive.• National tenant activity will continue as companies look to gain
position in response to the high growth of the valley.• New construction continuing on 84,000 SF project.• Average CBD Class A rents will more than likely crest the $20 for
the first time during 2007.
INDUSTRIAL
• Speculative development slow due to land prices and constructioncosts increasing at faster rate than rental rates.
• Landlords currently hold bargaining chips because vacancies arebelow 6% across valley with very few choices for tenants looking forspaces 20,000 or greater.
• Average rents have crested the $6 annual rate for warehouse space for first time during the latter part of 2006.
• The 2006 industry slowdown in expansion (which had supported residential construction) did not have much effect on industrial leasing and vacancy.
• Over 1 million SF were absorbed across the Valley during 2006.
Industrial Outlook• Speculative building may increase slightly during 2007, but will
probably not meet demand. • Rents are going to rise throughout 2007. • Developers will spend much of 2007 planning and positioning
themselves while looking for rents and land costs to fall in line.

BOSTON, MA
DOWNTOWN OFFICE
Inventory New Absorption Vacancy Class A(SF) Supply (SF) (SF) Rate (%) Rent ($PSF)
1999 58,904,000 844,000 812,000 5.5 50.502000 60,754,000 1,850,000 2,290,000 4.5 72.002001 62,928,000 2,174,000 -1,935,000 11.9 55.302002 64,660,000 1,732,000 -860,000 16.2 43.702003 65,914,000 1,254,000 368,000 17.4 38.402004 66,722,000 808,000 -61,000 17.9 38.202005 66,942,000 220,000 2,045,000 12.6 41.402006 66,942,000 0 1,773,000 9.8 46.00
SUBURBAN OFFICE
Inventory New Absorption Vacancy Class A(SF) Supply (SF) (SF) Rate (%) Rent ($PSF)
1999 90,941,000 5,599,000 7,904,000 12.3 25.602000 95,894,000 4,953,000 9,241,000 6.2 38.902001 102,727,000 6,833,000 -6,570,000 21.0 31.002002 106,177,000 3,450,000 -1,766,000 26.0 25.002003 108,561,000 2,384,000 -290,000 28.2 21.002004 108,383,000 -178,000 1,810,000 25.6 20.802005 107,341,000 -1,042,000 3,363,000 18.8 20.102006 108,091,000 750,000 2,616,000 12.7 24.00
INDUSTRIAL
Inventory New Absorption Vacancy Warehouse Land(SF) Supply (SF) (SF) Rate (%) Rent ($PSF) ($PSF)
1999 142,309,000 795,000 2,170,000 9.7 6.00 – 2000 144,744,000 2,435,000 3,030,000 8.2 7.00 – 2001 146,806,000 2,062,000 -1,726,000 14.6 7.00 1.952002 147,664,000 858,000 -60,000 15.9 6.00 1.952003 148,421,000 757,000 -1,248,000 19.2 6.00 1.702004 149,036,000 615,000 -1,767,000 23.0 5.50 2.872005 151,142,000 2,106,000 503,000 23.7 5.50 –2006 152,380,000 1,238,000 488,000 22.8 5.84 –
METROPOLITAN INDICATORS – 2007
• Gross Metro Product Percent Change: 2.3
• Total Employment Increase/Decrease: 11,300Percent Change: 1.0
• Unemployment Rate: 5.0
• Population (000): 1,804.8
Source: Moody’s Economy.com
C O L L I E R S I N T E R N AT I O N A L l U S R E A L E S TAT E R E V I E W 2 0 0 7
CONTACT: Margaret Wigglesworth • [email protected] l RESEARCH: Robert Sammons • [email protected] 17
OFFICE
• Boston closes 2006 in relatively good condition though not yet at pre-2001 levels due to shakiness in financial services.
• Vacancy continues declining especially for Downtown and Back Bayas well as 128 West suburban markets.
• Few large blocks available Downtown or Back Bay, one exception isGillette placing 325,000 SF on market at Prudential Center.
• Average asking rents steadily rising across submarkets but especiallyDowntown, Cambridge and 128 West.
• CBD investment sales strong with several key properties closing atwell over $400 per SF (1 Lincoln Street at $838 per SF and 265Franklin Street for $486 per SF).
Office Outlook• Jobs expected to climb again in 2007, especially in law and
accounting fields. Financial services is mixed bag with some growth (Bank of America adding jobs) and some cutbacks due to relocations (Fidelity).
• Little new office construction in metro area, so the vacancy rateexpected to decline in 2007 across most submarkets.
• Average asking rents in key submarkets will increase at or slightlyhigher than 2006 levels, especially for Class A.
• High-Tech/Bio-Tech/Pharma firms will continue desiring office andlab space, especially in Cambridge and 128 West submarkets.
• Expect 128 West to be hot, due to increasing popularity withinvestors and developers with several long-term speculative projectsto be announced in 2007.
INDUSTRIAL
• Industrial/warehouse activity space picked up but remains weakerthan other major metro markets.
• Most leasing and sales transactions on smaller side, less than 100,000 SF.
• 128 West and North submarkets closed 2006 with tightest availability, both near 10.0% and highest average asking rents, both near $10.00 per SF NNN).
• R&D and Flex remained hottest subset in 2006.• Major construction underway includes 200,000 SF warehouse near
Port of Boston, 50% pre-leased.• Gillette renewed for just over 1-million SF in Ayer after threatening
to relocate away from Boston market completely.
Industrial Outlook• Demand for industrial/warehouse/R&D will lag behind other
major markets in 2007. With little new construction, vacanciesshould continue declining.
• Activity greater in submarkets furthest from CBD in 2007.• Average asking rents will climb slightly, especially in submarkets with
new product. Possibly some pricing weakness in areas with significantolder stock.
• Investment activity should remain steady in 2007 especially amongmodern properties along I-495 and Bristol County.
• Expect distribution facilities development to spread further from traditional submarkets toward Providence and Worcester.
CHARLESTON, SCC O L L I E R S I N T E R N AT I O N A L l U S R E A L E S TAT E R E V I E W 2 0 0 7
DOWNTOWN OFFICE
Inventory New Absorption Vacancy Class A(SF) Supply (SF) (SF) Rate (%) Rent ($PSF)
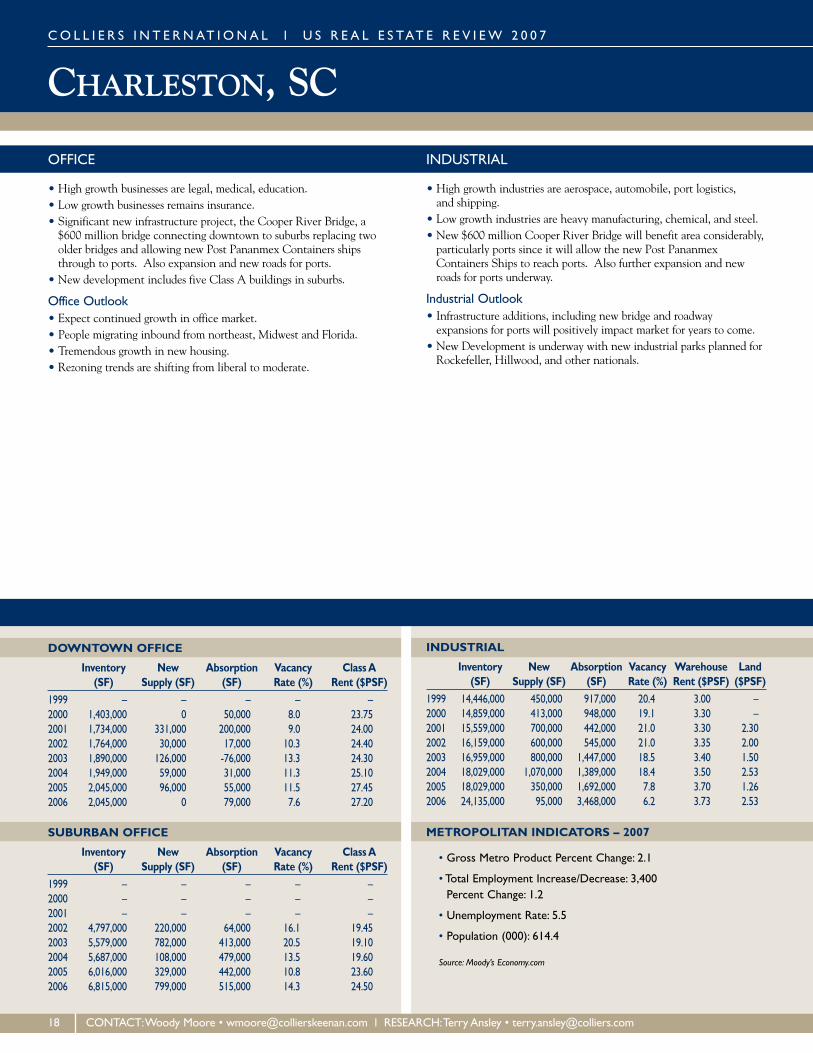
1999 – – – – –2000 1,403,000 0 50,000 8.0 23.752001 1,734,000 331,000 200,000 9.0 24.002002 1,764,000 30,000 17,000 10.3 24.402003 1,890,000 126,000 -76,000 13.3 24.302004 1,949,000 59,000 31,000 11.3 25.102005 2,045,000 96,000 55,000 11.5 27.452006 2,045,000 0 79,000 7.6 27.20
SUBURBAN OFFICE
Inventory New Absorption Vacancy Class A(SF) Supply (SF) (SF) Rate (%) Rent ($PSF)
1999 – – – – –2000 – – – – –2001 – – – – –2002 4,797,000 220,000 64,000 16.1 19.452003 5,579,000 782,000 413,000 20.5 19.102004 5,687,000 108,000 479,000 13.5 19.602005 6,016,000 329,000 442,000 10.8 23.602006 6,815,000 799,000 515,000 14.3 24.50
INDUSTRIAL
Inventory New Absorption Vacancy Warehouse Land(SF) Supply (SF) (SF) Rate (%) Rent ($PSF) ($PSF)
1999 14,446,000 450,000 917,000 20.4 3.00 – 2000 14,859,000 413,000 948,000 19.1 3.30 – 2001 15,559,000 700,000 442,000 21.0 3.30 2.302002 16,159,000 600,000 545,000 21.0 3.35 2.002003 16,959,000 800,000 1,447,000 18.5 3.40 1.502004 18,029,000 1,070,000 1,389,000 18.4 3.50 2.532005 18,029,000 350,000 1,692,000 7.8 3.70 1.262006 24,135,000 95,000 3,468,000 6.2 3.73 2.53
METROPOLITAN INDICATORS – 2007
• Gross Metro Product Percent Change: 2.1
• Total Employment Increase/Decrease: 3,400Percent Change: 1.2
• Unemployment Rate: 5.5
• Population (000): 614.4
Source: Moody’s Economy.com
18 CONTACT:Woody Moore • [email protected] l RESEARCH:Terry Ansley • [email protected]
OFFICE
• High growth businesses are legal, medical, education.• Low growth businesses remains insurance.• Significant new infrastructure project, the Cooper River Bridge, a
$600 million bridge connecting downtown to suburbs replacing twoolder bridges and allowing new Post Pananmex Containers shipsthrough to ports. Also expansion and new roads for ports.
• New development includes five Class A buildings in suburbs.
Office Outlook• Expect continued growth in office market.• People migrating inbound from northeast, Midwest and Florida.• Tremendous growth in new housing.• Rezoning trends are shifting from liberal to moderate.
INDUSTRIAL
• High growth industries are aerospace, automobile, port logistics, and shipping.
• Low growth industries are heavy manufacturing, chemical, and steel.• New $600 million Cooper River Bridge will benefit area considerably,
particularly ports since it will allow the new Post PananmexContainers Ships to reach ports. Also further expansion and newroads for ports underway.
Industrial Outlook• Infrastructure additions, including new bridge and roadway
expansions for ports will positively impact market for years to come.• New Development is underway with new industrial parks planned for
Rockefeller, Hillwood, and other nationals.

CHARLOTTE, NC
DOWNTOWN OFFICE
Inventory New Absorption Vacancy Class A(SF) Supply (SF) (SF) Rate (%) Rent ($PSF)
1999 17,251,000 1,145,000 938,000 5.1 28.002000 18,003,000 752,000 947,000 3.2 25.302001 18,670,000 667,000 126,000 5.4 24.502002 19,668,000 998,000 364,000 9.5 22.902003 19,768,000 100,000 -7,000 10.2 23.802004 19,768,000 0 77,000 9.7 23.802005 19,858,000 90,000 463,000 5.2 21.302006 19,858,000 0 157,000 4.7 22.80
SUBURBAN OFFICE
Inventory New Absorption Vacancy Class A(SF) Supply (SF) (SF) Rate (%) Rent ($PSF)
1999 33,835,000 420,000 1,558,000 13.0 24.002000 34,972,000 1,137,000 1,423,000 11.8 21.802001 36,825,000 1,853,000 215,000 17.8 20.302002 37,682,000 857,000 98,000 19.8 20.002003 38,074,000 392,000 539,000 18.9 19.302004 38,737,000 663,000 89,000 20.7 19.302005 39,690,000 953,000 1,551,000 15.3 19.402006 41,250,000 1,560,000 1,273,000 15.7 19.70
INDUSTRIAL
Inventory New Absorption Vacancy Warehouse Land(SF) Supply (SF) (SF) Rate (%) Rent ($PSF) ($PSF)
1999 145,584,000 1,959,000 2,044,000 13.0 4.30 – 2000 146,934,000 1,350,000 1,712,000 9.7 3.80 – 2001 147,738,000 804,000 -644,000 14.4 3.60 1.492002 148,941,000 1,203,000 -486,000 17.2 3.40 1.502003 149,115,000 174,000 76,000 18.2 3.40 1.702004 149,478,000 363,000 981,000 17.0 4.10 1.752005 150,714,000 1,236,000 2,224,000 11.1 4.10 –2006 151,429,000 715,000 1,962,000 10.4 4.11 –
METROPOLITAN INDICATORS – 2007
• Gross Metro Product Percent Change: 3.0
• Total Employment Increase/Decrease: 13,300Percent Change: 1.6
• Unemployment Rate: 5.1
• Population (000): 1,607.1
Source: Moody’s Economy.com
C O L L I E R S I N T E R N AT I O N A L l U S R E A L E S TAT E R E V I E W 2 0 0 7
CONTACT: Rob Cochran • [email protected] l RESEARCH: Matt Russell • [email protected] 19
OFFICE
• Availability at 2-4% vacancy downtown, 12-14% suburbs. Very healthy.
• High growth includes financial services, legal, government, anddefense-related. Real estate and construction strong in residentialand commercial.
• High growth are all major homebuilders, Bank of America,Wachovia, BB&T banks and startup community banks.
• Sports, especially NASCAR are economic driver and growing.• First leg of light rail line from Pineville to Charlotte’s CBD, estimated
at $475 million.• New towers under construction include BOA and Wachovia, also
NASCAR office building; City Park is large 175-acre mixed-use redevelopment of former Charlotte Convention Center.
• Outer belt residential and commercial exploding.• Housing market strong. Top end slowed, time on market longer,
prices steady.
Office Outlook• NASCAR Hall of Fame arrives in 2008. Expect large economic impact.• Anticipate unabated migration over next 20-50 years. Great weather,
good government. Transplants mainly from northeast.• IT and Tech treading water. Textile waning.• First light rail line to open late 2007-2008. Additional interest
in north line to University area. Project has 25-year timeline. Other projects are I-485, with 2013 completion, and western legbetween I-85 and I-77 to connect 2008-2009.
• Land rates rising. Infill spiked considerably. Trend pushing developers further out.
INDUSTRIAL
• By year-end 1.77 million SF bulk distribution space delivered.• Overall vacancy rate slightly down at 10.4% over last year’s 10.5%.• Top growth includes logistics, automotive parts, machine, medical
equipment, construction, and NASCAR. • Retailers are high growth, including Ross Dress for Less, Crate &
Barrel, Target, West Marine, Black & Decker. • Old buildings, especially former textile mills, converted to residential
condos and apartments.• Bulk land sales at $45,000 to $85,000 per acre with individual sites
w/utilities at $75,000 to $125,000 per acre.• Becoming increasingly difficult to rezone land to light and heavy
industrial, diminishing supply, resulting in rapid continued price acceleration.
• Largest sale 1.08 million SF former Winn Dixie Distribution Centerat $24,500,000.
• Largest lease West Logistics at 251,000 SF.
Industrial Outlook• Charlotte’s outer belt (I-485) under construction with 75% delivered
end 2007.• Third runway and runway extension will increase business for largest
cargo jets. Runways and Norfolk Southern's rail extension intomulti-modal yard at airport will spur more logistics growth.
• Early 2007 expect delivery of approximately 500 million SF.• Comparatively low house prices will continue to fuel migration from
non-traditional areas such as Midwest, Florida, and California.

CHICAGO, ILC O L L I E R S I N T E R N AT I O N A L l U S R E A L E S TAT E R E V I E W 2 0 0 7
DOWNTOWN OFFICE
Inventory New Absorption Vacancy Class A(SF) Supply (SF) (SF) Rate (%) Rent ($PSF)
1999 116,112,000 2,600,000 -156,000 10.7 34.302000 116,916,000 804,000 2,140,000 10.2 36.002001 119,147,000 2,231,000 -685,000 12.7 35.002002 119,977,000 830,000 -3,404,000 16.6 32.002003 122,802,000 2,825,000 -945,000 16.9 32.002004 124,660,000 1,858,000 1,544,000 17.0 32.002005 126,316,000 1,656,000 207,000 19.5 34.002006 126,795,000 479,000 3,795,000 15.2 36.00
SUBURBAN OFFICE
Inventory New Absorption Vacancy Class A(SF) Supply (SF) (SF) Rate (%) Rent ($PSF)
1999 93,130,000 3,984,000 1,681,000 11.7 27.002000 97,059,000 3,929,000 1,383,000 13.8 28.502001 101,232,000 4,173,000 -3,010,000 20.7 29.002002 102,945,000 1,713,000 -793,000 23.4 25.002003 103,347,000 402,000 -1,283,000 23.9 25.002004 103,886,000 539,000 2,501,000 21.8 22.002005 104,112,000 226,000 1,365,000 21.1 23.602006 104,245,000 133,000 1,385,000 18.9 22.30
INDUSTRIAL
Inventory New Absorption Vacancy Warehouse Land(SF) Supply (SF) (SF) Rate (%) Rent ($PSF) ($PSF)
1999 988,381,000 22,227,000 24,189,000 5.6 5.20 – 2000 1,007,524,000 19,143,000 15,680,000 5.8 5.60 – 2001 1,017,872,000 10,348,000 -10,978,000 8.0 5.10 4.682002 1,031,233,000 13,361,000 1,305,000 8.9 4.40 3.902003 1,044,699,000 13,466,000 7,392,000 9.4 4.60 4.802004 1,061,977,000 17,278,000 13,221,000 9.5 4.50 4.202005 1,080,869,000 18,892,000 19,349,000 9.0 4.60 5.172006 1,098,495,000 17,626,000 14,077,000 9.0 4.56 6.01
METROPOLITAN INDICATORS – 2007
• Gross Metro Product Percent Change: 2.4
• Total Employment Increase/Decrease: 39,700Percent Change: 1.0
• Unemployment Rate: 4.6
• Population (000): 7,975.2
Source: Moody’s Economy.com
20 CONTACT: David Bercu • [email protected] l RESEARCH: George Cutro • [email protected]
OFFICE
• Downtown demand set records for investment sales with high-quality,well-leased product. New record with 1 S. Dearborn sale at $422 per SF.
• Two new CBD deliveries and ground broken on two towers totaling 2 million SF, expected delivery 2009.
• Largest leases include Kirkland & Ellis’ 600,000 SF; Jenner & Block’s412,000 SF; and Mesirow Financial’s 390,000 SF.
• CBD vacancy steadily decreased nearly 2.0%, absorption remainedpositive every quarter.
• CBD growth in office conversions to office-condos or residential-condos, particularly East Loop due to Millennium Park.
• Suburban Class A successful attracting tenants, causing rents to rise10% to 15% over 2005 levels.
• Four speculative projects broke ground in suburban markets.
Office Outlook• Demand remaining strong in 2007 for top-tier assets as leasing
improves and vacancy rates continue falling.• Mixed-use delivery set for Q4 2007, adds 400,000 SF. • Leasing expected strong with continued absorption and vacancy
likely dipping below 15%.• Conversion trend expected to continue for assets challenged with
high vacancy.• Suburban freeze on electrical rates terminates at year-end.
Anticipate jump from 40% to 80% over 2006.• Land prices to continue climbing. Reached $16.00 per SF in 2006,
four times higher than decade ago.• Landlords scaling back concessions 5% to 10%. Already fewer free
rents and tenant allowances for Class A.
INDUSTRIAL
• Major absorption in warehouse/distribution. End users signed leasesfor majority of large transactions.
• Infill development robust at O’Hare International Airport. Nine speculative warehouse/distribution facilities broke ground, 1.2 million SF total, with 706,100 SF available.
• Land prices escalating. Spread from $5.00 to $23.00 per SF versus$3.50 to $17.00 per SF last year.
• Build-to-suit completions surpass speculative deliveries for first time since 2003 with 10.4 million SF completed (8.9 million SF speculative).
• Manufacturers had positive impact. Several firms presumed extinctrecorded large transactions.
• Leasing achieved record year posting 36.6 million SF. Tremendous Q2 movement of 12.2 million SF helped ink 2006 capstone for tenant activity.
• Sales activity dropped 40% to 17.7 million SF.• Weaker sales contributed to net absorption decline.
Currently 12.4 million SF, compared to 2005’s 19.3 million SF.
Industrial Outlook• Bulk warehouse/distribution will continue driving demand,
however at slower pace. Expect strain on rental rates, likelyremaining flat.
• Capital markets hungry for industrial bulk warehouse/distribution,fueling speculative construction.
• Anticipate rising sale prices in 2007 from 7% to 10%, despite 2006 lower user sale activity.

CINCINNATI, OH
DOWNTOWN OFFICE
Inventory New Absorption Vacancy Class A(SF) Supply (SF) (SF) Rate (%) Rent ($PSF)
1999 12,017,000 36,000 137,000 7.6 20.602000 12,030,000 13,000 55,000 6.9 20.902001 12,030,000 0 -110,000 8.2 21.302002 12,180,000 150,000 105,000 13.4 21.202003 12,180,000 0 8,000 13.0 21.202004 12,180,000 0 62,000 12.5 21.002005 12,368,000 188,000 -428,000 18.0 21.802006 12,368,000 0 -311,000 18.4 21.80
SUBURBAN OFFICE
Inventory New Absorption Vacancy Class A(SF) Supply (SF) (SF) Rate (%) Rent ($PSF)
1999 14,016,000 409,000 361,000 11.6 22.002000 15,000,000 984,000 225,000 12.9 16.302001 16,133,000 1,133,000 735,000 16.4 19.302002 16,776,000 643,000 149,000 22.9 19.702003 16,776,000 0 142,000 22.4 19.802004 16,776,000 0 -354,000 25.2 19.802005 17,367,000 591,000 730,000 23.7 19.802006 17,935,000 568,000 552,000 22.7 19.80
INDUSTRIAL
Inventory New Absorption Vacancy Warehouse Land(SF) Supply (SF) (SF) Rate (%) Rent ($PSF) ($PSF)
1999 228,634,000 9,000,000 2,163,000 5.0 4.30 – 2000 236,634,000 8,000,000 2,500,000 6.0 3.30 – 2001 242,073,000 5,439,000 464,000 7.6 3.20 1.382002 244,173,000 2,100,000 1,003,000 8.5 3.20 1.852003 245,215,000 1,042,000 -35,000 8.9 3.20 1.402004 247,872,000 2,657,000 6,134,000 7.8 3.20 1.782005 250,900,000 3,028,000 7,636,000 5.8 3.20 1.252006 256,033,000 5,133,000 4,694,000 5.9 3.20 1.25
METROPOLITAN INDICATORS – 2007
• Gross Metro Product Percent Change: 2.4
• Total Employment Increase/Decrease: 7,700Percent Change: 0.7
• Unemployment Rate: 5.5
• Population (000): 2,092.3
Source: Moody’s Economy.com
C O L L I E R S I N T E R N AT I O N A L l U S R E A L E S TAT E R E V I E W 2 0 0 7
CONTACT: Laura Brunner • [email protected] l RESEARCH: MaryAnn Christenson • [email protected] 21
OFFICE
• Central Business District vacancy increased by 25% from last year.Corporate mergers, relocations, and competition from suburbs havingeffect on CBD market.
• Suburban markets seeing strong growth and development. More than 500,000 SF of new space delivered in suburbs in 2006 of which 70% leased by end of year.
• Rising operating expenses have affected lease rates and deal structures, particularly in CBD. CBD owners and landlords continue to become aggressive and creative to absorb space.
• Suburban lease rates starting to stabilize and concessions diminishing. • Out-of-town investors continue to buy properties.
Office Outlook• Continued competition between downtown and suburbs. As CBD
tries to reinvent itself with increased residential and retail projects, itis unclear whether office users will follow.
• More suburban development. Nearly 2 million SF planned in suburban markets over next few years.
• More mixed-use projects combining components of office, retail andresidential both downtown and in suburbs.
• Kenwood and I-71 corridor expected to be hottest office market overnext several years.
• Land position for development unclear. Good vacant land sites insidebeltway in short supply, so developers will either continue to moveout or look at brownfields and redevelopment opportunities closer in.
INDUSTRIAL
• Lease rates increasing with diminishing concessions. • More than 5 million SF of new construction, the largest amount
in 5 years. • Twelve bulk transactions (excluding renewals) of 100,000 SF or
greater in 2006. More than 3.8 million SF of net absorption of bulkspace in 2006.
• Companies outgrowing existing space and building or moving to newer and bigger facilities with expansion capabilities. Examples include San Mar, KAO Brands, Cummins Engine, and Innotrac.
• Developers making their next land positions with land in traditional hot areas such as the airport corridor and West Chester in short supply.
Industrial Outlook• Richwood, Kentucky and Monroe, Ohio will be area’s next industrial
hot spot for development over the next several years. • Lease, buy or build? With lack of available functional properties
and land sites within beltway, users must either settle for older, lessfunctional buildings or continue to move further out for better land sites.
• Continued speculative bulk development as premium space tightens. • Northern Cincinnati market continues to be the hot office/warehouse
market with more development in 2007. • Leasing conditions continuing to move in landlord's favor in
tightening market.

CLEVELAND, OHC O L L I E R S I N T E R N AT I O N A L l U S R E A L E S TAT E R E V I E W 2 0 0 7
DOWNTOWN OFFICE
Inventory New Absorption Vacancy Class A(SF) Supply (SF) (SF) Rate (%) Rent ($PSF)
1999 28,669,000 26,000 -134,000 15.3 23.002000 28,706,000 37,000 352,000 13.9 22.502001 28,706,000 0 -429,000 14.0 21.202002 29,411,000 705,000 -1,285,000 22.1 20.002003 29,426,000 15,000 -575,000 23.5 20.502004 29,426,000 0 -79,000 23.9 20.502005 29,426,000 0 45,000 21.2 20.902006 29,426,000 0 784,000 18.7 20.30
SUBURBAN OFFICE
Inventory New Absorption Vacancy Class A(SF) Supply (SF) (SF) Rate (%) Rent ($PSF)
1999 58,343,000 578,000 218,000 14.9 22.502000 59,211,000 868,000 771,000 15.4 23.302001 59,637,000 426,000 173,000 17.1 22.002002 59,834,000 197,000 348,000 15.4 21.602003 59,944,000 110,000 -61,000 18.3 20.902004 60,035,000 91,000 311,000 16.5 19.102005 60,151,000 116,000 107,000 11.6 21.002006 60,430,000 279,000 -381,000 12.8 21.70
INDUSTRIAL
Inventory New Absorption Vacancy Warehouse Land(SF) Supply (SF) (SF) Rate (%) Rent ($PSF) ($PSF)
1999 349,708,000 3,300,000 3,724,000 7.4 5.50 – 2000 351,607,000 1,899,000 -3,088,000 8.9 5.50 – 2001 353,555,000 1,948,000 -7,162,000 9.4 4.50 1.722002 355,296,000 1,741,000 -1,120,000 9.6 3.50 1.952003 356,313,000 1,017,000 -5,682,000 10.3 4.10 5.502004 358,697,000 2,384,000 2,372,000 10.1 3.60 1.142005 359,511,000 814,000 3,928,000 9.2 3.55 1.252006 359,757,000 246,000 -2,071,000 9.1 3.74 1.37
METROPOLITAN INDICATORS – 2007
• Gross Metro Product Percent Change: 1.3
• Total Employment Increase/Decrease: -1,300Percent Change: -0.1
• Unemployment Rate: 5.5
• Population (000): 2,116.8
Source: Moody’s Economy.com
22 CONTACT: Joseph Martanovic • [email protected] l RESEARCH: Jennifer Wilms • [email protected]
OFFICE
• Regional anchor market. Over 55 million people within 250 miles,low cost of living.
• Over $300 million in state grants for new business, research facilitiescreates new products, technologies, jobs.
• Three downtown mixed-use retail and housing projects: Flats East 450,000 SF; $100 million Battery Park conversion; and Avenue District.
• New bus line in $220 million Euclid Corridor connects downtown toworld-class arts, entertainment, and medical amenities.
• Downtown Class A sales robust, outside capital flowing. Key Towerand Fifth Third Center transferred ownership. New York grouprestoring 320,000 SF Class C, to Class A.
• St. Paul Travelers Insurance leased 59,028 SF in submarket andPriceWaterhouse Coopers signed in former BP Building.
Office Outlook• Euclid corridor project in University Circle has $2 billion in
development underway.• Multi-billion Lakeshore project started. Turns I-90 to boulevard
allowing more lakefront access.• Duke Realty’s exit means 2 million SF suburban space to transfer.• Premier law firm, Baker & Hostetler reportedly plans expansion
to 200,000 SF.• In suburbs, six building Chagrin Highlands creates 3 million SF and
12-building Emerald Corporate Park adds 1 million SF.• Progressive Insurance growing, as Key and National City banks also
expand operations.
INDUSTRIAL
• Over 370 million SF, half owner occupied. Central U.S. location,three international airports, six deep-water ports, five highways, twomajor railways, and Lake Erie access.
• Former “Rubber Capital of the World” (Akron), now global centerfor polymer R & D with over 400 companies.
• Leading industrial design talent at Cleveland District of Design, job-generating consumer product design cluster reinvigorates industrial area.
• Final construction on Steelyard Commons, multi-million dollar heavyindustrial conversion to retail plaza.
• Construction began on MidTown Technology Center withBrownfield Grant to purchase Ohio Knitting Mills, demolish abandoned screw factory, and eliminate contamination.
• Significant sales included Venture Lighting’s 331,000 SF, andGoodyear’s 700,000 SF.
• Significant leases included Atomic Box’s 121,000 SF and Kinetic Technologies’ 110,000 SF.
Industrial Outlook• LA-based Industrial Realty Group’s 225 acre, 4 million SF clean up,
restoration, and development of former assembly plant begins.• Cleveland Foundation finalizing open water tests on Lake Erie for
world’s first fresh water wind farm, hoping to provide incentive tomanufacturing and parts supply sectors.
• Recycling former industrial sites enabling development of Loftworks,Mid-City Lofts, Kronheim Lofts, YWCA, and Kalman & Pabst PhotoGroup facilities.

COLUMBIA, SC
DOWNTOWN OFFICE
Inventory New Absorption Vacancy Class A(SF) Supply (SF) (SF) Rate (%) Rent ($PSF)
1999 – – – – 18.802000 3,975,000 0 50,000 4.6 18.502001 4,055,000 80,000 -267,000 10.9 18.802002 4,111,000 56,000 -18,000 11.2 18.002003 4,111,000 0 97,000 8.9 17.802004 4,461,000 350,000 -135,000 14.4 19.702005 4,461,000 0 -10,000 12.8 19.802006 4,461,000 0 52,000 12.4 19.70
SUBURBAN OFFICE
Inventory New Absorption Vacancy Class A(SF) Supply (SF) (SF) Rate (%) Rent ($PSF)
1999 – – – – 16.502000 4,273,000 90,000 103,000 7.6 17.002001 4,308,000 35,000 -41,000 15.2 18.002002 4,408,000 100,000 236,000 12.4 18.002003 4,483,000 75,000 -248,000 21.3 17.502004 4,483,000 0 72,000 23.5 16.202005 4,518,000 35,000 229,000 22.4 17.102006 4,518,000 0 157,000 19.5 17.80
INDUSTRIAL
Inventory New Absorption Vacancy Warehouse Land(SF) Supply (SF) (SF) Rate (%) Rent ($PSF) ($PSF)
1999 29,531,000 1,048,000 1,183,000 6.8 3.25 – 2000 30,612,000 1,081,000 781,000 8.0 3.25 – 2001 31,386,000 774,000 1,298,000 5.2 3.25 1.002002 32,991,000 1,605,000 -143,000 10.6 3.25 1.252003 32,991,000 0 -1,082,000 15.4 3.25 0.902004 33,209,000 218,000 1,253,000 10.5 3.65 1.002005 33,461,000 252,000 1,745,000 5.1 3.90 1.002006 33,940,000 479,000 539,000 4.6 3.90 1.10
METROPOLITAN INDICATORS – 2007
• Gross Metro Product Percent Change: 2.6
• Total Employment Increase/Decrease: 5,900Percent Change: 1.6
• Unemployment Rate: 5.9
• Population (000): 703.2
Source: Moody’s Economy.com
C O L L I E R S I N T E R N AT I O N A L l U S R E A L E S TAT E R E V I E W 2 0 0 7
CONTACT:Woody Moore • [email protected] l RESEARCH: Ryan Hyler • [email protected] 23
OFFICE
• Occupancy climbed from 81.4% at mid-year to 84.0% at year-end. • CBD posted positive absorption of 33,392 SF during second half,
bringing year-end occupancy to 87.56%. CBD Class A stood at87.04% at year-end.
• Due to limited Class A space in CBD, lower priced Class A beingabsorbed more quickly, resulting in rise of average rental rates.
• Suburban market experienced 157,695 SF of absorption from mid-year 2006 to year-end 2006.
• Suburban asking rents remained fairly stable even with demand increase.
• Class A market in Northeast Columbia posted highest Class A at 93.13% at year-end.
Office Outlook• Looking ahead, it is unclear what will happen along Main Street
when SCANA relocates at end of 2009, leaving an additional 10% of CBD office market vacant.
• Due to a tight supply of high-end space available in the northeast,this area may be poised for next office development.
• As Cayce/West Columbia attracts new developments, particularlyalong the river, this submarket may be viewed as an extension ofCBD, rather than a secondary submarket.
INDUSTRIAL
• Tough year for prospects looking to lease or purchase due to very tightand competitive conditions.
• Occupancy level rose to 95.36% from 94.9% at 2005 year-end. • Absorption fell from 1,700,000 SF in 2005 to 540,000 SF, largely
due to lack of available space. Many tenants and users forced to goelsewhere, postpone expansion plans, or enter market.
• The recent spike in construction costs and interest rates have slowednew speculative construction almost to standstill.
• Frustrating year for industrial users looking to purchase property.Almost no vacant properties for sale in 20,000 SF to 50,000 SF rangeand few choices in larger or smaller categories.
• Lexington County developed an industrial park and is exploring possibility of tax incentives for speculative developments.
Industrial Outlook• Lease rates for Class A space rising to level that should support new
speculative construction in 2007.• Kershaw County actively recruiting industry. As Columbia’s
northeast continues to grow, we should expect expansion intoKershaw County.
• Historically industrial area along Bluff Road will see more conversionsinto non-industrial uses as growth continues adjacent to USC’sWilliams-Brice Stadium.
• First phase of University of South Carolina’s research campus underdevelopment, and is expected to attract research related industry toarea. Many long-term positive benefits anticipated.

COLUMBUS, OHC O L L I E R S I N T E R N AT I O N A L l U S R E A L E S TAT E R E V I E W 2 0 0 7
DOWNTOWN OFFICE
Inventory New Absorption Vacancy Class A(SF) Supply (SF) (SF) Rate (%) Rent ($PSF)
1999 – – 30,000 6.4 –2000 6,695,508 305,000 125,000 7.4 22.462001 7,548,508 853,000 (340,000) 13.4 21.732002 7,626,508 78,000 (137,000) 15.8 20.292003 7,766,508 140,000 68,000 17.3 18.792004 7,928,508 162,000 106,000 17.6 18.842005 7,928,508 0 115,000 18.5 17.262006 8,141,508 213,000 125,000 18.9 16.92
SUBURBAN OFFICE
Inventory New Absorption Vacancy Class A(SF) Supply (SF) (SF) Rate (%) Rent ($PSF)
1999 – – 1,261,000 6.0 –2000 11,467,000 -831,000 1,002,000 10.8 19.842001 12,034,000 567,000 (336,000) 15.9 19.822002 14,308,000 2,274,000 460,000 20.9 19.152003 14,041,000 -267,000 (136,000) 21.0 18.092004 14,609,000 568000 219,000 22.9 18.232005 14,802,000 193,000 (32,000) 22.2 17.242006 15,443,000 641,000 776,000 19.6 16.33
INDUSTRIAL
Inventory New Absorption Vacancy Warehouse Land(SF) Supply (SF) (SF) Rate (%) Rent ($PSF) ($PSF)
1999 – – – – – – 2000 210,433,000 – 12,813,000 6.6 3.14 – 2001 214,443,000 4,010,000 10,628,000 8.3 3.05 – 2002 216,551,000 2,108,000 11,041,000 9.1 2.88 – 2003 218,282,000 1,731,000 8,563,000 9.5 3.00 – 2004 221,363,000 3,081,000 13,317,000 10.9 2.87 – 2005 224,945,000 3,582,000 14,578,000 11.2 2.87 – 2006 232,667,000 7,722,000 7,208,000 13.2 3.27 1.60
METROPOLITAN INDICATORS – 2007
• Gross Metro Product Percent Change: 2.0
• Total Employment Increase/Decrease: 7,400Percent Change: 0.8
• Unemployment Rate: 5.1
• Population (000): 1,741.7
Source: Moody’s Economy.com
24 CONTACT: Steve Falor • [email protected] l RESEARCH: Jill Porosky • [email protected]
OFFICE
• Growing economy increasing demand. Insurance plus booming legalbusiness boosted professional and business services employment 2.4%.
• Educational health services grew over 3% partly due to Ohio StateUniversity, one of U.S.’s largest state universities.
• Nationwide Insurance constructing new CBD building and signedlease for more space in Northwest. Clothing manufacturersannounced expansion plans.
• Significant sales were Fifth Third Center for over $52 million,Brooksedge Corporate Center for $32 million, and Northwoods II, for $10.6 million.
• Vacancy at 20.31%, down half point since Q3. • Downtown year-end vacancy at 17.28%, down slightly over Q3.
Vacancy steady at 16.50% Class A.• Submarket vacancies declined 1% during Q4. All decreased, except
Northeast, where vacancies steady at 18%.
Office Outlook• CBD infrastructure initiatives include mayor’s streetcar proposal
connecting neighborhoods on busy High Street corridor, and majorreconstruction of several highways.
• Mixed-use becoming attractive. Several speculative buildings andbuild-to-suits underway in Northeast. Similar trend in CBD.
• Only Ohio city with positive growth from 2000 to 2005. Second fastest growing MSA in Midwest.
• Vital office conversion market, condo conversions popping up. New townhouse and loft conversions constructed throughout decade.
• Housing struggling with country, likely negative effects.
INDUSTRIAL
• Strong economy increasing demand. Strategic market for distributiondue to central location and convenience to major railroads.
• Wholesale Trade grew 2.5%; Transportation & Utilities sector grew 1%.
• New intermodal facility adjacent to airport driving demand for moreindustrial parks, developers beginning to stockpile land within 5miles. Facility also fueling sales in Southeast submarket.
• Recent land sales include Pizzuti Company’s 156 acres for $9.93 million, and planned purchase of 160 acres just south of Pizzuti’s land.
• Vacancy increased slightly over Q4 of 11.6%. Submarkets steady.New construction and completions combined with vacancy stabilityindicates healthy leasing.
• Bulk vacancy increased since Q3, up from 12.34% to 17.34%, likelydue to jump in construction. Busy Southeast saw largest increasefrom 12.35% to 17.69% over Q4, due to several buildings added.
Industrial Outlook• Infrastructure development on upswing. Intermodal yard will
double cargo through central Ohio by 2010, create more than20,000 jobs, over next 30 years.
• New construction continues with large, speculative bulk facilities, at 400,000 SF and larger, mostly around airport, and new intermodal yard.
• Housing downturn may result in negative effects.

DALLAS/FT. WORTH, TX
DOWNTOWN OFFICE
Inventory New Absorption Vacancy Class A(SF) Supply (SF) (SF) Rate (%) Rent ($PSF)
1999 33,977,000 0 400 18.9 21.002000 33,977,000 0 -308,000 19.8 22.502001 34,020,000 43,000 75,000 19.7 25.002002 34,123,000 103,000 -562,000 21.6 19.002003 34,123,000 0 -438,000 22.9 18.502004 34,123,000 0 123,000 22.5 18.502005 34,123,000 0 66,000 22.3 19.102006 34,123,000 0 270,000 21.5 19.50
SUBURBAN OFFICE
Inventory New Absorption Vacancy Class A(SF) Supply (SF) (SF) Rate (%) Rent ($PSF)
1999 199,469,000 15,644,000 11,727,000 12.9 23.002000 205,262,000 5,793,000 61,956,000 12.3 22.702001 214,429,000 9,167,000 336,000 15.9 23.502002 218,150,000 3,721,000 -1,749,000 18.1 21.002003 220,692,000 2,542,000 446,000 18.8 20.502004 224,466,000 3,774,000 5,844,000 17.6 20.002005 227,179,000 2,713,000 2,897,000 17.3 22.002006 231,508,000 4,329,000 5,221,000 16.5 22.50
INDUSTRIAL
Inventory New Absorption Vacancy Warehouse Land(SF) Supply (SF) (SF) Rate (%) Rent ($PSF) ($PSF)
1999 570,445,000 20,437,000 11,941,000 6.5 3.00 – 2000 587,101,000 16,656,000 14,566,000 7.0 4.10 – 2001 610,983,000 23,882,000 14,665,000 9.9 3.50 2.752002 622,642,000 11,659,000 18,302,000 10.1 3.00 2.602003 628,783,000 6,141,000 11,619,000 11.1 3.00 2.502004 640,677,000 11,894,000 10,159,000 11.7 3.00 2.352005 640,677,000 6,316,000 12,608,000 10.6 3.35 2.602006 658,841,000 11,848,000 14,797,000 10.2 3.50 2.95
METROPOLITAN INDICATORS – 2007
• Gross Metro Product Percent Change: 3.6
• Total Employment Increase/Decrease: 41,000Percent Change: 2.0
• Unemployment Rate: 5.1
• Population (000): 4,065.6
Source: Moody’s Economy.com
C O L L I E R S I N T E R N AT I O N A L l U S R E A L E S TAT E R E V I E W 2 0 0 7
CONTACT: Mark Noble • [email protected] l RESEARCH: Jana Brown • [email protected] 25
OFFICE
• Economy strong and keeping healthy pace. Unemployment stable atyear-end and down slightly over last year.
• Labor very tight. Wages rising, however, some slowed hiring due tosoftening sales.
• Largest lease signings Blue Cross and Blue Shield of Texas’ 980,000SF; Sabre Incorporated’s 375,055 SF.
• Inventory at year-end at 266 million SF in 3,147 buildings up 4 million SF, and 71 buildings over 2005.
• Vacancy dropped to 17.2% at year-end compared to 17.9% at Q4 2005; positive absorption reached 5.5 million SF, increase of nearly 2.5 million SF.
• Largest construction projects in Dallas CBD and Uptown/TurtleCreek submarkets. A CBD 652,000 SF project is 91% pre-leased, and 400,000 SF tower is 100% pre-leased.
• Growth companies are business, trade, and financial services. Defense and manufacturing slowing down.
• Average sales were $124 per SF at cap rate of 7.42% compared to $113 per SF at 7.7% in 2005.
Office Outlook• Expect home starts to cut back 2% in 2007. Fewer homes under
$175,000 and $250,000+ with homes $175,000 to $250,000 increasing production 9%. Competition, margins, buyer traffic, lotprice increases and cancellations top builder concerns for 2007.Relocation buyers having difficulty selling existing homes elsewhere.
• Dallas CBD, Uptown have several projects underway in Arts Districtand near Victory Park, contributing to downtown Dallas revitalization.
• Rental rates and demand for space continue to increase.
INDUSTRIAL
• Manufacturing job losses reached point of wiping out all of previoustwo years of gains.
• New infrastructure initiatives include DART Light Rail system connecting D/FW International Airport through Las Colinas/Irving.
• Significant Deliveries include 1.2 million SF Texas Instruments Semi-Conductor Plant and 755,355 SF Grand Lakes I.
• Under Construction are 800,000 SF River Park 600 and 750,000 SFat Lakeside Ranch Business Center.
• Cap rates lower, averaging 7.26%, down from 8.25% in mid 2005.• Significant leases/move-ins are Whirlpool Corp.’s 852,000 SF,
Kimberly-Clark Corporation’s 414,000 SF near DFW Airport; The RoomStore’s 378,285 SF.
• Significant leases: Proctor & Gamble’s 626,100 SF.
Industrial Outlook• Texas Instruments expects good growth in ’07.• DART Light Rail system plans moving forward to connect D/FW
International Airport through Las Colinas/Irving. Delivering in threephases: 2011, 2012, and 2013.
• Scheduled deliveries 8.9 million SF in 2007.

DENVER, COC O L L I E R S I N T E R N AT I O N A L l U S R E A L E S TAT E R E V I E W 2 0 0 7
DOWNTOWN OFFICE
Inventory New Absorption Vacancy Class A(SF) Supply (SF) (SF) Rate (%) Rent ($PSF)
1999 25,015,000 22,000 288,000 7.3 24.402000 25,597,000 582,000 665,000 5.5 27.502001 25,803,000 206,000 -793,000 10.8 25.402002 25,803,000 0 -1,206,000 14.9 22.402003 25,803,000 0 -123,000 15.3 20.502004 25,803,000 0 -173,000 14.8 18.202005 25,803,000 0 447,000 14.0 18.502006 26,179,000 376,000 705,000 11.8 23.80
SUBURBAN OFFICE
Inventory New Absorption Vacancy Class A(SF) Supply (SF) (SF) Rate (%) Rent ($PSF)
1999 72,371,000 5,028,000 2,106,000 9.5 26.502000 77,399,000 5,028,000 7,495,000 8.3 22.902001 81,998,000 4,599,000 1,652,000 15.1 21.502002 84,113,000 2,115,000 -1,300,000 18.7 19.002003 84,889,000 776,000 381,000 18.0 19.302004 85,832,000 943000 1,052,000 16.3 19.452005 86,040,000 208,000 2,130,000 14.5 20.402006 86,702,000 662,000 1,896,000 13.4 21.10
INDUSTRIAL
Inventory New Absorption Vacancy Warehouse Land(SF) Supply (SF) (SF) Rate (%) Rent ($PSF) ($PSF)
1999 219,414,000 1,800,000 -471,000 5.5 4.00 – 2000 223,806,000 4,392,000 2,434,000 6.5 4.50 – 2001 228,195,000 4,389,000 1,920,000 7.1 5.90 2.752002 232,650,000 4,455,000 -264,000 8.5 5.65 3.002003 235,338,000 2,688,000 -666,000 9.6 5.60 3.002004 237,351,000 2,013,000 2,105,000 9.5 5.60 3.252005 238,974,000 1,623,000 2,850,000 8.8 5.55 3.002006 240,709,000 1,735,000 2,545,000 7.3 4.25 3.50
METROPOLITAN INDICATORS – 2007
• Gross Metro Product Percent Change: 2.5
• Total Employment Increase/Decrease: 12,600Percent Change: 1.0
• Unemployment Rate: 5.2
• Population (000): 2,422.2
Source: Moody’s Economy.com
26 CONTACT: Bob Whittelsey • [email protected] l RESEARCH: Julie Duran • [email protected]
OFFICE
• Another banner year with 3.2 million SF space absorbed by year-end.• 1.7 million SF new space delivered.• CBD and lower downtown seeing first significant speculative
development in two decades with 600,000 SF to break ground.• T-Rex project, major interstate and light rail expansion project
completed culminating six-year $1.6 billion public works investment.• Major leases include Direct TV’s 256,000 SF, EnCana’s 450,000 SF,
and Lockheed Martin’s 300,000 SF.• Energy became leader in job growth. Major players EnCana, Forrest
Oil, Kerr McGee, Delta Petroleum, Anadarko. Many smaller regionalcompanies also expanding operations.
• Equity Office to complete largest portfolio sale in Denver history with2 million SF in CBD.
• Rental rates increased 2.3% over 2005 to average of $18.57 per SF.At least 3 Class “A” CBD properties now asking over $30.00 per SFfull service.
Office Outlook• In 2007, Southeast Suburban with 45 million SF will see first
speculative development since 2000.• Deliveries will continue with 1.4 million SF planned or under
construction for 2007.• Lease rates should begin to increase at greater pace over next
24 months.
INDUSTRIAL
• Net absorption totaled 560,000 SF for Q4 and 2.5 million SF for year.• Vacancy rate unchanged at 8.8% in Q4 but dropped half a percent
from year-end 2005.• Speculative construction controlled with 2.3 million SF added.• Lauth Property Group began construction on 407,000 SF spec,
Majestic Realty started two spec buildings totaling 415,000 SF, andProLogis breaking ground on 357,000 SF spec building and 600,000SF build-to-suit for furniture retailer distribution center.
• Major corporate mergers and acquisitions in high tech industry present potential issues for northwest corridor.
• Largest completion was Sysco’s 600,000 SF for regional distributioncenter at former Stapleton Airport.
• Largest lease by Staples in 300,300 SF distribution center on I-76.• Other significant industrial leases included 265,000 SF by Crocs,
158,000 SF sublease by Aspen Distribution, and 142,000 SF byWhole Foods.
Industrial Outlook• 2 million SF under construction scheduled to be delivered first
half of 2007.• Denver holds country’s highest per capita residential foreclosure.
Could impact future warehouse leasing due to residential construction drop.
• The Samsonite Corporate Campus becoming Mile High BusinessCenter. This 100-acre parcel was Samsonite’s home for forty years.Panattoni approved to construct up to 1.7 million SF distributionand manufacturing over seven buildings.

DETROIT, MI
DOWNTOWN OFFICE
Inventory New Absorption Vacancy Class A(SF) Supply (SF) (SF) Rate (%) Rent ($PSF)
1999 25,871,000 0 -104,000 8.6 25.752000 25,871,000 0 187,000 11.0 27.802001 25,871,000 0 -218,000 11.4 25.802002 26,017,000 146,000 -319,000 16.5 24.002003 27,097,000 1,080,000 569,000 17.3 21.002004 27,097,000 0 588,000 14.3 21.502005 27,097,000 0 -172,000 15.9 22.502006 27,452,000 355,000 303,000 16.6 22.00
SUBURBAN OFFICE
Inventory New Absorption Vacancy Class A(SF) Supply (SF) (SF) Rate (%) Rent ($PSF)
1999 85,435,000 1,345,000 971,000 6.5 24.502000 87,333,000 1,898,000 -236,000 7.1 24.302001 89,250,000 1,917,000 -1,927,000 12.8 25.302002 90,686,000 1,436,000 -3,015,000 15.0 24.802003 91,526,000 840,000 -807,000 16.4 23.002004 92,357,000 831,000 598,000 16.0 22.002005 93,062,000 705,000 777,000 16.6 23.502006 93,502,000 440,000 -663,000 17.5 23.50
INDUSTRIAL
Inventory New Absorption Vacancy Warehouse Land(SF) Supply (SF) (SF) Rate (%) Rent ($PSF) ($PSF)
1999 397,895,000 5,000,000 -593,000 7.0 5.80 – 2000 405,726,000 7,831,000 -1,752,000 9.0 5.70 – 2001 411,782,000 6,056,000 -11,789,000 12.6 6.00 7.002002 414,111,000 2,329,000 -12,891,000 13.1 4.80 3.402003 415,255,000 1,144,000 -5,626,000 14.2 4.80 4.502004 416,539,000 1,284,000 1,647,000 13.0 4.80 4.002005 417,952,000 1,413,000 7,914,000 11.6 5.00 3.752006 420,001,000 2,049,000 -9,959,000 13.6 4.75 5.50
METROPOLITAN INDICATORS – 2007
• Gross Metro Product Percent Change: 0.8
• Total Employment Increase/Decrease: -6,200Percent Change: -0.8
• Unemployment Rate: 9.1
• Population (000): 1,954.8
Source: Moody’s Economy.com
C O L L I E R S I N T E R N AT I O N A L l U S R E A L E S TAT E R E V I E W 2 0 0 7
CONTACT: Cameron McCausland • [email protected] l RESEARCH: Stacee Gatti • [email protected] 27
OFFICE
• Year ended negative. Net absorption at negative 1,039,661 SF at Q4,down from positive 487,282 SF year ago.
• Metro area rental rates decreased slightly during year. Average $20.27 per SF.
• Q4 averages for Class A $23.45, Class B $19.28, and Class C $16.78.Downtown at $19.08, suburbs $20.51. Healthy concessions offered onnew leases and renewals dropping asking rates up to 20%.
• New construction delivered 1,294,807 SF for year. Notables include:130,000 SF Columbus Corporate Office Center, and 200,000 SFEarhart Corporate Center.
• Vacancy increased to 17.0% end Q4, a 1.8% jump over last year.Downtown vacancy stood at 17.8% and suburban markets at 16.8%.
• Investors remained active despite challenges. Sales volume over $200million. Price per SF averaged $88.
Office Outlook• Local issues anticipated into 2007. Automotive industry activity
diminishing, impacting suppliers and manufactures. Jobless rates at7.0% higher than regional/national averages.
• Despite recession, growing buzz in medical office industry, bringingpositive activity and new job opportunity. Retaining existing andattracting new business major priorities.
• Total 616,397 SF under construction heading into 2007.
INDUSTRIAL
• Industrial/flex at 4,460,789 SF negative net absorption. • Total industrial inventory 420,001,261 SF in 8,667 buildings as of Q4.
Flex at 32,984,968 SF and Warehouse/Distribution at 387,016,293 SF. • Asking rental rate $5.45 per SF. Flex/R&D rates fluctuate
geographically. Runs from $13.50 per SF in Detroit to $7.93 per SFin East. Effective rates usually up to 20% less due to concessions andother incentives.
• Warehouse/Distribution vacancy up at 13.1% Q4. Near 20.0%vacancy in Detroit and outlying submarkets. Flex/R&D vacancy stable at 20.0%, and high in most submarkets, with a few stable at or below 10%.
• Additional 578,788 SF inventory delivered Q4. Approximately 450,000 SF under construction comprised of warehouse/distribution in Detroit and West Corridor.
• Industrial/flex sales activity sluggish with 140 industrial sales; totalvolume over $350 million for year. Price per SF averaged $41.23
Industrial Outlook• Local factors impacting industrial long term. Several challenges
ahead as major employers make announcements affecting region’s economy.
• Auto industry uncertainty causing manufacturers to demand shorterlease terms, and forcing landlords to comply with lease concessionsand lease rate reductions.
• At local and state levels, retaining and attracting new industry aremajor priorities.

FT. LAUDERDALE/BROWARD COUNTY, FLC O L L I E R S I N T E R N AT I O N A L l U S R E A L E S TAT E R E V I E W 2 0 0 7
DOWNTOWN OFFICE
Inventory New Absorption Vacancy Class A(SF) Supply (SF) (SF) Rate (%) Rent ($PSF)
1999 6,646,000 406,000 -71,000 6.3 29.002000 6,905,000 259,000 200,000 6.4 26.702001 7,082,000 177,000 49,000 12.5 25.502002 7,525,000 443,000 -55,000 17.5 26.202003 7,579,000 54,000 189,000 15.9 26.402004 7,629,000 50,000 1,000 16.7 26.702005 7,679,000 50,000 187,000 11.6 27.402006 7,679,000 0 176,000 9.0 30.30
SUBURBAN OFFICE
Inventory New Absorption Vacancy Class A(SF) Supply (SF) (SF) Rate (%) Rent ($PSF)
1999 37,097,000 1,245,000 -686,000 10.1 21.502000 38,336,000 1,239,000 555,000 10.4 18.702001 40,790,000 2,454,000 967,000 16.3 24.702002 41,261,000 471,000 -12,000 15.5 23.702003 41,791,000 530,000 976,000 13.8 24.102004 42,472,000 681,000 1,285,000 11.9 23.902005 42,920,000 448,000 1,115,000 7.8 25.102006 43,567,000 647,000 1,259,000 8.0 28.00
INDUSTRIAL
Inventory New Absorption Vacancy Warehouse Land(SF) Supply (SF) (SF) Rate (%) Rent ($PSF) ($PSF)
1999 97,591,000 2,794,000 -885,000 7.7 – – 2000 100,532,000 2,941,000 4,060,000 6.8 6.70 – 2001 103,862,000 3,330,000 2,049,000 9.4 5.80 8.572002 105,406,000 1,544,000 1,014,000 8.9 6.00 5.002003 106,937,000 1,531,000 2,379,000 8.0 6.30 10.002004 109,063,000 2,126,000 2,797,000 7.3 6.30 8.002005 110,473,000 1,410,000 3,675,000 4.8 6.95 9.002006 111,834,000 1,361,000 1,534,000 3.8 7.46 20.00
METROPOLITAN INDICATORS – 2007
• Gross Metro Product Percent Change: 3.8
• Total Employment Increase/Decrease: 20,500Percent Change: 2.6
• Unemployment Rate: 3.2
• Population (000): 1,846.0
Source: Moody’s Economy.com
28 CONTACT: Steve Wasserman • [email protected] l RESEARCH: Jan McLane • [email protected]
OFFICE
• Rental rates up due to increasing operating expenses, particularlyinsurance and electric.
• Office condo trend peaked, then fell, with a short-lived span of interest, but still active.
• New construction just under 749,000 SF.• Largest sales Class A in late 2006: 134,000 SF Lakeside Office Center
in Plantation, for $226 per SF; and Class B Galleria Corporate Centerin eastern Fort Lauderdale for $158 per SF.
• Single-family homes sales dropped 24% from a year ago, median pricedropped 10% over a year ago. Housing market stabilizing, homeswere over-priced and market now correcting. Sellers more realistic.
Office Outlook• Rental rates expected to rise as operating costs, especially
insurance, skyrocket.• Currently, 2.3 million SF under construction, 765,000 in CBD.• More landlords changing to NNN lease rates so rising operating costs
absorbed by tenants.• Vacancy expected to remain low; market expected tight.• Bordering the Ft. Lauderdale CBD on 18 acres of redeveloped land,
Riverbend Corporate Park has initial 325,000 SF (6 buildings) underconstruction. The 8 to 10 year project consists of 1,000 residentialunits, 3 million SF of office space and 500,000 SF of retail.
• Construction starting late 2007 on Atlantic Center, 450,000 SF, 35-story tower in heart of CBD. Site recently purchased for $14.9million. Asking lease rates in unprecedented $45 per SF range.Could be Fort Lauderdale’s tallest commercial tower.
INDUSTRIAL
• Over 3 million SF absorbed.• AMB purchased 106,000 SF in Coral Springs, now own over 500,000
SF in Broward, and 5.6 million SF in Miami-Dade.• New construction totaled 1,054,238 SF.• New FedEx facility completed with 216,000 SF in Pompano Beach.• Leases of 10,000 SF and under dominated transactions. • Industrial condo sales slowing and prices leveling off.
Industrial Outlook• 1.8 million SF under construction, largest project is 250,000 SF
building in Miramar, built by The Coaster Company, owners. • Mohawk Industries signed long-term lease in Pembroke Pines for
260,000 SF build-to-suit.• Hanesbrands in Weston vacating 267,000 SF lease to consolidate
operations to North Carolina, putting sublease on market.• Rental rates expected to continue climbing, along with insurance and
other operating costs. Local governments pushed to address concerngiven impact on growth.
• Vacancy at historic lows and expected to remain low in tight market.

FRESNO, CA
DOWNTOWN OFFICE
Inventory New Absorption Vacancy Class A(SF) Supply (SF) (SF) Rate (%) Rent ($PSF)
1999 – – – – 19.502000 2,085,000 0 150,000 12.3 15.602001 2,195,000 110,000 149,000 10.9 15.602002 2,342,000 147,000 86,000 12.7 18.002003 2,844,000 502,000 440,000 13.7 19.202004 2,930,000 86,000 101,000 10.6 22.802005 2,928,000 -2,000 -19,000 11.2 23.002006 2,976,000 48,000 157,000 7.3 24.00
SUBURBAN OFFICE
Inventory New Absorption Vacancy Class A(SF) Supply (SF) (SF) Rate (%) Rent ($PSF)
1999 12,410,000 213,000 160,000 12.0 23.502000 12,713,000 303,000 830,000 11.3 19.202001 13,274,000 561,000 694,000 10.4 19.202002 14,444,000 1,170,000 1,343,000 8.1 16.202003 14,503,000 59,000 60,000 7.0 19.202004 15,422,000 919,000 601,000 7.9 25.202005 15,767,000 345,000 417,000 6.3 26.402006 16,440,000 673,000 544,000 8.8 26.40
INDUSTRIAL
Inventory New Absorption Vacancy Warehouse Land(SF) Supply (SF) (SF) Rate (%) Rent ($PSF) ($PSF)
1999 43,164,000 750,000 2,800,000 8.6 3.60 – 2000 44,164,000 1,000,000 1,200,000 6.0 3.20 – 2001 44,364,000 200,000 100,000 8.0 3.40 2.252002 44,764,000 400,000 0 9.0 3.20 2.502003 45,564,000 800,000 -30,000 10.8 3.20 2.502004 45,964,000 400,000 20,000 11.6 3.20 3.002005 46,764,000 800,000 1,923,000 9.1 3.20 4.252006 47,204,000 440,000 786,000 7.6 3.20 4.00
METROPOLITAN INDICATORS – 2007
• Gross Metro Product Percent Change: 0.9
• Total Employment Increase/Decrease: -300Percent Change: -0.1
• Unemployment Rate: 9.2
• Population (000): 900.3
Source: Moody’s Economy.com
C O L L I E R S I N T E R N AT I O N A L l U S R E A L E S TAT E R E V I E W 2 0 0 7
CONTACT: Mike Schuh • [email protected] l RESEARCH: Debbie Kidd • [email protected] 29
OFFICE
• Market totals approximately 19.5 million SF with another 4.5 millionSF in government-owned and occupied office buildings for total of 24 million SF.
• Vacancy at end of 2006 was 1.6 million SF or 8.35%, up from 7.21% in 2005.
• New construction in metro area is booming, with just over 1.0 millionSF added in 2006. Of that, nearly 735,000 SF leased by tenants orbuilt by owners/users.
• Increase in vacancy from 7.21% to 8.35%, both historically low rates,primarily due to remaining vacancy in new product and should beabsorbed in 2007.
• Approximately 80% of growth can be found in northwest and northeast areas of Fresno. Trend should continue in 2007.
Office Outlook• Central Valley has seen and will continue to see strong growth as
both population and businesses move inland for more affordable housing and better opportunities.
• Market remains favorable for high growth industries such as financialservices, medical services, and real estate related companies.
• As region grows, infrastructure expands to meet population needs.Two freeways expanded and will undergo further expansion; anotherhas government funds appropriated.
• Abundant land available for development.• High construction costs mean future rents will remain high
with moderate increases predicted for future. Purchase prices will continue to rise due to lack of available product.
INDUSTRIAL
• Major hub for distribution/warehouse users serving the Western US.• Most inexpensive place to live and conduct business in California.• Located in center of the fifth largest economy in the world.• Most productive agricultural region in United States.• High quality lifestyle, near major national parks, Pacific Ocean,
good schools, desirable climate.
Industrial Outlook • Strong growth as population and industries move inland for more
affordable housing and better business opportunities.• Quality infrastructure expands to meet the growing needs of region.• Distribution users consolidate multiple locations into single
warehouse to serve all of California from a single location.• Excellent supply of large Class A industrial parks available.• Favorable real estate costs and positive business climate.

GREENVILLE, SCC O L L I E R S I N T E R N AT I O N A L l U S R E A L E S TAT E R E V I E W 2 0 0 7
DOWNTOWN OFFICE
Inventory New Absorption Vacancy Class A(SF) Supply (SF) (SF) Rate (%) Rent ($PSF)
1999 – – – – –2000 2,695,000 0 88,000 14.0 18.752001 2,740,000 45,000 107,000 14.3 18.252002 2,923,000 183,000 154,000 13.8 18.252003 2,952,000 29,000 1,000 16.1 18.252004 3,014,000 62,000 9,000 16.3 18.502005 3,101,000 87,000 102,000 10.8 18.902006 3,101,000 0 28,000 12.0 16.50
SUBURBAN OFFICE
Inventory New Absorption Vacancy Class A(SF) Supply (SF) (SF) Rate (%) Rent ($PSF)
1999 – – – – –2000 3,235,000 0 64,000 21.0 17.252001 3,669,000 434,000 113,000 19.6 17.252002 3,669,000 0 -50,000 28.1 17.502003 3,744,000 75,000 -77,000 30.7 16.002004 3,772,000 28,000 60,000 28.8 16.752005 3,801,000 29,000 107,000 21.2 16.652006 3,801,000 0 232,000 16.2 18.50
INDUSTRIAL
Inventory New Absorption Vacancy Warehouse Land(SF) Supply (SF) (SF) Rate (%) Rent ($PSF) ($PSF)
1999 – – – – – – 2000 – – – – – – 2001 – – – – – – 2002 43,161,000 343,000 – 20.5 3.30 0.802003 43,423,000 262,000 -1,090,000 23.5 3.20 0.802004 43,787,000 364,000 1,099,000 21.5 3.20 –2005 43,787,000 – – – – – 2006 60,586,000 900,000 – 13.0 3.50 0.92
METROPOLITAN INDICATORS – 2007
• Gross Metro Product Percent Change: 1.2
• Total Employment Increase/Decrease: 400Percent Change: 0.1
• Unemployment Rate: 5.8
• Population (000): 603.2
Source: Moody’s Economy.com
30 CONTACT: Frank Hammond • [email protected] l RESEARCH: Kitty Allen • [email protected]
OFFICE
• Strong rebound late 2006, record absorption of 324,144 SF.• Class A strongest, rental rates up from $15.75 to $16.48 per SF,
4.4% increase.• LEED certified buildings developed as tenants push for “green” space.
Buildings include Clemson University ICAR campus, and 165,000 SFHubbell Lighting Headquarters.
• Mixed-use development trend. CBD includes, RiverPlace, McBeeStation, and The Bookends. Suburbs include Magnolia Park, formerGreenville Mall redevelopment.
• South Financial Group purchased 69 acres for $10 million along I-85for regional headquarters development.
• Out of state investment interest increasing with purchases ofWachovia Place for $30.9 million, Liberty Square I and II for $58 million.
• Engineers outnumber any other U.S. county. Sector reboundingimpacting suburban market. Fluor Corporation leasing 160,000 SF,with plans for more. Suburban Class A in short supply.
Office Outlook• Fluor Corporation will lease another 40,000 SF in 2007, which
continuing squeeze on suburban Class A.• Ford Motor Credit announced expansion, adding 200 associates to
current 350 and will expand offices by 28,000 SF.• Largest developments in pipeline include CU-ICAR campus off I-85
and RiverPlace in CBD. • Suburban Class B continues suffering. Office condominiums glut
competes for smaller tenants offering opportunity to own.
INDUSTRIAL
• High growth industries include research and development, warehouse/logistics, and light manufacturing. Expansion locally and regionally.
• High growth companies include BMW and suppliers.• New developments include 70,000 SF flex space and 80,000 SF spec
building at Matrix Parkway. Others are 20,000 SF, and 30,000 SFspec buildings in Woodfield Industrial Park. A 101,000 SF vacantspec building in Spartanburg was recently completed.
• Total of 10 million SF vacant and currently on market.• Significant transactions are Hillside II building, 307,000 SF leased;
Echostar, 316,000 SF leased; Caterpillar, 168,087 SF leased; Prologisleased approx. 200,000 SF.
• Land prices variable. Rough graded at $20,000 to $39,500 per acre;pad ready at $65,000 to $75,000 per acre. Acreage ranges from 8 to 72 acres.
Industrial Outlook• Seeing influx of companies migrating from Florida and Northeast. • Rezoning issues cropping up. Becoming more difficult to find entitled
property, and problem is increasing as re-zoning issues continue.• Several new developments including, construction of 300,000 SF spec
building in Spartanburg by local developer.

HARTFORD, CT
DOWNTOWN OFFICE
Inventory New Absorption Vacancy Class A(SF) Supply (SF) (SF) Rate (%) Rent ($PSF)
1999 9,575,000 0 96,000 25.1 22.002000 9,575,000 0 470,000 20.8 22.102001 9,575,000 0 106,000 19.8 22.102002 9,575,000 0 -305,000 19.9 24.202003 9,575,000 0 -141,000 20.5 24.202004 9,575,000 0 48,000 18.8 24.002005 9,947,000 372,000 210,000 20.6 24.302006 10,150,000 203,000 521,000 15.6 24.20
SUBURBAN OFFICE
Inventory New Absorption Vacancy Class A(SF) Supply (SF) (SF) Rate (%) Rent ($PSF)
1999 12,880,000 0 849,000 15.7 20.002000 12,880,000 0 451,000 12.2 21.502001 13,005,000 125,000 -486,000 16.1 20.802002 13,304,000 299,000 -157,000 18.1 19.902003 13,777,000 473,000 -97,000 20.7 20.602004 13,913,000 136,000 214,000 18.2 20.202005 14,236,000 323,000 316,000 17.7 20.102006 14,287,000 51,000 539,000 15.5 20.70
INDUSTRIAL
Inventory New Absorption Vacancy Warehouse Land(SF) Supply (SF) (SF) Rate (%) Rent ($PSF) ($PSF)
1999 61,361,000 150,000 150,000 14.5 4.00 – 2000 61,611,000 250,000 250,000 14.3 4.50 – 2001 61,761,000 150,000 160,000 14.2 4.50 1.102002 61,861,000 100,000 300,000 13.9 4.50 1.032003 62,678,000 817,000 900,000 13.2 4.30 1.002004 62,932,000 254,000 484,000 13.4 4.30 1.702005 63,082,000 150,000 241,000 13.2 4.50 1.722006 63,282,000 200,000 200,000 13.1 4.50 1.72
METROPOLITAN INDICATORS – 2007
• Gross Metro Product Percent Change: 2.7
• Total Employment Increase/Decrease: 6,100Percent Change: 1.0
• Unemployment Rate: 4.0
• Population (000): 1,201.5
Source: Moody’s Economy.com
C O L L I E R S I N T E R N AT I O N A L l U S R E A L E S TAT E R E V I E W 2 0 0 7
CONTACT: Keith J. Kumnick, SIOR • [email protected] l RESEARCH: James Stanulis • [email protected] 31
OFFICE
• Market size 24.2 million SF. Class A 14.3 million SF.• Overall vacancy 16.4%. Class A is 12.2 %.• Suburban Class A average gross rents at $20.61.• CBD Class A average gross rents remain at $24.19.• Absorption will top 1.0 million SF in 2006.• Market movers are health, insurance, and financial.• CBD saw three Class B sales from $20-44 per SF for 1.2 million SF,
all under rehab and repositioning for lease.• Suburbs have three large build-to-suits: Hartford Insurance
450,000 SF; ING 400,000 SF; and Mortgage Lenders Network305,000 SF. Total construction contracts $350 million.
• Only speculative construction for medical office in suburbs.• Housing starts off but apartment/condo developments at
historic volume.• Class A sales between $80-180 per SF with cap rates
from 6.75 to 8.9%.
INDUSTRIAL
• Inventory approximately 68 million SF.• Transition continues from manufacturing to warehouse distribution.• Overall vacancy rate approximately 10%, but numbers negatively
skewed by manufacturing facilities undergoing obsolescence.• Investment demand for facilities strong during 2006. Several large
facilities (500,000 plus), and portfolios traded. Varying degrees ofoccupancy, some vacant, some leases short term.
• Trend toward larger distribution centers over 500,000 SF continueswith construction on Walgreens’ 1.0 million SF. Other BTS’s completed with more future plans announced.
• Large leases signed including renewals and expansions. Examples areClark Steel (247,500 SF), Arett Sales (341,000 SF) and New BreedCorp, a 3PL (540,000 SF).
• A 13 building portfolio (1.5 million SF/98% leased) sold for $97 million. Investor acquired two facilities totaling 1.4 million SF for $57.5 million and resold year-end for $77 million.
• Lego’s multi-building campus (1.5 million SF) on market. Office, manufacturing and distribution center sold year-end for $59 million.
Industrial Outlook• Demand looks strong for 2007 as investors continue looking
for opportunities including net leased and vacant properties needing repositioning.
• Trend towards larger distribution centers expected to continue • Lack of high bay product and trend towards large facilities typically
results in build-to-suit for companies without flexibility. Increaseddemand for larger land sites (50-100 acres) expected to continue.
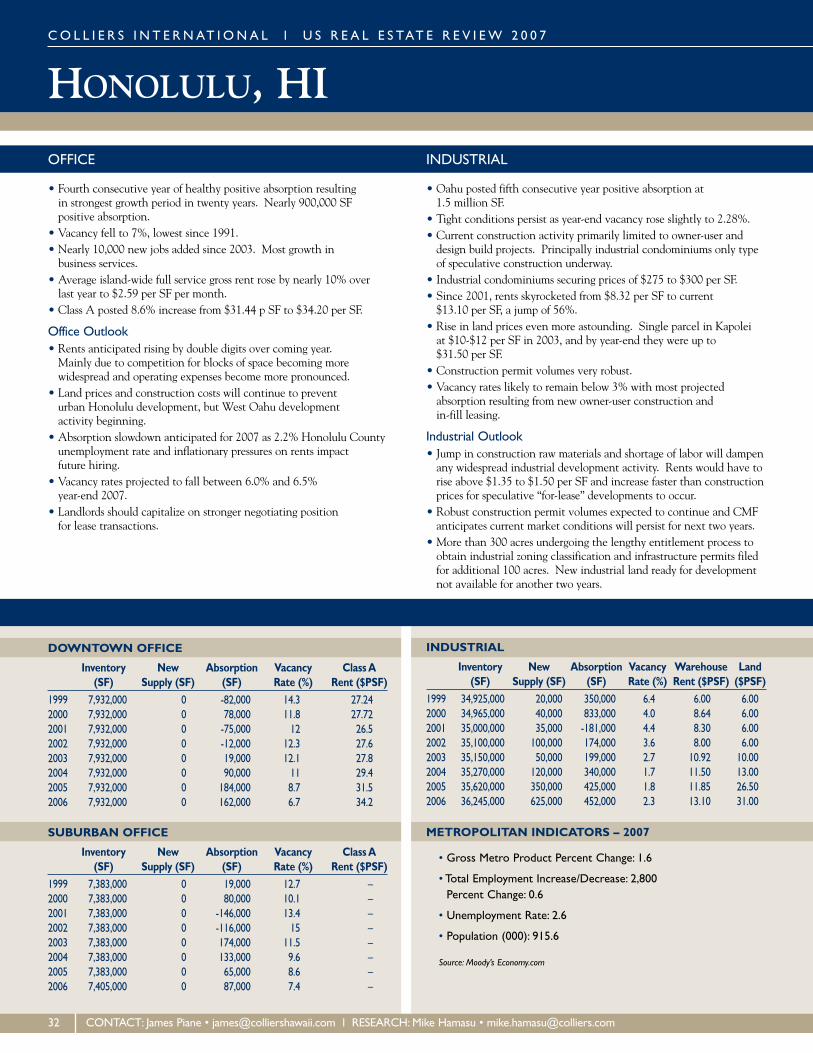
HONOLULU, HIC O L L I E R S I N T E R N AT I O N A L l U S R E A L E S TAT E R E V I E W 2 0 0 7
DOWNTOWN OFFICE
Inventory New Absorption Vacancy Class A(SF) Supply (SF) (SF) Rate (%) Rent ($PSF)
1999 7,932,000 0 -82,000 14.3 27.242000 7,932,000 0 78,000 11.8 27.722001 7,932,000 0 -75,000 12 26.52002 7,932,000 0 -12,000 12.3 27.62003 7,932,000 0 19,000 12.1 27.82004 7,932,000 0 90,000 11 29.42005 7,932,000 0 184,000 8.7 31.52006 7,932,000 0 162,000 6.7 34.2
SUBURBAN OFFICE
Inventory New Absorption Vacancy Class A(SF) Supply (SF) (SF) Rate (%) Rent ($PSF)
1999 7,383,000 0 19,000 12.7 –2000 7,383,000 0 80,000 10.1 –2001 7,383,000 0 -146,000 13.4 –2002 7,383,000 0 -116,000 15 –2003 7,383,000 0 174,000 11.5 –2004 7,383,000 0 133,000 9.6 –2005 7,383,000 0 65,000 8.6 –2006 7,405,000 0 87,000 7.4 –
INDUSTRIAL
Inventory New Absorption Vacancy Warehouse Land(SF) Supply (SF) (SF) Rate (%) Rent ($PSF) ($PSF)
1999 34,925,000 20,000 350,000 6.4 6.00 6.002000 34,965,000 40,000 833,000 4.0 8.64 6.002001 35,000,000 35,000 -181,000 4.4 8.30 6.002002 35,100,000 100,000 174,000 3.6 8.00 6.002003 35,150,000 50,000 199,000 2.7 10.92 10.002004 35,270,000 120,000 340,000 1.7 11.50 13.002005 35,620,000 350,000 425,000 1.8 11.85 26.502006 36,245,000 625,000 452,000 2.3 13.10 31.00
METROPOLITAN INDICATORS – 2007
• Gross Metro Product Percent Change: 1.6
• Total Employment Increase/Decrease: 2,800Percent Change: 0.6
• Unemployment Rate: 2.6
• Population (000): 915.6
Source: Moody’s Economy.com
32 CONTACT: James Piane • [email protected] l RESEARCH: Mike Hamasu • [email protected]
OFFICE
• Fourth consecutive year of healthy positive absorption resulting in strongest growth period in twenty years. Nearly 900,000 SF positive absorption.
• Vacancy fell to 7%, lowest since 1991. • Nearly 10,000 new jobs added since 2003. Most growth in
business services.• Average island-wide full service gross rent rose by nearly 10% over
last year to $2.59 per SF per month.• Class A posted 8.6% increase from $31.44 p SF to $34.20 per SF.
Office Outlook• Rents anticipated rising by double digits over coming year.
Mainly due to competition for blocks of space becoming more widespread and operating expenses become more pronounced.
• Land prices and construction costs will continue to prevent urban Honolulu development, but West Oahu development activity beginning.
• Absorption slowdown anticipated for 2007 as 2.2% Honolulu Countyunemployment rate and inflationary pressures on rents impact future hiring.
• Vacancy rates projected to fall between 6.0% and 6.5% year-end 2007.
• Landlords should capitalize on stronger negotiating position for lease transactions.
INDUSTRIAL
• Oahu posted fifth consecutive year positive absorption at 1.5 million SF.
• Tight conditions persist as year-end vacancy rose slightly to 2.28%.• Current construction activity primarily limited to owner-user and
design build projects. Principally industrial condominiums only typeof speculative construction underway.
• Industrial condominiums securing prices of $275 to $300 per SF. • Since 2001, rents skyrocketed from $8.32 per SF to current
$13.10 per SF, a jump of 56%. • Rise in land prices even more astounding. Single parcel in Kapolei
at $10-$12 per SF in 2003, and by year-end they were up to $31.50 per SF.
• Construction permit volumes very robust.• Vacancy rates likely to remain below 3% with most projected
absorption resulting from new owner-user construction and in-fill leasing.
Industrial Outlook• Jump in construction raw materials and shortage of labor will dampen
any widespread industrial development activity. Rents would have torise above $1.35 to $1.50 per SF and increase faster than constructionprices for speculative “for-lease” developments to occur.
• Robust construction permit volumes expected to continue and CMFanticipates current market conditions will persist for next two years.
• More than 300 acres undergoing the lengthy entitlement process toobtain industrial zoning classification and infrastructure permits filedfor additional 100 acres. New industrial land ready for developmentnot available for another two years.

HOUSTON, TX
DOWNTOWN OFFICE
Inventory New Absorption Vacancy Class A(SF) Supply (SF) (SF) Rate (%) Rent ($PSF)
1999 40,885,000 0 385,000 8.3 23.942000 40,885,000 0 134,000 7.9 26.552001 40,885,000 0 -725,000 9.8 28.142002 41,466,000 581,000 -979,000 16.0 24.262003 43,009,000 1,543,000 -831,000 20.9 22.512004 43,009,000 0 -24,000 21 21.312005 43,009,000 0 709,000 19.9 21.192006 43,009,000 0 1,556,000 16.3 23.90
SUBURBAN OFFICE
Inventory New Absorption Vacancy Class A(SF) Supply (SF) (SF) Rate (%) Rent ($PSF)
1999 167,442,000 4,536,000 811,000 11.2 21.262000 169,781,000 2,339,000 67,000 13.2 21.512001 170,543,000 762,000 301,000 14.2 21.992002 171,394,000 851,000 1,282,000 14.7 20.602003 171,774,000 380,000 -137,000 15.5 20.412004 172,101,000 327,000 1,717,000 15.2 19.792005 172,428,000 327,000 2,815,000 14.3 20.272006 173,265,000 837,000 4,352,000 12.6 22.38
INDUSTRIAL
Inventory New Absorption Vacancy Warehouse Land(SF) Supply (SF) (SF) Rate (%) Rent ($PSF) ($PSF)
1999 373,832,000 8,352,000 1,975,000 5.5 4.24 0.752000 382,800,000 8,968,000 3,327,000 6.5 4.44 1.002001 389,905,000 7,105,000 4,941,000 7.0 4.31 1.052002 395,993,000 6,088,000 1,279,000 8.0 4.22 1.002003 400,142,000 4,149,000 546,000 8.7 4.34 1.102004 403,957,000 3,815,000 7,818,000 7.8 4.29 1.202005 412,851,000 8,894,000 13,650,000 6.5 4.46 1.302006 415,979,000 3,128,000 4,131,000 6.6 4.45 1.50
METROPOLITAN INDICATORS – 2007
• Gross Metro Product Percent Change: 3.7
• Total Employment Increase/Decrease: 57,700Percent Change: 2.4
• Unemployment Rate: 5.3
• Population (000): 5,517.1
Source: Moody’s Economy.com
C O L L I E R S I N T E R N AT I O N A L l U S R E A L E S TAT E R E V I E W 2 0 0 7
CONTACT: Gary Mabray • [email protected] l RESEARCH: Rosalinda Engle • [email protected] 33
OFFICE
• Energy, law, healthcare, and technology, highest growth. Energy 50%economic base. Unprecedented oil prices at $61/bbl and natural gasat $6.64/mcf benefit region.
• Active energy companies are ChevronTexaco, EOG Resources, andReliant Resources.
• Infrastructure improvements completed. Westpark Tollway opened,also 610 West Loop.
• Developers added 1.1 million SF new multi-tenant space. Largest, 206,300 SF in Westchase began speculative, but 100% leasedwithin a few months. Several speculative projects announced for 3.8 million SF, despite another opening with 0% occupancy.
• Leasing robust with Chevron/Texaco’s 1.2 million SF in CBD, andBMC’s 400,000 SF in Westchase.
• Housing strong. Volume of $15.2 billion exceeded $14.2 billion in 2005.
• Availabilities dwindled with 28.8 million SF and vacancy at 13.3% down from 15.4%.
Office Outlook• Infrastructure improvements continue. Interstate 10 and U.S.
Highway 59 South expansions underway.• Several new speculative developments will break ground in 2007.
Eight starting Q1. • Other speculative developments continuing construction.
Opus South’s 250,000 SF build-to-suit completed early 2007. • Developers showing confidence given total in pipeline.
3.8 million SF proposed year-end 2006, 16 over 100,000 SF.• Housing expected strong in 2007.
INDUSTRIAL
• Energy, Port of Houston, and airport system largest industries.Manufacturing and logistics in submarkets.
• In Southeast corridor, port is economic driver with direct impact ontenant base. Construction of $1.2 billion Bayport Container andTerminal started, continuing for ten years.
• Infrastructure improvements steady, with some major projects completed.
• 3.1 million SF added. Largest include Vantage Companies’ 287,500 SF and 276,500 SF projects; and Prologis’ 192,000 SF warehouse.
• Leases include nearly 340,000 SF to Academy Sports and Outdoors;and Laufen Ceramics’ 200,000 SF.
• Major sales include 58,268 SF for $82.00 per SF, and 913,000 for$74.00 per SF.
• Availabilities remained unchanged with 28.5 million SF and flatvacancy of 6.9%.
• Most vacancies in Northwest, 8.1 million SF, and Southwest, 5.6 million SF.
Industrial Outlook• $1.2 billion container and terminal project expected to generate
estimated $1 billion annual business revenue, and $40 million annualtax revenue, in addition to 12,000 new jobs.
• Growth at port expected to continue driving new development in Southeast.
• 5.5 million SF under construction. Fastest growing submarkets are North and Northwest Corridors near airport and SoutheastCorridor near port.

INDIANAPOLIS, INC O L L I E R S I N T E R N AT I O N A L l U S R E A L E S TAT E R E V I E W 2 0 0 7
DOWNTOWN OFFICE
Inventory New Absorption Vacancy Class A(SF) Supply (SF) (SF) Rate (%) Rent ($PSF)
1999 10,691,000 54,000 4,000 12.0 21.002000 10,905,000 214,000 -270,000 16.0 21.002001 11,270,000 365,000 22,000 18.5 21.502002 11,270,000 0 117,000 17.5 19.602003 11,286,000 16,000 193,000 15.9 19.602004 11,348,000 62,000 129,000 15.2 19.602005 11,348,000 0 112,000 14.6 19.582006 11,412,000 64,000 -84,000 18.3 19.40
SUBURBAN OFFICE
Inventory New Absorption Vacancy Class A(SF) Supply (SF) (SF) Rate (%) Rent ($PSF)
1999 14,466,000 972,000 647,000 10.9 21.002000 16,034,000 1,568,000 640,000 15.7 23.002001 16,488,000 454,000 622,000 16.0 20.802002 16,927,000 439,000 -66,000 18.8 19.002003 17,502,000 575,000 135,000 20.7 19.002004 17,936,000 434,000 689,000 18.7 19.002005 18,203,000 267,000 297,000 18.3 19.112006 18,530,000 327,000 502,000 17.8 19.30
INDUSTRIAL
Inventory New Absorption Vacancy Warehouse Land(SF) Supply (SF) (SF) Rate (%) Rent ($PSF) ($PSF)
1999 187,647,000 5,537,000 4,765,000 6.9 4.25 – 2000 193,295,000 5,649,000 8,085,000 5.4 3.50 – 2001 199,255,000 5,960,000 316,000 8.1 4.50 1.722002 204,731,000 5,476,000 2,658,000 9.2 5.90 1.502003 207,019,000 2,289,000 3,837,000 8.4 4.80 2.402004 212,590,000 5,571,000 5,397,000 8.2 4.30 1.492005 212,590,000 2,939,000 4,825,000 7.3 5.90 –2006 223,245,000 5,776,000 5,726,000 6.5 5.75 –
METROPOLITAN INDICATORS – 2007
• Gross Metro Product Percent Change: 2.4
• Total Employment Increase/Decrease: 8,900Percent Change: 1.0
• Unemployment Rate: 5.0
• Population (000): 1,676.2
Source: Moody’s Economy.com
34 CONTACT: Luke Wessel • [email protected] l RESEARCH: Matt Briggs • [email protected]
OFFICE
• Growing market with over 1.7 million people, representing increaseof 106,000 between 2000 and 2004.
• Manufacturing provides 12% of the workforce in metro area, highest percentage.
• But job market changing. Number of manufacturing jobs in metroarea dropped by 11,000 between 2001 and 2005.
• Between 2001 and 2005 health care and social services sectors addedover 9,700 jobs.
• Submarkets added over 200,000 SF of new multi-tenant office inventory in 2006 and have another 500,000 SF currently under construction.
Office Outlook• The metro area’s population projected to increase by 15 percent,
by year 2025.• The employment levels expected to increase 10 percent by 2025.• By the year 2030, retail employment expected to increase
by 28 percent and non-retail employment expected to increase by 31 percent.
• Projected employment levels for year 2012 indicate the top tengrowth occupations in state, include: registered nurses, truck drivers,medical assistants, nurses’ aides, and teacher assistants.
• The submarkets have over 850,000 SF of new multi-tenant officeinventory proposed to begin construction in 2007 and 2008.
INDUSTRIAL
• The Indiana Manufacturer’s Association, reports 48,000 new manufacturing jobs returned since 2003.
• Market emerged as major distribution hub. From 2001 to 2003, distribution space accounted for 7.5 million SF, which ballooned to 16.7 million SF from 2004 to 2006.
• Industrial land prices continue to climb for improved, well-located ground.
• Within the past few years one ethanol plant has mushroomed to17, plus four new biodiesel plants.
• Since 2004, 273 new facilities have opened and last year the statesecured more than $6.9 billion in new projects.
Industrial Outlook• Continued logistics growth in Central Indiana pushing developers
further outward toward interstate routes to develop modern bulk product.• Second largest FedEx hub in world at Indianapolis International
Airport. Ongoing airport construction set for completion in 2008will help accommodate future freight volume.
• The development of our ports, including planned intermodal hub in Plainfield, could lead railroad freight directly here rather thanthrough Chicago.
• Major roadwork projects shaping up around the state keepingtrucking industry running smoothly.
• Purdue University was recently chosen to lead new $13 millionregional center aimed at improving transportation efficiency andsafety, coordinating intermodal shipping, and upgrading highwaysand infrastructure in the Midwest.

JACKSONVILLE, FL
DOWNTOWN OFFICE
Inventory New Absorption Vacancy Class A(SF) Supply (SF) (SF) Rate (%) Rent ($PSF)
1999 – – – – –2000 – – – – –2001 12,191,000 49,000 -269,000 9.7 18.902002 12,218,000 27,000 27,000 10.4 19.602003 12,358,000 140,000 -146,000 12.3 20.002004 12,358,000 0 -120,000 16.7 19.502005 12,358,000 0 514,000 16.7 23.002006 12,838,000 480,000 913,000 12.7 20.00
SUBURBAN OFFICE
Inventory New Absorption Vacancy Class A(SF) Supply (SF) (SF) Rate (%) Rent ($PSF)
1999 – – – – –2000 – – – – –2001 23,502,000 688,000 137,000 14.0 18.002002 23,880,000 378,000 -170,000 16.1 18.502003 24,523,000 643,000 1,057,000 13.6 18.002004 24,815,000 292,000 372,000 10.7 19.802005 25,023,000 208,000 224,000 13.2 19.802006 25,592,000 569,000 858,000 11.8 20.50
INDUSTRIAL
Inventory New Absorption Vacancy Warehouse Land(SF) Supply (SF) (SF) Rate (%) Rent ($PSF) ($PSF)
1999 – – – – – – 2000 – – – – – – 2001 77,944,000 438,000 -1,800,000 10.0 4.40 3.002002 78,414,000 470,000 -418,000 8.7 3.50 4.502003 80,190,000 1,776,000 2,126,000 8.7 3.50 5.002004 81,803,000 1,613,000 605,000 7.9 3.60 1.752005 83,759,000 1,956,000 2,073,000 8.1 3.70 2.002006 85,117,000 1,358,000 2,700,000 6.2 3.75 2.50
METROPOLITAN INDICATORS – 2007
• Gross Metro Product Percent Change: 2.1
• Total Employment Increase/Decrease: 5,300Percent Change: 0.8
• Unemployment Rate: 3.6
• Population (000): 1,290.7
Source: Moody’s Economy.com
C O L L I E R S I N T E R N AT I O N A L l U S R E A L E S TAT E R E V I E W 2 0 0 7
CONTACT: Fran Pepis • [email protected] l RESEARCH: Louis Galant • [email protected] 35
OFFICE
• Improving conditions reduced overall vacancy rate below 12% fromhigh of nearly 20% three years ago.
• Class A office space asking rents increased on average $.25 per SF to $1.00 per SF depending on location. Current rate over $20 per SF.
• Average sale prices with 65% or greater occupancy including qualitytenants, at $95 per SF in CBD and $100 per SF in suburbs.
• New companies locating to area and local businesses seeking expansion increasing absorption and furthering growth.
• Office condominiums gaining strength. Entrepreneurs and small businesses tending to own rather than pay escalating rents.
Office Outlook• Downtown remains attractive for financial institutions, law firms,
government, and businesses seeking a signature address. • Suburban growth will shift with expanding population toward
southern reaches and into adjacent counties.• Local demand for proposed Class A build-to-suit suburban properties
will dictate 100,000 to 150,000 SF driven by increasingly higheroccupancy rate, rising rents, and land costs.
• Rents expected to resume historical 3 to 5 percent increase per year,while vacancy rate anticipated dropping below 10 percent.
• Most build-to-suit projects tenant driven, resulting in additional space.
INDUSTRIAL
• Market poised for biggest boom in decades due to development ofMitsui O.S.K. container terminal at Jax Port, expected to open Spring2008, bringing 800,000 twenty-foot containers per year to area.
• Estimated shortage of 4 million SF of bulk warehouse space to meetdemand of Mitsui terminal.
• Historically stable rental rates on rise due to declining vacancies,increased construction and land costs, and rising demand for buildings.
• Vacancy for true bulk distribution space in Jacksonville is 5.25%, lowest in ten years.
• Bulk warehouse leasing rates at all-time high of $3.00-$3.85 per SFfor older facilities, NNN, to $4.25-$4.75 per SF, NNN for newer buildings.
Industrial Outlook• Development regulations continuing to encourage most construction
within business parks due to lack of available entitled land.• Growth in northeast expected to be generated from distribution,
with third-party logistics major contributor.• Increasing interest in port for maritime container carriers encouraging
Port Authority to construct two new cargo terminals over five years,upping total to five.
• Bulk warehousing will be increasingly moving west, along I-10 corridor, due to available, reasonably priced industrial land shortage.
• Greatest space demand remains for bulk warehousing and distribution, especially Northside and Westside.

KANSAS CITY, MO-KSC O L L I E R S I N T E R N AT I O N A L l U S R E A L E S TAT E R E V I E W 2 0 0 7
DOWNTOWN OFFICE
Inventory New Absorption Vacancy Class A(SF) Supply (SF) (SF) Rate (%) Rent ($PSF)
1999 9,905,000 241,000 333,000 10.2 21.352000 9,905,000 0 4,000 10.2 21.752001 10,179,000 274,000 7,000 12.5 20.952002 10,309,000 130,000 -439,000 17.9 21.002003 10,798,000 489,000 -186,000 23.3 20.352004 10,630,000 -168,000 -407,000 25.9 20.352005 11,001,000 371,000 73,000 27.8 20.822006 11,151,000 150,000 435,000 24.8 20.50
SUBURBAN OFFICE
Inventory New Absorption Vacancy Class A(SF) Supply (SF) (SF) Rate (%) Rent ($PSF)
1999 27,028,000 1,185,000 1,125,000 6.5 23.502000 28,692,000 1,664,000 870,000 8.9 22.352001 30,273,000 1,581,000 103,000 13.3 22.072002 30,879,000 606,000 -1,631,000 20.3 21.722003 31,192,000 313,000 96,000 20.8 21.452004 31,596,000 404,000 785,000 19.3 20.892005 31,858,000 262,000 727,000 17.7 20.082006 32,396,000 538,000 458,000 17.6 20.60
INDUSTRIAL
Inventory New Absorption Vacancy Warehouse Land(SF) Supply (SF) (SF) Rate (%) Rent ($PSF) ($PSF)
1999 157,239,000 3,650,000 3,479,000 5.0 3.80 – 2000 162,645,000 5,316,000 4,360,000 5.4 4.40 – 2001 166,028,000 3,382,000 -2,535,000 8.9 4.40 2.502002 168,582,000 2,555,000 1,124,000 9.6 3.80 2.752003 169,834,000 1,252,000 -757,000 10.7 3.80 3.002004 171,360,000 1,526,000 3,935,000 9.2 3.80 3.002005 171,360,000 2,114,000 1,600,000 9.4 3.95 1.802006 174,857,000 1,383,000 2,929,000 8.4 4.25 2.00
METROPOLITAN INDICATORS – 2007
• Gross Metro Product Percent Change: 2.3
• Total Employment Increase/Decrease: 8,800Percent Change: 0.9
• Unemployment Rate: 5.1
• Population (000): 1,987.1
Source: Moody’s Economy.com
36 CONTACT: Frazier Bell • [email protected] l RESEARCH: Carolyn Bagnall • [email protected]
OFFICE
• Inventory at 43.6 million SF leasable Class A or Class B.• IRS’s 1.1 million SF processing center opened south of downtown. • New 500,000 SF H&R Block headquarters opened, part of
Downtown revitalization.• Metro-area produced 890,000 SF net absorption. Vacancy fell
eight-tenths of a point, but remained high at 19.5% at end of 2006.• Major growth companies include H&R Block, Cerner Corporation,
Garmin International, and J.E. Dunn Construction.• Cerner Corporation negotiating lease and subsequent purchase of
500,000 SF campus, adding to the 1.4 million SF Cerner already owns and occupies.
• Corporate Woods, a suburban multi-tenant with 2.2 million SF ofClass A and B, sold for $285 million, largest value for metro-areaoffice property.
Office Outlook• The Kansas City economy continues growing, rate expected to slow
in 2007. The Mid-America Regional Council projected rate of 2.2 percent for year.
• Construction limited. However, owner-occupied and governmentalbuildings completed through 2008.
• Several arts, entertainment, and sports projects underway, contributing to major revitalization of Kansas City’s downtown.Projects include Sprint Arena, Kauffman Performing Arts Center, and Kansas City Live entertainment district. Sprint Arena andKansas City Live will open in 2007.
INDUSTRIAL
• Inventory at 175 million SF at the end of 2006.• Produced 2.9 million SF net absorption.• Vacancy at 8.4 percent, year-end, down one point from
year-end 2005.• Manufacturing performed well in 2006 despite national trends
and strong presence for Ford and GM. Recorded 580,000 SF netabsorption during year. Vacancy just 5%.
• GM plans to expand plant in metro area, third expansion in five years.
• Investor interest in industrial properties strong. Twelve investorsacquired total of five million square feet.
• The largest transaction, Cobalt Capital Investors acquired 1.7 millionSF portfolio from T.A. Associates Realty.
Industrial Outlook• Market in transition. Previously serving local and regional firms,
now regional and national firms targeting area for major distributionfacilities. Two new intermodal facilities playing role in new trend.
• Construction starting on BNSF intermodal facility in southwesternmetro area. Logistics park also being developed on 1,000-acre site.Ultimately, may contain up to 10 million SF distribution space.
• Second intermodal facility planned for former Richards-GebaurAirport site. Kansas City Southern providing rail service.
• 700,000 SF fulfillment center opened early 2007 for Musician’sFriend, subsidiary of Guitar Center, Inc. In spring 440,000 SF distribution facility opening for Pacific Sunwear.

LAS VEGAS, NV
DOWNTOWN OFFICE
Inventory New Absorption Vacancy Class A(SF) Supply (SF) (SF) Rate (%) Rent ($PSF)
1999 2,295,000 26,000 14,000 10.4 28.202000 2,353,000 58,000 14,000 12.0 29.042001 2,472,000 119,000 103,000 12.0 27.962002 2,779,000 307,000 262,000 12.3 27.242003 2,789,000 10,000 8,000 12.3 28.202004 3,005,000 216,000 33,000 17.6 28.802005 3,005,000 0 89,000 14.6 28.802006 3,005,000 0 261,000 5.9 39.00
SUBURBAN OFFICE
Inventory New Absorption Vacancy Class A(SF) Supply (SF) (SF) Rate (%) Rent ($PSF)
1999 17,139,000 1,665,000 1,108,000 10.7 26.042000 18,545,000 1,406,000 1,827,000 7.6 27.482001 20,347,000 1,802,000 962,000 11.1 26.282002 22,509,000 2,162,000 1,591,000 12.5 27.242003 23,725,000 1,216,000 975,000 12.9 30.122004 25,890,000 2,165,000 2,056,000 12.2 29.042005 28,250,000 2,360,000 3,163,000 8.4 29.882006 31,206,000 2,956,000 2,166,000 10.1 32.20
INDUSTRIAL
Inventory New Absorption Vacancy Warehouse Land(SF) Supply (SF) (SF) Rate (%) Rent ($PSF) ($PSF)
1999 64,369,000 3,711,000 2,477,000 7.2 3.84 – 2000 67,704,000 3,335,000 4,192,000 5.6 3.84 – 2001 72,402,000 4,698,000 2,812,000 7.8 4.08 9.432002 76,753,000 4,351,000 2,335,000 10.0 3.84 2.882003 79,724,000 2,971,000 1,497,000 11.5 4.80 2.902004 83,700,000 3,976,000 6,208,000 8.3 4.92 7.002005 87,331,000 3,631,000 6,727,000 4.4 5.52 6.662006 92,470,000 5,139,000 4,940,000 4.3 5.52 22.96
METROPOLITAN INDICATORS – 2007
• Gross Metro Product Percent Change: 4.8
• Total Employment Increase/Decrease: 34,300Percent Change: 3.7
• Unemployment Rate: 4.2
• Population (000): 1,841.8
Source: Moody’s Economy.com
C O L L I E R S I N T E R N AT I O N A L l U S R E A L E S TAT E R E V I E W 2 0 0 7
CONTACT: Mike Mixer • [email protected] l RESEARCH: John Stater • [email protected] 37
OFFICE
• Decline in residential construction. Commercial land stable.• Unemployment stands at 4.0%.• Class A and B inventory at 15 million SF. Over 1 million SF Class B
space completed in 2006.• Demand for Class A and B lagged behind new supply, with vacancy at
8.6%. Pre-leasing strong for projects currently under construction.• Several high-rise condo projects completed or under construction,
including Platinum Las Vegas, Soho Lofts, Vegas Grand, Palms Place,Trump Towers.
• Multi-use projects another hot development. Project City Center’s66 acres, and Town Square’s 1.5 million SF under construction.
Office Outlook• Overall, the economy is healthy. • No new Class A completed in 2006, but 2 million SF is either under
construction or beginning construction in 2007. Another 2 millionSF Class B under construction or planned.
• Tourist industry expected to produce annual records for gaming revenues, visitor counts, and airline passengers.
• Market for residential land expected to return by year-end 2007.• Job growth strong in Las Vegas Valley, but residential construction
downturn may begin impacting economy.
INDUSTRIAL
• Inventory at 92.5 million SF. Over 5 million SF completed in 2006.Almost 4 million SF under construction, with another 4 million SF to begin in 2007.
• Demand was strong at beginning of 2006, but ultimately laggedbehind new supply. Industrial vacancy at 4.3%, and has been risingfor two straight quarters.
• Forward industrial supply increased to 8,695,874 SF in Q4 from Q3’s7,163,493 SF. Of this amount, 47% under construction, withWarehouse/Distribution projects accounting for 76%. Remaining 53% planned space, 76% Warehouse/Distribution. North Las Vegas and Southwest, total 86% of supply.
Industrial Outlook• Residential construction is weak. Will have both a positive and
negative impact.• On the positive side, land prices might soften through early 2007.
High land prices have forced developers into higher asking rates, nowthey might start coming down again.
• On the negative side, construction industry is key occupant of industrial space. A slow down could lead to higher vacancy rates in short term.
• Still, market for residential land will return by year-end 2007. That will ultimately tighten land market again. Post-2010, developers may well be building outside Las Vegas Valley proper.
• Fourth quarter’s absorption was about 82% below quarterly average for2006; therefore we anticipate slight rise in vacancy through first twoquarters in 2007 with possible improvement by year’s end.

LITTLE ROCK, ARC O L L I E R S I N T E R N AT I O N A L l U S R E A L E S TAT E R E V I E W 2 0 0 7
DOWNTOWN OFFICE
Inventory New Absorption Vacancy Class A(SF) Supply (SF) (SF) Rate (%) Rent ($PSF)
1999 – – – – –2000 – – – – –2001 – – – – –2002 – – – – –2003 – – – – –2004 5,879,000 53,000 149,000 14.7 14.102005 5,717,000 -162,000 173,000 15.2 14.202006 5,669,000 -48,000 84,000 12.3 14.80
SUBURBAN OFFICE
Inventory New Absorption Vacancy Class A(SF) Supply (SF) (SF) Rate (%) Rent ($PSF)
1999 – – – – –2000 – – – – –2001 – – – – –2002 – – – – –2003 – – – – –2004 7,129,000 20,000 -39,000 8.8 –2005 7,189,000 60,000 117,000 8.8 17.902006 7,232,000 43,000 80,000 9.8 17.90
INDUSTRIAL
Inventory New Absorption Vacancy Warehouse Land(SF) Supply (SF) (SF) Rate (%) Rent ($PSF) ($PSF)
1999 – – – – – – 2000 – – – – – – 2001 – – – – – – 2002 – – – – – – 2003 – – – – – – 2004 15,284,000 215,000 327,000 12.5 3.80 2.502005 15,438,000 154,000 14,000 13.3 3.25 1.952006 15,438,000 0 449,000 10.3 3.25 2.00
METROPOLITAN INDICATORS – 2007
• Gross Metro Product Percent Change: 2.5
• Total Employment Increase/Decrease: 5,100Percent Change: 1.5
• Unemployment Rate: 5.1
• Population (000): 657.0
Source: Moody’s Economy.com
38 CONTACT: Steve Lane • [email protected] l RESEARCH: Marolyn Dorman • [email protected]
OFFICE
• High growth areas are professional services, and medical related services
• High growth companies are local banks, non profits, and health insurance
• Office occupancies continue to increase, therefore availability ratesmoving upward.
• Infrastructure initiatives include continued widening of Interstate 30 and Interstate 40.
• New development taking place downtown with new baseball parkand residential condos.
• Most significant sales were 550,000 SF Regions Center, and 268,598SF Bank of America.
• Currently land prices are flat.
Office Outlook• Retailers continue moving to the western suburbs.• Housing market is trending downward, especially high-end housing.• Downtown office converting to residential; Midtown apartments
converting to condos.
INDUSTRIAL
• Warehouse occupancies declining; rates stagnant• Midtown warehouses converted to office and apartments.• Land prices remain stagnant.
Industrial Outlook• In 2007, the largest anticipated delivery is 786,673 SF of Class A.
Expected to come on the market in January.• Also in January, another 456,922 SF expected to be delivered.• A smaller project of 191,600 SF is set for delivery sometime
in early 2007.• Market soft because of existing product coming on the market.• No new construction on horizon.• Small market, and highly sensitive to over supply.

LOS ANGELES, CA
DOWNTOWN OFFICE
Inventory New Absorption Vacancy Class A(SF) Supply (SF) (SF) Rate (%) Rent ($PSF)
1999 31,153,000 -100,000 -622,000 18.9 24.002000 31,153,000 0 -88,000 19.4 24.502001 31,227,000 74,000 478,000 18.4 24.602002 31,227,000 0 -67,000 19.5 24.002003 31,227,000 0 -86,000 19.8 24.202004 31,227,000 0 162,000 20.3 25.202005 31,282,000 55,000 1,186,000 16.3 27.702006 31,282,000 0 48,000 15.8 34.40
SUBURBAN OFFICE
Inventory New Absorption Vacancy Class A(SF) Supply (SF) (SF) Rate (%) Rent ($PSF)
1999 129,936,000 5,788,000 6,654,000 11.9 28.002000 138,007,000 8,071,000 11,159,000 11.9 31.002001 140,947,000 2,940,000 -2,938,000 14.2 30.302002 143,813,000 2,866,000 -1,864,000 16.7 29.002003 145,164,000 1,351,000 1,252,000 17.0 28.302004 145,679,000 515,000 2,944,000 14.0 29.302005 146,473,000 794,000 5,042,000 10.7 30.102006 147,291,000 818,000 3,636,000 9.4 32.40
INDUSTRIAL
Inventory New Absorption Vacancy Warehouse Land(SF) Supply (SF) (SF) Rate (%) Rent ($PSF) ($PSF)
1999 659,137,000 26,408,000 38,090,000 5.4 6.60 – 2000 694,174,000 35,037,000 44,337,000 4.4 6.10 – 2001 723,978,000 29,804,000 14,628,000 6.3 6.60 5.002002 732,201,000 8,223,000 6,233,000 6.4 7.00 12.002003 739,308,000 7,107,000 11,085,000 3.6 6.40 13.002004 746,191,000 6,883,000 10,951,000 2.8 6.50 13.802005 752,664,000 6,473,000 11,075,000 2.7 6.85 25.002006 757,502,000 4,838,000 5,037,000 2.6 7.67 30.00
METROPOLITAN INDICATORS – 2007
• Gross Metro Product Percent Change: 2.2
• Total Employment Increase/Decrease: 24,600Percent Change: 0.6
• Unemployment Rate: 4.9
• Population (000): 10,026.3
Source: Moody’s Economy.com
C O L L I E R S I N T E R N AT I O N A L l U S R E A L E S TAT E R E V I E W 2 0 0 7
CONTACT: Rich Davis • [email protected] l RESEARCH: Michael Washington • [email protected] 39
OFFICE
• Nation’s 4th largest office market.• Inventory 252 million SF.• Vacancy rates averages around 10%.• Absorption up. Vacancy rates decreasing. Rents increasing
5-7% Class A.• Absorption of 3.5 million SF.• Delivered over 2.1 million SF.• Sale prices continue increasing over 40%. Some in $350+ per SF range.• Lack of large contiguous space in Class A.• Leasing activity in over 24 million SF.
Office Outlook• 7.1 million SF planned.• Population out-migration to neighboring states will not affect growth.• Education, apparel, and leisure growth industries.• Residential building and finance companies most impacted by
economy. Housing affordability remains an issue.• Multi-housing will continue rent increases.• Office rents will increase by less than 10% due to new
construction deliveries.• Sales will increase slightly even with scarcity of land, construction
costs, and zoning concerns.• Gross Business Tax (1-5%) remains issue for businesses and politicians.• New developments like LA Live and Grand Avenue Project, Americana
at Brand, and Universal Citywalk, will headline real estate news.• Less value-add institutional opportunities may cause sales volume decrease.• Private client investors, foreign investors, and entrepreneurs remain
active buyers.
INDUSTRIAL
• Nation’s largest industrial market.• Inventory at 1.2 billion SF.• Lowest vacancy of any major market nationwide.• Absorption up, at 6.5 million SF, vacancy flat, rents rising 15-20%.• Delivered over 18 million SF in past year.• Sale prices rising over 20%. Some $112+ per SF.• Limited big box availability other than Inland Empire.• Trend in conversions to mixed-use/residential. Zoning favoring trend.
Industrial Outlook• 4 million SF planned, with deliveries to support increasing demand.• Continued big box growth.• Manufacturing, bio-tech, and IT are growth industries.• Investment interest in manufacturing and industrial products.• Sales and rent increases due to lack of supply. Between 7-10%.• Housing costs pushing businesses and workers outside LA.• Interest from institutional and private client businesses and
investors in 2007.

LOS ANGELES/INLAND EMPIRE, CAC O L L I E R S I N T E R N AT I O N A L l U S R E A L E S TAT E R E V I E W 2 0 0 7
INDUSTRIAL
Inventory New Absorption Vacancy Warehouse Land(SF) Supply (SF) (SF) Rate (%) Rent ($PSF) ($PSF)
1999 – – – – – – 2000 – – – – – – 2001 – – – – – – 2002 286,740,000 168,000 1,594,000 9.0 4.70 5.502003 293,192,000 6,452,000 9,149,000 6.2 4.70 5.802004 300,061,000 6,869,000 7,147,000 5.8 4.70 5.752005 311,771,000 11,710,000 11,783,000 4.0 5.15 7.252006 338,140,000 26,369,000 18,359,000 5.4 5.58 8.15
40 CONTACT: Rich Davis • [email protected] l RESEARCH: Michael Washington • [email protected]
INDUSTRIAL
• Nation’s fastest growing industrial market.• Industrial inventory at 101 million SF.• 17 million SF under construction, 46.5 million SF planned.• IE Vacancy rate of <5%.• Vacancy trending up due to deliveries. Rents rising 2-5%.• Sales $70-$80 per SF. Big box sales $50-$60 per SF.• Large inventory of new big box attracts tenants and buyers.
Industrial Outlook• Continued growth from west, 46.5 million SF planned.• Transportation, warehousing, and logistics are growth industries.• Continued demand for big box.• Moderate growth in rents and sales at 3 to 7%.• Relatively affordable housing and rents will attract businesses.• Growing retail and mixed-use to support thriving
manufacturing business.• Some institutional investment interest expected.• Expansion putting demand on infrastructure, especially
transportation. Conditions should drive other services to market.• Look for more apartment complexes to support growing population.
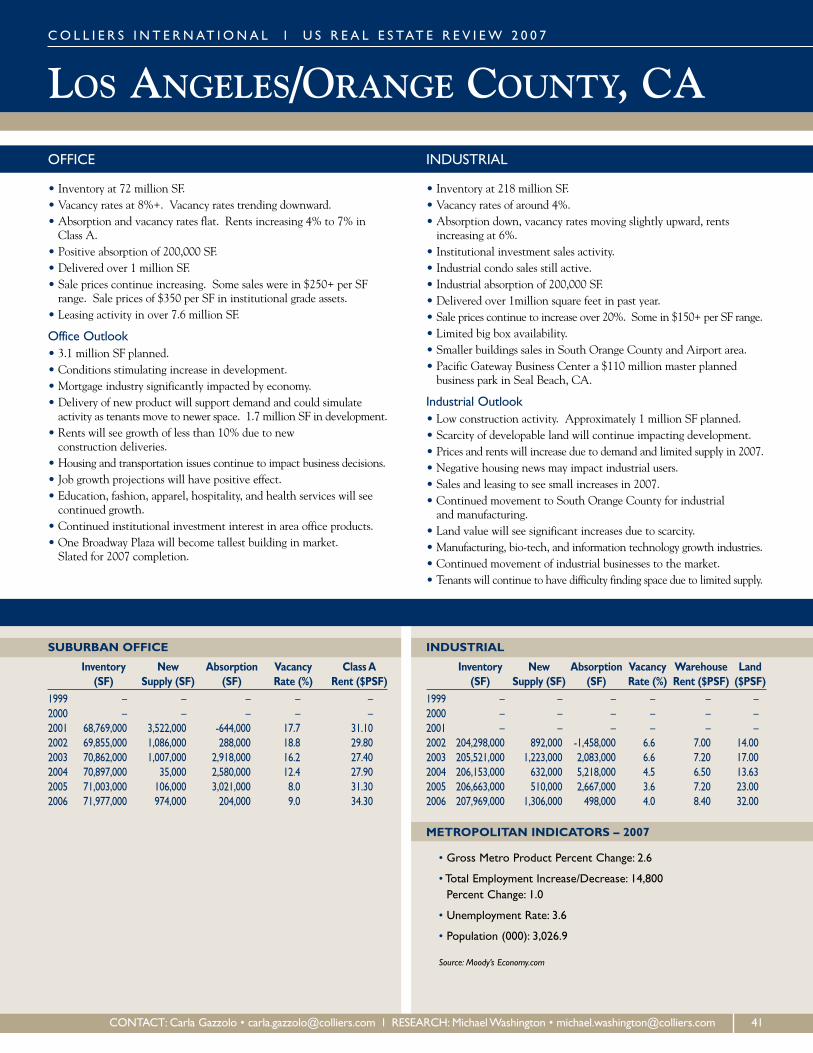
LOS ANGELES/ORANGE COUNTY, CA
SUBURBAN OFFICE
Inventory New Absorption Vacancy Class A(SF) Supply (SF) (SF) Rate (%) Rent ($PSF)
1999 – – – – –2000 – – – – –2001 68,769,000 3,522,000 -644,000 17.7 31.102002 69,855,000 1,086,000 288,000 18.8 29.802003 70,862,000 1,007,000 2,918,000 16.2 27.402004 70,897,000 35,000 2,580,000 12.4 27.902005 71,003,000 106,000 3,021,000 8.0 31.302006 71,977,000 974,000 204,000 9.0 34.30
INDUSTRIAL
Inventory New Absorption Vacancy Warehouse Land(SF) Supply (SF) (SF) Rate (%) Rent ($PSF) ($PSF)
1999 – – – – – – 2000 – – – – – – 2001 – – – – – – 2002 204,298,000 892,000 -1,458,000 6.6 7.00 14.002003 205,521,000 1,223,000 2,083,000 6.6 7.20 17.002004 206,153,000 632,000 5,218,000 4.5 6.50 13.632005 206,663,000 510,000 2,667,000 3.6 7.20 23.002006 207,969,000 1,306,000 498,000 4.0 8.40 32.00
METROPOLITAN INDICATORS – 2007
• Gross Metro Product Percent Change: 2.6
• Total Employment Increase/Decrease: 14,800Percent Change: 1.0
• Unemployment Rate: 3.6
• Population (000): 3,026.9
Source: Moody’s Economy.com
C O L L I E R S I N T E R N AT I O N A L l U S R E A L E S TAT E R E V I E W 2 0 0 7
CONTACT: Carla Gazzolo • [email protected] l RESEARCH: Michael Washington • [email protected] 41
OFFICE
• Inventory at 72 million SF.• Vacancy rates at 8%+. Vacancy rates trending downward.• Absorption and vacancy rates flat. Rents increasing 4% to 7% in
Class A.• Positive absorption of 200,000 SF.• Delivered over 1 million SF.• Sale prices continue increasing. Some sales were in $250+ per SF
range. Sale prices of $350 per SF in institutional grade assets.• Leasing activity in over 7.6 million SF.
Office Outlook• 3.1 million SF planned.• Conditions stimulating increase in development.• Mortgage industry significantly impacted by economy.• Delivery of new product will support demand and could simulate
activity as tenants move to newer space. 1.7 million SF in development.• Rents will see growth of less than 10% due to new
construction deliveries.• Housing and transportation issues continue to impact business decisions.• Job growth projections will have positive effect.• Education, fashion, apparel, hospitality, and health services will see
continued growth.• Continued institutional investment interest in area office products.• One Broadway Plaza will become tallest building in market.
Slated for 2007 completion.
INDUSTRIAL
• Inventory at 218 million SF.• Vacancy rates of around 4%.• Absorption down, vacancy rates moving slightly upward, rents
increasing at 6%.• Institutional investment sales activity.• Industrial condo sales still active.• Industrial absorption of 200,000 SF.• Delivered over 1million square feet in past year.• Sale prices continue to increase over 20%. Some in $150+ per SF range.• Limited big box availability.• Smaller buildings sales in South Orange County and Airport area.• Pacific Gateway Business Center a $110 million master planned
business park in Seal Beach, CA.
Industrial Outlook• Low construction activity. Approximately 1 million SF planned. • Scarcity of developable land will continue impacting development.• Prices and rents will increase due to demand and limited supply in 2007.• Negative housing news may impact industrial users.• Sales and leasing to see small increases in 2007.• Continued movement to South Orange County for industrial
and manufacturing.• Land value will see significant increases due to scarcity.• Manufacturing, bio-tech, and information technology growth industries.• Continued movement of industrial businesses to the market.• Tenants will continue to have difficulty finding space due to limited supply.

LOUISVILLE, KYC O L L I E R S I N T E R N AT I O N A L l U S R E A L E S TAT E R E V I E W 2 0 0 7
DOWNTOWN OFFICE
Inventory New Absorption Vacancy Class A(SF) Supply (SF) (SF) Rate (%) Rent ($PSF)
1999 – – – – –2000 – – – – –2001 8,854,000 0 -374,000 16.2 16.102002 9,095,000 241,000 -125,000 18.5 20.002003 9,095,000 0 -25,000 21.0 19.402004 9,171,000 76,000 -150,000 23.4 19.402005 9,171,000 0 312,000 32.3 19.402006 9,171,000 0 383,000 15.3 20.00
SUBURBAN OFFICE
Inventory New Absorption Vacancy Class A(SF) Supply (SF) (SF) Rate (%) Rent ($PSF)
1999 – – – – –2000 – – – – –2001 8,396,000 146,000 176,000 19.5 17.902002 8,665,000 269,000 261,000 19.1 17.502003 8,665,000 0 172,000 17.7 17.702004 8,665,000 0 -13,000 17.7 18.002005 8,665,000 0 -43,000 15.8 17.602006 8,849,000 184,000 124,000 16.4 17.10
INDUSTRIAL
Inventory New Absorption Vacancy Warehouse Land(SF) Supply (SF) (SF) Rate (%) Rent ($PSF) ($PSF)
1999 – – – – – – 2000 – – – – – – 2001 – – – – – – 2002 78,733,000 561,000 -231,000 19.0 3.40 2.302003 79,458,000 725,000 1,716,000 16.7 3.30 2.302004 80,707,000 1,249,000 1,854,000 7.5 3.80 2.182005 82,767,000 2,060,000 2,734,000 7.9 3.95 3.092006 86,567,000 3,800,000 4,517,000 6.7 3.95 3.32
METROPOLITAN INDICATORS – 2007
• Gross Metro Product Percent Change: 1.9
• Total Employment Increase/Decrease: 4,100Percent Change: 0.7
• Unemployment Rate: 6.2
• Population (000): 1,225.7
Source: Moody’s Economy.com
42 CONTACT: Doug Owen • [email protected] l RESEARCH: Doug Owen • [email protected]
OFFICE
• Economy strong and growing.• Inventory at year-end nearly 20 million SF leasable
Class A or B space.• Construction limited over last few years. However, a number of
build-to-suit projects completed in 2006. • A 150,000 SF Class A building completed at close of 2006, first since
2002, and has secured 40,000 SF tenant. • Vacancy both Class A and B continued to decline. • Major growth companies in include Humana Healthcare, ResCare,
and Kindred Healthcare. • First Residential Mortgage Network Inc. began 300-person
staff increase.• Norton Commons, a suburban mixed-use secured 110,000 SF surgery
center, 35,000 SF law firm, and is negotiating for 24,000 SF medialoffice building.
Office Outlook• Growth expected to continue, but may slow in 2007. • CBD continues its revitalization, which includes increased residential
units, retail expansion, and new top tier hotels. • A new sports arena and a 61-story mix-used facility are planed for
downtown waterfront.
INDUSTRIAL
• Absorption exceeding 3 million SF prompting developers to proposesignificant new construction.
• UPS announced $1 billion expansion of airport facilities.• Large manufacturers including Ford and Alcoa announced cutbacks.• Medical industry providers planning distribution facilities include
Johnson & Johnson 322,000 SF, Genentech 160,000 SF, and HDSmith 120,000 SF.
• Bullitt County continues attracting distribution facility developersand users.
• Users and developers beginning to consider southern Indiana, Shelby County and Oldham County due to limited available land in traditional industrial areas,
• Housing market slowed, but average purchase price only 2% lowerthan 2005.
• Major transactions include: UPS Supply Chain Solutions’ 822,500SF purchase; Johnson & Johnson’s 322,000 SF lease; and Konica’s315,000 SF lease.
• Land prices continue escalating as viable sites diminish. Industrial tract pricing ranges from $150,000 to $200,000 per acre in premier locations.
Industrial Outlook• Developers proposing almost 2,000,000 SF of new construction for
2007, due to high absorption, and increasing demand.• Expect current supply of existing facilities and viable development
sites in traditional markets to diminish, and users and developers topursue locations in previously untapped areas such as southernIndiana and Shelby County.
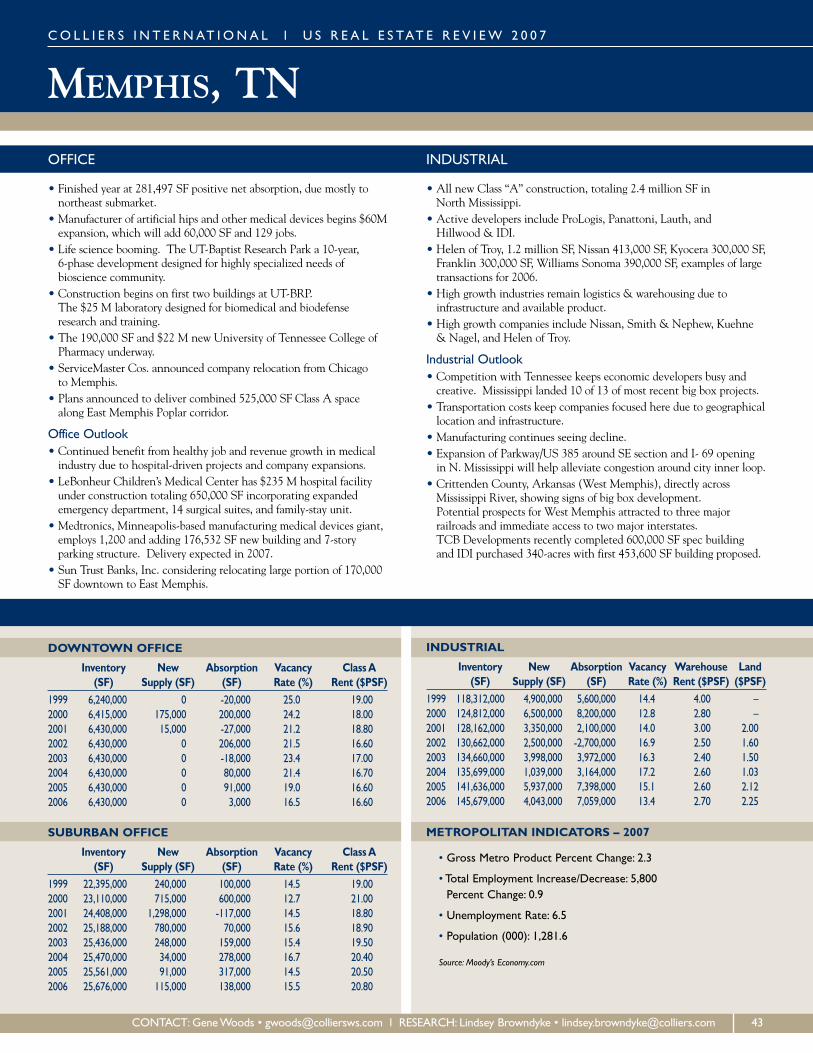
MEMPHIS, TN
DOWNTOWN OFFICE
Inventory New Absorption Vacancy Class A(SF) Supply (SF) (SF) Rate (%) Rent ($PSF)
1999 6,240,000 0 -20,000 25.0 19.002000 6,415,000 175,000 200,000 24.2 18.002001 6,430,000 15,000 -27,000 21.2 18.802002 6,430,000 0 206,000 21.5 16.602003 6,430,000 0 -18,000 23.4 17.002004 6,430,000 0 80,000 21.4 16.702005 6,430,000 0 91,000 19.0 16.602006 6,430,000 0 3,000 16.5 16.60
SUBURBAN OFFICE
Inventory New Absorption Vacancy Class A(SF) Supply (SF) (SF) Rate (%) Rent ($PSF)
1999 22,395,000 240,000 100,000 14.5 19.002000 23,110,000 715,000 600,000 12.7 21.002001 24,408,000 1,298,000 -117,000 14.5 18.802002 25,188,000 780,000 70,000 15.6 18.902003 25,436,000 248,000 159,000 15.4 19.502004 25,470,000 34,000 278,000 16.7 20.402005 25,561,000 91,000 317,000 14.5 20.502006 25,676,000 115,000 138,000 15.5 20.80
INDUSTRIAL
Inventory New Absorption Vacancy Warehouse Land(SF) Supply (SF) (SF) Rate (%) Rent ($PSF) ($PSF)
1999 118,312,000 4,900,000 5,600,000 14.4 4.00 – 2000 124,812,000 6,500,000 8,200,000 12.8 2.80 – 2001 128,162,000 3,350,000 2,100,000 14.0 3.00 2.002002 130,662,000 2,500,000 -2,700,000 16.9 2.50 1.602003 134,660,000 3,998,000 3,972,000 16.3 2.40 1.502004 135,699,000 1,039,000 3,164,000 17.2 2.60 1.032005 141,636,000 5,937,000 7,398,000 15.1 2.60 2.122006 145,679,000 4,043,000 7,059,000 13.4 2.70 2.25
METROPOLITAN INDICATORS – 2007
• Gross Metro Product Percent Change: 2.3
• Total Employment Increase/Decrease: 5,800Percent Change: 0.9
• Unemployment Rate: 6.5
• Population (000): 1,281.6
Source: Moody’s Economy.com
C O L L I E R S I N T E R N AT I O N A L l U S R E A L E S TAT E R E V I E W 2 0 0 7
CONTACT: Gene Woods • [email protected] l RESEARCH: Lindsey Browndyke • [email protected] 43
OFFICE
• Finished year at 281,497 SF positive net absorption, due mostly tonortheast submarket.
• Manufacturer of artificial hips and other medical devices begins $60Mexpansion, which will add 60,000 SF and 129 jobs.
• Life science booming. The UT-Baptist Research Park a 10-year, 6-phase development designed for highly specialized needs of bioscience community.
• Construction begins on first two buildings at UT-BRP. The $25 M laboratory designed for biomedical and biodefenseresearch and training.
• The 190,000 SF and $22 M new University of Tennessee College ofPharmacy underway.
• ServiceMaster Cos. announced company relocation from Chicago to Memphis.
• Plans announced to deliver combined 525,000 SF Class A spacealong East Memphis Poplar corridor.
Office Outlook• Continued benefit from healthy job and revenue growth in medical
industry due to hospital-driven projects and company expansions.• LeBonheur Children’s Medical Center has $235 M hospital facility
under construction totaling 650,000 SF incorporating expandedemergency department, 14 surgical suites, and family-stay unit.
• Medtronics, Minneapolis-based manufacturing medical devices giant,employs 1,200 and adding 176,532 SF new building and 7-story parking structure. Delivery expected in 2007.
• Sun Trust Banks, Inc. considering relocating large portion of 170,000SF downtown to East Memphis.
INDUSTRIAL
• All new Class “A” construction, totaling 2.4 million SF in North Mississippi.
• Active developers include ProLogis, Panattoni, Lauth, and Hillwood & IDI.
• Helen of Troy, 1.2 million SF, Nissan 413,000 SF, Kyocera 300,000 SF,Franklin 300,000 SF, Williams Sonoma 390,000 SF, examples of largetransactions for 2006.
• High growth industries remain logistics & warehousing due to infrastructure and available product.
• High growth companies include Nissan, Smith & Nephew, Kuehne& Nagel, and Helen of Troy.
Industrial Outlook• Competition with Tennessee keeps economic developers busy and
creative. Mississippi landed 10 of 13 of most recent big box projects.• Transportation costs keep companies focused here due to geographical
location and infrastructure.• Manufacturing continues seeing decline.• Expansion of Parkway/US 385 around SE section and I- 69 opening
in N. Mississippi will help alleviate congestion around city inner loop.• Crittenden County, Arkansas (West Memphis), directly across
Mississippi River, showing signs of big box development. Potential prospects for West Memphis attracted to three major railroads and immediate access to two major interstates. TCB Developments recently completed 600,000 SF spec building and IDI purchased 340-acres with first 453,600 SF building proposed.

MIAMI/DADE COUNTY, FLC O L L I E R S I N T E R N AT I O N A L l U S R E A L E S TAT E R E V I E W 2 0 0 7
DOWNTOWN OFFICE
Inventory New Absorption Vacancy Class A(SF) Supply (SF) (SF) Rate (%) Rent ($PSF)
1999 8,194,000 0 -154,000 10.0 28.002000 8,194,000 0 34,000 10.0 28.002001 8,194,000 0 0 10.7 27.802002 8,194,000 0 -284,000 11.9 28.202003 8,194,000 0 42,000 11.6 29.602004 8,194,000 0 72,000 12.4 30.302005 8,194,000 0 158,000 9.2 30.402006 8,194,000 0 -2,000 9.2 33.10
SUBURBAN OFFICE
Inventory New Absorption Vacancy Class A(SF) Supply (SF) (SF) Rate (%) Rent ($PSF)
1999 60,259,000 624,000 -744,000 8.4 –2000 60,259,000 0 1,541,000 6.5 27.202001 61,734,000 1,475,000 -449,000 11.8 28.002002 63,167,000 1,433,000 -114,000 12.3 28.702003 63,892,000 725,000 533,000 12.5 29.702004 64,996,000 1,104,000 2,062,000 11.3 28.902005 65,703,000 707,000 1,746,000 8.4 30.002006 66,126,000 423,000 1,324,000 7.8 34.50
INDUSTRIAL
Inventory New Absorption Vacancy Warehouse Land(SF) Supply (SF) (SF) Rate (%) Rent ($PSF) ($PSF)
1999 196,535,000 2,355,000 -2,589,000 6.9 – – 2000 197,954,000 1,419,000 1,319,000 7.1 6.00 – 2001 200,849,000 2,895,000 -556,000 9.8 5.00 20.182002 202,576,000 1,727,000 1,302,000 9.4 5.90 15.002003 203,590,000 1,014,000 2,934,000 8.2 5.90 11.002004 204,814,000 1,224,000 2,881,000 6.5 6.00 10.002005 206,262,000 1,448,000 4,524,000 4.3 7.35 9.002006 207,709,000 1,447,000 346,000 4.5 7.63 21.00
METROPOLITAN INDICATORS – 2007
• Gross Metro Product Percent Change: 2.9
• Total Employment Increase/Decrease: 16,500Percent Change: 1.6
• Unemployment Rate: 4.2
• Population (000): 2,435.6
Source: Moody’s Economy.com
44 CONTACT: Michael Fay • [email protected] l RESEARCH: Jan McLane • [email protected]
OFFICE
• New construction low for market at 548,214 SF.• Overall rental rates approximately 10% higher than a year ago. • Office condo market jumped about mid-year, then came down just as
quickly, surprisingly quick turnaround in interest. • Median home prices down 6.5%, and inventory up 116%.
Residential market correcting over South Florida. • Relevant office sales second half 2006: The 160,000 SF Lincoln in
Miami Beach sold for $468 per SF; New World Tower (272,000 SF)on Biscayne Blvd. sold for $220 per SF; The 396,000 SF at 1221 Brickell sold for $282 per SF; A 494,000 SF three building portfolio at Blue Lagoon sold for $200 per SF.
Office Outlook• Rental rates expected to continue rising, due to escalating insurance.• Landlords changing over to triple net leases to help pass on rising
operating expenses. • Over 2.7 million SF are under construction. Largest project
“Downtown Miami,” in CBD, a mixed-use 700,000 SF developmenton 9.3 acres with delivery 6/09.
• Institutional owners will fare better with escalating insurance ratesdue to ability to pool properties for lower rates, which reportedly cancut rates in half.
• Miami very tight and will continue to be positive throughout 2007.
INDUSTRIAL
• Vacancy rates at historic low, rental rates rose.• The Roca Tile Group, fifth largest tile maker in world, leased
134,838 SF in Dolphin Commerce Center.• The 978,164 SF ABC distribution headquarters in Hialeah sold for
$90M, included 29 acres. Buyers plan to develop 600,000 SF. • Over 3.6 million SF absorbed.• 12 properties with 915,673 SF of new product delivered in 2006.
Industrial Outlook• Procacci Development purchased 29 acres for new industrial and
office development in Dolphin Commerce Center for $21.4 million.• There are 2,474,113 SF under construction, largest project the
268,000 SF Turnpike Distribution Center in Medley.• Rental rates expected to rise as operating expenses, particularly
insurance, also rise.• Vacancy rates expected to stay low in tight market, fueled by
migration from Latin American industries looking to expand to US.• 2.5 million SF of product proposed for county, most in
northernmost region.

MILWAUKEE, WI
DOWNTOWN OFFICE
Inventory New Absorption Vacancy Class A(SF) Supply (SF) (SF) Rate (%) Rent ($PSF)
1999 15,007,000 167,000 105,000 15.7 -2000 15,122,000 115,000 74,000 15.0 23.502001 15,122,000 0 -976,000 14.5 23.002002 15,317,000 195,000 250,000 9.3 23.002003 15,838,000 521,000 1,003,000 10.7 23.002004 15,838,000 0 121,000 9.9 22.002005 15,838,000 0 -1,029,000 11.9 22.002006 15,838,000 0 494,000 14.1 22.00
SUBURBAN OFFICE
Inventory New Absorption Vacancy Class A(SF) Supply (SF) (SF) Rate (%) Rent ($PSF)
1999 36,077,000 550,000 110,000 10.9 0.002000 36,594,000 517,000 318,000 9.1 21.502001 37,188,000 594,000 371,000 1.5 21.002002 37,394,000 206,000 0 11.9 21.002003 37,894,000 500,000 918,000 10.8 21.002004 38,394,000 500,000 1,398,000 8.3 21.002005 38,416,000 22,000 -341,000 8.9 21.002006 38,416,000 0 16,000 12.0 21.00
INDUSTRIAL
Inventory New Absorption Vacancy Warehouse Land(SF) Supply (SF) (SF) Rate (%) Rent ($PSF) ($PSF)
1999 252,203,000 2,000,000 3,750,000 2.9 4.00 – 2000 255,203,000 3,000,000 4,000,000 3.7 4.00 – 2001 257,703,000 2,500,000 1,200,000 6.0 4.00 1.752002 259,203,000 1,500,000 -1,500,000 7.7 4.00 2.052003 264,523,000 5,320,000 14,376,000 6.7 4.30 2.002004 271,011,000 6,488,000 4,933,000 7.1 4.30 2.252005 272,050,000 1,039,000 537,000 7.2 4.20 1.722006 274,900,000 2,850,000 -650,000 7.7 4.20 1.85
METROPOLITAN INDICATORS – 2007
• Gross Metro Product Percent Change: 2.2
• Total Employment Increase/Decrease: 7,900Percent Change: 0.9
• Unemployment Rate: 5.3
• Population (000): 1,523.0
Source: Moody’s Economy.com
C O L L I E R S I N T E R N AT I O N A L l U S R E A L E S TAT E R E V I E W 2 0 0 7
CONTACT: Bill Quinlivan • [email protected] l RESEARCH: Nicole Benish • [email protected] 45
OFFICE
• Healthcare industry continues to expand. Columbia/St. Mary’s,Froedtert Hospital, Aurora Health Care largest growing companies.
• Most notable infrastructure change is the re-development of I-94 andI-43 intersection in downtown. Re-development of I-94 and Hwy 45intersection, “Zoo Interchange,” proposed.
• Manpower’s new headquarters is notable new development in downtown. Other proposed projects, include the Pabst City redevelopment. No significant office developments in the suburbs currently.
• Extensive amount of housing development downtown, but minimalin the suburbs, except for Pabst Farms development.
• Third Ward, Walkers Point and Haymarket Square are most activesubmarkets for redevelopment.
• Sale/lease transactions slow. In all of 2006, Hammes Co. andTranswestern sold their significant office portfolios.
Office Outlook• Migration is tending toward larger, corporate users
moving downtown.• There are minimal rezoning issues, but municipalities becoming more
particular about developments.• Availability of office space remains stable. Several large office
projects proposed for downtown, but virtually none for suburbs.• Land prices remain stable; developers and REITs are positioning
themselves for future.• Housing market is stable, no bursting bubble.
INDUSTRIAL
• High growth companies are QuadGraphics, Harley Davidson, andBeck Carton Company.
• Largest infrastructure initiative is the one billion dollar plus reconstruction of the Marquette Interchange on city’s central freeway system.
• Numerous 200,000 SF plus build-to-suit developments and speculative buildings in the I-94 south corridor.
• Availabilities of industrial properties steady, possibly increasing.• Conversions of multi-story industrial buildings continue, particularly
in and around downtown Milwaukee.• Two significant sale/leasebacks include the sale of the 170,000 SF
International Flavors and Fragrances building and the 250,000Corporate Express building to OPUS.
Industrial Outlook• Healthcare, distribution and printing industries are growing, while
heavy manufacturing industry is slowing in this area.• Migration is stable, but low growth.• Rezoning is becoming more difficult for industrial; some submarkets
have almost no industrial land.• The land market has seen increasing prices due to the lack of
availability, while the volume is increasing.

MINNEAPOLIS, MNC O L L I E R S I N T E R N AT I O N A L l U S R E A L E S TAT E R E V I E W 2 0 0 7
DOWNTOWN OFFICE
Inventory New Absorption Vacancy Class A(SF) Supply (SF) (SF) Rate (%) Rent ($PSF)
1999 21,133,000 0 370,000 7.1 28.402000 22,060,000 927,000 573,000 7.2 28.702001 23,976,000 1,916,000 513,000 12.2 27.602002 24,904,000 928,000 -1,400,000 20.3 23.502003 24,904,000 0 -35,000 20.4 25.102004 24,904,000 0 -326,000 21.2 26.002005 24,904,000 0 737,000 19.6 24.702006 24,560,000 -344,000 239,000 19.4 24.40
SUBURBAN OFFICE
Inventory New Absorption Vacancy Class A(SF) Supply (SF) (SF) Rate (%) Rent ($PSF)
1999 37,854,000 1,154,000 366,000 10.5 26.002000 39,668,000 1,814,000 1,489,000 12.7 27.502001 41,770,000 2,102,000 1,664,000 17.6 27.002002 43,109,000 1,339,000 180,000 20.3 23.502003 43,109,000 0 2,038,000 16.3 27.402004 43,109,000 0 573,000 16.5 26.302005 42,784,000 -325,000 729,000 16.1 23.202006 42,580,000 -204,000 503,000 15.5 24.00
INDUSTRIAL
Inventory New Absorption Vacancy Warehouse Land(SF) Supply (SF) (SF) Rate (%) Rent ($PSF) ($PSF)
1999 82,236,000 3,600,000 2,870,000 8.6 4.60 – 2000 84,436,000 2,200,000 1,846,000 9.4 4.70 – 2001 87,699,000 3,263,000 1,084,000 13.4 4.30 3.002002 90,683,000 2,984,000 1,546,000 17.0 4.40 3.002003 90,734,000 51,000 1,673,000 14.0 4.10 3.002004 90,734,000 0 113,000 14.8 4.25 3.002005 92,381,000 1,647,000 4,523,000 13.2 4.30 5.002006 91,979,000 -402,000 1,553,000 11.0 4.55 7.23
METROPOLITAN INDICATORS – 2007
• Gross Metro Product Percent Change: 2.2
• Total Employment Increase/Decrease: 13,300Percent Change: 0.7
• Unemployment Rate: 3.8
• Population (000): 3,199.5
Source: Moody’s Economy.com
46 CONTACT: Jeffrey LaFavre • [email protected] l RESEARCH: Jim Mayland • [email protected]
OFFICE
• Record volume of office building sales, including both CBD marketsand the suburbs.
• Target Corporation continues to draw vendors to downtown Minneapolis.
• Limited new construction in the multi-tenant arena.• CBD office buildings being converted to hotels and
residential housing. • Early renewals of large tenants as a result of limited availability
of large blocks of contiguous space and low rents; tenants takingadvantage of market conditions.
Office Outlook• Reemergence of new construction, with first significant speculative
office building to be delivered since 2001.• New 685,000 SF development at Excelsior Crossings already secured
a tenant, Cargill, for a majority of development, with possibility ofleasing remaining space to them as well.
• Light rail-driven new construction will also start to boom in 2007.• The inflated value of office sales will drive cost of taxes up by an
estimated average of 9%.• Limited amounts of large contiguous blocks available in market.
There could be an announcement of a new office building for downtown before year-end 2007.
INDUSTRIAL
• Absorption cooled substantially from 2005, primarily due to pent updemand from previous 3 years.
• Limited speculative development.• Owners pushing up asking rates for the first time in five years, due to
high cost of new construction and tight supply in some locations• Land costs remain high as owners who once had hopes of selling land
for residential development still expect inflated values.• Zero to negative industrial job growth the past three years.
Industrial Outlook• Rents will continue to increase as remaining available space declines.• Expect more proposed developments, though actual groundbreaking
will depend on pre-leasing for most developers.• Gap between new construction rent and existing building rent will
continue narrowing.• Quantity of single user for sale buildings will continue to decrease,
driving users to multi-tenant buildings.• Downturn in residential may potentially free up land for
industrial development.
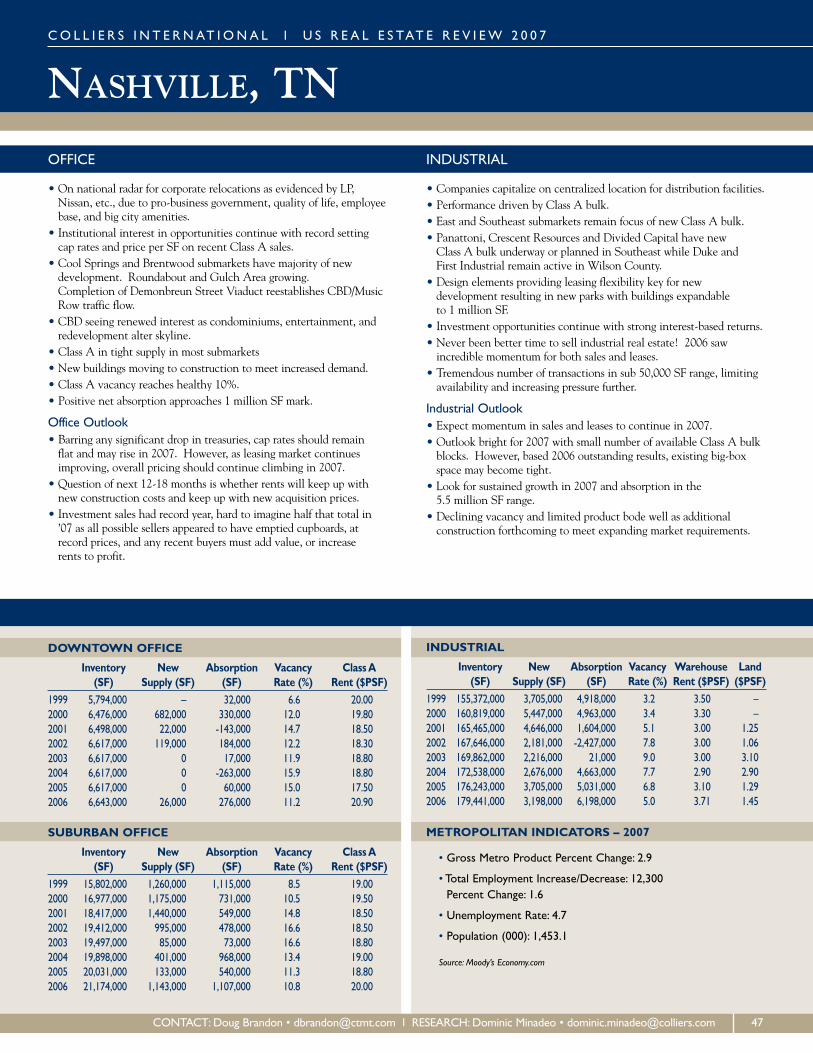
NASHVILLE, TN
DOWNTOWN OFFICE
Inventory New Absorption Vacancy Class A(SF) Supply (SF) (SF) Rate (%) Rent ($PSF)
1999 5,794,000 – 32,000 6.6 20.002000 6,476,000 682,000 330,000 12.0 19.802001 6,498,000 22,000 -143,000 14.7 18.502002 6,617,000 119,000 184,000 12.2 18.302003 6,617,000 0 17,000 11.9 18.802004 6,617,000 0 -263,000 15.9 18.802005 6,617,000 0 60,000 15.0 17.502006 6,643,000 26,000 276,000 11.2 20.90
SUBURBAN OFFICE
Inventory New Absorption Vacancy Class A(SF) Supply (SF) (SF) Rate (%) Rent ($PSF)
1999 15,802,000 1,260,000 1,115,000 8.5 19.002000 16,977,000 1,175,000 731,000 10.5 19.502001 18,417,000 1,440,000 549,000 14.8 18.502002 19,412,000 995,000 478,000 16.6 18.502003 19,497,000 85,000 73,000 16.6 18.802004 19,898,000 401,000 968,000 13.4 19.002005 20,031,000 133,000 540,000 11.3 18.802006 21,174,000 1,143,000 1,107,000 10.8 20.00
INDUSTRIAL
Inventory New Absorption Vacancy Warehouse Land(SF) Supply (SF) (SF) Rate (%) Rent ($PSF) ($PSF)
1999 155,372,000 3,705,000 4,918,000 3.2 3.50 – 2000 160,819,000 5,447,000 4,963,000 3.4 3.30 – 2001 165,465,000 4,646,000 1,604,000 5.1 3.00 1.252002 167,646,000 2,181,000 -2,427,000 7.8 3.00 1.062003 169,862,000 2,216,000 21,000 9.0 3.00 3.102004 172,538,000 2,676,000 4,663,000 7.7 2.90 2.902005 176,243,000 3,705,000 5,031,000 6.8 3.10 1.292006 179,441,000 3,198,000 6,198,000 5.0 3.71 1.45
METROPOLITAN INDICATORS – 2007
• Gross Metro Product Percent Change: 2.9
• Total Employment Increase/Decrease: 12,300Percent Change: 1.6
• Unemployment Rate: 4.7
• Population (000): 1,453.1
Source: Moody’s Economy.com
C O L L I E R S I N T E R N AT I O N A L l U S R E A L E S TAT E R E V I E W 2 0 0 7
CONTACT: Doug Brandon • [email protected] l RESEARCH: Dominic Minadeo • [email protected] 47
OFFICE
• On national radar for corporate relocations as evidenced by LP,Nissan, etc., due to pro-business government, quality of life, employeebase, and big city amenities.
• Institutional interest in opportunities continue with record settingcap rates and price per SF on recent Class A sales.
• Cool Springs and Brentwood submarkets have majority of new development. Roundabout and Gulch Area growing. Completion of Demonbreun Street Viaduct reestablishes CBD/MusicRow traffic flow.
• CBD seeing renewed interest as condominiums, entertainment, andredevelopment alter skyline.
• Class A in tight supply in most submarkets• New buildings moving to construction to meet increased demand.• Class A vacancy reaches healthy 10%.• Positive net absorption approaches 1 million SF mark.
Office Outlook• Barring any significant drop in treasuries, cap rates should remain
flat and may rise in 2007. However, as leasing market continuesimproving, overall pricing should continue climbing in 2007.
• Question of next 12-18 months is whether rents will keep up withnew construction costs and keep up with new acquisition prices.
• Investment sales had record year, hard to imagine half that total in’07 as all possible sellers appeared to have emptied cupboards, atrecord prices, and any recent buyers must add value, or increase rents to profit.
INDUSTRIAL
• Companies capitalize on centralized location for distribution facilities.• Performance driven by Class A bulk.• East and Southeast submarkets remain focus of new Class A bulk.• Panattoni, Crescent Resources and Divided Capital have new
Class A bulk underway or planned in Southeast while Duke and First Industrial remain active in Wilson County.
• Design elements providing leasing flexibility key for new development resulting in new parks with buildings expandable to 1 million SF.
• Investment opportunities continue with strong interest-based returns.• Never been better time to sell industrial real estate! 2006 saw
incredible momentum for both sales and leases.• Tremendous number of transactions in sub 50,000 SF range, limiting
availability and increasing pressure further.
Industrial Outlook• Expect momentum in sales and leases to continue in 2007.• Outlook bright for 2007 with small number of available Class A bulk
blocks. However, based 2006 outstanding results, existing big-boxspace may become tight.
• Look for sustained growth in 2007 and absorption in the 5.5 million SF range.
• Declining vacancy and limited product bode well as additional construction forthcoming to meet expanding market requirements.

NEW JERSEY – CENTRAL
C O L L I E R S I N T E R N AT I O N A L l U S R E A L E S TAT E R E V I E W 2 0 0 7
SUBURBAN OFFICE
Inventory New Absorption Vacancy Class A(SF) Supply (SF) (SF) Rate (%) Rent ($PSF)
1999 91,990,000 3,651,000 3,010,000 9.4 29.002000 93,767,000 1,777,000 2,524,000 6.0 26.902001 95,934,000 2,167,000 1,330,000 11.8 24.302002 98,433,000 2,499,000 -1,387,000 15.3 23.502003 99,007,000 574,000 719,000 15.5 24.002004 99,537,000 530,000 1,717,000 14.2 25.502005 100,815,000 1,278,000 2,821,000 12.5 25.302006 101,646,000 831,000 218,000 13.0 25.50
INDUSTRIAL
Inventory New Absorption Vacancy Warehouse Land(SF) Supply (SF) (SF) Rate (%) Rent ($PSF) ($PSF)
1999 253,307,000 3,675,000 3,927,000 7.2 5.20 – 2000 256,557,000 3,250,000 3,725,000 5.7 5.50 – 2001 263,712,000 7,155,000 1,479,000 7.0 5.00 4.002002 268,989,000 5,277,000 -2,031,000 8.3 5.00 3.752003 269,848,000 859,000 7,137,000 5.9 4.50 5.002004 272,207,000 2,359,000 7,066,000 4.3 4.20 4.502005 278,844,000 6,637,000 709,000 6.6 4.70 18.002006 284,290,000 5,446,000 2,575,000 7.5 5.05 18.50
METROPOLITAN INDICATORS – 2007 (EDISON)
• Gross Metro Product Percent Change: 2.6
• Total Employment Increase/Decrease: 9,400Percent Change: 0.9
• Unemployment Rate: 4.8
• Population (000): 2,352.5
Source: Moody’s Economy.com
48 CONTACT: Jon Tesser • [email protected] l RESEARCH: Carrie Ciaburri • [email protected]
OFFICE
• Strictly suburban market with little new construction due to oversupply and slow job growth.
• Subleases represent less than 2% of availability and no longer a major factor.
• Vacancy rates remained virtually flat at 13% but did increase slightlylast quarter 2006 due to new construction delivered.
• Rental rates remained flat throughout year for both Class A and Bcombined, ranging from $24.22 to $24.28.
• Class A rental rates averaged $25.50 per SF. Class B rental rates inupper $21.00 range.
• Significant sale transaction: Met Life bought old AT&T headquartersfor $270 million.
• Aventis leased 669,700 SF in Bridgewater for 10 years.• Speculative 201,094 SF building in Princeton and speculative
167,000 SF building in Hamilton delivered. Both nearly 100% vacant.
INDUSTRIAL
• 5,024,600 SF of new construction delivered.• 4,689,400 SF presently under construction.• Construction costs have outpaced rental rate growth.• Vacancy rates increased by approximately 1% over last year due to
rate of new construction becoming greater than demand. Year endedwith vacancy rate of 8.4% up from 7.2%.
• Rents decreased slightly due to surplus of vacant space.• First Industrial Realty Trust bought 886,748 SF building in
Cranbury, NJ for $95,700,000.• Cal Cartage leased 267,765 SF at 50 Middlesex Avenue for 5-years.
Industrial Outlook• Speculative construction starts expected to decrease until some of
surplus new construction is leased. Anticipate more construction ona build-to suit basis in future.
• The 4,689,400 SF presently under construction expected delivered in 2007.

NEW JERSEY – NORTHERN
SUBURBAN OFFICE
Inventory New Absorption Vacancy Class A(SF) Supply (SF) (SF) Rate (%) Rent ($PSF)
1999 142,458,000 3,750,000 4,100,000 13.1 29.002000 145,458,000 3,000,000 4,600,000 8.8 29.002001 148,571,000 3,113,000 510,000 11.1 30.002002 152,752,000 4,181,000 1,449,000 12.6 25.002003 155,099,000 2,347,000 -318,000 13.6 28.702004 156,766,000 1,667,000 3,607,000 12.2 27.102005 157,078,000 312,000 -609,000 12.0 27.402006 157,271,000 193,000 550,000 11.8 28.20
INDUSTRIAL
Inventory New Absorption Vacancy Warehouse Land(SF) Supply (SF) (SF) Rate (%) Rent ($PSF) ($PSF)
1999 417,089,000 946,000 4,902,000 5.3 5.50 – 2000 418,449,000 1,360,000 6,630,000 3.6 5.90 – 2001 420,323,000 1,874,000 -2,493,000 5.5 6.30 5.752002 420,874,000 551,000 1,602,000 5.3 6.20 9.002003 421,699,000 825,000 2,811,000 4.9 5.90 7.002004 422,859,000 1,160,000 914,000 4.8 6.10 11.002005 422,975,000 116,000 -3,773,000 5.7 6.20 22.002006 423,877,000 902,000 278,000 5.9 6.63 23.00
METROPOLITAN INDICATORS – 2007 (NEWARK)
• Gross Metro Product Percent Change: 1.8
• Total Employment Increase/Decrease: -200Percent Change: -0.0
• Unemployment Rate: 5.4
• Population (000): 2,167.7
Source: Moody’s Economy.com
C O L L I E R S I N T E R N AT I O N A L l U S R E A L E S TAT E R E V I E W 2 0 0 7
CONTACT: Jon Tesser • [email protected] l RESEARCH: Carrie Ciaburri • [email protected] 49
OFFICE
• Suburban market with no new construction due to oversupply andslow job growth.
• Subleases are less than 2% of available space and no longer a major factor.
• Rental rates remained flat at $26 range, for both Class A and B. • Vacancy rates have remained flat at around 13-13.2% for past year.• Lehman Brothers sold 80 Park Plaza in Newark, NJ for $147,500,000
or $144.00 per SF to Wells Real Estate Investment Trust II, Inc. • Deutsche Bank leased 281,920 SF at Harborside Financial Center in
Jersey City for 10 years.• One speculative 175,000 SF office building in Parsippany,
NJ delivered.
INDUSTRIAL
• Vacancy rates remained flat over 2005 and 2006 but still low at 6-6.2%.
• Rents increased slightly over the year.• 851,726 SF of new construction delivered.• 1,055,064 SF under construction. All expected delivered in 2007.• Very little vacant land left in northern NJ with the exception of
western area, so not much construction anticipated for 2007.• One of the lowest vacancy rates for all industrial markets in
the country.• Prime location just outside New York City with direct access to
Port Newark/Elizabeth.• RREEF bought 617,000 SF in Teterboro for $70.7 million from
AMB Corp. • Moishe’s Moving and Storage leased 228,000 SF in Jersey City
for 11-years.

NEW YORK, NYC O L L I E R S I N T E R N AT I O N A L l U S R E A L E S TAT E R E V I E W 2 0 0 7
MIDTOWN MANHATTAN OFFICE
Inventory New Absorption Vacancy Class A(SF) Supply (SF) (SF) Rate (%) Rent ($PSF)
1999 239,008,000 1,600,000 3,900,000 6.4 54.002000 239,008,000 0 1,445,000 5.4 65.402001 239,863,000 855,000 -12,916,000 10.4 61.302002 242,369,000 2,506,000 -573,000 11.4 54.702003 244,267,000 1,898,000 888,000 11.8 52.402004 247,250,000 2,983,000 5,846,000 10.5 57.502005 250,385,000 3,135,000 7,065,000 8.0 59.602006 251,516,000 1,131,000 4,607,000 6.5 79.60
MIDTOWN SOUTH MANHATTAN OFFICE
Inventory New Absorption Vacancy Class A(SF) Supply (SF) (SF) Rate (%) Rent ($PSF)
1999 – – – – –2000 98,218,000 0 787,000 5.5 38.002001 98,218,000 0 -7,256,000 12.9 43.802002 98,218,000 0 -998,000 14.0 34.002003 98,218,000 0 1,460,000 12.5 27.602004 98,218,000 0 1,054,000 11.4 33.702005 98,218,000 0 3,114,000 8.3 36.002006 98,218,000 0 689,000 7.6 44.50
50 CONTACT: Nicola Heryet • [email protected] l RESEARCH: Robert Sammons • [email protected]
OFFICE
New York, Midtown Manhattan• Class A average asking rent skyrocketed 30% from $59.64 per SF to
almost $78.00 per SF, an all-time high.• Pricing in several premium buildings along Fifth, Madison, and
Park avenues climbed to over $150 per SF.• Vacancy rate for Class A space dropped from 6.9% to 5.9% with large
blocks of space becoming scarce.• The only new construction ongoing in Midtown is in the
Times Square submarket. Two buildings underway, another undergoing a complete renovation and one is about to break ground.
• Sales prices have soared with several major office buildings closing forover $1,000 per SF.
NewYork, Midtown Manhattan Outlook• Extremely tight with vacancy rate falling below 5% due to job growth
continuing in 2007 among financial and business service firms.• Average asking rent will continue upward possibly topping $90 per SF
by year-end 2007.• Tenants with expiring leases may split operations and move back
office to other areas including suburbs due to escalating rents.• One building, 1.5 million SF tower, due for 2007 completion, at
620 Eighth Avenue, The New York Times Building. Expected to befully leased for third quarter opening.
• Expect an announcement for one or more new office towers in Penn Station and/or Times Square submarkets.
New York, Midtown South Manhattan• Overall vacancy rate dropped from 8.3% to 7.9%.
Several submarkets, Chelsea and Flatiron, improved over others such as Hudson Square and TriBeCa.
• The overall average asking rent rose, finishing up 17.7% from $32.18 per SF to just under $38.00 per SF.
• Small Hudson Square submarket continues to have highest vacancyrate in Manhattan at 22.8%. Mostly highly renovated former manufacturing buildings with activity beginning to pick up.
• Numerous investment sales. Many smaller and destined for conversion to residential or “teardowns.”
• Largest amount of Class A available at Empire State Building. The 2.8 million SF tower has 569,000 SF vacant with 135,000 SF in one block.
New York, Midtown South Manhattan Outlook • Expect vacancy rate to continue slide in 2007 as tenants in Midtown
look to less expensive Class A and B space here, where a few “bigblocks” still exist.
• Asking rents will likely climb sharply, especially in the convenientChelsea and Flatiron submarkets, due to continued robust leasing activity.
• Additional commercial and residential development announcementslikely in West Chelsea along “High Line.” Area has recently undergone upzoning.
• Retail growth will prove strong due to rise in population. • The number and price of building sales will rise as all investors delve
deeper into Manhattan for opportunities.

NEW YORK, NY
DOWNTOWN MANHATTAN OFFICE
Inventory New Absorption Vacancy Class A(SF) Supply (SF) (SF) Rate (%) Rent ($PSF)
1999 101,469,000 0 2,255,000 8.2 37.002000 101,469,000 0 4,021,000 4.5 46.202001 88,069,000 -13,400,000 -19,195,000 11.4 42.502002 88,069,000 0 -2,742,000 14.4 36.402003 88,069,000 0 446,000 14.2 33.902004 88,069,000 0 536,000 13.6 33.602005 88,069,000 0 2,494,000 11.3 33.802006 89,744,000 1,675,000 3,217,000 8.9 48.40
C O L L I E R S I N T E R N AT I O N A L l U S R E A L E S TAT E R E V I E W 2 0 0 7
CONTACT: Nicola Heryet • [email protected] l RESEARCH: Robert Sammons • [email protected] 51
OFFICE
New York, Downtown Manhattan• Downtown Class A vacancy rate fell from 9.2% to 8.2%, a
significant drop, considering completion of 1.7 million square feet at 7 World Trade Center.
• Class A asking rent shot to almost $50 per SF from $33.76 per SF, primarily due to opening of 7 World Trade Center, with asking rent of $65 per SF. Several buildings raised rents by $2 - $4 per SF in Q4.
• Sublease space was cut almost in half, dropping from 1.8 million SF to 1.0 million SF.
• Construction finally began on 2.6 million SF “Freedom Tower” onWorld Trade Center site. Completion due in first quarter of 2011.
• Several retailers announced openings including Tiffany’s, whichleased 10,000 SF at 37-43 Wall Street, second store in New YorkCity; flagship store remains on Fifth Avenue.
NewYork, Downtown Manhattan Outlook• Lower Manhattan will remain a less expensive alternative to
Midtown by 30% to 35%, pushing additional tenants to relocate here if they can find space.
• Expect 7 World Trade Center to be fully leased by year-end 2007 currently 750,000 SF available.
• Tenant base will become more diversified though still led by financialservices and government.
• Expect pause in residential conversions since housing market willremain somewhat cool, though commercial market HOT.
• New South Ferry subway station opens in 2007, linking three lines to the Staten Island Ferry Terminal. Work also continues on FultonTransit Center and World Trade Transit Hub, completion dates in 2009.

NEW YORK, NYC O L L I E R S I N T E R N AT I O N A L l U S R E A L E S TAT E R E V I E W 2 0 0 7
WESTCHESTER COUNTY, NY SUBURBAN OFFICE
Inventory New Absorption Vacancy Class A(SF) Supply (SF) (SF) Rate (%) Rent ($PSF)
1999 – – – – –2000 – – – – –2001 39,873,000 0 -2,074,000 16.5 26.302002 39,873,000 0 704,000 14.8 26.102003 39,873,000 0 407,000 13.7 27.002004 39,873,000 0 -991,000 16.2 27.602005 39,873,000 788,000 1,231,000 15.1 27.202006 43,423,000 0 -711,000 15.5 27.60
FAIRFIELD COUNTY, CT SUBURBAN OFFICE
Inventory New Absorption Vacancy Class A(SF) Supply (SF) (SF) Rate (%) Rent ($PSF)
1999 – – – – –2000 – – – – –2001 60,048,000 0 -3,797,000 14.1 30.802002 60,048,000 0 -1,810,000 17.3 30.802003 60,048,000 0 29,000 17.3 28.802004 60,048,000 0 -73,000 17.4 28.602005 61,317,000 1,269,000 1,640,000 15.6 28.002006 61,510,000 193,000 932,000 14.1 30.40
METROPOLITAN INDICATORS – 2007
• Gross Metro Product Percent Change: 2.4
• Total Employment Increase/Decrease: 55,000Percent Change: 1.1
• Unemployment Rate: 4.9
• Population (000): 11,520.9
Source: Moody’s Economy.com
52 CONTACT: Nicola Heryet • [email protected] l RESEARCH: Robert Sammons • [email protected]
OFFICE
New York,Westchester County• Class A vacancy rate up over past year, from 15.5% to 18.4%
as two large blocks added, 471,000 SF and 400,000 SF in White Plains submarket.
• Vacancy rate shot to just over 25% in White Plains, largest submarket.
• Only minor rent increases, within dollar of five years ago, in bothWestchester and White Plains submarket.
• Currently 16 Class A buildings (of 138) in Westchester have at least50,000 SF availability.
• Most leasing deals completed by tenants already located in countyand either renewing, expanding, or relocating.
NewYork,Westchester County Outlook• Leasing activity should pick up over next twelve months as tenants
from Manhattan look for cheaper alternatives, even for back-officespace only.
• Employment growth in financial and business services expected torise in 2007.
• Rents should push higher after long period of little movement.• Sales prices should creep upwards in 2007 as expected spillover from
Manhattan prompts investors to look outside city.• One office property under construction and due for 2007 completion,
a 17,000 SF medical building in county’s northwest.
New York, Fairfield County• Class A vacancy rate has eased, falling to lowest figure since
June 2002.• After long struggle, Class A average asking rent for county topped
$30 per SF late in year, first time since September 2003.• In largest submarket Stamford, vacancy rate remains just over
20%, down from 22.5% at beginning of year and off record high of 23.8% in Q1 of 2005.
• Some significant blocks remaining in Stamford including 163,000 SF at 1600 Summer Street and 100,000 SF building at 750 East Main Street.
• Greenwich, very popular with hedge funds, has downtown vacancyrate of near zero. Some large blocks outside core area exist, includingdefunct fund Amaranth’s 123,000 SF sublease.
New York, Fairfield County Outlook• Unemployment rate sitting just above 3% should remain extremely
low with additional hiring in financial and business services fields.• Vacancy rate will soon edge below 20% as firms, particularly financial
services, begin splitting operations and taking suburban space forback-office.
• Rents should climb across the county especially in areas north andeast of Stamford where some tenants report “higher quality of life.”
• Two new projects underway with one due for completion in 2007– a 370,000 SF building at 279 Atlantic Street.
• Investment sales prices will continue to improve due to competitionin New York City and expectation of increased leasing velocity.

OAKLAND, CA
DOWNTOWN OFFICE
Inventory New Absorption Vacancy Class A(SF) Supply (SF) (SF) Rate (%) Rent ($PSF)
1999 12,641,000 0 515,000 7.6 30.002000 12,641,000 0 334,000 4.8 51.202001 12,641,000 0 -278,000 8.9 37.202002 13,169,000 528,000 -238,000 15.5 26.702003 13,169,000 0 -130,000 15.7 26.202004 13,169,000 0 124,000 14.6 24.402005 13,169,000 0 212,000 12.7 25.702006 13,169,000 0 101,000 11.9 28.20
SUBURBAN OFFICE
Inventory New Absorption Vacancy Class A(SF) Supply (SF) (SF) Rate (%) Rent ($PSF)
1999 8,934,000 1,741,000 1,957,000 5.3 30.002000 9,818,000 884,000 3,204,000 1.7 44.002001 12,731,000 2,913,000 -396,000 12.9 35.302002 14,073,000 1,342,000 -1,129,000 17.8 28.202003 15,077,000 1,004,000 1,431,000 16.3 23.502004 15,077,000 0 -277,000 19.8 24.102005 15,113,000 36,000 836,000 14.4 25.402006 15,113,000 0 -9,000 17.3 28.10
INDUSTRIAL
Inventory New Absorption Vacancy Warehouse Land(SF) Supply (SF) (SF) Rate (%) Rent ($PSF) ($PSF)
1999 127,054,000 1,619,000 3,135,000 5.3 6.20 – 2000 127,964,000 910,000 3,455,000 3.8 10.40 – 2001 129,529,000 1,565,000 -4,148,000 8.0 5.70 14.002002 130,417,000 888,000 -1,544,000 9.3 4.60 8.292003 130,586,000 169,000 276,000 9.1 4.50 11.002004 130,921,000 335,000 1,494,000 8.0 4.20 12.002005 131,078,000 157,000 1,895,000 6.7 4.30 13.622006 131,170,000 92,000 1,712,000 5.4 5.16 17.00
METROPOLITAN INDICATORS – 2007
• Gross Metro Product Percent Change: 2.7
• Total Employment Increase/Decrease: 12,600Percent Change: 1.2
• Unemployment Rate: 4.6
• Population (000): 2,506.8
Source: Moody’s Economy.com
C O L L I E R S I N T E R N AT I O N A L l U S R E A L E S TAT E R E V I E W 2 0 0 7
CONTACT: Mike Burke • [email protected] l RESEARCH: Glenda Cheng • [email protected] 53
OFFICE
• Downtown Class A rents skyrocketing due to tightening supply.Flight to quality slowing. Class A rents at $2.38 per SF, over lastyear’s $2.13 per SF.
• Vacancy for B/C and suburban rose slightly to 17.3%. Demand steadycausing pressure on rents.
• Leasing healthy. Total up14.7% at nearly 2.4 million SF. • Investment sales for Class A steady. Beacon Capital Partners
acquiring Lake Merritt Plaza, premier building downtown. • Class B/C investment sales perked up downtown. • Top employers remain state and local government, and
medical/healthcare.
Office Outlook• Strong conditions positive for Brandywine Realty Trust. New project
delivery in 2007, adding 215,000 SF. First recent major construction.• San Francisco rents escalating forcing companies to migrate.
Jamba Juice leased nearly 36,000 SF to facilitate HQ move. Expect followers, as area becomes cost-effective alternative.
• Expect strong leasing activity to continue.• Rezoning issues surfacing due to infill. Concerns over conversion of
industrial buildings to condominiums and conversion of historicalindustrial to office/residential could slow redevelopment.
INDUSTRIAL
• Strong economy fueled demand dropping vacancy to 5.4%, five yearlow. Rental rates increased to $.54 NNN per SF.
• Warehouse/distribution changes. Submarket vacancy dropped to historical low 3.5%. Significant leases Keeco’s 283,630 SF, and Eagle Globe Logistics’ 180,160 SF.
• Warehouse/distribution strong due to international trade hubs, Port of Oakland, and Oakland International Airport.
• Rents rising, space constrained. Warehouse rentals at $.43 NNN per SF.
• R&D/Flex ended with 249,675 SF absorption, first positive close inseveral years. Light industrial sector flat at healthy 5.6%.
• Owner-user sales strong. Peets Coffee purchased 135,000 SF for roasting operations.
• Investment sales included WP Investments’ acquisition of BritanniaBusiness Center, 91,530 SF.
Industrial Outlook• Warehouse/distribution rents continuing up due to space and new
construction limits.• Deal rates for new leases and renewals on rise as tight conditions
drive market. • Rezoning issues will continue.• Light industrial strong. Multi-tenant industrial into industrial
condominiums becoming popular for smaller users who prefer owning. Demand high for incubator units.
• Vacancy rate in R& D/Flex at 15.4%, should drop as activity improves.

ORLANDO, FLC O L L I E R S I N T E R N AT I O N A L l U S R E A L E S TAT E R E V I E W 2 0 0 7
DOWNTOWN OFFICE
Inventory New Absorption Vacancy Class A(SF) Supply (SF) (SF) Rate (%) Rent ($PSF)
1999 9,102,000 337,000 216,000 6.1 25.202000 9,859,000 757,000 414,000 9.0 25.402001 9,945,000 86,000 -104,000 12.0 25.302002 9,945,000 0 -149,000 11.8 23.602003 10,165,000 220,000 135,000 12.5 22.802004 10,165,000 0 13,000 11.1 21.002005 10,430,000 265,000 81,000 11.9 24.002006 11,007,000 577,000 927,000 8.0 26.50
SUBURBAN OFFICE
Inventory New Absorption Vacancy Class A(SF) Supply (SF) (SF) Rate (%) Rent ($PSF)
1999 35,628,000 490,000 438,000 6.8 18.002000 37,565,000 1,937,000 2,212,000 7.9 19.802001 40,178,000 2,613,000 672,000 11.6 20.602002 41,011,000 833,000 187,000 12.4 20.302003 41,729,000 718,000 -97,000 14.1 20.202004 42,131,000 402,000 291,000 11.9 19.702005 42,454,000 323,000 1,204,000 8.9 19.002006 43,590,000 1,136,000 1,703,000 7.6 22.60
INDUSTRIAL
Inventory New Absorption Vacancy Warehouse Land(SF) Supply (SF) (SF) Rate (%) Rent ($PSF) ($PSF)
1999 108,221,000 813,000 -339,000 7.2 – – 2000 110,067,000 1,846,000 1,658,000 7.3 5.90 – 2001 113,647,000 3,580,000 2,859,000 9.4 4.20 3.002002 115,253,000 1,606,000 924,000 10.1 4.30 3.502003 116,680,000 1,427,000 -154,000 11.6 4.10 2.602004 119,916,000 3,236,000 6,191,000 8.6 4.50 3.632005 121,766,000 1,850,000 2,909,000 8.1 4.75 4.002006 124,522,000 2,756,000 4,344,000 6.7 5.25 6.50
METROPOLITAN INDICATORS – 2007
• Gross Metro Product Percent Change: 3.4
• Total Employment Increase/Decrease: 24,000Percent Change: 2.2
• Unemployment Rate: 3.1
• Population (000): 2,036.9
Source: Moody’s Economy.com
54 CONTACT: Matt Sullivan • [email protected] l RESEARCH: Danny Rice • [email protected]
OFFICE
• Inventory at 52,513,508 SF with 92% occupancy. • Vacancy consistent, ranging from 7.7% to 8.5%. Leveling off
at 7.9% in Q4.• Deliveries strong in Q4 at 718,166 SF with 2 million SF
still in pipeline.• Class A in central Florida at 18.7 million SF with nearly
92% occupied. • America’s Capital Partners purchased downtown Bank of America
building for $96,250,000. • Leasing rates on steady rise over last six quarters, currently at $20.94. • Second best year for existing single-family homes sales.
Inventory dropped at year-end, but still buyer’s market with 13.23 months worth of inventory.
Office Outlook• New CBD high-rise arriving early 2007 consists of 394,000 SF
Class A condo suites, residential condos, 105,000 SF retail and 12-screen movie theater.
• Darden Restaurants purchased parcel in southern Orange County for$100 million national headquarters. Construction set for January2007, delivery 2009.
• Three major arts, sports and entertainment projects underway fordowntown. Projects include new performing arts center, sports, andentertainment arena and major renovation to Florida Citrus Bowl.
INDUSTRIAL
• Inventory of 122,381,087 SF at year-end, up from 120 million SF 2005.
• Vacancy continues falling with most recent data at 6.8%, down from 7 %.
• Just over 500,000 SF delivered Q4 with yearly total finishing at 2,581,038 SF.
• Construction picked up recently with 31 buildings underway, 1.6 million SF.
• Long Ridge Industrial Portfolio LP acquired 420,000 SF warehouse for $22 million.
• Flex space strong with vacancy continuing to fall. Rental rates risingover last seven quarters and respectable absorption at 188,277 SF.
• Q3 had highest absorption at 1,031,801 SF, two and three times other quarters.
• Population rose by over 50,000 people. • Rental rates continuing up, current averages at $6.40 NNN.
Industrial Outlook• Recent construction boom will impact 2007. Expect year full of new
deliveries offering many opportunities for market.• Land availability diminishing for Central Florida, especially along
railroad. New commuter rail using existing railway recently approved.Traffic currently using railway system will be rerouted west of city.New opportunities in coming years as traffic and demand rises forindustrial parks along the western railway.

PHILADELPHIA, PA
DOWNTOWN OFFICE
Inventory New Absorption Vacancy Class A(SF) Supply (SF) (SF) Rate (%) Rent ($PSF)
1999 27,984,000 215,000 1,517,000 10.7 25.002000 27,984,000 0 727,000 8.8 28.402001 27,984,000 0 -1,349,000 12.3 23.502002 27,984,000 0 -816,000 14.4 23.002003 27,984,000 0 561,000 13.0 23.302004 27,984,000 0 244,000 12.4 23.302005 28,937,000 953,000 68,000 13.9 23.202006 28,937,000 0 556,000 12.4 23.70
SUBURBAN OFFICE
Inventory New Absorption Vacancy Class A(SF) Supply (SF) (SF) Rate (%) Rent ($PSF)
1999 90,902,000 1,885,000 699,000 7.9 25.002000 92,660,000 1,758,000 -1,741,000 9.4 23.502001 95,441,000 2,781,000 -1,465,000 13.2 24.002002 97,714,000 2,273,000 -1,003,000 13.7 23.002003 99,488,000 1,774,000 -880,000 17.4 24.302004 100,675,000 1,187,000 1,900,000 16.1 23.302005 101,443,000 768,000 1,197,000 15.5 22.902006 103,086,000 1,643,000 2,834,000 13.9 22.95
INDUSTRIAL
Inventory New Absorption Vacancy Warehouse Land(SF) Supply (SF) (SF) Rate (%) Rent ($PSF) ($PSF)
1999 393,268,000 350,000 1,227,000 13.1 2.50 – 2000 395,853,000 2,585,000 3,446,000 8.5 3.90 – 2001 402,239,000 6,386,000 -2,422,000 12.7 4.00 2.532002 403,643,000 1,404,000 -6,367,000 13.8 4.00 2.502003 404,829,000 1,186,000 4,281,000 12.3 4.00 2.902004 409,128,000 4,299,000 5,782,000 12.2 4.00 3.042005 413,972,000 4,844,000 11,390,000 10.5 4.25 4.002006 418,115,000 4,143,000 10,810,000 8.6 4.75 4.00
METROPOLITAN INDICATORS – 2007
• Gross Metro Product Percent Change: 2.1
• Total Employment Increase/Decrease: 12,900Percent Change: 0.7
• Unemployment Rate: 4.8
• Population (000): 3,907.1
Source: Moody’s Economy.com
C O L L I E R S I N T E R N AT I O N A L l U S R E A L E S TAT E R E V I E W 2 0 0 7
CONTACT: Greg West • [email protected] l RESEARCH: Rose Penny • [email protected] 55
OFFICE
• Overall decline in vacancy rates.• Largest lease transactions were renewals with moderate expansion or
companies moving within market. Exception was Olympus USA,which opened new U.S. headquarters in Allentown, PA.
• Investment market extremely active in CBD, but constrained in suburban markets due to diminished offerings. Sale prices and caprates leveled off.
• Rental rates remained flat, but concessions diminished. New construction has higher face rates due to construction costs.
Office Outlook• Possible surplus of speculative construction in a few submarkets, but
overbuilding not a factor overall. • No appreciable rental growth.• Main growth sectors remain health services and pharmaceuticals with
possible contractions in financial services.• Absorption may increase during first six months of 2007 in CBD, but
decrease during second half with delivery of 1.2 million SF ComcastTower. Comcast taking 881,000 SF, (400,000 SF in another building)and remaining 250,000 SF available.
• Suburban absorption possibly slightly lower than 2006.• Fewer properties expected to trade in 2007 due to high volume of
investment transactions over last two years.
INDUSTRIAL
• Regional vacancy dropped 3.6 basis points, with most submarkets wellbelow 10%.
• Absorption extremely strong, boosted by completion of several majorbuild-to-suit facilities
• Active companies varied by submarket: pharmaceutical, medicalproduct/device companies and specialty manufacturing in suburbs;building products, retailers and food companies in Southern New Jerseyand food/supermarket supply and consumer products in Lehigh Valley.
• Sale prices continued to increase, but not at same rate as in two previous years.
• Only Lehigh Valley submarket has significant speculative construction. Southern New Jersey more active for build-to-suit,while balance of suburban counties and Northern Delaware have limited developable land available.
Industrial Outlook• Asking rents may begin increasing during 2007 due to finite supply
of quality space, especially in smaller size ranges.• Lehigh Valley will continue having highest level of speculative
construction and may see temporary over-supply.• Expect constrained investment activity due to limited offerings.• Conversions of industrial sites to residential development
decreasing in 2007.• Downturn in housing could potentially impact larger warehouse
users in building products, home improvement, and home furnishing industries.
• Potential closing of Chrysler plant in Newark, Delaware poses possible negative impact on Northern Delaware Market.

PHOENIX, AZC O L L I E R S I N T E R N AT I O N A L l U S R E A L E S TAT E R E V I E W 2 0 0 7
DOWNTOWN OFFICE
Inventory New Absorption Vacancy Class A(SF) Supply (SF) (SF) Rate (%) Rent ($PSF)
1999 19,097,000 399,000 -128,000 9.2 29.402000 19,111,000 14,000 -185,000 10.5 22.002001 20,237,000 1,126,000 -115,000 17.0 21.802002 20,237,000 0 -449,000 18.6 18.402003 20,362,000 125,000 -109,000 19.0 17.502004 20,530,000 168,000 111,000 18.3 19.402005 20,530,000 0 976,000 15.1 21.202006 20,530,000 0 1,165,000 10.6 21.40
SUBURBAN OFFICE
Inventory New Absorption Vacancy Class A(SF) Supply (SF) (SF) Rate (%) Rent ($PSF)
1999 65,406,000 5,630,000 2,392,000 11.3 27.902000 68,960,000 3,554,000 3,920,000 10.1 24.002001 74,361,000 5,401,000 1,785,000 16.9 24.002002 77,433,000 3,072,000 1,457,000 17.9 20.902003 79,118,000 1,685,000 2,618,000 16.1 20.102004 82,569,000 3,451,000 2,694,000 15.8 23.002005 85,351,000 2,782,000 5,676,000 13.5 22.702006 87,275,000 1,924,000 5,020,000 12.9 23.40
INDUSTRIAL
Inventory New Absorption Vacancy Warehouse Land(SF) Supply (SF) (SF) Rate (%) Rent ($PSF) ($PSF)
1999 200,362,000 9,447,000 6,918,000 8.2 5.70 – 2000 206,071,000 5,709,000 5,069,000 8.3 4.00 – 2001 212,248,000 6,177,000 2,491,000 10.1 4.80 2.842002 217,498,000 5,250,000 1,338,000 12.1 5.40 5.472003 220,398,000 2,900,000 215,000 13.2 5.90 4.502004 224,101,000 3,703,000 4,546,000 11.4 5.80 1.802005 228,470,000 4,369,000 8,766,000 9.5 6.30 4.582006 236,932,000 8,462,000 9,351,000 9.0 6.54 5.68
METROPOLITAN INDICATORS – 2007
• Gross Metro Product Percent Change: 4.1
• Total Employment Increase/Decrease: 55,700Percent Change: 3.0
• Unemployment Rate: 3.3
• Population (000): 4,067.6
Source: Moody’s Economy.com
56 CONTACT: Mike Fitz-Gerald • [email protected] l RESEARCH: Stewart Park • [email protected]
OFFICE
• Job growth skyrocketing with 75,000 new jobs at year-end, withanother 60,000 expected in 2007. Population grew to 128,600 new residents.
• Absorption at 6.18 million SF at Q4. Year-to-date activity Class Aposted 2.03 million SF while Class B recorded 3.63 million SF.
• Vacancy continued declining. Down 9.2%. Sublease also decreasedthroughout year.
• New construction activity brisk. Deliveries totaled 3.52 million SFwith additional 6.93 million SF under construction.
• Sales activity strong. Total volume topped $2.81 billion, with priceper SF posting $184.74 per SF. Average cap rate posted 7.1%.
Office Outlook• Blue Chip Panel’s influences on economy in 2007 are population and
employment growth, increasing wages, and construction. Projectionsinclude strong economic growth well above national average.
• Expect increasing absorption starting 2007, due to strong job creationand population inflow.
• Vacancies to continue declining steadily since activity at record pace. Class A and C vacancies already below 10% indicating need for inventory.
• Proposals growing as number of deliveries and new projects rise.Currently 9.4 million SF planned.
• Market bolstered by job creation especially in advanced business services. Overall activity will remain high.
INDUSTRIAL
• Considered southwest industrial “hub,” serving main trade corridorwith southern California. Strong job creation and centralized location bolstered activity throughout 2006.
• Year-to-date absorption posted a record 11.3 million SF. • Metro vacancy rate for all buildings posted 8.4% at year-end 2006,
down from 9.0% at year-end 2005.• New construction deliveries for year posted 8.46 million SF, nearly
double the 4.63 million SF seen delivered during all of 2005.• Sales activity remained strong throughout 2006. Total sales volume
posted $1.55 billion, with average price per SF, posting $93.63 per SF.
Industrial Outlook• Population and employment growth, increasing wages, and
construction are expected to be main drivers behind industrial growth in 2007 as well.
• Projections call for increasing absorption well into 2007, with activityin both office and industrial expected to be major highlight in metroPhoenix economy.
• Number of actively proposed projects at end of 2006 posted 7.29 million SF, indicating pipeline of new projects will remain strong.
• Projections indicate vacancy rates will continue to decline, due tostrong absorption activity.
• Metro Phoenix poised to record another banner year during 2007.Strong job growth and population inflow key factors driving marketand expected to remain strong well into coming year.

PLEASANTON/WALNUT CREEK, CA
DOWNTOWN OFFICE
Inventory New Absorption Vacancy Class A(SF) Supply (SF) (SF) Rate (%) Rent ($PSF)
1999 – – – – –2000 – – – – –2001 – – – – –2002 – – – – –2003 – – – – –2004 21,465,000 0 354,000 12.2 26.102005 21,465,000 0 783,000 11.1 25.802006 21,085,000 -380,000 -256,000 11.3 26.88
SUBURBAN OFFICE
Inventory New Absorption Vacancy Class A(SF) Supply (SF) (SF) Rate (%) Rent ($PSF)
1999 – – – – –2000 – – – – –2001 – – – – –2002 – – – – –2003 – – – – –2004 18,499,000 0 185,000 13.6 22.902005 18,499,000 0 321,000 10.5 24.402006 20,899,000 2,400,000 1,256,000 13.5 26.40
INDUSTRIAL
Inventory New Absorption Vacancy Warehouse Land(SF) Supply (SF) (SF) Rate (%) Rent ($PSF) ($PSF)
1999 – – – – – – 2000 – – – – – – 2001 – – – – – – 2002 – – – – – – 2003 – – – – – – 2004 32,752,000 66,000 206,000 8.6 4.80 10.002005 32,840,000 88,000 39,000 8.6 4.35 10.172006 32,966,000 126,000 1,000 8.6 4.93 10.55
METROPOLITAN INDICATORS – 2007
• Gross Metro Product Percent Change: 2.7
• Total Employment Increase/Decrease: 12,600Percent Change: 1.2
• Unemployment Rate: 4.6
• Population (000): 2,506.8
Note: Metropolitan Indicators are for Oakland
Source: Moody’s Economy.com
C O L L I E R S I N T E R N AT I O N A L l U S R E A L E S TAT E R E V I E W 2 0 0 7
CONTACT: Mike Burke • [email protected] l RESEARCH: Lisa Kohler • [email protected] Kevin Bailey • [email protected] 57
OFFICE
• Slow down in market compared to 2005.• Sales to owner/users particularly strong in beginning of year.• Rental rates consistently rose for all classes in 2006.• Vacancy stayed essentially flat for year.• Mortgage and title companies not leasing space as quickly as a year
ago, but are not vacating as much space as had been anticipated.
Office Outlook• No significant new construction is planned for next year.• Increasing rents are expected to continue.• A rent spike expected in the second quarter of 2007.• The current shortage of sublease space is expected to continue and
grow in the new year.• Increase in local office investment anticipated.
INDUSTRIAL
• Industrial leasing velocity leveled off through 2006, though salesremained strong.
• Industrial sites with yard area becoming harder to locate.• Rents have decreased over the year for all industrial types.• Vast majority of leasing activity has been for spaces under 10,000 SF.• Vacancy rate is a historically low 3.7%.
Industrial Outlook• Construction expected to increase closer to core markets with
additional warehouse and industrial space in 2007.• Owner/User sales expected to increase through 2007.• Construction expected to slow in outlying markets as existing
inventory is absorbed.• Rental rates will continue to increase especially in core markets as
vacancy continues to decrease.• Construction costs are likely to continue climbing, though more
slowly than previously due to lagging residential market.

PORTLAND, ORC O L L I E R S I N T E R N AT I O N A L l U S R E A L E S TAT E R E V I E W 2 0 0 7
DOWNTOWN OFFICE
Inventory New Absorption Vacancy Class A(SF) Supply (SF) (SF) Rate (%) Rent ($PSF)
1999 18,846,000 0 56,000 6.3 27.302000 19,300,000 454,000 758,000 5.4 25.002001 19,370,000 70,000 -814,000 11.3 27.002002 20,138,000 768,000 -214,000 15.1 22.002003 20,326,000 188,000 212,000 12.7 21.002004 20,326,000 0 113,000 12.8 20.102005 20,326,000 0 104,000 12.7 20.502006 20,326,000 0 280,000 11.7 21.30
SUBURBAN OFFICE
Inventory New Absorption Vacancy Class A(SF) Supply (SF) (SF) Rate (%) Rent ($PSF)
1999 36,516,000 464,000 243,000 10.0 21.502000 37,333,000 817,000 1,306,000 7.9 23.502001 38,687,000 1,354,000 -18,000 12.0 23.002002 38,827,000 140,000 -794,000 14.0 23.002003 40,373,000 1,546,000 -252,000 17.3 21.002004 40,930,000 557,000 1,536,000 14.3 20.602005 41,174,000 244,000 1,369,000 10.9 21.802006 41,817,000 643,000 442,000 11.7 21.80
INDUSTRIAL
Inventory New Absorption Vacancy Warehouse Land(SF) Supply (SF) (SF) Rate (%) Rent ($PSF) ($PSF)
1999 141,131,000 2,087,000 1,683,000 8.1 4.10 –2000 142,544,000 1,413,000 2,466,000 4.8 3.50 – 2001 143,596,000 1,052,000 -1,219,000 8.5 5.00 5.502002 144,532,000 936,000 455,000 16.4 5.00 5.002003 146,885,000 2,353,000 2,609,000 16.4 4.80 4.702004 147,998,000 1,113,000 5,001,000 13.9 4.60 4.402005 149,317,000 1,319,000 4,839,000 10.8 4.55 7.612006 151,843,000 2,526,000 4,189,000 9.6 4.71 6.51
METROPOLITAN INDICATORS – 2007
• Gross Metro Product Percent Change: 3.2
• Total Employment Increase/Decrease: 18,400Percent Change: 1.8
• Unemployment Rate: 5.3
• Population (000): 2,158.8
Source: Moody’s Economy.com
58 CONTACT:Tom Lawwill • [email protected] l RESEARCH: Jazmyne Thompson • [email protected]
OFFICE
• Fastest growing sectors are construction and financial• Slowest growing sectors are natural resources, mining,
and information• Fastest Growing Companies are reportedly Buena Vista Custom
Homes, UMD Technology Inc., and HemCon Inc. • Home prices jumped 14.5% in 2006 but now slowing.• Some new development. Total new construction 461,258 SF with
830,678 SF under construction including two Class B in CBD.• Vacancy at 11.7%, down from 12% year-end 2005• Largest leases were Nike’s 90,000 SF, and WebMD’s 47,280 SF.
Top Sale was One Main Place, 315,133 SF for $69,325,000.• Land sales volume and prices are up from 2005. Largest land
sale was 7.00 acres for $12,768,525 or $41.88 per SF
Office Outlook• TriMet begins construction on the MAX light rail line at start of
2007. Rail runs from downtown Portland to Clackamas County.• Home prices now slowing but not as much as nation, given drastic
jump of 14.5% in 2006. Expect continued steady slowing.
INDUSTRIAL
• New construction planned for 2,353,830 SF with 1,300,907 SF currently under construction. Largest 2006 delivery, Bybee LakeLogistics Center, Phase I at 438,750 SF. Largest Under Construction,Bybee Lake Logistics Center, Phase II at 290,425 SF.
• Vacancy at 8.8%, down from 11.8% year-end 2005.• Largest lease MillBank Materials’ 246,211 SF in northeast,
Moran Foods’ 182,000 SF. Top Sale was ON Semiconductor Facility’s 506,363 SF for $105 million or $207.36 per SF.
• Largest land sale in NW corner of NW Evergreen and NW Shute Rd,Hillsboro. 36.35 acres for $9.8 million or $6.19 per SF. Land salesvolume and prices up from 2005.

RALEIGH/DURHAM, NC
DOWNTOWN OFFICE
Inventory New Absorption Vacancy Class A(SF) Supply (SF) (SF) Rate (%) Rent ($PSF)
1999 2,842,000 95,000 178,000 6.8 –2000 2,933,000 91,000 156,000 5.1 19.002001 3,120,000 187,000 46,000 9.8 18.002002 3,179,000 59,000 30,000 8.7 18.002003 3,226,000 47,000 -3,000 10.3 18.002004 3,513,000 287,000 250,000 10.5 18.002005 3,648,000 135,000 198,000 8.4 19.002006 3,712,000 64,000 32,000 10.6 19.30
SUBURBAN OFFICE
Inventory New Absorption Vacancy Class A(SF) Supply (SF) (SF) Rate (%) Rent ($PSF)
1999 25,217,000 3,586,000 2,551,000 6.9 –2000 28,299,000 3,082,000 2,186,000 7.7 19.502001 31,455,000 3,156,000 -2,473,000 20.0 18.502002 32,620,000 1,165,000 -148,000 21.4 18.002003 33,017,000 397,000 179,000 21.7 18.002004 34,639,000 1,622,000 1,761,000 19.7 18.002005 35,597,000 958,000 1,625,000 17.1 19.002006 37,236,000 1,639,000 1,279,000 15.8 19.80
INDUSTRIAL
Inventory New Absorption Vacancy Warehouse Land(SF) Supply (SF) (SF) Rate (%) Rent ($PSF) ($PSF)
1999 30,019,000 442,000 1,988,000 11.9 – – 2000 30,955,000 936,000 868,000 12.3 4.30 – 2001 33,895,000 2,940,000 101,000 21.9 4.30 3.002002 34,234,000 339,000 -464,000 26.5 4.00 1.852003 34,450,000 216,000 -106,000 27.3 3.50 2.002004 34,630,000 180,000 661,000 26.0 3.50 2.002005 34,785,000 155,000 1,924,000 21.5 3.75 1.722006 34,985,000 200,000 1,413,000 15.5 4.25 2.25
METROPOLITAN INDICATORS – 2007
• Gross Metro Product Percent Change: 4.1
• Total Employment Increase/Decrease: 14,200Percent Change: 2.9
• Unemployment Rate: 3.9
• Population (000): 1,004.8
Source: Moody’s Economy.com
C O L L I E R S I N T E R N AT I O N A L l U S R E A L E S TAT E R E V I E W 2 0 0 7
CONTACT: Bob Van Wormer • [email protected] l RESEARCH: Suzy McPherson • [email protected] 59
OFFICE
• Vacancy rate at 13.85% with 5.6 million SF available at year-end. • Major new projects under construction include 150,000 SF, in
Durham CBD, and 204,000 SF in Morrisville.• Purchases: Kane Realty’s 45 acres with 1.3 million SF Class A
planned; Soleil Group’s former hotel for hotel, luxury residential, and 100,000 SF Class A.
• Fidelity Investments leased four buildings totaling 500,000 SF for 3-5 years while 2,000-employee campus developed in ResearchTriangle Park.
• Migration strong. Net influx of 29,000.• Housing slowing despite migration. Starts down nearly 25%, and
remaining until absorption rises. Prices coming down. • Rental market benefiting. Multi-family delivered over
2000 units. Multi-family vacancies at 8.5%, asking rents averaging$771 per month.
Office Outlook• New infrastructure: I-540 Loop and terminal at RDU
International Airport.• 29 Class A projects planned, 3 million SF total, 15 underway,
65% pre-leased.• High growth remains financial services, informatics, nanoscale
technologies; medical care; Low are telecom, retail, and possibly residential development.
• Positive migration expected to continue and housing slowing.Migrants unable to sell homes elsewhere. Rental benefiting.
• Abundant land available for office development.
INDUSTRIAL
• Sharp drop in vacancy. Down from 26% to 14% in 24 months, stillindustrial development tempered.
• 2.8 million SF warehouse product available at year-end. Major vacancies include: 412,000 SF Carolinas Distribution Center,and 123,000 SF Research Tri Center North V near RTP.
• First Carolina Properties and Casto Development converting 475,000 SF former manufacturing facility into large-scale, mixed-use.
• Significant sales/lease transactions: Empire Distributors purchased200,000 SF build-to-suit; Kuehne and Nagel leased 295,000 SF atCarolinas Distribution Center; Beacon Partners and HamiltonMerritt Inc. acquisition of 6-building, 292,000 SF flex park for $22.79M.
Industrial Outlook• Abundant land available in Triangle. Prime land retails for
$75k-$125k per acre.• New infrastructure projects, I-540 Outer Loop in Wake County and
expansion of Terminal C at RDU International Airport expected tobenefit future development.
• High growth industries remain those affiliated with residential development (subject to slow down), nutraceuticals, nanoscale technologies, and distribution. Future high growth companiesinclude Empire Distributors, Digital Lifestyle Outfitters, Parata Systems.
• Low growth industries remain telecom equipment, retail, publishing.
RENO, NVC O L L I E R S I N T E R N AT I O N A L l U S R E A L E S TAT E R E V I E W 2 0 0 7
DOWNTOWN OFFICE
Inventory New Absorption Vacancy Class A(SF) Supply (SF) (SF) Rate (%) Rent ($PSF)
1999 – – – – –2000 – – – – –2001 1,429,000 0 -28,000 13.8 –2002 1,429,000 0 19,000 12.6 20.002003 1,429,000 0 22,000 11.3 20.502004 1,429,000 0 -24,000 12.4 20.202005 1,429,000 0 -91,000 17.9 21.002006 1,429,000 0 132,000 8.5 23.50
SUBURBAN OFFICE
Inventory New Absorption Vacancy Class A(SF) Supply (SF) (SF) Rate (%) Rent ($PSF)
1999 – – – – –2000 – – – – –2001 4,018,000 70,000 98,000 12.4 –2002 4,244,000 226,000 317,000 10.3 20.602003 4,478,000 234,000 238,000 9.4 20.502004 4,751,000 273,000 79,000 13.3 21.102005 4,971,000 220,000 87,000 14.2 22.802006 4,971,000 0 31,000 12.3 24.00
INDUSTRIAL
Inventory New Absorption Vacancy Warehouse Land(SF) Supply (SF) (SF) Rate (%) Rent ($PSF) ($PSF)
1999 – – – – – – 2000 – – – – – – 2001 55,032,000 2,543,000 1,526,000 8.8 3.70 2.502002 56,291,000 1,259,000 717,000 9.8 3.50 2.202003 57,383,000 1,092,000 269,000 10.9 3.50 2.202004 58,950,000 1,567,000 2,805,000 8.7 3.50 2.002005 60,554,000 1,604,000 1,986,000 6.2 3.50 3.752006 61,845,000 1,291,000 2,913,000 5.0 4.08 3.75
METROPOLITAN INDICATORS – 2007
• Gross Metro Product Percent Change: 3.5
• Total Employment Increase/Decrease: 5,600Percent Change: 2.4
• Unemployment Rate: 4.3
• Population (000): 412.3
Source: Moody’s Economy.com
60 CONTACT: Mike Burke • [email protected] l RESEARCH: Krystal Christiaens • [email protected]
OFFICE
• High growth is mining; Low growth is home building and related industries.
• High growth companies are Microsoft and Employers Insurance withlow growth Centex and Lennar.
• Lots of sublease space added to market and available. Newly completed NevDex IV has 65,000 SF available.
• 2006 brought sizable transactions to northern areas. Microsoft Licensing’s 69,000 SF; IGT’s new 52,000 SF headquarters;Washoe Counties purchase of 50,000 SF; 29,000 SF at NorthernNevada Corporate Center; and 27,000 SF at One California.
• Land hit top for this cycle with office land trading high at $18.60 per SF.
• Four major buildings completed bringing Class A total to 202,918 SF. • Business relocations slowing compared to previous years. Now, taxes
remain low in northern Nevada but cost of homes and office rentscompare to parts of Bay Area.
• Housing market continues to slump as over-inflated prices spiral.Between 2003 and 2005 median resale price jumped almost 65%.Early 2006 marked peak, with prices then plunging almost 16% and sales volumes declining by 40%.
Office Outlook• New development for 2007 slim with only 123,000 SF of Class A
space planned within 12 months. • High cost of homes and commercial real estate may be deterring new
business; low taxes may not be enough incentive to draw a significantnumber of new companies to area. However, as housing slows, andoverall prices drop this could change.
INDUSTRIAL
• Increased distribution is high growth industry.• Manufacturing companies starting to look in our direction.• Currently, over 3 million SF under construction centered in new
Reno Tahoe Industrial Center in McCarran. Additionally, over 2million SF of big box distribution with 405,000 SF planned to beginconstruction within 12 months in Fernley.
• Migration trend is away from traditional and now scarce and more costly industrial space within Reno and Sparks and toward outlying areas.
• Significant transactions in 2006 include Charles River Laboratoriesacquisition of 293,000 SF; Kuehne & Nagle’s 180,00 SF; AmericanRed Cross’ 169,000 SF; Ames True Temper’s 165,000 SF; AndersonMerchandiser’s 161,400 SF; and Vanguard’s 135,000 SF.
Industrial Outlook• Expensive industrial land within market continues to push industrial
growth out of the Reno/sparks area.• Increasing new construction in outlying areas expected to expand
availabilities as construction is completed. • USA Parkway to be completed in 2007 connecting Dayton and
Carson City, enabling further growth to the south of Reno.

SACRAMENTO, CA
DOWNTOWN OFFICE
Inventory New Absorption Vacancy Class A(SF) Supply (SF) (SF) Rate (%) Rent ($PSF)
1999 12,184,000 398,000 335,000 8.3 26.752000 12,184,000 0 172,000 6.8 27.952001 12,184,000 0 -1,000 6.9 27.952002 12,334,000 150,000 -118,000 8.9 29.252003 12,576,000 242,000 -272,000 12.8 29.802004 12,576,000 0 -85,000 13.5 28.902005 13,126,000 550,000 661,000 12.1 30.282006 13,126,000 0 -274,000 14.2 30.28
SUBURBAN OFFICE
Inventory New Absorption Vacancy Class A(SF) Supply (SF) (SF) Rate (%) Rent ($PSF)
1999 48,404,000 2,454,000 2,056,000 9.1 19.502000 50,325,000 1,921,000 1,137,000 10.4 21.352001 52,352,000 2,027,000 1,134,000 11.7 21.702002 54,204,000 1,852,000 326,000 14.1 22.002003 55,699,000 1,495,000 1,423,000 13.9 23.102004 57,030,000 1,331,000 747,000 14.6 23.502005 58,202,000 1,172,000 1,880,000 12.7 24.502006 59,702,000 1,500,000 629,000 13.6 25.80
INDUSTRIAL
Inventory New Absorption Vacancy Warehouse Land(SF) Supply (SF) (SF) Rate (%) Rent ($PSF) ($PSF)
1999 151,466,000 3,528,000 2,782,000 7.5 4.20 – 2000 153,667,000 2,201,000 1,163,000 8.1 4.43 – 2001 157,003,000 3,336,000 -6,611,000 14.2 4.66 3.752002 160,203,000 3,200,000 2,537,000 14.3 4.90 3.402003 161,434,000 1,231,000 1,623,000 14.0 5.20 3.302004 163,789,000 2,355,000 2,779,000 13.5 5.48 10.502005 166,143,000 2,354,000 4,370,000 12.1 5.76 11.172006 167,891,000 1,748,000 3,079,000 11.1 6.04 15.00
METROPOLITAN INDICATORS – 2007
• Gross Metro Product Percent Change: 2.6
• Total Employment Increase/Decrease: 12,600Percent Change: 1.4
• Unemployment Rate: 4.6
• Population (000): 2,101.7
Source: Moody’s Economy.com
C O L L I E R S I N T E R N AT I O N A L l U S R E A L E S TAT E R E V I E W 2 0 0 7
CONTACT: Dennis Shorrock • [email protected] l RESEARCH: Garrick Brown • [email protected] 61
OFFICE
• Overall vacancy 13.7% up from 12.6% recorded one year ago.• Aggressive new development outpaces occupancy growth, adding
approximately 1.5 million SF while absorbing just over 350,000 SF.Trend to continue.
• Rental rates climbing. Rates at $23.60 per SF, up from $22.50 per SF,9.5% jump.
• Rising construction costs, 20% over past three years, driving rentalrate growth.
• Investment sales dropped 30%. Asking prices high and cap rates lowhampering potential deals.
• Downtown Union Pacific Rail yard redevelopment plan gainedground with land sale to Thomas Enterprises.
Office Outlook• Strong development continuing with 2.7 million SF new space
under construction.• Occupancy expected to increase first half of 2007. Over 3.5 million
SF needed that could land during 2007. Robust development assuressupply meets demand.
• Rail yard redevelopment marks largest CBD infill redevelopment inU.S., potentially transforming downtown into 24-hour city.
• Construction costs expected to moderate in 2007.• Investment activity to pick up by late 2007. Cap rates already
reversing with some sellers adjusting prices. Not much pricing relieffor top tier properties.
INDUSTRIAL
• Vacancy of 11.1% at year-end, down from 12.1% one year ago. • Market tight for smaller industrial and divisible multi-tenant,
vacancy at 9.3%. • Bulk warehouse spent five years competing with neighboring markets,
but worst is over. Bulk vacancy down from 2001 peak of 21.6% to13.6% at year-end.
• Absorption posted over 3 million SF, with roughly 760,000 SF in Q4.Bulk market made greatest strides accounting for 1.9 million SF.
• New development down considerably with just 1.7 million SF newdeliveries following two years of adding over 2.3 million SF per year.
• Investment sales decreased 25%. Declining cap rates remained primary culprit, with most transactions registering in 6% range.
Industrial Outlook• Investment should improve. Prices stabilizing, interest rates low,
rental rate growth should help cap rates. Look for owner/user sales to become lion’s share.
• Stagnant land market and new availability of zoned land at MetroAirpark near airport are factors stabilizing land prices in 2007.
• Shortage of developable land continues to slow new construction.Also, increased land prices in urban core have pushed developmentfurther into outlying areas.
• Just over 1 million SF in pipeline, lowest since 2002. Expect vacancyslide in 2007, given overhang for bulk properties diminished andstrong tenant activity.
• Expect more significant rental rate growth.

SAN DIEGO, CAC O L L I E R S I N T E R N AT I O N A L l U S R E A L E S TAT E R E V I E W 2 0 0 7
DOWNTOWN OFFICE
Inventory New Absorption Vacancy Class A(SF) Supply (SF) (SF) Rate (%) Rent ($PSF)
1999 9,371,000 120,000 52,000 10.2 25.802000 9,371,000 0 140,000 8.4 26.402001 9,371,000 0 178,000 7.6 28.402002 9,371,000 0 -171,000 10.1 27.202003 9,371,000 0 -6,000 10.2 29.102004 9,371,000 0 43,000 9.4 31.102005 9,752,000 381,000 179,000 11.0 30.402006 9,888,000 136,000 -39,000 13.5 34.20
SUBURBAN OFFICE
Inventory New Absorption Vacancy Class A(SF) Supply (SF) (SF) Rate (%) Rent ($PSF)
1999 52,370,000 2,250,000 2,784,000 7.4 27.002000 52,870,000 500,000 1,786,000 4.60 24.702001 54,409,000 1,539,000 -385,000 10.1 23.602002 55,736,000 1,327,000 -1,900,000 12.8 22.502003 56,290,000 554,000 757,000 11.3 29.402004 56,545,000 255,000 102,000 11.6 32.902005 58,119,000 1,574,000 2,409,000 8.9 33.602006 60,796,000 2,677,000 1,220,000 11.1 35.90
INDUSTRIAL
Inventory New Absorption Vacancy Warehouse Land(SF) Supply (SF) (SF) Rate (%) Rent ($PSF) ($PSF)
1999 166,739,000 11,380,000 7,102,000 7.9 7.20 – 2000 170,293,000 3,554,000 4,565,000 5.6 7.80 – 2001 173,730,000 3,437,000 2,363,000 8.2 7.50 8.502002 175,347,000 1,617,000 213,000 9.1 6.50 9.002003 177,363,000 2,016,000 684,000 9.8 7.60 5.502004 180,183,000 2,820,000 2,493,000 7.8 8.00 5.942005 182,805,000 2,622,000 3,505,000 6.8 8.50 12.902006 185,713,000 2,908,000 2,801,000 6.9 9.00 16.52
METROPOLITAN INDICATORS – 2007
• Gross Metro Product Percent Change: 2.3
• Total Employment Increase/Decrease: 12,500Percent Change: 1.0
• Unemployment Rate: 4.1
• Population (000): 2,977.8
Source: Moody’s Economy.com
62 CONTACT: Jim Zimsky • [email protected] l RESEARCH: Chris Reutz • [email protected]
OFFICE
• Over 2.8 million SF completed, most in a decade. • Vacancy increased over 2% ending at 11.5%, highest since 2002.
Sublease vacancy remains low at 1.5%. Over 37% of 2006 deliveries vacant.
• Multi-tenant demand flat considering nearly 1 million SF of the 1.2 million SF net absorption due to Qualcomm’s two build-to-suit towers.
• Downtown sales volume robust with $887 million sold in 33 properties. Average prices $416 per SF downtown and $326 per SF suburban.
• Employment growth strong with 13,900 jobs added. Unemployment rate dipped to 3.9%. Largest gain in professional and business services. Financial services losing 1,000 jobs.
• Median home price dropped by 6% sustained double-digit growth.Housing resale volume slipped as condo-conversion “craze” halted.
Office Outlook• The 2.8 million SF in completions, plus additional 3.7 million SF
under construction will create a short-term oversupply.• New deliveries in 2007 and 2008 currently only 28% pre-committed,
so vacancy expected to increase to over 13% by year-end 2007.• Expect rental rates to increase as new premium product in select
suburban markets captures relocating tenants from expiring leases.Some Class A rates reaching nearly $48.00 per SF full-service.
• Economy.com forecasts 12,500 new jobs created during 2007.
INDUSTRIAL
• Stable supply-demand balance. 3.1 million SF constructed, mostcompleted since 2001 with 950,472 SF completed in Q4.
• Nearly two-thirds of 2006 completions absorbed within year. Total net absorption 2.8 million SF.
• Vacancy 6.9% in Q4, stayed below 7% for past six quarters. Industrial sublease vacancy stands at 1.0%.
• Rents flat at $12.84 per SF NNN.• Land limited, new development prohibitively expensive. North and
South counties seeing warehouse and multi-tenant activity due tolower land costs. Central County focused on R&D/Flex, corporate,and laboratories.
• North County activity under 10,000 SF. Some users finding ownership affordable due to low interest rates.
• Employment strong, 13,900 new jobs. Manufacturing saw minor netjob loss of 4%, 400 jobs. Trade, transportation, and utilities gained1.1%, or 2,500 jobs.
Industrial Outlook• Vacancy stable with slight increases early 2007. Anticipate decrease
by year-end; expect 6% to 7% range.• Trend toward razing older manufacturing facilities to redevelop into
offices. Plans underway to redevelop over 3 million SF on formerSony manufacturing facility site.
• Interstates 5, 805, 15 and state highways 78 and 125 undergoingimprovements to relieve congestion. North County constructionnearly complete on commuter rail serving four submarkets.
• Rents expected flat throughout 2007.
SAN FRANCISCO, CA
DOWNTOWN OFFICE
Inventory New Absorption Vacancy Class A(SF) Supply (SF) (SF) Rate (%) Rent ($PSF)
1999 71,903,000 525,000 2,634,000 2.6 45.12000 74,837,000 2,934,000 3,093,000 3.6 78.12001 77,010,000 2,173,000 -5,011,000 13.5 40.92002 79,353,000 2,343,000 -1,137,000 16.9 322003 79,578,000 225,000 138,000 16.9 29.12004 79,578,000 0 1,237,000 15.4 31.32005 79,328,000 -250,000 1,700,000 13.2 35.42006 79,154,000 -174,000 1,139,000 11.6 42.6
METROPOLITAN INDICATORS – 2007
• Gross Metro Product Percent Change: 4.1
• Total Employment Increase/Decrease: 11,900Percent Change: 1.2
• Unemployment Rate: 4.2
• Population (000): 1,697.8
Source: Moody’s Economy.com
C O L L I E R S I N T E R N AT I O N A L l U S R E A L E S TAT E R E V I E W 2 0 0 7
CONTACT: Glen Esnard • [email protected] l RESEARCH:Tove Nilsen • [email protected] 63
OFFICE
• City taking steps to encourage developers to think green, for examplecompressing review process for LEED certification to 1/12th the typical time.
• Housing finally slowed after flurry of activity over last few years.Activity cooled but far from ceased.
• Tech companies growing. Tech industry revitalized over past year due to renewed interest from venture capitalists and idea of overnight success.
• Investment demand at all time high, particularly in value-add properties. Total investment volume of $3.8 billion but total 2006transactions topped $4.37 billion.
• Class A view space demand far exceeds supply. Lack of premiumspace driving firms into abundant commodity space, tamping downaverage rents.
Office Outlook• A slew of development projects in pipeline. A total of 2.4 million SF
delivering by 2009.• Class A decrease and significant increases in construction costs will
continue to force tenants to renew.• There is a “disconnect” between Class B rental rate Pro Forma and
actual market Pro Forma, the gap will close.• Overall vacancy rate will dip below 10% by year-end 2007, causing
rental rates to continue to increase 20%.• Conversions of vacant office buildings to residential will continue to
impact vacancy rate through 2007. However, trend should decline,due to entitlements, construction costs, and interest rate increases.

SAN FRANCISCO/SAN MATEO PENINSULA, CA
C O L L I E R S I N T E R N AT I O N A L l U S R E A L E S TAT E R E V I E W 2 0 0 7
SUBURBAN OFFICE
Inventory New Absorption Vacancy Class A(SF) Supply (SF) (SF) Rate (%) Rent ($PSF)
1999 26,022,000 2,118,000 2,084,000 0.7 56.052000 28,600,000 2,578,000 3,215,000 2.6 70.902001 29,731,000 1,131,000 -4,363,000 22.4 36.952002 30,221,000 490,000 -1,104,000 28.3 28.452003 30,388,000 167,000 189,000 29.3 25.102004 30,388,000 0 644,000 25.4 24.702005 30,388,000 0 1,548,000 20.4 25.702006 30,388,000 0 710,000 15.8 29.60
INDUSTRIAL
Inventory New Absorption Vacancy Warehouse Land(SF) Supply (SF) (SF) Rate (%) Rent ($PSF) ($PSF)
1999 43,952,000 100,000 297,000 1.8 9.60 – 2000 43,933,000 -19,000 682,000 2.5 31.20 – 2001 43,933,000 0 -3,333,000 9.8 10.10 – 2002 43,973,000 40,000 -1,877,000 11.6 10.00 – 2003 43,973,000 0 436,000 10.6 8.60 60.002004 43,973,000 0 1,179,000 8.3 7.90 65.002005 43,973,000 0 1,051,000 6.2 9.25 73.002006 43,973,000 0 327,000 5.4 9.36 73.11
64 CONTACT: Mike Burke • [email protected] l RESEARCH: Jeff Dizon • [email protected]
OFFICE
• Overall vacancy rate year-end at 15.8%, down from 20.4% a year ago,also lowest rate since Q3, 2001.
• Leasing activity slowed as gross absorption dropped to 3.38 million SF. • Net occupancy gains realized for fourth consecutive year as Peninsula
posted 710,465 SF net absorption. • Overall average starting rents at 2006 close increased to
$29.64 per SF. Highest average since Q2, 2002. • Class A rents increased to $31.32 per SF, due to strong demand
in San Mateo, Foster City, Redwood City and Menlo Park. Sand Hill Road, hotbed for venture capitalists, space in range of $64.20 to $78.00 per SF.
• 2005’s investment surge continued with over $270 million more in2006, recording $1.7 billion in transactions.
• The average price per SF jumped from $243 to $380. Driving averageup are ING Clarion’s 133,000 SF acquisition for $989 per SF andStarwood Capital’s purchase of Pacific Shores Center, 1.7 million SFfor $488 per SF.
• Largest lease transaction was PDL BioPharma’s 440,000 SF inRedwood City. Moving headquarters to Pacific Shores Center,signing fifteen-year deal.
Office Outlook• Demand and deal flow should stay strong. Gross absorption should
exceed 3 million SF with an occupancy gain over 600,000 SF. • With submarkets tightening, especially Class A, asking rate expected
to increase 15%.
INDUSTRIAL
• Industrial vacancy remained relatively flat throughout 2006 withvacancy at 5.5% at year-end.
• R&D vacancy continued to fall, with vacancy rate just under 12%. • Industrial/warehouse in northern areas of Brisbane & South San
Francisco continues to become redevelopment plays as demand forspecialized R&D/lab space rises.
• Average asking rental rates rose from $8.76 per SF (NNN) at beginning of year to $9.36 per SF (NNN) at end.
• Cap rates continued to fall as price per SF rose to $193 per SF. • Overall leasing activity 2006 decreased over previous year, however
net occupancy gains posted.• Northern area continued to generate bulk of leasing activity
in R&D market.
Industrial Outlook• Expect rents to rise in both industrial/warehouse and R&D markets. • Cautiously optimistic for industrial/warehouse market, primarily
due to decline in demand last year. That may affect how far askingrents rise.
• Industrial/warehouse space will continue to generate demand on sales side, attracting owner/users and developers looking to changewarehouses into labs.

SAN JOSE/SILICON VALLEY, CA
DOWNTOWN OFFICE
Inventory New Absorption Vacancy Class A(SF) Supply (SF) (SF) Rate (%) Rent ($PSF)
1999 6,174,000 0 96,000 5.4 45.102000 6,174,000 0 260,000 1.2 60.002001 6,516,000 342,000 -151,000 8.7 57.102002 6,516,000 0 -292,000 13.2 39.302003 7,172,000 656,000 -77,000 20.3 32.702004 7,172,000 0 -10,000 20.6 33.002005 7,172,000 0 -286,000 24.6 30.302006 7,172,000 0 310,000 20.0 30.40
SUBURBAN OFFICE
Inventory New Absorption Vacancy Class A(SF) Supply (SF) (SF) Rate (%) Rent ($PSF)
1999 42,119,000 1,704,000 1,455,000 4.6 42.402000 44,142,000 2,023,000 2,559,000 1.9 84.002001 47,634,000 3,492,000 -171,000 10.7 42.202002 49,566,000 1,932,000 216,000 13.1 29.202003 49,875,000 309,000 -2,389,000 17.3 25.902004 49,881,000 6,000 1,035,000 15.2 24.802005 49,895,000 14,000 1,875,000 11.5 27.202006 50,146,000 251,000 2,327,000 6.9 32.10
INDUSTRIAL
Inventory New Absorption Vacancy Warehouse Land(SF) Supply (SF) (SF) Rate (%) Rent ($PSF) ($PSF)
1999 237,972,000 253,000 4,680,000 4.2 10.50 – 2000 242,960,000 4,988,000 11,230,000 1.3 8.40 – 2001 251,531,000 8,571,000 -7,312,000 7.6 8.40 32.502002 253,861,000 2,330,000 -8,607,000 11.7 4.30 35.002003 253,883,000 22,000 -12,987,000 16.8 5.50 25.002004 253,964,000 81,000 951,000 16.4 5.20 25.002005 254,470,000 506,000 4,311,000 14.5 4.90 25.002006 254,511,000 41,000 5,333,000 12.2 5.11 30.00
METROPOLITAN INDICATORS – 2007
• Gross Metro Product Percent Change: 3.7
• Total Employment Increase/Decrease: 9,600Percent Change: 1.1
• Unemployment Rate: 5.0
• Population (000): 1,787.9
Source: Moody’s Economy.com
C O L L I E R S I N T E R N AT I O N A L l U S R E A L E S TAT E R E V I E W 2 0 0 7
CONTACT: Mike Burke • [email protected] l RESEARCH: Jeff Dizon • [email protected] 65
OFFICE
• Strong activity, with absorption at 7.10 million SF, third year over 7 million.
• Net absorption increased 51% from previous year, posting net occupancy gain of 2.64 million SF, largest one-year gain since 2000.
• Starting rents above $24.00 per SF, full service, for first time since 2002.
• Amount of previously occupied space available decreased from 5.92 million SF to 4.47 million SF, difference 24.6%.
• Job growth highest seen in over five years, driving down jobless rate to 4.5%.
• Venture capital spending as of Q3 2006 was highest since 2001,recording $6.71 billion.
• Investment up 35.6% from previous year, recording $3.8 billion in transactions.
• Of five major office markets, only San Jose reported gain in grossabsorption 2005 to 2006.
Office Outlook• Office gross absorption should again exceed 7 million SF with
occupancy gain of close to 3 million SF. • Should see office rents increase by 10-15%, due to lower availability
rates forecasted for the coming year.
INDUSTRIAL
• Net occupancy gains in R&D, industrial, and warehouse; R&D andindustrial posted gains greater than previous year.
• Industrial and warehouse sectors tight, 2006 availability rates lowestsince 2000.
• For first time in five years, R&D availability is below 20%, at 18.44%. • User sale and leasing activity in R&D totaled over 11 million SF for
third year, posting 11.2 million SF gross absorption.• Industrial posted back-to-back net occupancy gains over 1 million SF,
seen last in 1996 and 1997.• Previously occupied R&D/industrial/warehouse space coming
available during 2006 decreased 28.69% over last year.
Industrial Outlook• R&D poised to generate another 3.0-3.5 million SF occupancy gain
in 2007, on total gross absorption of 11.0-12.0 million SF. • Industrial sector is consistency benchmark, but tight conditions
likely to reduce gross absorption to 3.5 million SF and net absorptionto 1 million SF.
• Warehouse absorption hard to forecast due to small building base.Low vacancy, but expecting 2.5 million SF absorption and 750,000 SFnet occupancy gain.
• Investment virtually flat, up only 1.9%, recording $1.3 billion in transactions.

SEATTLE/PUGET SOUND, WAC O L L I E R S I N T E R N AT I O N A L l U S R E A L E S TAT E R E V I E W 2 0 0 7
DOWNTOWN OFFICE
Inventory New Absorption Vacancy Class A(SF) Supply (SF) (SF) Rate (%) Rent ($PSF)
1999 30,961,000 428,000 741,000 2.5 32.002000 32,892,000 1,931,000 1,819,000 3.5 37.002001 34,879,000 1,987,000 -1,405,000 12.6 35.002002 35,732,000 853,000 -45,000 14.6 29.502003 36,577,000 845,000 311,000 15.3 26.302004 36,665,000 88,000 -167,000 15.2 25.802005 36,665,000 0 763,000 12.8 25.202006 36,850,000 185,000 1,487,000 8.5 27.50
SUBURBAN OFFICE
Inventory New Absorption Vacancy Class A(SF) Supply (SF) (SF) Rate (%) Rent ($PSF)
1999 43,380,000 3,943,000 1,670,000 6.7 22.502000 45,962,000 2,582,000 3,769,000 5.3 24.002001 49,500,000 3,538,000 -1,222,000 15.6 25.002002 50,593,000 1,093,000 166,000 17.5 23.002003 50,803,000 210,000 -90,000 17.6 22.902004 50,874,000 71,000 965,000 15.4 23.602005 51,270,000 396,000 2,031,000 12.0 21.802006 51,320,000 50,000 779,000 10.6 26.00
INDUSTRIAL
Inventory New Absorption Vacancy Warehouse Land(SF) Supply (SF) (SF) Rate (%) Rent ($PSF) ($PSF)
1999 196,165,000 5,292,000 607,000 4.7 4.90 – 2000 196,881,000 716,000 643,000 5.2 4.60 – 2001 199,991,000 3,110,000 -4,646,000 8.6 5.50 8.002002 201,140,000 1,149,000 -2,380,000 10.4 5.50 9.702003 201,988,000 848,000 -1,057,000 11.1 5.50 8.002004 205,112,000 3,124,000 6,496,000 9.3 5.50 6.002005 215,141,000 10,029,000 8,102,000 7.4 5.60 6.752006 219,360,000 4,219,000 5,595,000 6.5 6.36 7.50
METROPOLITAN INDICATORS – 2007
• Gross Metro Product Percent Change: 3.6
• Total Employment Increase/Decrease: 24,500Percent Change: 1.7
• Unemployment Rate: 4.3
• Population (000): 2,520.6
Source: Moody’s Economy.com
66 CONTACT: John Powers • [email protected] l RESEARCH:Trish McRae • [email protected]
OFFICE
• Inventory at 88,169,702 SF, total vacancy including sublease at 9.97%.
• Seattle’s absorption 1,487,000 SF, highest ever! Direct vacancy fallento 8.46%.
• CBD availability disappearing, costing more, migration to submarkets.• Interest strong. Investment in sellers’ favor. Tenants buying own
properties on premise of rising rents, now reality.• Leasing activity highest in Bellevue, vacancy below 5%. • South King County vacancy up slightly to 19.9%. Net absorption
negative earlier, but year-end reached 374,500 SF. • Safeco bought 282,000 SF and 200,000 SF, one of largest
leases downtown. • Microsoft purchased 800,000 SF reportedly for $220.5M;
Teachers Insurance & Annuity Association purchased Millennium Corporate Park for $139M.
Office Outlook• Positive absorption should continue for several more years.
Availability limited in 2007, inventory increases 40% over next two years.
• Seattle and Eastside awaiting effects of Blackstone’s buyout of largestlandlord, Equity Office Properties.
• New Eastside projects under construction coming available startingQ3 2007 include Lincoln Square’s 520,000 SF 100% leased, Tower333, and The Bravern in 2008. Problems plagued Tower 333 aftercrane fell killing one and causing millions in damage.
INDUSTRIAL
• 800,000 SF added to inventory, now at 219,360,453 SF.• Year-end absorption at 5,594,789 SF.• Properties in the Eastside submarkets posted phenomenal gains with
year-end showing over 1.0 million SF occupied. In two years, nearly2.2 million SF absorbed with vacancy dropping 9 percentage points!
• Willows submarket, leader for growth. High-tech, distribution, andbusiness park all showed triple-digit gains at year-end.
• Kent Valley’s vacancy rate at 5.12%, tightest in region. Vacancies ona downward trend since beginning of 2004.
• Phenomenal year in Perce County. Net absorption for year at 2,127,000 SF.
• IDX pre-leased 300,000 SF in Fife; Salmon Terminals leased 209,000 SF.
• Children’s Hospital & Regional Medical Center purchased the lifesciences building, for $108,853,967; RREEF purchased GatewayCorporate Center in Tukwila for $73,300,000.
Industrial Outlook• Expect measured dip in vacant space, but increase in actual vacancy
rate as new construction floods area. • Construction continues in Kent Valley though land limited.
Currently 1.8 million SF under construction. • Manufacturing hot in Northend spurred by transactions near
South Everett Boeing plant. Expect more of same.

ST. LOUIS, MO
DOWNTOWN OFFICE
Inventory New Absorption Vacancy Class A(SF) Supply (SF) (SF) Rate (%) Rent ($PSF)
1999 11,387,000 165,000 153,000 13.3 18.502000 11,432,000 45,000 153,000 12.3 20.002001 11,432,000 0 -259,000 14.6 19.502002 11,432,000 0 -504,000 19.0 18.802003 11,432,000 0 -349,000 22.0 18.802004 11,206,000 -226,000 -52,000 20.9 18.502005 11,156,000 -50,000 44,000 20.2 19.302006 11,234,000 78,000 167,000 19.2 20.60
SUBURBAN OFFICE
Inventory New Absorption Vacancy Class A(SF) Supply (SF) (SF) Rate (%) Rent ($PSF)
1999 29,209,000 1,824,000 1,421,000 6.3 26.302000 30,929,000 1,720,000 1,337,000 7.2 25.502001 33,625,000 2,696,000 739,000 12.5 24.502002 34,552,000 927,000 332,000 13.9 24.502003 35,379,000 827,000 321,000 15.0 23.502004 35,591,000 212,000 307,000 14.6 23.002005 36,204,000 613,000 1,088,000 13.0 23.002006 36,785,000 581,000 978,000 11.8 23.00
INDUSTRIAL
Inventory New Absorption Vacancy Warehouse Land(SF) Supply (SF) (SF) Rate (%) Rent ($PSF) ($PSF)
1999 218,327,000 4,569,000 3,926,000 3.4 4.25 – 2000 222,146,000 3,819,000 2,122,000 4.1 5.00 – 2001 227,252,000 5,106,000 -1,947,000 7.1 4.00 2.752002 230,650,000 3,398,000 1,856,000 7.6 3.30 3.502003 232,246,000 1,596,000 573,000 8.0 3.50 4.502004 233,676,000 1,430,000 3,961,000 6.9 3.50 3.502005 234,944,000 1,268,000 3,853,000 5.4 3.75 3.252006 239,561,000 4,617,000 2,317,000 6.5 4.00 3.85
METROPOLITAN INDICATORS – 2007
• Gross Metro Product Percent Change: 2.1
• Total Employment Increase/Decrease: 7,800Percent Change: 0.6
• Unemployment Rate: 5.1
• Population (000): 2,825.2
Source: Moody’s Economy.com
C O L L I E R S I N T E R N AT I O N A L l U S R E A L E S TAT E R E V I E W 2 0 0 7
CONTACT: Rick Messey • [email protected] l RESEARCH: Jeradawn Vaughn • [email protected] 67
OFFICE
• Net absorption exceeded one million SF, second consecutive million-plus year
• No space in West County with greater than 60,000 SF of contiguousspace available at year-end.
• Since millennium, city slowly been experiencing a transformation andto date $3.5 billion dollars have been invested in downtown.
• Centene Corporation, which currently occupies approximately120,000 SF in two buildings in Clayton, has plans for a 300,000 SFbuilding to accommodate projected growth.
• Express Scripts building a 320,000 SF headquarters on Natural BridgeRoad, and will retain some existing space.
• In its move from Clayton, Smurfit Stone leased 140,000 SF in new220,000 SF CityPlace Six in Creve Coeur.
• Class A in West St. Louis County absorbed 798,000 SF, resulting invacancy falling from 14.7% to 9.5%
Office Outlook• Availability of larger blocks of space continues to diminish.
Expect higher rents for Class A space 20,000 SF and larger in theClayton, West and South County submarkets.
• Transformation in downtown continues. • Large speculative construction has been virtually nonexistent for ten
years and 2007 will bring even less speculative space to the market.• North St. Louis vacancy rate expected to increase in 2007 as
approximately 260,000 SF scheduled to be vacated by three large tenants.
INDUSTRIAL
• Speculative new construction increased steadily in last four years.• Transportation costs taking precedence over proximity to major
population centers. St. Louis among secondary and tertiary metropolitan areas benefiting from trend.
• Primary driver for absorption of two million square feet of new construction was continued emergence of Madison County as preferred location for regional distribution buildings.
• Spectrum Brands leased entire 605,000 SF Lakeview DistributionCenter I in Edwardsville, Illinois.
• Bulk construction added 3.6 million SF, all speculative• Downtown manufacturing and warehouse rapidly being converted to
residential and retail; nearly 4 million SF converted in past five years,primarily to loft condos and apartments.
• Duke Realty completed 528,000 SF Lindbergh Distribution Center in Hazelwood
Industrial Outlook• Speculative construction of Class A distribution will continue into
2007 and 2008, but absorption will keep vacancies at healthy level.• Expect industrial production and rising import/export activity to keep
demand for space strong.• Trend in manufacturing and warehouse buildings conversions
expected to continue. • Four bulk buildings with a total of 900,000 SF under construction
and scheduled for completion in first half of 2007.

TAMPA BAY, FLC O L L I E R S I N T E R N AT I O N A L l U S R E A L E S TAT E R E V I E W 2 0 0 7
DOWNTOWN OFFICE
Inventory New Absorption Vacancy Class A(SF) Supply (SF) (SF) Rate (%) Rent ($PSF)
1999 7,860,000 0 96,000 11.1 19.322000 7,860,000 0 85,000 13.4 19.762001 7,860,000 0 -156,000 14.8 19.672002 7,860,000 0 -27,000 15.8 19.702003 7,860,000 0 34,000 16.3 19.482004 7,860,000 0 37,000 15.9 19.902005 7,860,000 0 54,000 15.0 19.732006 7,860,000 0 11,000 16.1 20.72
SUBURBAN OFFICE
Inventory New Absorption Vacancy Class A(SF) Supply (SF) (SF) Rate (%) Rent ($PSF)
1999 54,325,000 1,558,000 1,558,000 7.3 20.502000 56,613,000 2,288,000 2,288,000 10.1 21.632001 58,492,000 1,879,000 1,879,000 12.4 20.552002 59,150,000 658,000 658,000 11.9 20.042003 59,987,000 837,000 837,000 12.4 20.802004 61,524,000 1,537,000 1,537,000 12.1 21.032005 62,666,000 1,142,000 1,142,000 10.1 21.392006 63,492,000 826,000 826,000 9.4 23.81
INDUSTRIAL
Inventory New Absorption Vacancy Warehouse Land(SF) Supply (SF) (SF) Rate (%) Rent ($PSF) ($PSF)
1999 157,894,000 1,207,000 642,000 4.6 4.48 – 2000 160,755,000 2,861,000 1,006,000 5.6 4.73 – 2001 164,305,000 3,550,000 1,382,000 6.9 4.54 2.002002 165,791,000 1,486,000 1,505,000 6.8 4.28 2.502003 167,464,000 1,673,000 2,193,000 6.4 4.35 3.902004 168,368,000 904,000 1,183,000 6.2 4.33 5.002005 170,811,000 2,443,000 2,428,000 6.1 4.67 5.002006 173,545,000 2,734,000 4,575,000 5.0 5.53 5.50
METROPOLITAN INDICATORS – 2007
• Gross Metro Product Percent Change: 2.3
• Total Employment Increase/Decrease: 15,900Percent Change: 1.2
• Unemployment Rate: 3.4
• Population (000): 2,732.3
Source: Moody’s Economy.com
68 CONTACT: Russ Sampson • [email protected] l RESEARCH: Karen Temmen • [email protected]
OFFICE
• Total 817,226 SF completed, 31 buildings with 75% pre-leased or sold.
• Vacancy steady ending at 10%. Continued positive absorptiondespite new building supply.
• New 30,000 SF conversion in CBD. Industrial renovated into office condos.
• Lease rates up. Overall direct ended at $19.89 per SF. Class A directat $22.33 per SF.
• MetLife, Inc. leased 115,000 SF, also purchased and leased total300,800 SF in former MCI Worldcom complex.
• Florida has fastest job growth and lowest unemployment of ten mostpopulous states. Job growth jumped 2.1% adding 27,200 jobs.
• Housing slow. Sales totals down 43% over 2005. Median pricesincreased by 8%.
• Growth areas are professional/business, education/health, andleisure/hospitality services.
• Construction sluggish due to drop in residential construction.
Office Outlook• 22 buildings totaling 1,196,192 SF under construction, 42% of
space leased or sold. The I-75 Corridor submarket leads area with 8 buildings and 522,982 SF.
• Expect lease rates to continue upward trend throughout 2007.• Vacancy should hold steady.• Total net migration is 46,814 according to Moody’s Economy.com.
Over next five years population estimated to grow by 8% to 9%.
INDUSTRIAL
• Good news for Industrial and Flex market. First quarter had over 1 million SF completed, with over 1.8 million SF absorbed! Total new construction completed just over 2.9 million SF.
• 22 buildings under construction totaling 1.7 million SF, 48% leased or sold.
• Vacancy improved throughout year. Rate for Q4 2006 at 5.2%, downfrom 6.2% year-end 2005. Vacancy rates projected to hold steadythroughout 2007.
• Marked increase in lease rates from new construction and shrinkingavailability. Warehouse/distribution rose to $5.55 per SF year-endfrom $4.67 per SF 2005. Flex rates rising from $9.02 per SF for Q42005 to current $9.64 per SF for Q4 2006. Lease rates shouldincrease throughout 2007.
• Three new container cranes now servicing more ships at Port ofTampa. Facility on 24 acres with expansion capabilities. A majoradvantage over other U.S. ports locked into current capacity. A weekly shipment from Shanghai, China to Tampa began mid-year.
Industrial Outlook• Construction activity expected to continue, with deliveries
set for 2007.• Vacancy rates projected to hold steady throughout 2007. • Current and continued port expansion will benefit industrial market
near term and years to come.

WASHINGTON, DC
DOWNTOWN OFFICE
Inventory New Absorption Vacancy Class A(SF) Supply (SF) (SF) Rate (%) Rent ($PSF)
1999 91,968,000 1,598,000 1,979,000 5.7 39.082000 93,579,000 1,611,000 2,774,000 4.0 39.362001 97,784,000 4,205,000 2,223,000 5.3 40.752002 99,492,000 1,708,000 209,000 6.4 41.942003 102,135,000 2,643,000 911,000 7.2 42.202004 103,802,000 1,667,000 1,667,000 7.5 43.202005 106,573,000 2,771,000 1,809,000 7.2 44.092006 111,351,000 4,778,000 3,213,000 7.1 46.71
INDUSTRIAL
Inventory New Absorption Vacancy Warehouse Land(SF) Supply (SF) (SF) Rate (%) Rent ($PSF) ($PSF)
1999 – – – – – – 2000 164,666,000 2,700,000 1,400,000 6.1 – – 2001 168,013,000 3,347,000 21,000 8.5 6.70 5.002002 169,777,000 1,764,000 -2,999,000 10.2 7.50 6.002003 172,218,000 2,441,000 656,000 11.2 7.20 5.002004 174,977,000 2,759,000 3,438,000 10.6 8.80 5.502005 178,972,000 3,995,000 3,027,000 9.2 7.80 6.002006 182,233,000 3,261,000 2,095,000 9.4 8.38 6.23
C O L L I E R S I N T E R N AT I O N A L l U S R E A L E S TAT E R E V I E W 2 0 0 7
CONTACT: Paul Darr • [email protected] l RESEARCH: Margarita Foster • [email protected] 69
OFFICE
• Total dollar volume for office investment sales reached $6.5 billioncompared to $4.2 billion in 2005.
• Numerous whole company and portfolio sales contributed to therobust increase.
• Net absorption reached a 15-year high of 3.2 million SF. • Deliveries totaled 4.7 million SF, roughly 30 percent available. • Expansions by federal users and law firms contributed heavily
to net absorption. • Vacancy remained almost unchanged at 7.1 percent.
Office Outlook• With fewer massive federal leases waiting to be signed, net
absorption should return to more normalized level in 2007, ending year somewhere between 1.5 and 2.5 million SF.
• Just 2.7 million SF scheduled to deliver in 2007 with 58% available. • Gut renovations taking buildings out of inventory will continue,
keeping vacancy close to 7 percent. • Rental rates are likely to continue to rise as more private sector
owners (replacing REITs) hold out for higher rents.• The sale of equity office trust will keep investment sales volume high
in the DC market.
INDUSTRIAL
• Market inventory is 182 million SF.• D.C. industrial mostly in suburban Maryland and Northern Virginia.
Posted mixed vacancy over year, between 9.0% and 9.8%, settling at9.4% in Q4.
• Net absorption teetered, fluctuating between 1.15 million SF Q3 andnegative 465,000 SF Q2. Overall market net absorption positive491,121 SF Q4.
• Average asking rental rates ended year at $10.29 per SF, up by 1.3%from previous quarter.
• Largest lease signings included: Capital Lighting & Supply’s 200,000SF at Eastgate Business Park; Coca-Cola’s 79,752 SF.
• Vacant sublease space dropped to 994,828 SF Q4 from 1.0 million SF Q3.
• Over 3 million SF in 56 buildings delivered for year.• Industrial/Flex sales down. However, large portfolio 7-building sale in
suburban Maryland. The 446,010 SF sold for $94 million, or $210.76per SF, 6.5% cap rate.
Industrial Outlook• Activity continues with 3.7 million SF under construction at year-end
2006, several deliveries set for 2007.• The largest projects underway are Pennsylvania Ave. SE, 200,000 SF
100% pre-leased, and Ashburn Corporate Center, ACC 4, 175,000 SF, 37% pre-leased.
• Overall outlook good, with slight increase in vacancy expected, asnew product delivered. Should drop again toward year-end.

WASHINGTON, DCC O L L I E R S I N T E R N AT I O N A L l U S R E A L E S TAT E R E V I E W 2 0 0 7
NORTHERN VA OFFICE
Inventory New Absorption Vacancy Class A(SF) Supply (SF) (SF) Rate (%) Rent ($PSF)
1999 108,681,000 10,036,000 8,642,000 4.9 30.502000 116,959,000 8,278,000 10,212,000 3.1 35.002001 125,781,000 8,822,000 -5,479,000 14.2 34.002002 131,816,000 6,035,000 -34,000 18.2 28.002003 133,753,000 1,937,000 3,068,000 16.3 26.752004 136,734,000 2,981,000 6,057,000 12.8 28.852005 138,906,000 2,172,000 3,920,000 10.6 30.302006 142,437,000 3,531,000 2,973,000 10.3 32.50
SUBURBAN MD OFFICE
Inventory New Absorption Vacancy Class A(SF) Supply (SF) (SF) Rate (%) Rent ($PSF)
1999 61,556,000 1,432,000 2,099,000 8.3 0.002000 63,667,000 2,111,000 3,008,000 6.0 32.002001 66,397,000 2,730,000 -242,000 11.7 31.002002 68,802,000 2,405,000 313,000 15.7 28.502003 70,097,000 1,295,000 -27,000 17.3 26.502004 71,448,000 1,351,000 2,743,000 13.6 26.102005 71,721,000 273,000 1,020,000 9.7 26.332006 72,330,000 609,000 339,000 9.9 27.17
METROPOLITAN INDICATORS – 2007
• Gross Metro Product Percent Change: 2.6
• Total Employment Increase/Decrease: 29,500Percent Change: 1.2
• Unemployment Rate: 3.4
• Population (000): 4,166.3
Source: Moody’s Economy.com
70 CONTACT: Paul Darr • [email protected] l RESEARCH: Margarita Foster • [email protected]
OFFICE
Washington, DC – Northern Virginia• After three years continuous recovery, effects of leveling demand
began to take hold.• Year-over-year net absorption approached 3 million SF, settling at the
low end of the normalized range of 3 to 4 million SF. • Vacancy declined slightly by 3 basis points to 10.3 percent• Total dollar volume for investment sales reached $5.8 billion
compared to $4 billion in 2005. • Leases signed between 5,000 and 50,000 SF brought about net
absorption. Users included law firms, accounting and financialgroups, federal agencies, and government contractors.
Washington, DC – Northern Virginia Office Outlook• Route 28 South and Toll Road markets will likely capture significant
portion of overall net absorption.• Vacancy to rise in outer markets by 20 to 30 basis points as 4 million
SF deliver throughout coming year. • Users seeking large contiguous blocks in excess of 50,000 SF will find
minimal options, forcing consideration of outer markets. • Leasing velocity on downward trajectory and currently limited
number of tenants in market as well as new job growth projections of 33,500 net, indicate 2007 to be moderate.
• Expect continued sales activity in Northern Virginia, though fewerportfolios expected to change hands, indicating sales volume mayhave peaked in 2006.
Washington, DC – Suburban Maryland• In Maryland, dollar volume of office building sales declined from
$2.0 to $1.7 billion as fewer Class A buildings changed hands. • 2006 was a lackluster year as total net absorption reached just
339,000 square feet.• Minimal leasing activity coupled with moves to federal campuses
were largely responsible for the tepid performance. • In a market that is typically measured, eight speculative
groundbreakings totaling 1.1 million SF took place in suburban Maryland.
• Despite anemic leasing activity, few deliveries of new office spacetogether with new building owners produced an increase in rentalrates throughout the market.
Washington, DC – Suburban Maryland Office Outlook• Vacancy will likely rise as available buildings deliver.• The wait for federal leasing is likely to continue in 2007. • While the democratically controlled Congress is more likely to
fund health and biomedical research, it will take some time for appropriations to result in signed leases.
• Organic growth from service providers in accounting, finance, law, and technology will likely generate net absorption of 250,000 to 500,000 SF.

WEST PALM BEACH, FL
DOWNTOWN OFFICE
Inventory New Absorption Vacancy Class A(SF) Supply (SF) (SF) Rate (%) Rent ($PSF)
1999 – – – – –2000 9,445,000 65,000 -176,000 10.4 29.902001 9,953,000 508,000 415,000 14.6 28.402002 9,953,000 0 -26,000 13.3 30.302003 9,993,000 40,000 -37,000 13.8 30.002004 10,011,000 18,000 311,000 10.8 27.802005 10,045,000 34,000 281,000 8.7 30.202006 10,065,000 20,000 638,000 8.9 35.10
SUBURBAN OFFICE
Inventory New Absorption Vacancy Class A(SF) Supply (SF) (SF) Rate (%) Rent ($PSF)
1999 – – – – –2000 27,761,000 835,000 831,000 8.7 27.202001 28,374,000 613,000 -226,000 14.0 28.602002 28,514,000 140,000 -286,000 13.0 27.602003 28,953,000 439,000 421,000 12.7 27.602004 29,206,000 253,000 932,000 10.5 25.802005 29,432,000 226,000 377,000 7.6 24.802006 29,994,000 562,000 641,000 9.1 28.00
INDUSTRIAL
Inventory New Absorption Vacancy Warehouse Land(SF) Supply (SF) (SF) Rate (%) Rent ($PSF) ($PSF)
1999 – – – – – – 2000 45,583,000 773,000 -45,000 6.1 6.50 – 2001 46,303,000 720,000 229,000 6.1 6.80 – 2002 46,662,000 359,000 154,000 6.3 6.40 11.002003 47,676,000 1,014,000 -103,000 8.6 6.70 10.002004 48,399,000 723,000 643,000 6.4 6.70 8.002005 49,145,000 746,000 1,868,000 3.4 7.00 11.002006 49,703,000 558,000 -116,000 4.4 8.44 20.00
METROPOLITAN INDICATORS – 2007
• Gross Metro Product Percent Change: 3.5
• Total Employment Increase/Decrease: 13,800Percent Change: 2.3
• Unemployment Rate: 3.5
• Population (000): 1,332.9
Source: Moody’s Economy.com
C O L L I E R S I N T E R N AT I O N A L l U S R E A L E S TAT E R E V I E W 2 0 0 7
CONTACT: Steve Wasserman • [email protected] l RESEARCH: Jan McLane • [email protected] 71
OFFICE
• New construction totals completed this year, 600k SF.• Rental rates rose approximately $2 per SF over this time last year• The majority of leases in county have been smaller, 5,000 SF
and under.• Median home prices dropped 12% from year ago, and just took first
quarterly plunge in nearly a decade; the housing market is correcting. • The Boca Financial Center, an 86,000 SF Class A office building sold
for $487 per SF.
Office Outlook• 3.4 million SF are under construction, with 733,000 in the CBD.• Rental rates expected to rise due to increasing insurance and other
operating expenses. • Though the vacancy rate is up slightly, the market here still expected
to remain tight• The largest project underway countywide is build-to-suit headquarters
in Boca Raton for Office Depot headquarters. This 624,000 SF development consists of 3 Class A buildings on 28 acres. The firstmajor new luxury office building in CBD in 15 years is the 300,000SF CityPlace Tower, a Class A, 18-story tower built with cat 4/5 hurricane resistant construction. The state of the art features willhelp to add value to building and justify the approximately $35 per SFNNN asking lease rates. This building will help fill need for largeblocks of space in Class A buildings in CBD, which are scarce.
INDUSTRIAL
• Rental rates rose approximately 15% over this time last year.• Developable land is scarce, and costs per square foot are within the
$15-$20 range.• 246,880 SF new product built this year, all the buildings are
40,000 SF and under.• In Boca Raton, the largest sale was the 141,000 SF US Food Service
facilities, which sold for $130 per SF. • The once strong industrial condo market is showing signs of
slowing, and leased projects are again becoming more lucrative for property owners.
Industrial Outlook• 552,000 SF under construction countywide, 252,000 SF in Jupiter, a
14 property project called Jupiter Trade Center.• Vacancy rate currently at 4.2% and will continue to stay low
throughout 2007.• Strength of local economy, along with continuing migration, presents
need for home products, directly affecting industry. • Rental rates will continue rising due to escalating insurance and
operating expenses.• The 365,000 SF Scripps Research Institute proposed for Palm Beach
Gardens will attract additional business growing the area and creatingneed for both industrial and office space.

GLOSSARY
C O L L I E R S I N T E R N AT I O N A L l U S R E A L E S TAT E R E V I E W 2 0 0 7
72
OFFICEInventory – Includes all existing multi or single tenant leased andowner-occupied office properties greater than or equal to 10,000square feet (net rentable area). In some larger markets this minimumsize threshold may vary up to 50,000 square feet. Does not includemedical or government buildings.
Vacancy Rate – Percentage of total inventory physically vacant as atthe survey date including direct vacant and sublease space.
Absorption – Net change in physically occupied space over a givenperiod of time.
New Supply – Includes completed speculative and build-to-suit construction. New supply quoted on a net basis after any demolitions or conversions.
Annual Quoted Rent – Includes all costs associated with occupyinga full floor in the mid-rise portion of a Class A building inclusive oftaxes, insurance, maintenance, janitorial and utilities (electricity surcharges added where applicable). All office rents in this report are quoted on an annual, gross per square foot basis. Rent calculations do not include sublease space.
Cap Rate – (Or going-in cap rate) Capitalization rates in this surveyare based on multi-tenant institutional grade buildings fully leased atmarket rents. Cap rates are calculated by dividing net operatingincome (NOI) by purchase price.
Note: SF = Square FeetPSF = Per Square FootCBD = Central Business District
INDUSTRIALAbsorption – Net change in occupied space over a given period of time.
Bulk Space – 100,000 square feet or more with up to 10 percent officespace, the balance being general warehouse space with 20 to 36 footceiling heights. All loading is dock-height.
Flex Space – Single-story buildings having 10 to 18 foot ceilingswith both floor-height and dock-height loading. Includes wide variation in office space utilization, ranging from retail and personalservice through distribution, light industrial and occasional heavyindustrial use.
Inventory – Includes all existing multi or single tenant leased andowner-occupied industrial warehouse, light manufacturing, flex andR&D properties greater than or equal to 10,000 square feet.
New Construction – Includes completed speculative and build-to-suit construction. New construction quoted on a net basis after any demolitions or conversions.
Service Space – Single story (or mezzanine) with 10 to 16 footceilings with frontage treatment on one side and dock-height loadingor grade level roll-up doors on the other. Less than 15% office.
Tech/R&D – One and two story, 10 to 15 foot ceiling heights withup to 50% office/dry lab space (remainder in wet lab, workshop, storageand other support), with dock-height and floor-height loading.
Triple Net Rent – Includes rent payable to the landlord and doesnot include additional expenses such as taxes, insurance, maintenance,janitorial and utilities. All industrial and high-tech/ R&D rents inthis report are quoted on an annual, triple net per square foot basis in U.S. dollars.
Vacancy Rate – Percentage of total inventory available (both vacantand occupied) as at the survey date including direct vacant andsublease space.
Warehouse – 50,000 square feet or more with up to 15 percent officespace, the balance being general warehouse space with 18 to 30 footceiling heights. All loading is dock-height.
RETAILCommunity Shopping Center – Usually configured as a strip oftenin a straight line or “L” or “U” shape. Anchor tenant is typically adiscount department store (i.e. Wal-Mart, Target), supermarket orsuper drug store. A community center typically offers a wider rangeof apparel and other soft goods than a neighborhood center does.Total gross leasable area is often between 100,000 and 400,000square feet.
Neighborhood Shopping Center – These centers are designed toprovide convenience shopping for the day-to-day needs of consumersin the immediate neighborhood. Anchors are likely to be supermarkets or drugstores. Other tenants might include stores providing sundries, snacks and personal services.Generally, neighborhood centers are 30,000-150,000 SF in size and are configured as strip centers without an enclosed walkway or mall area, but may possibly have a canopy to connect the storefronts.
Power Center – These centers are designed to provide tremendousselection in a particular merchandise category at low prices.Anchors are likely to be category killers, home improvement stores,discount department stores, warehouse clubs or off-price stores.Generally, regional centers are 250,000-600,000 SF in size and areconfigured with several freestanding (unconnected) anchors and a minimal number of small specialty tenants.
Lifestyle Center – Nonanchored open-air specialty center with high concentration of mall type fashion, home, restaurant and entertainment retailers.
Premier Fashion Streetfront – Destination retail corridor in urbancenter typically occupied by fashion retailers and able to commandtop rents.
Rents – All retail rents in this report are quoted on an annual, triplenet per square foot basis.
Note: SF = Square FeetPSF= Per Square Foot

COLLIERS USA OFFICE LOCATIONS
C O L L I E R S I N T E R N AT I O N A L l U S R E A L E S TAT E R E V I E W 2 0 0 7
www.colliers.com 73
ARBentonvilleLittle RockAZPhoenixScottsdaleCABakersfieldCarlsbadFairfieldFresnoGilroyLos AngelesOaklandPalo AltoPleasantonRosevilleSacramentoSan DiegoSan Francisco San JoseSan MateoStocktonWalnut CreekCODenverCTHartfordNew HavenStamfordDCWashingtonDEWilmington
FLBoca RatonClearwaterFt. LauderdaleFt. MyersJacksonvilleMiamiOrlandoTampaWest Palm BeachGAAtlantaHIHonoluluIDBoiseSun ValleyILChicagoINIndianapolisKYLouisvilleMDBaltimoreMIDetroitMNMinneapolisSt. PaulMOKansas CitySt. LouisNCCharlotteRaleigh
NJNew JerseyPrincetonNVLas VegasRenoNYNew YorkOHAkronCincinnatiClevelandColumbusDaytonPepper PikeORPortlandPAAllentownConchohockenPhiladelphiaSCCharlestonColumbiaGreenvilleTNMemphisNashvilleTXDallas/Ft. WorthHoustonWABellevueSeattleTacomaWIMilwaukee
COLLIERS USA OFFICE LOCATIONS
Colliers International is a corporation of leading real estate firms committed todelivering consistently superior commercial real estate services, wherever, andwhenever needed.
• US $1.4 Billion in Revenue • 9,327 Professionals• US $54 Billion in Transaction Volume • 54 Countries• 595 Million SF Under Management • 6 Continents
241 OFFICES WORLDWIDE
130 Americas98 United States18 Canada14 Latin America
65 Europe, Middle East & Africa46 Asia Pacific
54 COUNTRIES ON 6 CONTINENTS
ArgentinaAustraliaAustriaBelgiumBrazilBulgariaCanadaChileChinaColombiaCroatiaCzech RepublicDenmarkEstoniaFinlandFranceGermanyGreeceHong KongHungaryIndiaIndonesiaIrelandIsraelItalyJapanLatvia
LithuaniaMalaysiaMexicoNetherlandsNew ZealandNorwayPeruPhilippinesPolandPortugalRomaniaRussiaSaudi ArabiaSerbia and MontenegroSingaporeSlovak RepublicSouth AfricaSouth KoreaSpain SwedenSwitzerlandTaiwanTurkeyUkraineUnited Arab EmiratesUnited KingdomUnited States
Colliers International 2007Contributor – Robert Sammons,[email protected], Editor – Cara Birrittieri

www.colliers.com