Embed Size (px)
Citation preview
AIP Member Societies: Acoustical Society of America • American Association of Physicists in Medicine • American Association of Physics Teachers • American Astronomical Society • American Crystallographic Association • American Meteorological Society • American Physical Society • AVS Science and Technology of Materials, Interfaces and Processing • The Optical Society • The Society of Rheology
Astronomy Enrollments and Degrees
Results from the 2012 Survey of Astronomy Enrollments and Degrees
Patrick Mulvey and Starr Nicholson
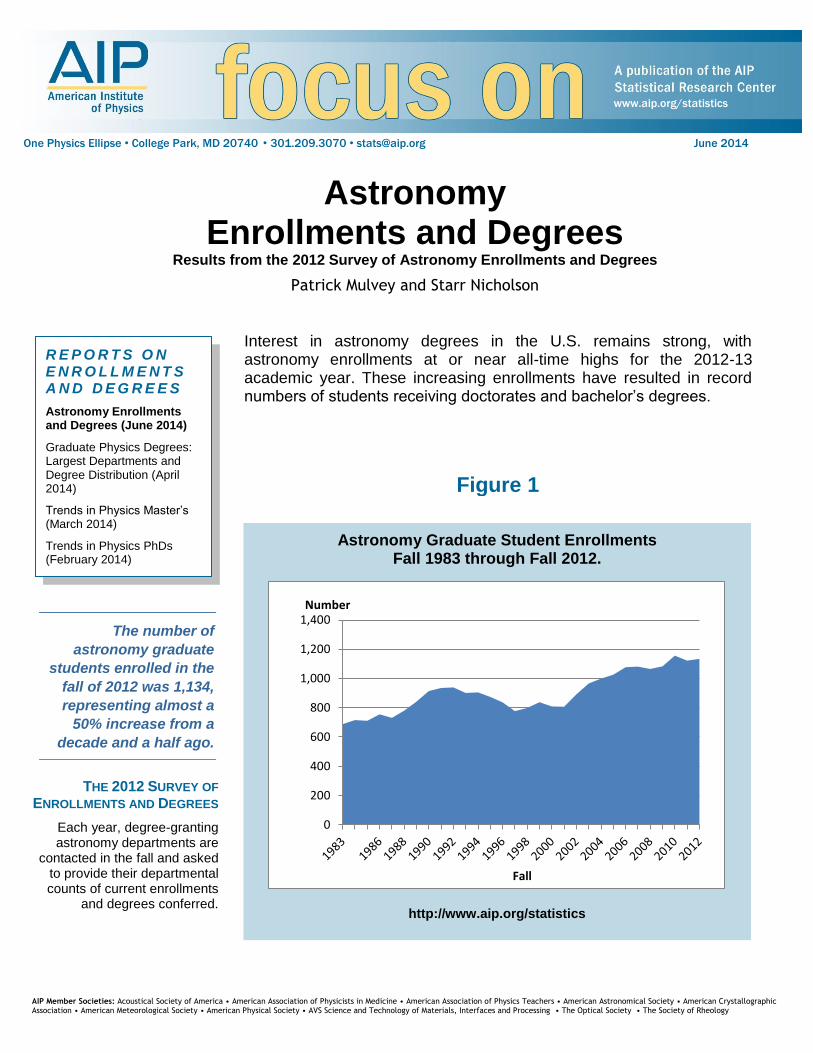
The number of
astronomy graduate
students enrolled in the
fall of 2012 was 1,134,
representing almost a
50% increase from a
decade and a half ago.
Astronomy Graduate Student Enrollments Fall 1983 through Fall 2012.
http://www.aip.org/statistics
0
200
400
600
800
1,000
1,200
1,400Number
Fall
Interest in astronomy degrees in the U.S. remains strong, with astronomy enrollments at or near all-time highs for the 2012-13 academic year. These increasing enrollments have resulted in record numbers of students receiving doctorates and bachelor’s degrees.
R E P O R T S O N E N R O L L M E N T S A N D D E G R E E S
Astronomy Enrollments and Degrees (June 2014)
Graduate Physics Degrees: Largest Departments and Degree Distribution (April 2014)
Trends in Physics Master’s (March 2014)
Trends in Physics PhDs (February 2014)
Figure 1
THE 2012 SURVEY OF
ENROLLMENTS AND DEGREES
Each year, degree-granting astronomy departments are
contacted in the fall and asked to provide their departmental counts of current enrollments
and degrees conferred.
www.aip.org/statistics
One Physics Ellipse • College Park, MD 20740 • 301.209.3070 • [email protected] June 2014

June 2014 AIP Statistical Research Center
Page 2 focus on Astronomy Enrollments and Degrees
Figure 2
The increase in the
number of astronomy
departments offering
the bachelor’s as their
highest astronomy
degree is largely
attributable to existing
physics departments
adding an astronomy
major.
Number of Departments Offering an Astronomy Degree by Highest Astronomy Degree Offered, Classes 1983 through 2012.
1983 87 91 95 99
Class of
0
10
20
30
40
50
0
10
20
30
40
50
03
Doctoral-granting
BS-granting
MS-granting
Number
07 2012
http://www.aip.org/statistics
There were 79 departments in the U.S. awarding astronomy degrees in the 2011-12 academic year. A little more than half (43) of these departments offered master’s and doctorates with the remainder offering the bachelor’s as their highest degree. Half of the degree-granting astronomy departments are part of a combined physics and astronomy department. The other half are stand-alone astronomy departments. Three quarters of the doctoral-granting astronomy departments are stand-alone, compared to 20% of the departments that offer a bachelor’s as their highest degree. Detailed department-level astronomy enrollment and degree data for the class of 2012 can be found in the Astronomy Roster. (1) (1) Nicholson, Starr and Mulvey, Patrick. 2013. focus on Roster of Astronomy Departments with Enrollments and Degree Data, 2012. AIP, College Park, MD.

AIP Statistical Research Center June 2014
focus on Astronomy Enrollments and Degrees Page 3
About three-quarters of
introductory
astronomy course
enrollments were at
physics departments
that did not offer an
astronomy degree.
Introductory Astronomy Course Enrollments by Type of Department, Academic Year 2011-12.
Highest Physics or Astronomy
Degree Offered by Department
Depts. Offering Physics Degrees
Only
Depts. Offering Astronomy Degrees
Bachelor’s 54,000 12,000
Master’s 25,000 2,000
PhD 62,000 40,000
Total 141,000 54,000
Note: It’s estimated that in 2011 an additional 51,000 students took
an introductory astronomy course at a 2-year college. (White, Susan and Chu, Raymond, Physics Enrollments in Two-Year Colleges, April 2013. AIP, College Park, MD)
http://www.aip.org/statistics
Table 1
The total number of students taking an introductory astronomy course at a degree-granting physics or astronomy department is approaching 200,000. Enrollments in introductory astronomy courses have been steadily increasing over the years and are now about 10% higher than what they were a decade earlier.
June 2014 AIP Statistical Research Center
Page 4 focus on Astronomy Enrollments and Degrees
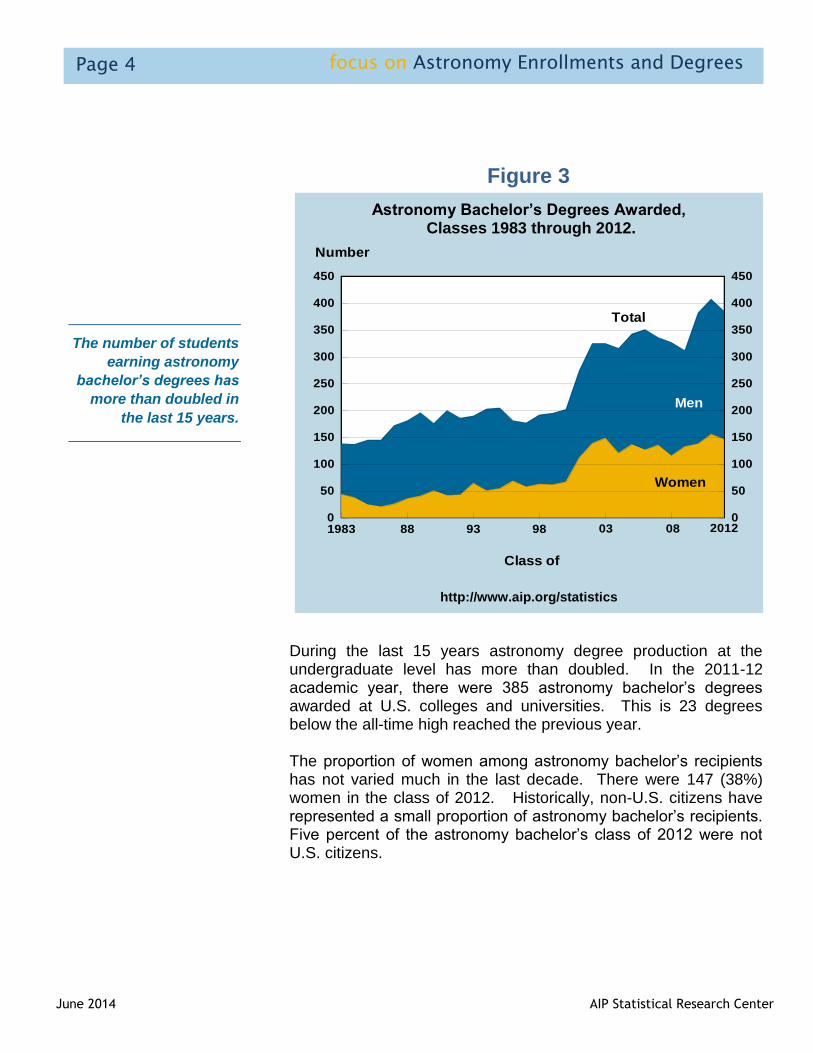
Astronomy Bachelor’s Degrees Awarded, Classes 1983 through 2012.
1983 88 93 98
Class of
0
50
100
150
200
250
300
350
400
450
0
50
100
150
200
250
300
350
400
450
Number
201203
Women
Men
Total
08
http://www.aip.org/statistics
Figure 3
During the last 15 years astronomy degree production at the undergraduate level has more than doubled. In the 2011-12 academic year, there were 385 astronomy bachelor’s degrees awarded at U.S. colleges and universities. This is 23 degrees below the all-time high reached the previous year. The proportion of women among astronomy bachelor’s recipients has not varied much in the last decade. There were 147 (38%) women in the class of 2012. Historically, non-U.S. citizens have represented a small proportion of astronomy bachelor’s recipients. Five percent of the astronomy bachelor’s class of 2012 were not U.S. citizens.
The number of students
earning astronomy
bachelor’s degrees has
more than doubled in
the last 15 years.

AIP Statistical Research Center June 2014
focus on Astronomy Enrollments and Degrees Page 5
Table 2
Bachelor’s-Only Departments Averaging 5 or More Astronomy Bachelor’s Degrees per Year,
Classes 2010, 2011, & 2012 Combined.
Annual Average
Northern Arizona U 15
U of Rochester (NY) 8
Haverford Coll (PA) 5
Mount Holyoke Coll (MA) 5
Williams Coll (MA) 5
Note: List includes only those departments that contributed degree data for all three years.
http://www.aip.org/statistics
PhD-Granting Departments Averaging 7 or More Astronomy Bachelor’s Degrees per Year, Classes 2010, 2011, & 2012 Combined.
Annual Average
Annual Average
U of California, Berkeley 25 U of Mass, Amherst 10
U of Colorado, Boulder 22 U of Michigan, Ann Arbor 10
U of Washington 21 Pennsylvania State U 9
Michigan State U 15 Ohio State U 8
Florida Inst. of Technology 14 U of Minnesota, Minneapolis 8
U of Maryland, College Park 13 U of Pittsburgh (PA) 8
U of Texas, Austin 13 Columbia U (NY) 7
U of California, Los Angeles 11 U of Florida 7
U of Wisconsin, Madison 11 U of Illinois, Urbana 7
Boston U (MA) 10 U of Virginia 7
U of Arizona 10
Note: List includes only those departments that contributed degree data for all three years. Nine of the 40 PhD-granting astronomy departments
do not offer an astronomy bachelor’s degree.
http://www.aip.org/statistics
Of the 35 departments
where the bachelor’s
was the highest
astronomy degree
offered, only 5
departments averaged
5 or more bachelor’s a
year.
Table 3
The 21 departments
listed in Table 3 were
responsible for
producing 63% of all
the astronomy
bachelor’s in the
combined classes of
2010, 2011 and 2012.

June 2014 AIP Statistical Research Center
Page 6 focus on Astronomy Enrollments and Degrees
First-year graduate
astronomy student
enrollments are at an
all-time high with 233
students entering
graduate programs in
the fall of 2012.
First-Year Graduate Astronomy Student Enrollments by Citizenship, Fall 1983 through Fall 2012.
http://www.aip.org/statistics
0
50
100
150
200
250
0
50
100
150
200
250
1983 88 92 96 00 04 08 2012
Number
Fall
First-Year Graduate Astronomy Student Enrollments by Gender, Fall 1983 through Fall 2012.
http://www.aip.org/statistics
0
50
100
150
200
250
0
50
100
150
200
250
1983 88 92 94 00 04 08 2012
Number
Fall
Figure 4
Total
Men
Women
Figure 5
Total
US Citizens
Foreign Citizens
The representation of
women among first-
year astronomy
graduate students was
37% in the fall of 2012.
The number of non-
U.S. citizens enrolling
in graduate astronomy
programs has
remained fairly
consistent for the last
15 years with an
average of about 50
non-U.S students
enrolling each year.

AIP Statistical Research Center June 2014
focus on Astronomy Enrollments and Degrees Page 7
Astronomy Master’s Degrees Awarded,
Classes 1983 through 2012.
1983 87 92 97
Class of
0
50
100
150
0
50
100
150
Exiting
Number
02 2012
En route
07
Note: Exiting astronomy master’s are individuals who upon receiving their degrees leave their current departments. They include graduates from departments where the master’s is the highest degree offered as well as master’s leaving departments that offer a doctorate. Master’s en route degrees can only be earned at departments where a doctorate is offered.
http://www.aip.org/statistics
Exiting astronomy master’s are individuals who upon receiving their degrees leave their current departments. Relatively few students each year receive an exiting astronomy master’s degree. The classes of 2010, 2011, and 2012 combined had an average of 35 exiting master’s degrees. There were 43 departments that offered graduate degrees in astronomy in the 2011-12 academic year. Three of these departments offered the master’s as their highest astronomy degree and were responsible for producing about one-fifth of the exiting astronomy master’s degrees in recent years. Forty of these departments also offered a PhD and produced four-fifths of the exiting master’s degrees. Similar to changes in first year-student enrollments, changes in the number of students receiving en route degrees is an indicator of how many students may be receiving doctorates in 3 to 5 years. Not all graduate students pursuing an astronomy doctorate earn a master’s en route. We estimate that 75% or fewer astronomy PhDs earn a master’s en route.
Figure 6
Of the students who
earn astronomy
doctorates, 75% or
fewer have been
awarded a master’s
degree en route.

June 2014 AIP Statistical Research Center
Page 8 focus on Astronomy Enrollments and Degrees
Figure 7
Astronomy PhDs Awarded by Gender, Classes 1983 through 2012.
1983 87 92 97 2012
Class of
0
20
40
60
80
100
120
140
160
180
0
20
40
60
80
100
120
140
160
180
02
Number
Women
Men
Total
07
http://www.aip.org/statistics
The 40 doctoral-
granting astronomy
departments averaged
3.8 PhDs in the class of
2012.
The 40 doctoral-granting astronomy departments in the U.S. awarded 152 astronomy PhDs in the class of 2012. After a sharp increase in astronomy doctoral production seen in the classes of 2005 through 2007, recent years have seen the number of doctorates conferred level off at around 155 degrees. Looking back at first-year astronomy student enrolments 2-6 years earlier and at an average of the en route master’s recently awarded, it is predicted that astronomy doctorate production will remain near their current levels for the next few years. There were 48 women among the astronomy PhDs in the class of 2012, 3 times as many as were conferred 2 decades earlier.

AIP Statistical Research Center June 2014
focus on Astronomy Enrollments and Degrees Page 9
The proportion of U.S. citizens among astronomy doctorates has remained at around 70% in recent years. U.S. citizens represent a greater proportion of astronomy doctorates than they do among physics doctorates recipients, where the U.S. citizens averaged 51% in the classes of 2010, 2011, and 2012.(2) The number of astronomy doctorates conferred in Figure 8 includes only departments that expressly offer a doctorate in astronomy. In addition, many of the PhD recipients from the 195 physics departments that award doctorates have subfield specialties of astrophysics. We estimate that these physics departments averaged 166 PhDs a year in astrophysics in the classes of 2010 and 2011(2).
U.S. citizens comprised
65% of the 152
astronomy doctorates
conferred in the class
of 2012.
Astronomy PhDs Awarded by Citizenship,
Classes 1983 through 2012.
http://www.aip.org/statistics
0
20
40
60
80
100
120
140
160
180
0
20
40
60
80
100
120
140
160
180
1983 87 92 96 00 04 08 2012
Number
Class of
Figure 8
Total
US Citizens
Non-U.S. Citizens
(2) Mulvey, Patrick and Nicholson, Starr. 2014. focus on Trends in Physics PhDs, AIP, College Park, MD.

June 2014 AIP Statistical Research Center
Page 10 focus on Astronomy Enrollments and Degrees
The 14 departments
listed in Table 4 were
responsible for
awarding over half of
the astronomy
doctorates in the
combined classes of
2010, 2011 and 2012.
Astronomy Departments Averaging 5 or More Astronomy PhDs per Year, Classes of 2010, 2011, & 2012 Combined.
Annual Average
Annual Average
Harvard U (MA) 10 U of Texas, Austin 6
Boston U (MA) 7 U of Washington 6
U of Virginia 7 U of California, Berkeley 5
Johns Hopkins U 6 U of Arizona 5
U of Colorado, Boulder 6 U of California, Santa Cruz 5
U of Florida 6 U of Maryland, College Park 5
U of Illinois, Urbana 6 U of Wisconsin, Madison 5
Note: List includes only those departments that contributed degree data for all three years.
http://www.aip.org/statistics
Table 4

AIP Statistical Research Center June 2014
focus on Astronomy Enrollments and Degrees Page 11
The past 25 years has
seen more than a
tripling in the
proportion of
astronomy doctorates
earned by women.
Percent of Bachelor’s Degrees and Doctorate’s in Astronomy
Earned by Women, Classes 1983 through 2012.
1983 87 92 970
5
10
15
20
25
30
35
40
45
50
0
5
10
15
20
25
30
35
40
45
50
Bachelor's
PhDs
07
Class of
2012
Percent
02
http://www.aip.org/statistics
Figure 9
After steadily rising from the mid-1980’s until the early 2000’s, the proportion of astronomy bachelor’s awarded to women has remained relatively unchanged for almost a decade. The representation of women among astronomy bachelor’s is almost twice that of physics bachelor’s, where in recent years, women have represented about 20% of the degree recipients. Women earned 32% of the astronomy doctorates in the class of 2012, a decline from a recent high of 40% two years earlier. Over the longer term, the proportion of astronomy doctorates earned by women has been steadily increasing. The past two and a half decades has seen more than a tripling in the proportion of astronomy doctorates earned by women.
Similar to astronomy undergraduates, women represent a larger proportion of astronomy doctorates than they do among physics doctorates where they comprised 20% of the class of 2012.(3)
(3) Mulvey, Patrick and Nicholson, Starr. 2014. focus on Trends in Physics PhDs, AIP, College Park, MD.

June 2014 AIP Statistical Research Center
Page 12 focus on Astronomy Enrollments and Degrees
Appendix 2. Trends in Astronomy Enrollments and Degrees, Academic Years 2002-2013.
Number of Astronomy Degrees Granted Undergraduate Astronomy
Major Enrollments Graduate Astronomy Student Enrollments
Academic Year
Bachelor’s
Exiting* Master’s
PhDs
Juniors
Seniors
1st Year
Total
2002-2003 325 22 88 385 576 201 892
2003-2004 316 27 116 441 540 218 966
2004-2005 343 27 91 437 584 212 999
2005-2006 351 30 119 511 565 188 1,026
2006-2007 336 18 125 379 569 206 1,077
2007-2008 327 36 161 364 536 193 1,081
2008-2009 322 29 141 388 515 215 1,065
2009-2010 382 23 156 382 605 193 1,083
2010-2011 408 47 160 450 637 202 1,156
2011-2012 385 35 152 487 666 224 1,122
2012-2013 484 694 233 1,134
*Exiting master’s are students who left their current departments with master’s degrees.
http://www.aip.org/statistics
Appendix 1. Number of Astronomy Degrees Granted by Highest Astronomy Degree Offered by Department, Academic Year 2011-12.
Degree Awarded
Highest Astronomy Degree Offered by
The Department
Bachelor’s Exiting* Master’s PhDs
Number of Departments
PhD-granting 278 28 152 40
Master’s-granting 19 7 3
Bachelor’s-granting 88 36
Total 385 35 152 79
*Exiting master’s are students who left their current departments with master’s degrees.
Note: Nine of the 40 PhD-granting astronomy departments do not offer a bachelor’s degree.
http://www.aip.org/statistics

AIP Statistical Research Center June 2014
focus on Astronomy Enrollments and Degrees Page 13
About the Survey Each fall the Statistical Research Center conducts its Survey of Enrollments and Degrees. The survey is sent to all degree-granting physics and astronomy departments in the U.S. and Puerto Rico to provide information concerning the number of students they currently have enrolled and the number of degrees they conferred in the previous academic year. We define the academic year as being from September to August. In the 2011-12 academic year 79 departments offered degrees in astronomy. We received responses from all but 7 (89%) of these departments. Estimates were derived and included in the totals for non-responding departments. Astronomy departments consist of stand-alone degree-granting departments (n=39) and departments that are administered along with a physics program (n=40). Data from this survey are also used to produce the “Roster of Astronomy Departments,” which provides a department-level enrollment and degree snapshot. The Roster covering the astronomy class of 2012 can be found at: http://www.aip.org/statistics/reports/roster-astronomy-departments-enrollment-and-degree-data-2012 These reports are possible because of the efforts of department chairs, faculty, and staff in providing their departmental data to the AIP year after year. We thank them for their ongoing support of this survey series.
e-Updates You can sign up to receive e-mail alerts which notify you when we post a new report. Visit http://www.aip.org/statistics/e_updates.html to sign up. You can indicate your area(s) of interest; we will send you an e-Update only when we post a new report that includes data of interest to you. If you sign up for every possible notification, you should receive no more than 20 messages in a year.
Career Resources The American Institutes of Physics has a Career Resources page (http://www.aip.org/career-resources) that centralizes an array of careers-related information for members of the physical science community. Content includes career advice, the latest science and engineering job opportunities, employment statistics, fellowship information, and science education and career path recommendations. Also featured are links to AIP Member Society Career Resources, which address the needs of specific scientists in greater detail.


