Embed Size (px)
Citation preview

1
College or Unit Level Annual Assessment Report Template and Guidelines
College or Unit Name: College of Technology Report Year: 2015-16 Submitted by: Mary L. Brake, Interim Associate Dean Submitted on (date): June, 2016 1. Description of Council/Committee.
The College committee is currently made up of (Interim) Associate Dean (AD) (Mary Brake) and the Director of the School of Engineering Technology and Interim Director of the School of Information Security & Applied Computing (Bob Lahidji) and the Interim Director of the School of Visual and Built Environments and the School of Technology & Professional Services Management, (Deb deLaski-Smith). The Directors work with program coordinators on assessment reports and then submit them to the AD, who recommends changes when necessary. Because some faculty are actively involved in accreditation, they understand assessment well, whereas other faculty are still learning and the AD is working with those faculty to help them improve their assessment.
2. Assessment Goals: In addition to the primary goal of assessing student learning, list other
2015-16 unit goals that support assessment of student learning (note whether these are direct (DA), indirect (IA) or operational (OA)).
Ensure overall student success Enable full time faculty to own and take charge of courses in their programs Improve quality and financial health of current programs, (OA) this year and (IA)
next year. Propose and advance quality programs Develop and execute a student recruitment campaign (OA) this year and (IA) in
future years. Support the EMU Foundation (OA) Advance research portfolio of faculty and COT, (OA) Improve infrastructure, (OA)
3. Summary of Accomplishments:
Improve Student Success o All programs assessed at least one student learning outcome (DA). o The COT advising office put together curriculum maps for all majors, based upon
the university course catalog (OA). The analysis of the road pointed to areas of improvement. For example, embedded prerequisites that are not listed in the program of study need to be formally added to the programs, via the input

2
system. Some programs are evaluating their many technical electives, which make it difficult for students to graduate in 4 years.
o Analysis of course roll outs to improve the graduation rates of students (OA). Several programs were analyzed. This process is on-going.
o Assess the number and offerings of sections to ensure that students will be able to take classes in sequential order with the goal of graduating in a timely manner. (OA this year and IA next year)
o Initiated contacts with key companies that will help bring internship and employment opportunities for current and graduating students
Enable full time faculty to own and take charge of courses in their programs. o Dean’s office helped programs with an analysis of section offerings. Section
offerings were optimized to offer adequate numbers of popular courses and to cancel inefficient sections and to improve the plan of offering these sections so that students can plan on courses that will have a large enough enrollment to be offered. (OA)
o Overall SCH of winter 2016 was up compared to SCH of winter 2015. Assessment for Fall 2016 SCH shows 9% increase when compared with same time last year.
o The programs are in the process of putting together consistent course roll outs and advertising these roll outs to students when they come in for advising and putting the roll outs on the program website in an effort to educate students so they can plan their education and graduate in a timely manner. Assessment of these measures will occur next year.
o Extra sections of popular classes were added to the winter session and low enrollment classes were cancelled. These low enrollment classes are still under assessment to determine the optimal semester for them to be offered. Extra sections of popular classes were added to the fall semester before registration to offer students as many course offerings as possible.
Improve quality and financial health of current programs to improve student
learning. o The course offerings taught by tenure track faculty versus part-time lecturers
were analyzed. Based upon this analysis two tenure track faculty lines were requested from the Provost, along with six full time lecturer positions.
o Assessment of quality and financial health of programs on student learning will occur next year.
o Was recognized to have been the only college that met its budget for 15-16.
Propose and advance quality programs. o A mechanical engineering program proposal and the course proposals were
written and submitted to the input process for approval. (OA) o A program on information technology and accompanying course proposals were
written and submitted through the curricular process. o Supported accreditation efforts of IDE, SAG, and the engineering technology
programs.
Student Recruitment o Visited several local high schools.

3
o Initiated a ‘student ‘ambassador’ recruitment and retention program. COT undergraduate students were recruited this summer and training will start this summer and fall. They will interact with prospective EMU students at events like Explore Eastern and in the future will be involved in retention events.
Support EMU Foundation and its efforts to support student learning.
o Hired Vince Cavataio, Director of Annual Giving now has an office in Sill Hall. Worked with Foundation to host events for alumni (MET, IDE, Aviation and Construction). The Construction golf outings was particularly successful.
o Hosted events to introduce potential industrial partners (Hyundai, Tenneco, Henkel, BASF, Gentex, and others) to our programs. We are working to provide more interaction between our students and industry via alumni and other industrial partners. This will be assessed next year.
Advance research portfolio of faculty to ensure students are taught up-to-date
material and to provide students with research opportunities. o Hired five new faculty members (1 Product Design and Development, 1
Engineering Management, 2 Information Assurance and a permanent director for the School of Visual and Built Environment), with proven research track records were hired and every effort is being made to help them to continue their research at EMU, (with research labs, software etc).
o Encouraged faculty to work on research with all students. Several students participated in the undergraduate research fair and others students participated in the graduate research fair.
o Supported faculty Research – 2 new faculty received new faculty research awards, 7 were awarded a Faculty Research/Creative Activity Fellowship, and 4 were awarded a Sabbatical.
Infrastructure Improvements to provide best learning environment possible.
o Harley Ellis Deveraux (HED) was awarded the bid to analyze the facilities currently used by the College of Technology, starting at the end of May, 2016. They will come up with a set of projects from small to large to help improve the infrastructure of COT, assess use of buildings that will advance the goals of the College, and put together specific plans for renovations for submission to the State of Michigan and for internal funding.
o Upgrades to classroom technology were made to Roosevelt in late summer, 2015 and will occur in Sill Hall in summer, 2017.
Direct Assessment
o All programs participated in assessment of student learning outcomes. Their reports are attached. All programs identified student learning outcomes, which is a huge increase from just two years ago. All programs performed assessment, typically direct assessment, but in some cases indirect assessment where a program issue needed to be assessed.
4. Examples:
The Polymers and Coatings did a particularly thorough job of assessing one of their student learning outcomes. Their program has six student learning outcomes (SLO) and faculty chose one of their SLOs to assess this year, in an appropriate course. The faculty picked five

4
detailed indicators to assess the SLO “students will be able to compare various coating technologies and evaluate their usefulness and limitations.” Faculty used a quiz, a midterm, group assignments, and a research paper to determine the level of achieving of the indicators they defined. They found that their SLO was largely achieve, except on one indicator. They plan on bringing in guest speakers in the future to improve students’ understanding of the regulations and performance needs of customers of UV-cure coatings. An example of assessment that indirectly influences student learning is Engineering Management. In this case the faculty in Engineering Management examined the program of study that they would like students to follow and modeled the course roll out so that a students can be successful in finishing the program. This analysis led to 9 program change objectives, which they will work on in the near future. Aviation Flight Technology and Management Programs assessed “knowledge of contemporary issues” in their senior seminar course by analyzing the weekly grades of a writing assignment. They found that the results showed a polar distribution, with students doing quite well or very poorly, but most did well. They found that it wasn’t that the students did not understand the SLO but the students did poorly on the method of the assessment, i.e. missed or were late in their blog assignments, or the quality of research or writing of the blog assignments was poor. They state, “A clear demonstration of knowledge in contemporary issues in the aviation industry was represented in almost all cases when blog assignments were completed.” Their continuous improvement includes identifying and addressing possible logistical issues that prevent the student from completing the assignment. Improvements include increasing the clarity of due dates and requirement in the syllabus as well as discussing the format of the blog writing.
5. Closing the Loop.
Most of the closing the loop plans of each program include altering course material. The Paralegal Studies program plans to change their assessment by requiring a pre- and post-assessment in courses that are prerequisite courses to the senior level course that was assessed this year. Some programs gave vague plans of action, such as the program will come up with additional assessment or different assessment. Programs will be encourage to turn in their report earlier next year (well before the end of the winter semester) so that they can receive help on ‘closing the loop’. Closing the Loup or a Plan of Action has been difficult for many faculty to grasp, but each year more and more programs have come up with meaningful plans that are based upon the results of their assessment.
6. Next Year’s Goals.
In addition to the goals listed under item 2 that are on-going, faculty will be encourage to perform their assessment by January so that they can receive feedback in the winter semester and if necessary, re-do their assessment. Also, programs will be asked to comment on the results of their ‘plans of action’ that they list in this year’s report.

5
7. Program Annual Assessment Report Template
Program Name:
Report Year: 2015-2016
Submitted on (date):
Program Student Learning Outcome Or Program Learning Objective Assessed:
Method of Assessment:
Assessment Findings:
Plan of Action: (plan on improvement to program)

6
Appendix A: Individual Reports for the College of Technology page School of Engineering Technology
Computer Aided Engineering ....................................................................................................7
Computer Engineering Technology ...........................................................................................8
Electronics Engineering Technology ...................................................................................... 10
Engineering Management ........................................................................................................12
Mechanical Engineering Technology .....................................................................................17
Product Design and Development ...........................................................................................19
Polymers and Coatings ............................................................................................................21
Quality Management ................................................................................................................25
School of Information Security and Applied Computing
Information Assurance .............................................................................................................28
School of Visual and Built Environment
Apparels, Textiles, and Merchandising ...................................................................................31
Communication Technology ....................................................................................................34
Construction Management .......................................................................................................35
Interior Design .........................................................................................................................36
Simulation, Animation and Gaming ........................................................................................40
School of Technology and Professional Services Management
Aviation Flight Technology and Management ........................................................................42
BMMT .....................................................................................................................................44
Hotel and Restaurant Management ..........................................................................................45
Paralegal ...................................................................................................................................47
Technology Management.........................................................................................................48
Technology Studies ..................................................................................................................51
Military Science ......................................................................................................................52

7
Program Annual Assessment Report
Program Name: Master of Science in Computer Aided Engineering
Report Year: 2015-2016
Submitted on (date): April 20, 2016
Program Student Learning Outcome Assessed:
1. Student will be able to implement CAD/CAM/CAE technology in a wide range of engineering
organizations.
2. Student will be able to find feasible solutions through systematic consideration and iteration of
creation, integration, and functional testing of products.
3. Student will be able to utilize CAE techniques to identify and reduce sources of problems for
the purpose of improving product and its quality.
4. Student will be able to apply the principles of mold design for a variety of plastics mold
processes and utilize processing equipment to create plastic materials for testing.
5. Student will be able to use the computer in planning manufacturing operations, solving
manufacturing and related problems, and controlling manufacturing processes for batch and
continuous production.
6. Student will be able to make public presentations and demonstration of the product.
SLO Assessed this academic year (list the student learning outcome(s) that was were assessed
this year:
Student will be able to utilize CAE techniques to identify and reduce sources of problems for
the purpose of improving product and its quality.
Method of Assessment:
Students' ability to perform FEA analysis using commercial software provided (Fall 2015
CAE 575 – 12 units with homework assignments)
Assessment Findings:
Among those 12 homework assignments, students had the lower performance in Units 7 and
11. Unit 7 includes I-Beam selection to meet a design specification. Unit 11 emphases on
FEA mesh convergence test.
Plan of Action:
1. More lectures should be focused on beam analysis including bending moment, bending
stresses and failure criteria.
2. More discussion and exercises should be given in FEA mesh convergence test, including
H-method and P-method.
8
Program Annual Assessment Report
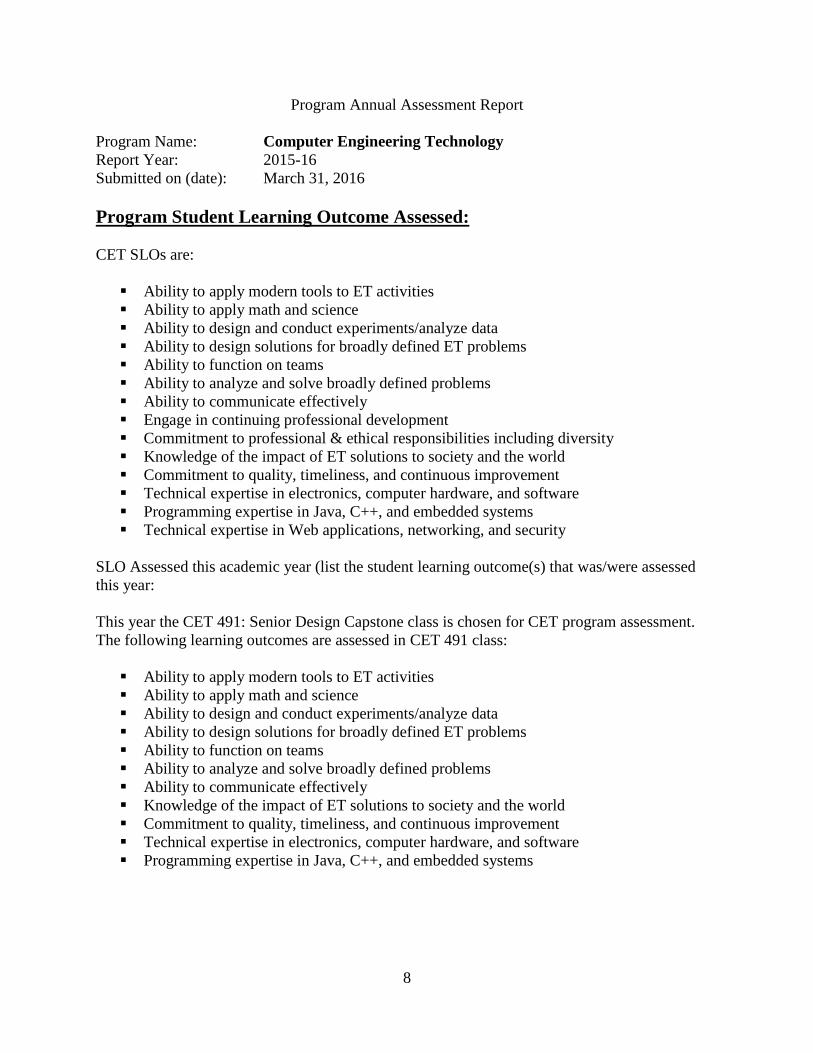
Program Name: Computer Engineering Technology
Report Year: 2015-16
Submitted on (date): March 31, 2016
Program Student Learning Outcome Assessed:
CET SLOs are:
Ability to apply modern tools to ET activities
Ability to apply math and science
Ability to design and conduct experiments/analyze data
Ability to design solutions for broadly defined ET problems
Ability to function on teams
Ability to analyze and solve broadly defined problems
Ability to communicate effectively
Engage in continuing professional development
Commitment to professional & ethical responsibilities including diversity
Knowledge of the impact of ET solutions to society and the world
Commitment to quality, timeliness, and continuous improvement
Technical expertise in electronics, computer hardware, and software
Programming expertise in Java, C++, and embedded systems
Technical expertise in Web applications, networking, and security
SLO Assessed this academic year (list the student learning outcome(s) that was/were assessed
this year:
This year the CET 491: Senior Design Capstone class is chosen for CET program assessment.
The following learning outcomes are assessed in CET 491 class:
Ability to apply modern tools to ET activities
Ability to apply math and science
Ability to design and conduct experiments/analyze data
Ability to design solutions for broadly defined ET problems
Ability to function on teams
Ability to analyze and solve broadly defined problems
Ability to communicate effectively
Knowledge of the impact of ET solutions to society and the world
Commitment to quality, timeliness, and continuous improvement
Technical expertise in electronics, computer hardware, and software
Programming expertise in Java, C++, and embedded systems

9
Method of Assessment:
Students were formed in four groups. Two groups had 4 students each. Two students chose to
work on their own unique project. Each team was responsible for design, making, writing control
programs and analyzing their projects. Each project involves (1) brainstorming project ideas, (2)
evaluating project ideas for meeting the project criteria and feasibility, (3) presenting and
defending the selected project idea, (4) designing the project, (5) developing and writing control
programs (6) making the physical systems, (7) testing the project, (8) preparing final project
report, (9) conducting live demonstration to the class, and (10) presenting the project to the class.
Four capstone projects are: (1) Lighting and Audio Monitoring APP program, (2) Drone and
Unmanned Roller, (3) Building Security System Using Drone, and (4) Gesture Sensing Control
system.
Project Evaluation Rubrics: Evaluating the
1. formation of project ideas
2. evaluation of project ideas
3. choose and define the capstone project
4. scheduling and monitoring the progress of capstone project
5. design and analysis of the capstone project
6. implementation (including project layouts, coding, manufacturing, etc.) of the project
7. presenting weekly reviews and reports
8. mid-term project progress evaluation
9. testing and debugging the project
10. final project demo
11. final project presentation
12. final report
Assessment Findings:
Each capstone project was assessed based on the eleven learning outcomes. Each team has
successfully completed their project including building physical systems and computer control
programs. All eleven learning outcomes have been met in each team project.
Plan of Action:
Decisions:
CET 491 course has successfully met the specified SLOs. This course was offered for the
first time in winter semester 2016. It is suggested that this course be offered once a year.
Improvements:
CET students have been equipped with a wide variety of skills in programming,
electronics, control, and Web applications when they take this capstone course. We would
consider working with local industries to involve students working in their ongoing projects. Or
local industries can provide projects for our students to design, develop and make.

10
Program Annual Assessment Report
Program Name: Electronics Engineering Technology
Report Year: 2015-16
Submitted on (date): April 6, 2016
Program Student Learning Outcome Assessed:
Program Student Learning Outcomes: (based on ABET’s outcomes)
(a) an ability to select and apply the knowledge, techniques, skills, and modern tools of their
disciplines to broadly-defined engineering technology activities;
(b) an ability to select and apply a knowledge of mathematics, science, engineering, and
technology to engineering technology problems that require the application of principles and
applied procedures or methodologies;
(c) an ability to conduct standard tests and measurements; to conduct, analyze, and
experimental results to improve processes;,
(d) an ability to design systems, components, or processes for broadly-defined engineering
technology problems appropriate to program educational objectives;
(e) an ability to function effectively as a member or leader on a technical team;
(f) an ability to identify, analyze, and solve broadly-defined engineering technology problems;
(g) an ability to apply written, oral, and graphical communication in both technical and non-
technical environments; and an ability to identify and use appropriate technical literature;
(h) an understanding of the need for and an ability to engage in self-directed continuing
professional development;
(i) an understanding of and a commitment to address professional and ethical responsibilities,
including a respect for diversity;
(j) a knowledge of the impact of engineering technology solutions in a societal and global
context;
(k) a commitment to quality, timeliness, and continuous improvement;
SLO assessed this academic year - an ability to design systems, components, or processes for
broadly-defined engineering technology problems appropriate to program educational objectives;
Specifically, the SLO assessed was the ability to design an op-amp circuit that combines both

11
inverting and non-inverting inputs using an exam question from ELEC 300 Analog Circuit
Analysis I.
Method of Assessment:
Rubric of a question asked on exam in ELEC 300 Analog Circuit Analysis I
Assessment Findings:
Most students were able to design an op-amp circuit that combines both inverting and non-
inverting inputs. We will try to improve the student performance next year but increasing the
amount of practice via extra homework problems and then we will assess again.
ELEC 300 Analog Circuit Analysis I – Design an op-amp circuit that will produce the output
voltage
3210 20VVVV
Fall 2015 - Exam I
Conclusions:
Eight of the student population scored 4 points or higher. One outlier received a zero which
pulled the average down to 3.8 points. Most students performed well overall. An average score
of 4.5 or better is our target goal.
Plan of Action:
Next year, students will be given extra homework using this method to try to improve the
performance of this SLO.
Fall
2015
Design
(6)
Names
1 4
2 4
3 6
4 4
5 6
6 3
7 6
8 4
9 6
10 0
11 2
12 2
13 2
Average 3.8

12
Program Annual Assessment Report
Program Name: Engineering Management
Report Year: 2015-16
Submitted on (date): March 31, 2016 Plan Submission
Submitted on (date): March 31, 2016 Proposal Submission
Program Student Learning Outcomes: Plan of Study (POS) development and student completion
according to schedule.
EM Program Assessment: EM Program – Course Scheduling
Data: Prior to the 2015/2016, classes have been scheduled and dropped due to low enrollment.
The minimum course enrollment levels have been increased to 12 to 15 students – limits vary
according to course. We have added additional electives, Engineering Management Analysis
and Business Process Reengineering, which increases the likelihood of low enrollment unless the
number of enrolled students increases or the scheduled class plan is well communicated and fits
with student Plan of Studies.
Problem: A predetermined sequence of classes is not available for our students to develop their
Plan of Study (POS) with a high degree of confidence that the courses will actually be offered
when needed for them to complete their POS.
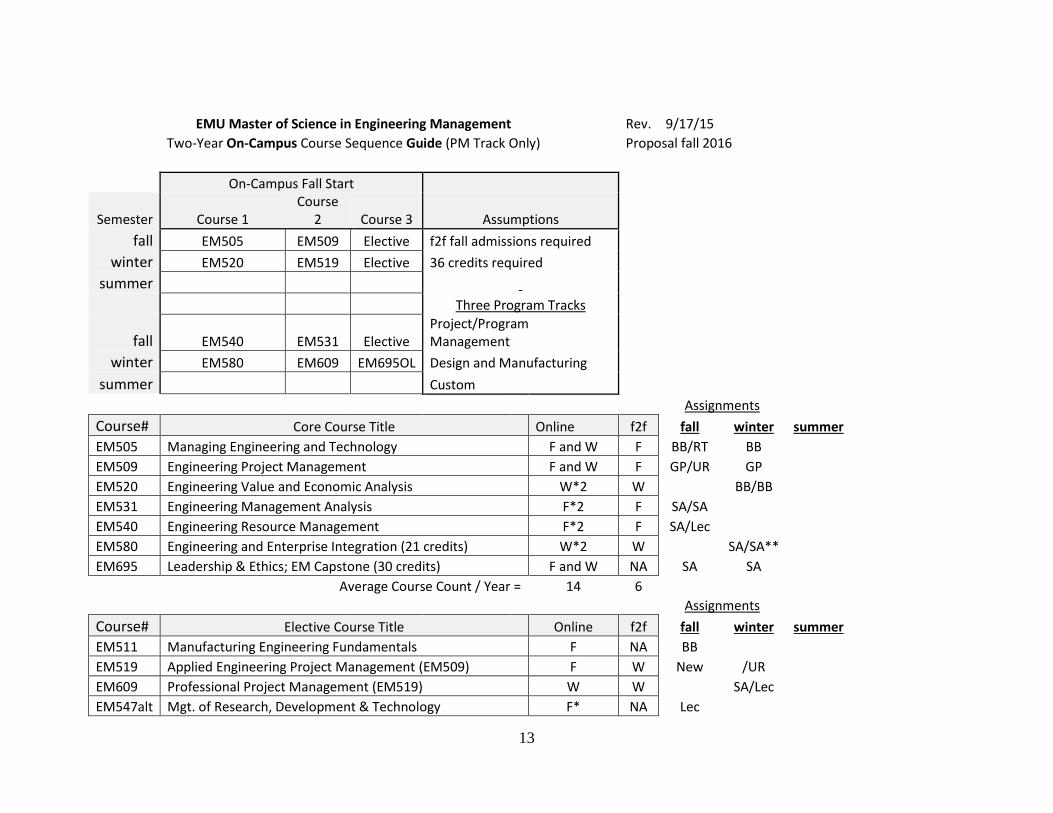
Approach to Solving the Problem: A model was developed to estimate the course SCH load
based on the forecasted number of face-to-face students, online students, starting semester, and
EM track selection. A course offering sequence and program change proposal was developed.
Both of these documents are appended to this assessment.
Assessment Findings:
Solution: The Engineering Management Program is completing a search process to add an
additional faculty member. Once the position is filled, we will complete a course sequence guide,
similar to the offering below, with an enrollment SCH forecast that will support the plan. The
following interim documents document the current status of the ongoing assessment.
13
EMU Master of Science in Engineering Management Rev. 9/17/15 Two-Year On-Campus Course Sequence Guide (PM Track Only) Proposal fall 2016
On-Campus Fall Start
Semester Course 1 Course
2 Course 3 Assumptions fall EM505 EM509 Elective f2f fall admissions required
winter EM520 EM519 Elective 36 credits required summer
Three Program Tracks
fall EM540 EM531 Elective Project/Program Management
winter EM580 EM609 EM695OL Design and Manufacturing summer Custom
Assignments Course# Core Course Title Online f2f fall winter summer
EM505 Managing Engineering and Technology F and W F BB/RT BB EM509 Engineering Project Management F and W F GP/UR GP EM520 Engineering Value and Economic Analysis W*2 W
BB/BB
EM531 Engineering Management Analysis F*2 F SA/SA EM540 Engineering Resource Management F*2 F SA/Lec EM580 Engineering and Enterprise Integration (21 credits) W*2 W
SA/SA**
EM695 Leadership & Ethics; EM Capstone (30 credits) F and W NA SA SA
Average Course Count / Year = 14 6
Assignments Course# Elective Course Title Online f2f fall winter summer
EM511 Manufacturing Engineering Fundamentals F NA BB EM519 Applied Engineering Project Management (EM509) F W New /UR
EM609 Professional Project Management (EM519) W W
SA/Lec EM547alt Mgt. of Research, Development & Technology F* NA Lec

14
EM558 Lean Production F NA BB EM570 Patents and Engineering Law W NA
CK**
EM659 Advanced Lean Systems (EM558) S**
SA**
EM669 Lean Leadership Standards and Integration (EM659) S*
BB*
EM620 Integrated Product/Process Design (EM509&649/659) W* NA
New EM649 Manufacturing Process Planning F** NA GV
EM630 High Tech Engineering Innovation W** NA
New Business Process Engineering W and S NA
SA SA
EM681 Special Topics Any Any
Average Course Count / Year = 10 2 * Offered odd years
** Offered even years Special Topic Examples: NA: Not Available
Environmental Engineering & Policy
PROPOSED CHANGES Core Class Changes
Add EM531 Engineering Management Analysis OL F2F Drop EM570 Patents and Engineering Law
Elective Changes Alt. Class EM547 Mgt. of Research, Development & Technology
Drop EM636 Analysis of Manufacturing Processes OL F2F Drop EM670 Design for Manufacture & Assembly (EM511 or 636) OL F2F Add EM570 Patents and Engineering Law OL
Add EM630 High Tech Engineering Innovation OL Add Business Process Engineering OL Net change: Was 22 OL & 11 f2f/yr. Now: 24 OL & 8 f2f/yr.
Was 39 credits to graduate Now: 36 Credits to graduate Note: 30% online have curriculum deficiencies

15
Program Change Objectives: 1. Enable face-to-face and online students to graduate within two years
2. Increase SCH/Class ratio 3. Reduce likelihood of class cancelation due to low enrollment
4. Enable long-term POS planning & Instructor assignment
5. Decrease student program cost 6. Enable electives to be offered in summer sessions
7. Adds Engineering Management Analysis to Core Requirements
8. Add 18 credit certificate option - Successful completion admits to EM.
9. f2f students only accepted in the fall semester
All Engineering Management Student Core Courses & Certificate
3 EM505 Managing Engineering and Technology 3 EM509 Engineering Project Management 3 EM520 Engineering Value and Economic Analysis 3 EM531 Engineering Management Analysis 3 EM540 Engineering Resource Management 3 EM580 Engineering and Enterprise Integration (21 credits) 3 EM695 Leadership & Ethics; EM Capstone (30 credits) 21 Core Class Credits
(18 Credits for Certificate)
Project/Program Management 3 EM519 Applied Engineering Project Management (EM509)
3 EM609 Professional Project Management (EM519) 3 New Business Process Engineering 6 Two additional electives
Design and Manufacturing 3 EM558 Lean Production
3
EM620 or 630
Integrated Product or Process Design
High Tech Engineering Innovation 3
EM649 or EM 659
Manufacturing Process Planning
Advanced Lean Manufacturing
3 Elective EM511Fundamentals of Manufacturing
3 Elective

16
Engineering Management Course SCH Load Forecasting Model:
Student Coding System
Sem
ester Year Type Track
Cycle
Time
fall
or
win
ter
1=odd
2= even
1=online
2=f2f
1=PMgt
2=DMfg
3=Custom
2=2yrs
4=4yrs
6=6yrs
505 509 520 531 540 580 695 519 609 BPM 511 558 620 630 649 659 669 547 570 Student
Type
Code
f o O P 2 f505oO f509oO w520oO f531eO f540eO w580eO w695eO 1 1 1 0.5 0.5 0.5 0.3 foOP2
f e O P 2 f505eO f509eO w520eO f531oO f540oO w580oO w695oO 1 1 1 0.5 0.5 0.5 0.3 feOP2
f o F P 2 f505oF f509oF w520oF f531eF f540eF w580eF w695eF 1 1 1 0.5 0.5 0.5 0.3 foFP2
f e F P 2 f505eF f509eF w520eF f531oF f540oF w580oF w695oF 1 1 1 0.5 0.5 0.5 0.3 feFP2
f o O D 2 f505oO f509oO w520oO f531eO f540eO w580eO w695eO 0.3 0.4 1 0.5 0.5 0.6 0.4 0.3 0.1 0.2 foOD2
f e O D 2 f505eO f509eO w520eO f531oO f540oO w580oO w695oO 0.3 0.4 1 0.5 0.5 0.6 0.4 0.3 0.1 0.2 feOD2
f o O C 2 f505oO f509oO w520oO f531eO f540eO w580eO w695eO 0.4 0.3 0.5 0.4 0.4 0.3 0.2 0.3 0.2 foOC2
f e O C 2 f505eO f509eO w520eO f531oO f540oO w580oO w695oO 0.4 0.3 0.5 0.4 0.4 0.3 0.2 0.3 0.2 feOC2
f o F C 2 f505oF f509oF w520oF f531eF f540eF w580eF w695eF 0.4 0.3 0.5 0.4 0.4 0.3 0.2 0.3 0.2 foFC2
f e F C 2 f505eF f509eF w520eF f531oF f540oF w580oF w695oF 0.4 0.3 0.5 0.4 0.4 0.3 0.2 0.3 0.2 feFC2
f o O P 4 f505oO f509oO w520eO f531eO f540oO w580oO f695oO 1 1 1 0.5 0.5 0.5 0.3 foOP4
f e O P 4 f505eO f509eO w520oO f531oO f540eO w580eO f695eO 1 1 1 0.5 0.5 0.5 0.3 feOP4
f o F P 4 f505oF f509oF w520eF f531eF f540oF w580oF f695oF 1 1 1 0.5 0.5 0.5 0.3 foFP4
f e F P 4 f505eF f509eF w520oF f531oF f540eF w580eF f695eF 1 1 1 0.5 0.5 0.5 0.3 feFP4
f o O D 4 f505oO f509oO w520eO f531eO f540oO w580oO f695oO 0.3 0.4 1 0.5 0.5 0.6 0.4 0.3 0.1 0.2 foOD4
f e O D 4 f505eO f509eO w520oO f531oO f540eO w580eO f695eO 0.3 0.4 1 0.5 0.5 0.6 0.4 0.3 0.1 0.2 feOD4
f o O C 4 f505oO f509oO w520eO f531eO f540oO w580oO f695oO 0.4 0.3 0.5 0.4 0.4 0.3 0.2 0.3 0.2 foOC4
f e O C 4 f505eO f509eO w520oO f531oO f540eO w580eO f695eO 0.4 0.3 0.5 0.4 0.4 0.3 0.2 0.3 0.2 feOC4
f o F C 4 f505oF f509oF w520eF f531eF f540oF w580oF f695oF 0.4 0.3 0.5 0.4 0.4 0.3 0.2 0.3 0.2 foFC4
f e F C 4 f505eF f509eF w520oF f531oF f540eF w580eF f695eF 0.4 0.3 0.5 0.4 0.4 0.3 0.2 0.3 0.2 feFC4
f o O P 6 f505oO w509oO w520eO f531eO f540oO w580oO f695oO 1 1 1 0.5 0.5 0.5 0.3 foOP6
f e O P 6 f505eO w509eO w520oO f531oO f540eO w580eO f695eO 1 1 1 0.5 0.5 0.5 0.3 feOP6
f o O D 6 f505oO w509oO w520eO f531eO f540oO w580oO f695oO 0.3 0.4 1 0.5 0.5 0.6 0.4 0.3 0.1 0.2 foOD6
f e O D 6 f505eO w509eO w520oO f531oO f540eO w580eO f695eO 0.3 0.4 1 0.5 0.5 0.6 0.4 0.3 0.1 0.2 feOD6
f o O C 6 f505oO w509oO w520eO f531eO f540oO w580oO f695oO 0.4 0.3 0.5 0.4 0.4 0.3 0.2 0.3 0.2 foOC6
f e O C 6 f505eO w509eO w520oO f531oO f540eO w580eO f695eO 0.4 0.3 0.5 0.4 0.4 0.3 0.2 0.3 0.2 feOC6
w o O P 2 w505oO w509oO w520eO f531eO w540eOw580eO w695eO 1 1 1 0.5 0.5 0.5 0.3 woOP2
w e O P 2 w505eO w509eO w520oO f531oO w540oOw580oO w695oO 1 1 1 0.5 0.5 0.5 0.3 weOP2
w o O D 2 w505oO w509oO w520eO f531eO w540eOw580eO w695eO 0.3 0.4 1 0.5 0.5 0.6 0.4 0.3 0.1 0.2 woOD2
w e O D 2 w505eO w509eO w520oO f531oO w540oOw580oO w695oO 0.3 0.4 1 0.5 0.5 0.6 0.4 0.3 0.1 0.2 weOD2
w o O C 2 w505oO w509oO w520eO f531eO w540eOw580eO w695eO 0.4 0.3 0.5 0.4 0.4 0.3 0.2 0.3 0.2 woOC2
w e O C 2 w505eO w509eO w520oO f531oO w540oOw580oO w695oO 0.4 0.3 0.5 0.4 0.4 0.3 0.2 0.3 0.2 weOC2
w o O P 4 w505oO w509oO w520eO f531eO w540oOw580oO w695oO 1 1 1 0.5 0.5 0.5 0.3 woOP4
w e O P 4 w505eO w509eO w520oO f531oO w540eOw580eO w695eO 1 1 1 0.5 0.5 0.5 0.3 weOP4
w o O D 4 w505oO w509oO w520eO f531eO w540oOw580oO w695oO 0.3 0.4 1 0.5 0.5 0.6 0.4 0.3 0.1 0.2 woOD4
w e O D 4 w505eO w509eO w520oO f531oO w540eOw580eO w695eO 0.3 0.4 1 0.5 0.5 0.6 0.4 0.3 0.1 0.2 weOD4
w o O C 4 w505oO w509oO w520eO f531eO w540oOw580oO w695oO 0.4 0.3 0.5 0.4 0.4 0.3 0.2 0.3 0.2 woOC4
w e O C 4 w505eO w509eO w520oO f531oO w540eOw580eO w695eO 0.4 0.3 0.5 0.4 0.4 0.3 0.2 0.3 0.2 weOC4
w o O P 6 w505oO f509oO w520eO f531eO f540oO w580oO w695oO 1 1 1 0.5 0.5 0.5 0.3 woOP6
w e O P 6 w505eO f509eO w520oO f531oO f540eO w580eO w695eO 1 1 1 0.5 0.5 0.5 0.3 weOP6
w o O D 6 w505oO f509oO w520eO f531eO f540oO w580oO w695oO 0.3 0.4 1 0.5 0.5 0.6 0.4 0.3 0.1 0.2 woOD6
w e O D 6 w505eO f509eO w520oO f531oO f540eO w580eO w695eO 0.3 0.4 1 0.5 0.5 0.6 0.4 0.3 0.1 0.2 weOD6
w o O C 6 w505oO f509oO w520eO f531eO f540oO w580oO w695oO 0.4 0.3 0.5 0.4 0.4 0.3 0.2 0.3 0.2 woOC6
w e O C 6 w505eO f509eO w520O f531oO f540eO w580eO w695eO 0.4 0.3 0.5 0.4 0.4 0.3 0.2 0.3 0.2 weOC6
General
Engineering Management Electives
Routing
EM Core Courses
PM Track Design & Manufacturing Track
17
Program Annual Assessment Report
Program Name: Mechanical Engineering Technology
Report Year: 2015-2016
Submitted on (date): April 27, 2016
Program Student Learning Outcome Assessed:
l) Technical expertise encompassing the area of materials (including strength of materials),
applied mechanics, statics and dynamics, thermal/fluid system design/analysis, conventional or
alternative energy system design/analysis, and power generation.
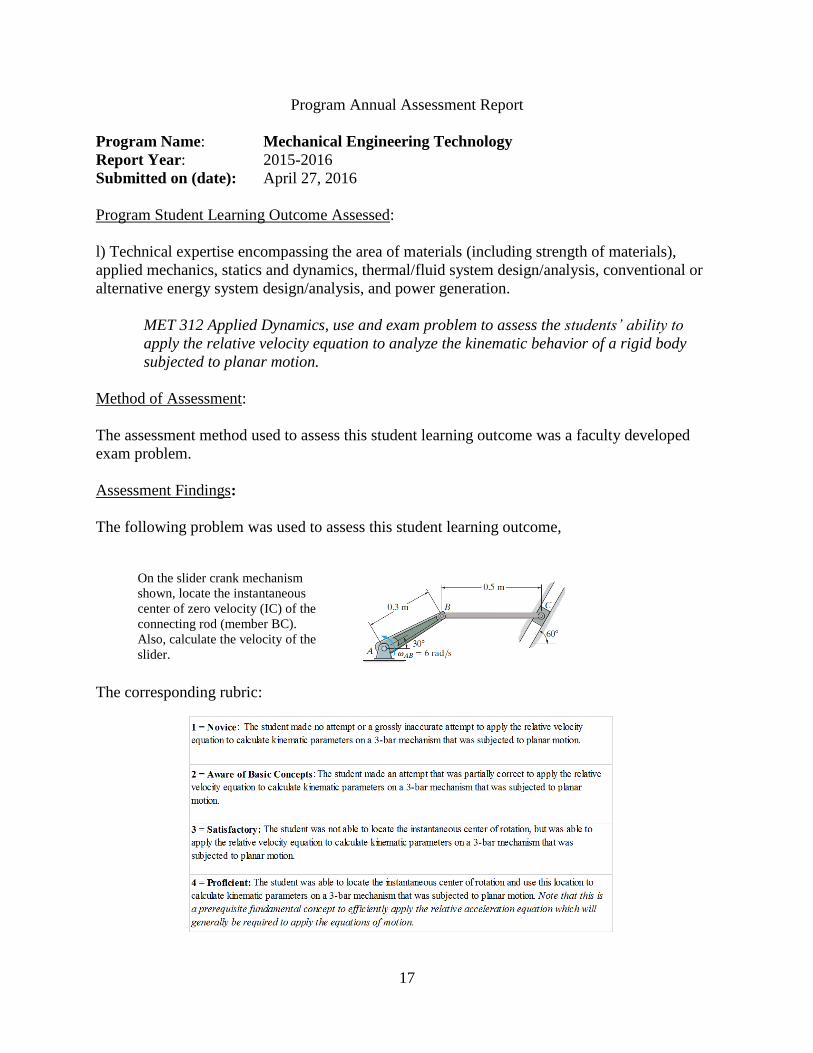
MET 312 Applied Dynamics, use and exam problem to assess the students’ ability to
apply the relative velocity equation to analyze the kinematic behavior of a rigid body
subjected to planar motion.
Method of Assessment:
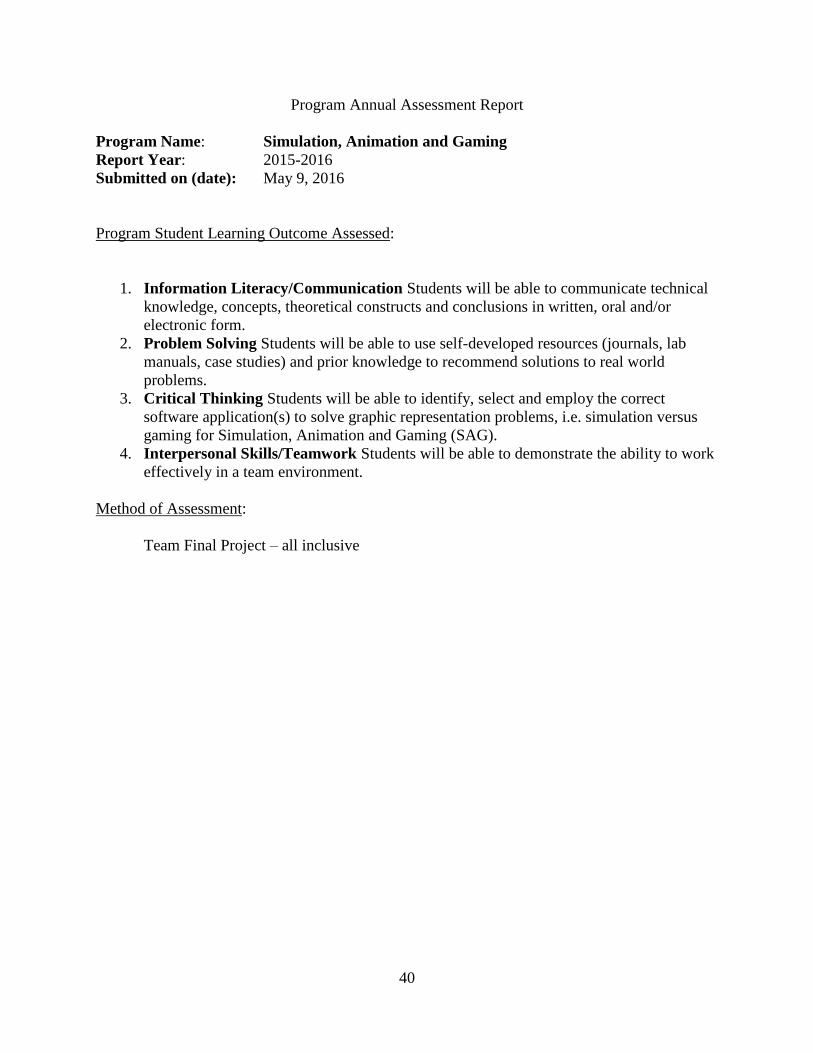
The assessment method used to assess this student learning outcome was a faculty developed
exam problem.
Assessment Findings:
The following problem was used to assess this student learning outcome,
The corresponding rubric:
On the slider crank mechanism
shown, locate the instantaneous
center of zero velocity (IC) of the
connecting rod (member BC).
Also, calculate the velocity of the
slider.
Note that member BC is horizontal
at the instant shown.

18
The results of this assessment were
Since more than 70% of the students that were evaluated earned a rating of Satisfactory or above,
no corrective action is required.
Plan of Action:
Continue to review and demonstrate the application of vector multiplication theory prior to
delivering the lecture on planar rigid body kinematic analysis.
Student A 3
Student B 3 Student C 3 Student D 4 Student E 4 Student F 4 Student G 2 Student H 2 Student I 4 Student J 3 Student K 3 Student L 4 Student M 2 Student N 1 Student O 3
Novice 0.07 7%
Aware of basic concepts 0.20 20%
Satisfactory 0.40 40%
Proficient 0.33 33%

19
Program Annual Assessment Report
Program Name: Product Design and Development
Report Year: 2015-2016
Submitted on (date): April 22, 2016
Program Student Learning Outcome Assessed:
Work effectively both individually and in teams.
Method of Assessment:
In PDD 156 Teamwork in Product Design, students are placed in teams of 4-5 to work on a
project. They have regularly scheduled, in-class, meetings.
All members of each team complete a meeting evaluation form (attached) at the end of each team
meeting. Forms are reviewed with them each week and all of them are collected when they
submit their project.
Assessment Findings:
The acceptable level of achievement is a 4 or higher with the exception of Pace. Pace should be
2, 3 or 4.
85% of the students achieved an acceptable level or higher.
Conclusion: Students are using teamwork tools covered in class to work effectively in teams.
Plan of Action:
No action required.

20
Meeting Evaluation Form Team #________ Date_____________
1. Our meeting today was: Rambling 2 3 4 Focused
2. The pace was: Too slow 2 3 4 Too fast
3. Everyone got a chance to participate: No 2 3 4 Yes
4. Our purpose was: Confused 2 3 4 Clear
5. We made good progress: No 2 3 4 Yes
6. We followed our ground rules: No 2 3 4 Yes
7. Agenda was distributed in time: No 2 3 4 Yes
8. Agenda was useful: No 2 3 4 Yes
9. Reviewed minutes from last time: No 2 3 4 Yes
10. Minutes from last meeting were complete: No 2 3 4 Yes
11. My input/ideas were fully considered: No 2 3 4 Yes
Comments:

21
Program Annual Assessment Report
Program Name: M.S. Program in Polymers and Coatings
Report Year: 2015-2016
Submitted on (date): April 18, 2016
Program Student Learning Outcome Assessed:
1. Will develop polymers and coating products and be knowledgeable in broad aspects of
polymers, coatings and raw materials and their applications in industries.
2. Will be able to design experiments for preparation, evaluation and applications of coatings for
specified end uses.
3. Will be able to select raw materials, design and formulate coatings for specified end uses.
4. Will be able to compare various coating technologies and evaluate their usefulness and
limitations
5. Will be able to apply concepts of interdisciplinary areas (chemistry, physics, material science,
patents and patenting etc.) to the problems of polymers and coatings.
6. Will demonstrate their ability to design and undertake independent study or research project to
satisfactory completion.
SLO Assessed this academic year:
Will be able to compare various coating technologies and evaluate their usefulness and
limitations
Method of Assessment:
The method used for assessment is outlined below.
For the selected SLO 4 appropriate course, PC-540 (UV-cure coatings) was identified.
For PC-540, in keeping with the SLO selected, five indicators have been identified that can fully
address the selected SLO. A list of SLO selected is shown below.
During the semester, student evaluation was conducted based on these five indicators. For
example, Assignment-I was mainly focusing on Indicator-I. In quiz, mid-terms tests were
designed to substantially evaluate indicators I and II. Test questions were so included that they
address, where possible, all five indicators. Two “group assignments” (problem solving theme)
were given that were targeted to evaluate indicator II and IV. All students were required to
research and write a term paper on a topic assigned. This assignment would assess indicators –
III, IV, and V. Class room discussions were also used to assess one or all indicators.

22
The data so collected (see attached table) were analyzed to identify how they met the SLO.
Overall rating was then calculated to determine how well the PC-540 met the selected SLO. We
also identified the areas of concern or of interests for continuous improvement.
Course evaluated: PC-540 UV-cure coatings
For this course we will evaluate students learning based on the following indicators.
Indicator-I: Have adequate knowledge of commonly used contemporary coatings
technologies such as – water-borne, High-solids, powder-coatings and
solvent-based coatings.
Indicator-II Able to relate various coating technologies with their applications (Why
certain technologies are more suitable for specific applications?
Indicator-III Able to understand purpose and significance of UV-cure coatings in light
of current regulations and performance needs of the end users (customers).
Indicator-IV Demonstrate understanding of UV-cure coating formulations and problem
solving of technical issues in UV-cure coatings / inks industries.
Indicator-V Be able to compare coating technologies within UV-cure coatings and their
suitability for a given application and performance.

23
Course No. PC-540 UV-Cure Coatings
SLO Will be able to compare various coating technologies and evaluate their
usefulness and limitations
Indicators Not Poorly Average Above Fully
achived acieved achived average acieved
achivedScale < 25 25 - 55 55 -75 75- 90 >90
Indicator-I: 0 0 0 45 55
Indicator-II 10 10 20 30 30
Indicator-III 0 0 40 25 35
Indicator-IV 0 0 10 0 90
Indicator-V 0 0 5 60 35
Total 10 10 75 160 245
Mean 2 2 15 32 49
Indicator-I: Have adequate knowledge of commonly used contemporary coatings technologies such
as – water-borne, High-solids, powder-coatings and solvent-based coatings
Indicator-II Able to relate various coating technologies with their applications
(Why certain technologies are more suitable for specific applications?
Indicator-III Able to understand purpose and significance of UV-cure coatings in light of current
regulations and performance needs of the end users (customers).
Indicator-IV Demonstrate understanding of UV-cure coating formulations and problem solving of
technical issues in UV-cure coatings / inks industries.
Indicator-V Be able to compare coating technologies within UV-cure coatings and their suitability .
for a given application and performance
% of Students showing achievement of this SLO
Findings:
1. The selected SLO (4) largely achieved > 80%.
2. There is much scope to further improve the achievement of this SLO for PC-540.

24
Changes recommended for instructions:
1. Some students were not able to effectively relate various coatings technologies to their
applications. Perhaps, this topic area can be incorporated in the first unit or add pre-
requisite of PC-502/503 where these are included. This will be done by introducing some
additional topics in PC 540 in the first unit and perhaps consider adding a pre-requisite.
2. In light of lower achievement of indicator –III, recommendations to include topics related
to extant regulations related to coatings as well as emerging applications and performance
requirements of this rapidly growing coating technology. It is recommended that we
bring in expert guest speakers from industry or government organization to the class to
share such information. Closer tie up with RadTech organization (Industry organization
for radiation curing industry) is recommended to facilitate this aspect.

25
Program Annual Assessment Report
Program Name: Master of Science in Quality Management
Report Year: 2015-2016
Submitted on (date): April 6, 2016
Program Student Learning Outcome Assessed:
Students will be able to select and utilize appropriate quality tools and procedures to
solve or prevent problems and improve quality. (QUAL 548 – Tools for Continuous
Improvement)
Method of Assessment:
Review of course content by Quality Management faculty.
Assessment Findings:
1. Course content was too narrowly focused on statistics.
2. The course shell lacked student learning outcome objectives.
3. As a result of these two items, approximately 1/3 of students were either failing or
dropping out of the course and QM program.
Plan of Action:
1. The course was totally redesigned.
2. Content was revised to include a variety of quality tools and procedures to solve or
prevent problems and improve quality.
3. A new text, “Besterfield, Quality Improvement”, 9th ed. 2013, was adopted.
4. The course Canvas shell was rewritten to include outcome based learning objectives for
each unit, supplemental instruction, and more exercises. An example of unit learning
objectives is provided below.
5. Weekly discussion was added to more closely working with the students.
6. Course application project was added to guide students applying what they learned.
New course content with the new Canvas shell is reflected below as it was successfully delivered
Fall 15. As a result, there was only one student who did not complete the course due to work
conflicts. The course passing rate was 93.8% (15/16) and average grade was 87.5. The course
was rated 77.8% “much above average” and “above average” combined, anonymously by the
students at the end of course.
An example from new course shell:
Unit 1 (Chapter 1 Introduction to Quality Improvement) Objectives
Upon completion of this unit, students will be able to:
1. Describe why quality is somewhat of an intangible.
2. Define quality, according to the American Society for Quality.

26
3. Define quality, according to ISO 9000.
4. Describe quality control and its purpose.
5. Describe quality improvement and its purpose.
6. Describe statistical quality control.
7. Describe quality assurance and its purpose.
8. Describe a process and its purpose.
9. Describe internal and external customers.
10. Describe internal and external suppliers.
11. Describe Failure Mode and Effect Analysis (FMEA) and what it combines.
12. List the things that FMEA is intended do.
13. Describe the two types of FMEA.
14. Describe Quality Function Deployment (QFD) and what it is intended to lead to.
15. List the questions that QFD answers.
16. Describe what QFD reduces.
17. Describe the ISO 9000.
18. List the three standards that the ISO 9000 series consists of and their contents.
19. Describe the ISO 14000 standard.
20. Describe what benchmarking searches for what and what it is intended to lead to.
21. Describe what Total Productive Maintenance (TPM) is with regard to the workforce and
what it is intended to obtain.
22. List the technical skills used in Total Productive Maintenance.
23. Describe quality by design, who uses it, and for what purpose.
24. Describe what quality by design is also known as.
25. List the major benefits of quality by design.
26. Describe how product liability is related to quality.
Course revised contents and schedule:

27
Contents Text Chapter Exercise Discussion Project Exam
1 9/8 9/14 Syllabus, Student Intro 1 Introduction to Quality Improvement 17 4 17
2 9/15 9/21 Quality Principles and Practices 2 Lean Enterprise & 3 Six Sigma 20 4 24
3 9/22 9/28 Quality Tools 4 Statistical Process Control 16 5 9
4 9/29 10/5 Statistics 5 Fundamentals of Statistics 20 4 22
5 10/6 10/12 Variable Control Charts 24 4
6 10/13 10/19 Chart Interpretation & Process Capability 23 4
7 10/20 10/26 Midterm Exam 100
8 10/27 11/2 Attribute Control Charts 9 – Control Charts for Attributes 26 4 Proposal/30 31
9 11/3 11/9 Specialized Control Charts and Gage Capability7 – Additional SPC Techniques for
Variables18 4 11
10 11/10 11/16 Reliability 11 Reliability 14 4 8
11 11/17 11/23 Management Planning & Tools 12 Management and Planning Tools 20 4 11
12 11/24 12/3 Experimental Design 13 Experimental Design 15 4 Report/70 24
13 12/4 12/10 Taguchi’s Quality 14 Taguchi’s Quality Engineering 10 4 15
14 12/11 12/17 Final Exam 100
Note: Assignments due at 11:59 pm EST on the due date Subtotal (points) 223 49 100 200
Weeks 12 thru 14 schedule adjusted due to Thanksgiving break Contribution to course grade 35% 5% 10% 50%
QUAL 548 Tools for Continuous Improvement - Fall '15
On-line, 9/8/2015 to 12/18/2015
Assignments
6 Control Charts for Variables 28
Week/
Unit
Start
Date
SubjectDue
Date

28
Program Annual Assessment Report
Program Name: Information Assurance
Report Year: 2015-2016
Submitted on (date): 4/6/2016
Descriptor/Scope of Assessment at EMU: IA 213 – Privacy and Technology
Program Student Learning Outcome Assessed:
Students in Information Assurance program will be able to recognize, analyze, and manage
privacy challenges created by technology. Both business and self-regulatory efforts will be
reviewed.
Method of Assessment:
Where Assessed: IA213- Privacy and Technology – One class offered online in fall 2015 and
one class offered online in winter 2015 during the 2015-2016 academic year. The IA213 was
selected as the course to measure students understanding of effect of technology on information
security, privacy in personal, professional, and business level, and the privacy issue in national
security. The course objective was upon completion of the course students will: understand what
privacy is and why it is important in the 21st century, learn how technology is compromising
privacy, be introduced to key legislation effecting personal privacy, learn the different in legal
protections between public and private privacy, understand the special privacy issues in the
workplace, analyze the privacy compromises needed for national security as well as that required
by the Patriot Act.
How Assessed: Different direct assessment methods such as group projects, exams, discussions,
analytical paper, etc. with different weight of value were used to assess students learning
outcome in this class. Group projects involving teamwork assessed not only students’
understanding of the subject matter but also their soft skill. Each of these assessment methods
aimed to evaluate students’ ability to recognize, analyze, and manage privacy challenges created
by emerging technology.
Class Discussions 20%
Exams 40%
Project Assignments 30%
Final Paper 10%
Total 100%

29
Assessment Findings:
IA213 Online class (Fall 2015): Number of Students: 29
Students Achieved
Recognize Analyze Manage
> 80% 86% 86% 86%
<80% 7% 7% 7%
Did not Attempt 7% 7% 7%
Outcome Benchmark: 80% of the students achieve at least an 80% satisfactory on the
assessment. The overall outcome in IA213 online class in fall 2015 shows that 86% of the
students were able to demonstrate competency with 80% accuracy to recognize, analyze, and
manage privacy challenges created by emerging technology.
In online discussion board students participated in discussion on different current topics related
to effect of technology on privacy and information security. Students were required to actively
participate in discussion and provide feedback on at least two other students’ discussions.
Students’ participation in to the discussion topic as well as respond to posts by their peers
required to be in the area of 150 words and to be substantial adding value with new ideas or
thoughts that engaged other students to respond.
In the group project assignments students developed privacy and information security threat
assessment based on evaluation of different emerging technology. In first project students review
the report Guidelines on Security and Privacy in Public Cloud Computing published by National
Institute of Standard and Technology (NIST). Students prepared an elaborate analytical report
explaining:
Deployment Models of Cloud Technology - the perspective of all four deployment
models of Cloud Technology.
Service Models of Cloud Technology - pros and cons of all three service models of
Cloud Technology from technology perspective.
Privacy and Security in Public Cloud Technology – advantages and disadvantages of
placing data in the Public Cloud Technology from privacy and security perspective.
In second project students reviewed the report titled Big Data: Seizing Opportunities, Preserving
Values that was prepared by the executive office of president of the United States. In this group
project students’ review was based on their understanding of Big Data and Privacy Law in
United States. Especially how Big Data is affecting people’s privacy and values, The Obama
Administration's Approach to Open Data and Privacy, U.S. Privacy Law and International
Privacy Frameworks, etc.

30
In the final paper students individually prepared report on the effect of emerging digital
technologies on privacy addressing following questions: explain how Mobile Technology and
Social Media influencing privacy, describe the type of security issues involve in using those
technologies and how to protect information from those security threats, the impact of Internet of
Things on privacy in light of its positive and negative perspective. Finally, students wrote about
what they have learned in this class that they did not know before.
Plan of Action:
This is an introductory level required course for students in undergraduate Information
Assurance program. Most of the students in this course were in freshman level. Students’ basic
knowledge on essential Information Security topics such as privacy, technology, and the effect of
technology on privacy in personal, professional, and business level, which in turn an issue in
national security, were assessed using different direct assessment methods. The course materials
were prioritized and condensed in this online class.
The assessment target for Information Assurance program is that 80% of the students should be
able to demonstrate competency with 80% accuracy. Overall, the 86% students’ grades fall
within the 80% -100% categories. That is, 86% of the students were able to demonstrate
competency with 80% accuracy to recognize, analyze, and manage privacy challenges created by
emerging technology. Since over 80% of the students have met the SLO that was assessed, the
conclusion would be to keep the course same. Also keep the online class of IA213 in same
format.
However, there is always room for improvement that may allow the 14% students who did not
achieve the goal of 80% learning outcome goal can be benefitted. An on-campus face-to-face
section of the IA213 can be offered as research shows that not all students excel in online
method of class delivery.

31
Program Annual Assessment Report
Program Name: Apparel, Textiles & Merchandising (ATM)
Report Year: 2015-2016
Submitted on (date): May 1, 2016
Program faculty decided to conduct assessment using the following Student Learning Outcome
(SLO):
Ability to solve technical problems using knowledge acquired in courses through critical
thinking.
Since ATM is a multi-disciplinary program several courses representing the different sections of
the program were selected to conduct SLO measurement in the assessment process. These
courses are listed below:
Undergraduate
ATM 212/312 Textile science courses that include Fiber, Yarn, Fabric, Color Finishing.
ATM 302 CAD/CAM Manufacturing Technique
ATM 200 Aesthetics and Design for Apparel Industry
Graduate
ATM 644 Recent Development in Textiles (Smart Textiles)
ATM 592 CAD/CAD for Textile Manufacturing
SLO- ATM 212/313: Textile Science courses are designed to provide comprehensive
understanding of the textile value chain Where Textile Science I covers fiber yarn formation,
manufacturing/ construction, design, basic properties relating to various kinds of fabrics. In
Textile Science II fabric design, construction and manufacturing are taught along with the
ultimate use of these fabric for different textile products. Color of the fabric has great effects on
the aesthetics of the fabric, particularly for apparel applications and this is a most value added
process in the fabric manufacturing. Therefore, students are taught color science, spectroscopic
universal standard color measurement methods, color (dye) chemistry etc.
Two measurements were made to determine how the students are capturing these concepts in
textile science classes. In Textile Science I: fiber identification ability and yarn construction
capabilities were assessed. In Textile Science II: Ability to recognize the production method,
detecting specific construction and the use of these fabrics in different applications were tested.
Example of Assessment in Textile Science I
Textile Science assessment was conducted using two measurements: (i) Fiber Identification
capability, (ii) Yarn construction analysis. Students are taught to identify specific fiber (natural
and synthetic) using burning, dissolution in particular solvents and microscopic analysis of
surface morphology. First students are given 16 different natural, manufactured and synthetic
fibers and asked them to analyses and identify each fiber by name as cotton, jute, rayon, nylon,

32
polyester etc. This exercise was conducted under the guidance of the instructor. Students were
then given coded 10 different fibers to identify using all three methods (burning, dissolution and
microscopic methods). 32 students participated in this measurement.
Results:
In the guided analysis 75% students correctly identified 100% of all 16 fibers and 25
students correctly identified 90% of all fibers.
In the totally blind analysis of coded fibers 19% student correctly identified 100% of all
fibers, 52% student correctly identified 90% fibers, 23% students correctly identify 80%
fibers and 6% students could identify less than 80% fibers.
Yarn construction analysis. Every type fabric is designed to be produced from a particular
yarn (material and construction). Construction includes linear density of the yarn, number
of ply, twist direction and magnitude etc. Students are taught yarn construction in the
classes using various types of yarn. This is an important element in product development.
Students were given 15 yarns having different constructions. Test was conducted on 31
students.
Examining student work it revealed that 31% students correctly analyzed 100% yarns, 38%
students correctly analyzed 90% yarns and 31 students correctly analyzed 80% yarns.
Analysis
During Fiber Identification testing students for get to test the sample using all three
techniques and therefore, fail to differentiate similar fibers. It was observed that student had
difficulty in microscopic examination of fiber surface morphology. In construction analysis
of yarn major source of mistake came from compound and fancy yarns that complex in
nature because two entirely different yarns are put together to create these yarns. Overall all
results is satisfactory, however, there are opportunities to improve.
In order to improve student outcome in these areas following measures are planned to be
taken:
1. More emphasis will be given in the fiber lab class on the microscopic analysis.
2. Student will be required to produce the test data of all three different tests before
identifying the fiber name to make sure that they performed all required tests.
3. More emphasis will be given in class using varieties of compound and fancy yarns.
Textile Science II
Students are taught in class to fabric type, construction, design (waive and knit) and the
applications of each fabric type using in excess 50 fabric swatches. In this assessment
students were given 10 fabric swatches and asked to differentiate between simple, compound
and composite fabric. They were also asked to analyze for method of manufacturing (woven,
knitted, nonwoven, tufted or braided and the construction details. 28 students participate in
this assessment measurement.
Results:
No. of students scored 90 and better 1
No. of students scored between 80-89 4
No. of student scored between 70-79 7
No. of students scored between 60-69 11
No. of students scored less than 60 5

33
This first time students were tested directly on this subject; however, student were informed
about this test in advance. Greatest problem was associated with compound and composite
fabric where majority student could not correctly analyzed construction of a compound/
composite and also failed to the constituent parts of these fabrics.
Improvement measures
Additional class hours will be dedicated to this analysis since this is an important aspect of
fabric science. Student will not only observe the demonstration of the process for this
analysis but also they will practice these exercise in the class with various swatches of
different constructions.
Graduate SLO
ATM 644: Recent advancement in textiles and apparel was selected for assessment. Since
smart fabric and clothing are most advanced textile that gaining popularity in the textile value
chain the course concentrate on the smart fabric. Smart fabric are those that show extra
ordinary properties. Some examples are odor absorbing clothing, thermos-regulating fabric,
antimicrobial fabric, electronic sensor fabric etc. This a multidisciplinary subject which
merges electronics, optical sensors, polymer science, physics, engineering, and bio-
technology, etc. with textile technology to create high value product. It was important to use
this course in assessment process because of the complex nature of the subject.
Students were required to write a paper on a specific smart fabric that should include
significance, specific benefit, clear explanation of the technology used, reflection the
evidence of validity of the process. Student scored between 85- 96% which was a satisfactory
result particularly, when it was taught very first time. Only one area could be better that was
the explanation of the technology used in those articles.
Improvement plan
More attention needs to be paid during teaching to make sure that students are understanding
the scientific concepts used and they are able express that.

34
Program Annual Assessment Report
Program Name: Communication Technology
Report Year: 2015-2016
Submitted on (date): April 29, 2016
Program Student Learning Outcome:
The Interpersonal Skills/Teamwork SLO was chosen to be assessed – Students will demonstrate
the ability to work together in teams to create a proposal and deliver a verbal presentation to a
prospective client.
Method of Assessment:
Course final proposal and presentation project for CMT 305W were reviewed. This was the
proposal generated by groups from an RFP and the subsequent presentation, as a group, to the
client (faculty panel) for consideration. Also assessed were the communication skills, both in the
group and with the instructor.
Assessment Findings: SLO was achieved
CMT 305W Proposal Presentation Teamwork Communication
1 Group 1 3 2 3 3
2 Group 2 2 3 3 2
3 Group 3 2 2 2 2
Key
3 Above Average
2 Average
1 Below Average
0 Unsatisfactory
Use of assessment findings to make decisions and improvements to the program.
The above SLO was reviewed for two years and has been achieved. Next year the
program will review: Critical Thinking

35
Program Annual Assessment Report
Program Name: Construction Management
Report Year: 2015-2016
Submitted on (date): May 1, 2016
Program Student Learning Outcome:
ACCE - SLO #8) Analyze methods, materials, and equipment used to construct projects.
SLO: Students will be able to perform and analyze the American Concrete Institute (ACI) and
Michigan Concrete Association (MCA) acceptance tests for concrete with respect to the
following seven ASTM specifications:
Concrete cylinders (C31)
Density (C138)
Slump (C143)
Sampling (C172)
Air content-volumetric (C173)
Air content-pressure (C231)
Temperature (C1064)
Method of Assessment:
Students take the Level 1 Concrete Testing Certification exam including both the written and
manual parts to achieve certification through the ACI and MCA.
Assessment Findings:
Eighteen students took the test on 3/18/16. All eighteen passed the manual part. Seven of
eighteen passed the written part.
Some students were unaware that the MCA written test allowed open notes.
The Sampling Test (C172) was the most difficult section on the written test.
Use of assessment findings to make decisions and improvements to the program.
1. More thorough lectures on the fundamentals of concrete including materials,
water/cement ratio, curing and hot/cold weather concreting. Possible use of clickers
during class presentations to insure student involvement.
2. Make sure students bring hard copies of the PowerPoint notes to the test since part of
the written test is open notes.
3. While preparing for the test, emphasize the Sampling Test (C172) by producing more
teaching aids and pre-quizzes.

36
Program Annual Assessment Report
Program Name: Interior Design
Report Year: 2015-2016
Submitted on (date): May 2, 2016
Program Student Learning Outcome Assessed:
One of the CIDA accreditation SLO’s that will be highlighted during the next site visit will be
teamwork and collaboration. The IDE 420 senior studio, large health care project is typically
taught with teams involved in research and project collaboration, but this has not formally been
assessed in the past.
Method of Assessment:
At the end of the winter semester, students were asked to complete a teamwork survey, which
was much more detailed than past verbal assessment of team interactions.
Assessment Findings:
Nine of fifteen students submitted their survey in a timely fashion. It was optional and not
required for semester grade completion. Survey data were in a narrative format.
Excerpts of comments included:
- “It helped me get out of my comfort zone. With a partner were are forced to try new
solutions that will accommodate both of our ideas. My partner excelled in the areas
that I have trouble with and I excel in areas she had trouble with. We kept organized
using a Google calendar and shared Google Drive docs. This is more realistic of a
company setting.”
- “It was easier to get work done in a timely fashion and you each do a piece of it.
Communication worked best face to face or by messaging each other. Email did not
work well for us. We could have improved our time management.” “My suggestion is
to have fun with your team member(s). Get to know them and do not prejudge a
person before you choose the team. Also, do not get picky with your choosing. Try
out other classmates as your team member(s).”
- “The project was large and working with a partner helped make the assignment more
manageable. My partner didn’t always hold up her end of the assignments when it
came to time management… Texting, collaborating in class and emailing were the
most convenient methods of communicating, but texting had delays and didn’t always
work. We each chose to work on something that was outside our comfort zone to get
more experience. Sometimes life events for your partner get in the way…”
- “Developing a concept and collaborating on ideas and solutions is more beneficial
when working with a partner. The only think that would be the least beneficial is that
compromise has to happen. Things will not always go the exact way you want them
to, as they would if you were working alone. We each worked on some things that

37
were and others that were not in our comfort zone. Working together to share how we
had previously done tasks helped make each member more comfortable and we each
learned something new. It’s good to teach each other new things.”
- “Most workplace settings involve teamwork at some point. It is best to develop
people skills and begin to understand how to work with different personality types.
The most helpful aspect was there is someone to help when you are low on time and
to evenly distribute the workload. We based task assignments on our strengths so as
to get things done quickly. One negative was not being more assertive and defining
what I wish would come from others.”
- “We think differently as we work with others. Other partner might take praise for
your ideas or work. It’s important to share work schedules. Timing became a
challenge but we worked to figure it out. We find a common ground and determine
the best way to work together peacefully. “
- “ I got the chance to work with someone new and it provides a chance to collaborate
on innovative ideas with one another. It was easier to find solutions when working as
a team. In the beginning, we shared our ideas of what we wanted to do on the project,
and compromised on who would do what. I learned to work with people who have
different style than me. Adapting skills were learned.”
- “ I knew both of my partners and we have similar ideas; so working together went
well. Determining who would be the leader could be challenging – one could
overpower others. Having a group “chat” worked well for us. No one was left out and
we could all see what others were talking about. A group of two might have been
better than 3. It was a large project; so each having a role was helpful.”
- “I did enjoy working with a team member because it allows you to see another
perspective throughout the process. Sharing the workload was good – made it less
overwhelming. Overall I was happy with how we handled the project. Maybe more
collaborative brainstorming in the beginning. I learned that it is good to go into any
project very open minded. I grew to enjoy this project much more after a few weeks
of working on it.”
Plan of Action:
It is recommended that assessment again occur in this studio and also for the fall IDE 410 studio
class. These are large complicated projects and students could use teamwork experience. We
need to assess ways to improve the process for them. Teaching the people skills of collaboration
is a challenge and requires practice. Teams tend to form with others they know. Having them
form new relationships will mimic a workplace setting.

38
Program Annual Assessment Report
Program Name: Masters of Science in Interior Design
Report Year: 2015-2016
Submitted on (date): April 29, 2016
Program Student Learning Outcome Assessed:
Program Student Learning Outcomes anticipated in IDE 507 – LEED and Sustainable Design
1. Students will be able to comprehend the global environmental challenges & sustainable
design approaches.
2. Students will be able to analyze the interactions between built and natural environments.
3. Students will be able to understand the structural components of building performance
rating system LEED: LT, SS, WE, EA, MR, IEQ, ID, & RP.
4. Students will be able to demonstrate an understanding of integrative strategies to achieve
sustainable building design.
5. Students will be able to conduct lighting calculation based on Lighting Power Density
(LPD) specified by ASHRAE 90.1.
6. Students will be able to use the ventilation rate requirements specified by ASHRAE 62.1
SLO assessed in 2015-2016:
Students will be able to demonstrate an understanding of integrative strategies to achieve
sustainable building design.
Method of Assessment:
The class adopts mock exam formulated by Green Building Certification Institute (GBCI)
certified agent based on the following reasons:
1. enabling students to familiarize with the format of USGBC certification exam
2. assessing students’ understanding of the materials
Assessment Findings:
The mock exam on “integrative strategies” consists of 62 questions. The following is the test
results performed by 11 students:
1. student SH 50/62 0.806
2. student EF 51/62 0.823
3. student MA 53/62 0.855
4. student AS 45/62 0.726
5. student EM 56/62 0.903
6. student AI 57/62 0.919
7. student RA 60/62 0.968
8. student DA 56/62 0.903
9. student AK 46/62 0.742

39
10. student GA 55/62 0.887
11. student SK 53/62 0.855 class average: 0.853
Collectively, the class performance met the passing percentage of 85% set up by GBCI.
Individually, there were 7 students out of II who scored 85% or above to pass the exam.
Plan of Action:
Based on the assessment findings through mock exam, the following measures will be utilized
for betterment:
1. The future lectures will adopt a comprehensive approach by connecting related
information scattered in various parts of the LEED Reference Guide to form a network
for easier association and comprehension.
2. The class will utilize a series of small-scale quizzes to highlight key points.
40
Program Annual Assessment Report
Program Name: Simulation, Animation and Gaming
Report Year: 2015-2016
Submitted on (date): May 9, 2016
Program Student Learning Outcome Assessed:
1. Information Literacy/Communication Students will be able to communicate technical
knowledge, concepts, theoretical constructs and conclusions in written, oral and/or
electronic form.
2. Problem Solving Students will be able to use self-developed resources (journals, lab
manuals, case studies) and prior knowledge to recommend solutions to real world
problems.
3. Critical Thinking Students will be able to identify, select and employ the correct
software application(s) to solve graphic representation problems, i.e. simulation versus
gaming for Simulation, Animation and Gaming (SAG).
4. Interpersonal Skills/Teamwork Students will be able to demonstrate the ability to work
effectively in a team environment.
Method of Assessment:
Team Final Project – all inclusive

41
Assessment Findings:
Plan of Action:
The students need to be able to work in groups and effectively communicate their final project to the class. In addition, students in
this major need to gain strong skills in personal and visual communication. Steps will be incorporated to address these issues.

42
Program Annual Assessment Report
Program Name: Aviation Flight Technology and Management Programs
Report Year: 2015-2016
Submitted on (date): May 4, 2016
Program Student Learning Outcome Assessed:
Program Student Learning Outcomes include:
Ability to apply knowledge of mathematics, science and applied sciences
Ability to interpret and analyze data
Ability to function on multi-disciplinary teams
Understanding of professional and ethical responsibilities
Ability to communicate effectively, including both written and verbal
communication skills
Recognition for the need for, and an ability to engage in, life-long learning
Knowledge of contemporary issues
Ability to use techniques, skills and modern technology necessary for professional
practice
Understanding of the national and international aviation environments
Ability to apply pertinent knowledge in identifying and solving problems
This year (2015-2016), we assessed the following:
Knowledge of contemporary issues
This SLO was assessed in AVT422 (Senior Seminar in Aviation Management). Students
were assessed on their ability to research and write blog entries pertaining to
contemporary issues in the aviation industry.
Method of Assessment:
This SLO was directly assessed by evaluating weekly student blog entries. Students were
given a weekly assignment to research and write about a specific contemporary topic in
the aviation industry. Additionally, students were required to comment on several
classmate’ blog posts every week. Specific questions about the topic were asked. Topics
included, but were not limited to, the following:
Impact of Global Airlines
Privatization of Air Traffic Control
Chinese Aircraft Manufacturing
Professionalism and the Regional Airline Industry
The Future of Commercial Space and Space Tourism
43
Current Status of Unmanned Aerial Vehicles (UAVs)
Third Class Medical Reform
Blog posts were evaluated by using a rubric. The rubric included the following:
Topic questions answered
Appropriate citations/references/APA formatting
Depth of discussion
Scholarly writing style
Assessment Findings:
Students wrote 12 blog posts on 12 different contemporary topics in the aviation industry
throughout the winter 2016 semester. The following is a break-down of their average
blog grade:
A (7 students, 58% of the class)
(2 students, 17% of the class)
D+ (1 student, 8% of the class)
D- (1 student, 8% of the class)
E (1 student, 8% of the class)
Evident in these findings is the fact that students either did well or poorly, without any
students in the B or C average grade range. Upon investigation, the lower grades were a
result of missed or late blog assignments and are not reflective of the quality of the
research or writing of blog assignments. A clear demonstration of knowledge in
contemporary issues in the aviation industry was represented in almost all cases when
blog assignments were completed.
Plan of Action:
A clear demonstration of knowledge in contemporary issues in the aviation industry was
demonstrated in almost all cases when blog assignments were completed, therefore, the
plan of action includes identifying and addressing any possible logistical issues that may
be preventing a student from completing the assignment or completing in a timely
manner. Barriers to assignment completion may include lack of clarity in the syllabus in
terms of due dates and requirements, as well as potential resistance to writing in the blog
format. The Plan of Action includes reviewing the syllabus and providing additional
clarity as needed as well as addressing other potential issues with writing in the blog
format.
44
Program Annual Assessment Report
Program Name: Business, Marketing, Management & Technology Education
Report Year: 2015-2016
Submitted on (date): April 23, 2016
Program Student Learning Outcome Assessed:
Evidence that grades improved by incorporating audio components to an online learning
environment.
Method of Assessment:
In Winter 2015, Konnie Kustron was assigned to teach BMMT 250 for the first time. She
received a course shell from a peer that did not include any audio lectures, but simply
included the textbook publisher’s Powerpoints. These Powerpoints often exceeded 50
screens per chapter, with some approaching 70 pages. Thirty-five students in two sections
were enrolled in the course. Grades through Unit 5 ranged from 95.08% to 0 with an
average grade of 65.5%. Removing the one student who received a zero who did not
participate in class, the average grade through Unit 5 was 67.48%.
In Winter 2016, Konnie Kustron added audio to the publisher’s Powerpoints. The length
of the Powerpoints were also shortened to 15-20 screens. Lectures did not exceed 20
minutes. Some chapters had two lectures based on the type of content.
Assessment Findings:
Twenty students were in Professor Kustron’s section of the class. Grades through Unit 5
ranged from 97.63% to 20.95% with an average of 77.58%. Student scores were more
than 10 points higher in Winter 2016.
Plan of Action:
Continue to add multi-media learning options to the course. Re-assess next year.

45
Program Annual Assessment Report
Program Name: Hotel, Restaurant Management (UG)
Report Year: 2015-2016
Submitted on (date): May 3, 2016
Program Student Learning Outcome Assessed:
The accrediting body for HRM has five program learning outcomes. For this academic
year, HRM chose to focus on: The development of effective written and oral
communication skills needed to be successful in the hospitality business environment.
Method of Assessment:
Faculty chose to focus on the use and quality of online threaded discussions. They have
used this tool for the past two years in their hybrid courses. Writing is evaluated in every
HRM course. The assessment spot-checked the writing of threaded discussions within
three courses: HRM 268, 430 and 496.
Assessment Findings:
While specific points vary on the rubric used for each class, the threaded discussions are
generally evaluated on the following:
Demonstrating an understanding of the initial question that began the threaded
discussion,
Providing a management application, solution, implication regarding the topic,
Thoughtfully responding to classmate comments about the topic.
In comparing threaded discussions provided by 200-level versus 400-level students, it is
clear that practicing written communication over time improves outcomes and student
grades. Responses matured, were more thoughtful, thorough, and clearly showed a
detailed understanding of the topic and HRM issues for more senior-level students.
Plan of Action:
For this SLO, continue to track student improvement in written communication. Review
avenues of oral communication and track improvement during the program.
For next year, the program will assess the second SLO from the accrediting body: Apply
classroom theory with practical application in the hospitality industry through targeted
work experience related to career objectives.

46
Program Annual Assessment Report
Program Name: Hotel, Restaurant Management (Grad)
Report Year: 2015-2016
Submitted on (date): May 3, 2016
Program Student Learning Outcome Assessed:
No assessment was completed this year due to the cancellation of graduate courses for
low enrollment. The few students in the program were finishing up capstone experiences
and/or final work through independent study or cross-listed courses attached to
undergraduate classes.
This program is not accredited by the agency accrediting the undergraduate HRM
program.
Method of Assessment:
Assessment Findings:
Plan of Action:
Admissions for fall 2016 for the graduate HRM program has been halted. Students are
being advised to take MBA courses or take Technology Studies courses. Faculty will
work with TS faculty to develop an HRM concentration within the TS program that will
go through the input system during 2016-17.

47
Program Annual Assessment Report
Program Name: Paralegal Studies
Report Year: 2015-2016
Submitted on (date): April 23, 2016
Program Student Learning Outcome Assessed:
Evidence that improvement in writing skills took place in LEGL 400. Assessment
included formulating ideas, researching case law and other literature properly cited,
formulating a paper with cogent arguments and grammatical elements properly
incorporated.
Method of Assessment:
In Fall 2015, 13 students were enrolled in LEGL 400. On the first day of class, students
came to class prepared to complete an in-class writing assignment to assess their research
and writing ability. At the end of class, final class grades were compared to the first
writing assignment. The identical grading rubric was used for all class assignments.
Assessment Findings:
For the class one writing assessment, grading was as follows with a 76% average:
72, 50, 90, 85, 85, 50, 85, 90, 50, 98, 85, 75, 75 = 76.151538 Average
For the final class grade, grading was as follows:
79, 77, 78, 95, 76, 85, 80, 91, 73, 95, 91, 83, 78 = 83.15 Average
Students on the average started as high C writers, and ended the course as high B- writers.
Plan of Action:
Continue to the same assessment model, but look at individual students excluding A
students who consistently earn A grades on all assignments. Also, require a pre and post
assessment in other courses including LEGL 304W and LEGL 305, which are pre-
requisite courses to LEGL 400.

48
Program Annual Assessment Report
Program Name: Technology Management
Report Year: 2015-16
Submitted on (date): March 28, 2016
Program Student Learning Outcomes:
Ability to plan and organize projects,
Ability to schedule projects effectively and within the constraints of the
organization,
Ability to scan significant technological changes occurring within the external
environment of the organization,
ability to use online collaboration systems,
Ability to assess the need for organizational change,
Ability to do a strengths, weaknesses, opportunities, and threats (SWOT) analysis
associated with new technologies
Ability to anticipate how new technologies may affect the organization,
Understanding of the tools used in process improvement,
Ability to implement process improvement schemes,
Ability to develop an effective technology strategy for achieving competitive
advantage,
Ability to assess the internal strengths and weaknesses of the organization with
respect to changes occurring within the external environment of the organization,
Ability to create value through the use of technology.
SLO Assessed this academic year (list the student learning outcome(s) that was were
assessed this year:
Understanding of the tools used in process improvement.
Method of Assessment:
Faculty reviewed students' ability to create and discuss a “Process
Improvement Plan” in TM 314W-Socio-Technical Systems Approach to
Process Improvement (Summer& Fall 2015- Homework).
Assessment Findings:
The ability to identify and articulate the steps required for process
improvement design and implementation was found to have the lowest
average score of 2.4 of the four elements assessed on the homework
assignment “Process Improvement Plan”. Please see the attached spreadsheet
for additional information.

49
TM 314W-Process Improvement Plan
Assess: Students' ability to create and discuss a "Process Improvement Plan" (Summer & Fall 2015 Homework)
Student No. Ability to identify and articulate rational for
change
Ability to identify and articulate steps
required for process improvement design and implementation
Ability to identify and articulate
method of evaluation
Consistency of proposed plan to total
quality approach to
process improvement
Average
1 3 3 3 3 3.0
2 2 3 3 3 2.8
3 3 3 3 3 3.0
4 2 1 2 3 2.0
5 2 2 2 1 1.8
6 3 3 3 3 3.0
7 2 2 3 1 2.0
8 3 3 3 3 3.0
9 3 1 1 1 1.5
10 3 3 3 3 3.0
11 3 3 3 3 3.0
12 3 2 3 3 2.8
13 3 3 3 3 3.0
14 3 3 3 3 3.0
15 3 2 3 1 2.3
16 2 2 2 3 2.3
17 3 3 3 3 3.0
18 2 3 3 3 2.8
19 3 3 3 3 3.0

50
20 3 3 3 3 3.0
21 3 3 3 3 3.0
22 3 3 3 3 3.0
23 2 1 1 1 1.3
24 3 2 2 1 2.0
25 1 1 2 2 1.5
Average 2.6 2.4 2.6 2.5 2.6
Scales (Columns B to E):
3 - complete understanding
2 - good understanding with occasional oversight errors
1 - limited understanding demonstrated by regular errors or incomplete work
Use of assessment findings to make (1) decisions and (2) improvements to program.
Conclusions: Faculty will incorporate additional course material and assignments centered on helping students identify and articulate
the steps required for process improvement design and implementation that are consistent with a total quality approach to process
improvement in future sections of 314W-Socio-Technical Systems Approach to Process Improvement.

51
Program Annual Assessment Report
Program Name: Master of Science in Technology Studies
Report Year: 2015-2016
Submitted on (date): 4-28-16
Program Student Learning Outcome Assessed:
Capstone Research Projects – previously students completed independent study work for
their capstone experience. An online course was developed for students to exchange ideas,
network, peer critique projects and writing, self-critique, and work to finish a project –
thus finishing the degree program. Many former students procrastinated on the
independent work. The course format delivered completed projects/papers, peer
mentoring experience, and degree conferrals.
Method of Assessment:
Research Seminar Capstone Research Essay Rubric at end of course (the same rubric was
used for peer and self evaluations).
Assessment Findings:
Students demonstrated and engaged in scholarly activity in the research and writing of
final capstone research essays.
Student
name
Integration
of
knowledge
Depth of
discussion
Cohesive
organization
Writing
mechanics
Documented
references
Student A 3 3 3 3 3
Student B 3 3 2 2 3
Student C 3 3 3 2 2
Student D 3 3 2 3 1
Student E 3 3 3 2 2
Key:
3 Above average
2 Average
1 Below average
Plan of Action:
Use Research Seminar Capstone Research Essay Rubric mid-course and end of course –
compare as well with self-evaluation

52
Program Annual Assessment Report
Program Name: Military Science
Report Year: 2016-2017
Submitted on (date): 22 April 2016
Program Student Learning Outcome Assessed:
1. Embraces their role as an Army officer. Lives honorably--with uncompromising
integrity. Builds Trust within the organization.
2. Demonstrate intellectual, military, and physical competence including skills required
to succeed both in tactical and garrison environments.
3. Think critically and creatively. Understands ambiguous situations and solves complex
problems.
4. Make sound and timely decisions within the commander’s guidance and intent.
5. Develop, lead, and inspire their units to accomplish the mission.
6. Demonstrates respect for others and the ability to work effectively with people of
different cultures.
7. Communicate and interact effectively with all audiences.
8. Pursue excellence and continue to grow, personally and professionally, demonstrating
a broad perspective that is open to new ideas and experiences.
9. Seeks balance, resilience, and demonstrates a strong and winning spirit, demonstrating
mental and physical toughness.
Method of Assessment:
In class assessments include mid-terms, finals, essay papers, oral presentations. See
enclosed slides containing lesson topics for Military Science Levels (MSL) 101, 102, 201,
202, 301, 302, 401, and 402.
Outside of class assessments include individual and group performance at Leadership
Labs, Leadership Development Exercises, and Cadet Summer Training (CST) at Ft. Knox,
Kentucky. Individual and group performance is monitored by active and reserve
component officers and non-commissioned officers. Additionally, United States Army
Cadet Command (USACC) assesses performance of all cadets nation-wide using an
Outcomes Metrics List (OML). See enclosed slide explaining the USACC OML. At the
conclusion of their junior year, cadets receive a cadet officer evaluation report from the
on-campus military science instructor and professor of military science. During the
summer between their junior and senior year, cadets attend the Cadet Leadership Course
(CLC), which is one of the main components at CST. At the conclusion of CLC, cadets
receive another cadet officer evaluation report from their instructors at Ft. Knox. If a
cadet fails to meet discipline, performance, or training standards, he/she will undergo a
Leader Development Review Board to determine if they should be retained in or
disenrolled from the ROTC program. Upon returning to campus for their senior year, the
professor of military science reviews and counsels all cadets on their performance and
recommends areas for improvement to achieve their potential.

53
Prior to commissioning, contracted cadets undergo an Entrance National Agency Check
(background check), medical examination, annual drug test through urinalysis screening,
pass an Army Physical Fitness Test, and meet Army height, weight, or body fat limits.
Cadets must meet all academic requirements to earn their degree with a GPA of 2.0 or
higher to earn a commission as an officer in the United States Army.
Assessment Findings:
The ROTC program is achieving the desired outcomes. While disenrollments are
relatively low (seven over the last two years or approximately eight percent), they occur
when the standards are not met.
In SY2015-2016, the average EMU cadet GPA was a 3.31. Out of 23 commissioned
second lieutenants, over 91% (21 out of 23) received their desired component (Active
Duty, U.S. Army Reserves, or National Guard) and 75% (6 out of 8) of active duty
accessions received their desired branch.
Plan of Action:
No changes recommended. Continue to execute the robust and comprehensive Reserve
Officer Training Program.