Embed Size (px)
Citation preview
College of Nurses of Ontario
Membership Statistics Report 2017
Membership Statistics Report 2017 Pub. No. 43069
ISSN 1916 - 047X
Copyright © College of Nurses of Ontario, 2017.
Commercial or for-profit redistribution of this document in part or in whole is prohibited except with the written consent of CNO. This document may be reproduced in part or in whole for personal or educational use without permission, provided that:
• due diligence is exercised in ensuring the accuracy of the materials reproduced;
• CNO is identified as the source; and
• the reproduction is not represented as an official version of the materials reproduced, nor as having beenmade in affiliation with, or with the endorsement of, CNO.
Copies of this document can be downloaded, free of charge, from the CNO website at www.cno.org.
College of Nurses of Ontario 101 Davenport Rd. Toronto, ON M5R 3P1
www.cno.org
VISION Leading in regulatory excellence
MISSION Regulating nursing in the public interest
College of Nurses of Ontario – Membership Statistics 2017 i
Table of Contents 1 Introduction 1
2 Methods and Notes 2
2.1 Data collection ....................................................................................................................... 2
2.2 Data query tool ....................................................................................................................... 2
2.3 Classes of registration ........................................................................................................... 2
General Class .................................................................................................................. 2
Extended Class ................................................................................................................ 2
Non-Practising Class ....................................................................................................... 3
2.4 Explanation of key terms........................................................................................................ 4
Renewal gains and losses ............................................................................................... 4
Nurses with multiple nursing employment positions ........................................................ 5
Overall working status and working status for employment positions ............................. 5
On leave .......................................................................................................................... 6
Location of nursing education .......................................................................................... 6
Not stated ........................................................................................................................ 6
3 Overall Membership 7
3.1 All members ........................................................................................................................... 7
3.2 General and Extended Class members ................................................................................. 8
General and Extended Class members not employed in nursing in Ontario ................... 9
General and Extended Class members employed in nursing in Ontario ....................... 10
Demographics of General and Extended Class members employed in nursing in
Ontario ....................................................................................................................................... 11
4 Registered Nurses in the General Class 13
4.1 Employment status .............................................................................................................. 13
4.2 Renewal gains and losses of Registered Nurses in the General Class ............................... 14
Overall gains and losses of Registered Nurses in the General Class ........................... 14
Renewal gains of Registered Nurses in the General Class ........................................... 16
Renewal losses of Registered Nurses in the General Class ......................................... 16
4.3 Registered Nurses in the General Class employed in nursing in Ontario ............................ 18
Demographics of Registered Nurses in the General Class ........................................... 19
Nursing employment of Registered Nurses in the General Class ................................. 21
4.4 Registered Nurses in the General Class employed in nursing outside of Ontario ............... 23
4.5 Registered Nurses in the General Class who are registered in other jurisdictions .............. 24
4.6 Appendix table references for Registered Nurses in the General Class ............................. 26
5 Registered Nurses in the Non-Practising Class 27
5.1 Employment status .............................................................................................................. 27
5.2 Renewal gains and losses of Registered Nurses in the Non-Practising Class .................... 27
5.3 Demographics of Registered Nurses in the Non-Practising Class ...................................... 29
5.4 Registered Nurses in the Non-Practising Class employed in nursing outside of Ontario .... 30

College of Nurses of Ontario – Membership Statistics 2017 ii
5.5 Registered Nurses in the Non-Practising Class who are registered in other jurisdictions ... 31
6 Registered Practical Nurses in the General Class 33
6.1 Employment status .............................................................................................................. 33
6.2 Renewal gains and losses of Registered Practical Nurses in the General Class ................ 34
Overall gains and losses of Registered Practical Nurses in the General Class ............ 34
Renewal gains of Registered Practical Nurses in the General Class ............................ 36
Renewal losses of Registered Practical Nurses in the General Class .......................... 36
6.3 Registered Practical Nurses in the General Class employed in nursing in Ontario ............. 38
Demographics of Registered Practical Nurses in the General Class ............................ 39
Nursing employment of Registered Practical Nurses in the General Class ................... 41
6.4 Registered Practical Nurses in the General Class employed in nursing outside of Ontario 43
6.5 Registered Practical Nurses in the General Class who are registered in other
jurisdictions ..................................................................................................................................... 44
6.6 Appendix table references for Registered Practical Nurses in the General Class ............... 46
7 Registered Practical Nurses in the Non-Practising Class 47
7.1 Employment status .............................................................................................................. 47
7.2 Renewal gains and losses of Registered Practical Nurses in the Non-Practising Class ..... 47
7.3 Demographics of Registered Practical Nurses in the Non-Practising Class ........................ 49
7.4 Registered Practical Nurses in the Non-Practising Class employed in nursing outside of
Ontario ............................................................................................................................................ 50
7.5 Registered Practical Nurses in the Non-Practising Class who are registered in other
jurisdictions ..................................................................................................................................... 51
8 Registered Nurses in the Extended Class (Nurse Practitioners) 53
8.1 Employment status .............................................................................................................. 53
8.2 Renewal gains and losses of RNs in the Extended Class (NPs) ......................................... 54
Overall gains and losses of RNs in the Extended Class (NPs) ..................................... 54
Renewal gains for RNs in the Extended Class (NPs) .................................................... 56
Renewal losses for RNs in the Extended Class (NPs) .................................................. 57
8.3 RNs in the Extended Class (NPs) employed in nursing in Ontario ...................................... 58
Demographics of RNs in the Extended Class (NPs) ..................................................... 59
Nursing employment of RNs in the Extended Class (NPs) ............................................ 61
RNs in the Extended Class (NPs) employed as Nurse Practitioners in Ontario ............ 63
9 Appendix 1: RNs in the General Class 66
9.1 RN General Class gains and losses: Trends ....................................................................... 66
Detailed breakdown of RN General Class losses .......................................................... 69
9.2 RN General Class employed in nursing in Ontario .............................................................. 73
Overall working status in Ontario by age group ............................................................. 73
Ontario nursing employment sector statistics ................................................................ 74
10 Appendix 2: RPNs in the General Class 77
10.1 RPN General Class gains and losses: Trends .................................................................... 77
Detailed breakdown of RPN General Class losses ....................................................... 80

College of Nurses of Ontario – Membership Statistics 2017 iii
10.2 RPN General Class employed in nursing in Ontario ............................................................ 84
Overall working status in Ontario by age group ............................................................. 84
Ontario nursing employment sector statistics ................................................................ 85
11 Appendix 3: RNs in the Extended Class (NPs) Employment Sector
Statistics 88
12 Appendix 4: Practice and Employment Definitions 91
12.1 Nursing employer ................................................................................................................. 91
Hospitals ........................................................................................................................ 91
Community ..................................................................................................................... 91
Long-term care .............................................................................................................. 93
Other .............................................................................................................................. 94
12.2 Position in Nursing ............................................................................................................... 95
12.3 Area of Practice ................................................................................................................... 97

College of Nurses of Ontario – Membership Statistics 2017 1
1 INTRODUCTION
The College of Nurses of Ontario (the College) is the regulatory body for nursing
in Ontario. Its mission is to regulate nursing in the public interest. The College
sets the requirements for becoming a nurse in Ontario and the standards of
practice that nurses must meet to maintain that designation. Only a person with a
valid Certificate of Registration from the College can practise as a nurse in
Ontario and use the protected titles: nurse, Registered Nurse (RN), Registered
Practical Nurse (RPN) or Nurse Practitioner (NP).
The College publishes annual statistics reports to provide data for stakeholders
about the nurses it registers. The College continually enhances its reports based
on stakeholder feedback. To find out more about the College’s statistical
resources or sign up for its statistics announcements, please visit
www.cno.org/stats .
College of Nurses of Ontario – Membership Statistics 2017 2
2 METHODS AND NOTES
2.1 Data collection
Every year, the College requires members in the General, Extended and Non-
Practising Classes to renew their memberships.1 As part of the renewal process,
the College collects member demographic and employment information in order
to carry out its regulatory mandate.
This report presents the membership statistics of the nurses who renewed their
memberships for 2017.2
2.2 Data query tool
The College’s data query tool is an online application that allows users to create
custom tables based on the College’s General and Extended Class membership
renewal data. The tool produces downloadable tables in HTML, PDF or Excel
formats and is available at www.cno.org/dqt . The data query tool contains data
from 1992 onwards.
2.3 Classes of registration
General Class
Members in the General Class are Registered Nurses (RNs) or Registered
Practical Nurses (RPNs) who are registered with the College and are eligible to
practise nursing in Ontario. Most nurses registered with the College belong to
this class.
Extended Class
The Extended Class is for RNs who have additional education and clinical
experience that allows them to practise as Nurse Practitioners (NPs) in Ontario.
Members in this class have an expanded scope of practice, with the authority to
diagnose, prescribe medication, perform procedures, and order and interpret
diagnostic tests.
1 Visit www.cno.org/en/become-a-nurse/classes-of-registration/ for more information about the College’s classes of registration. 2 The 2017 renewal period was Nov. 7, 2016 to Mar. 23, 2017.

College of Nurses of Ontario – Membership Statistics 2017 3
Non-Practising Class
The College established the Non-Practising Class on Jan. 1, 2013. Members in
this class are former members of the College’s General or Extended Classes.
Nurses in this class are not eligible to practise nursing in Ontario.
During the 2014 renewal period, there was a higher-than-usual number of losses
in the General Class. This was largely due to a new registration regulation
requirement that the College introduced, called the declaration of practice.3 The
new requirement allowed a member to renew in the General Class only if they
had:
practised nursing in Ontario within the past three years, or
become registered or reinstated with the College within the past three
years.
Members who did not meet these conditions could:
register in the Non-Practising Class,
resign their membership, or
have the College revoke their membership.
To coincide with the introduction of the Non-Practising Class, the College
eliminated the Retired Class and transferred members registered in the Retired
Class to the Non-Practising Class.
Since 2013 was the first year that members could register in the Non-Practising
Class, no members renewed in that class until the 2014 renewal. This report
presents statistics about members in the Non-Practising Class separately from
statistics about members in the General and Extended Classes.
By the end of 2016, the Ontario government approved changes to the registration
regulation to remove the phrase “in Ontario” from the declaration of practice
questions. Instead, beginning with the 2017 renewal, the College now asks
members to declare if they have practised nursing within the past three years, not
necessarily in Ontario.
3 Visit www.cno.org/en/maintain-your-membership1/declaration-of-practice/ for more information about the declaration of practice requirement.
College of Nurses of Ontario – Membership Statistics 2017 4
2.4 Explanation of key terms
Renewal gains and losses
Gains
There are three types of membership gains: reinstatements, new members and
changes in class.
Reinstatements are previously registered members who have reapplied to enter
the class in which they were previously registered. For example, a former
member of the RN General Class, who had resigned from the College, would like
to start practising in Ontario again. This former member would have to reinstate
their membership with the College in the same class.
New members are newly registered members who have never renewed with the
College before the current renewal.4
Change in class are members renewing in a different class. For example, an RN
who renewed in the Extended Class in the current renewal, but who previously
renewed in the General Class, represents a gain for the RNs in the Extended
Class (NPs).
Losses
There are three types of membership losses: resignations, revocations and
changes in class.
Resignations are members who resigned any time before or during the renewal
period.
Revocations are members who did not renew their memberships before the
revocation date.5
Change in class are members renewing in a different class. For example, an RN
who renewed in the Extended Class in the current renewal, but who previously
renewed in the General Class, represents a loss for the RNs in the General Class.
Net gain/loss
The difference between the gain and the loss is known as the net gain/loss. A net
gain occurs when there is an overall increase in members renewing in a particular
class over the previous year, and a net loss occurs when there is an overall
decrease in members renewing in a particular class over the previous year.
4 See the New Members in the General Class 2016 report at www.cno.org/en/what-is-cno/nursing-demographics/statistical-reports/ for more information about new College members. 5 The revocation date for the 2017 renewal was Mar. 23, 2017.

College of Nurses of Ontario – Membership Statistics 2017 5
Examining the net gain/loss allows for a better understanding of trends in the
total number of members renewing.
Nurses with multiple nursing employment positions
During renewal, the College asks members for information about all of their
employment positions. This includes the employer’s business address, employer
type, whether the position is a nursing role and if so, the member’s position and
area of practice within the role.
Because some members have more than one nursing position, the number of
nursing positions is higher than the number of members.
Overall working status and working status for employment positions
Overall working status (full-time, part-time or casual) is the highest working
status amongst all of a member’s nursing positions. The three examples below
illustrate how overall working status is calculated:
Example 1: If a member has both a casual nursing position and a full-
time nursing position, the member’s overall working status is full-time.
Example 2: If a member has three casual nursing positions, the
member’s overall working status is casual.
Example 3: If a member has one part-time nursing position and one
full-time non-nursing position, the member’s overall working status is
part-time.
This overall working status statistic is comparable with the working status
statistic used before 2011, when members provided information only about their
primary employment position.
Working status for employment positions (full-time, part-time or casual) is a
statistic that provides information about the working status of individual nursing
employment positions. Unlike overall working status, it does not aggregate
working status to the member level but instead reports it at the position level.
Table 2.1 shows the difference between overall working status and working
status for employment positions during the 2017 renewal.
During the 2017 renewal, 141,317 members reported having at least one nursing
employment position in Ontario. Of these members, 62.7 per cent had an overall
working status of full-time; 29.3 per cent had an overall working status of part-
time; and 8.0 per cent had an overall working status of casual.
These 141,317 members reported 169,063 nursing employment positions in
Ontario. Of these employment positions, 52.7 per cent were full-time; 29.6 per
cent were part-time; and 17.8 per cent were casual.

College of Nurses of Ontario – Membership Statistics 2017 6
Table 2.1: Overall working status and working status for employment
positions: Comparison
Total Working status statistic used
Full-time Part-time Casual
# % % %
141,317 Number of members employed in nursing in Ontario
Overall working status 62.7 29.3 8.0
169,063 Number of nursing employment positions in Ontario reported by members
Working status for employment positions
52.7 29.6 17.8
On leave
On leave is an employment status that the Ministry of Health and Long-Term
Care requested that the College include, starting in 2011. While the Ministry did
not provide a definition, the College interprets it to include members on leave
from the nursing profession due to parental leave or long-term disability. Before
2011, members on parental leave reported their status as employed, and members
on long-term disability reported their status based on their last day of work.
Location of nursing education
Location of nursing education is the province or country of a member’s
education that the member reported when applying to the College. This report
groups locations into the following: Ontario;6 other Canadian provinces or
territories; and international.
Not stated
Not stated refers to when a member did not provide valid information or when
information conflicted with other information they reported during the renewal
process.
6 Ontario universities and colleges offer Ontario nursing programs, and the College’s Council approves the programs for registering as a nurse in Ontario.

College of Nurses of Ontario – Membership Statistics 2017 7
3 OVERALL MEMBERSHIP
3.1 All members
Table 3.1 shows the number of General, Extended and Non-Practising Class
members who renewed their memberships over the past five years.
Table 3.1: Overall membership: Category and class
2013 2014 2015 2016 2017
# % # % # % # % # %
RN 114,824 73.2 111,287 72.2 115,385 71.6 115,792 70.4 116,451 69.6
General 112,582 71.8 104,298 67.7 104,401 64.8 104,140 63.3 104,483 62.5
Extended (NP) 2,242 1.4 2,362 1.5 2,567 1.6 2,822 1.7 3,083 1.8
Non-Practising 4,627 3.0 8,417 5.2 8,830 5.4 8,885 5.3
RPN 41,996 26.8 42,760 27.8 45,818 28.4 48,777 29.6 50,803 30.4
General 41,996 26.8 42,018 27.3 44,195 27.4 46,888 28.5 48,748 29.1
Non-Practising 742 0.5 1,623 1.0 1,889 1.1 2,055 1.2
Total 156,820 100 154,047 100 161,203 100 164,569 100 167,254 100

College of Nurses of Ontario – Membership Statistics 2017 8
3.2 General and Extended Class members
Figure 3.1 shows the number of members who have renewed in the General or
Extended Classes over the past 10 years.
Figure 3.1: Number of members renewing in the General or Extended
Classes
109,823 111,014 111,717 111,532 112,194 112,582104,298 104,401 104,140 104,483
32,137 33,633 35,427 36,588 38,845 41,996
42,018 44,195 46,888 48,748
9381,206
1,585 1,8002,020
2,242
2,362 2,5672,822 3,083
0
20,000
40,000
60,000
80,000
100,000
120,000
140,000
160,000
2008 2009 2010 2011 2012 2013 2014 2015 2016 2017
Me
mb
ers
hip
re
new
als
Year
Nurse Practitioners
Registered Practical Nurses
Registered Nurses
College of Nurses of Ontario – Membership Statistics 2017 9
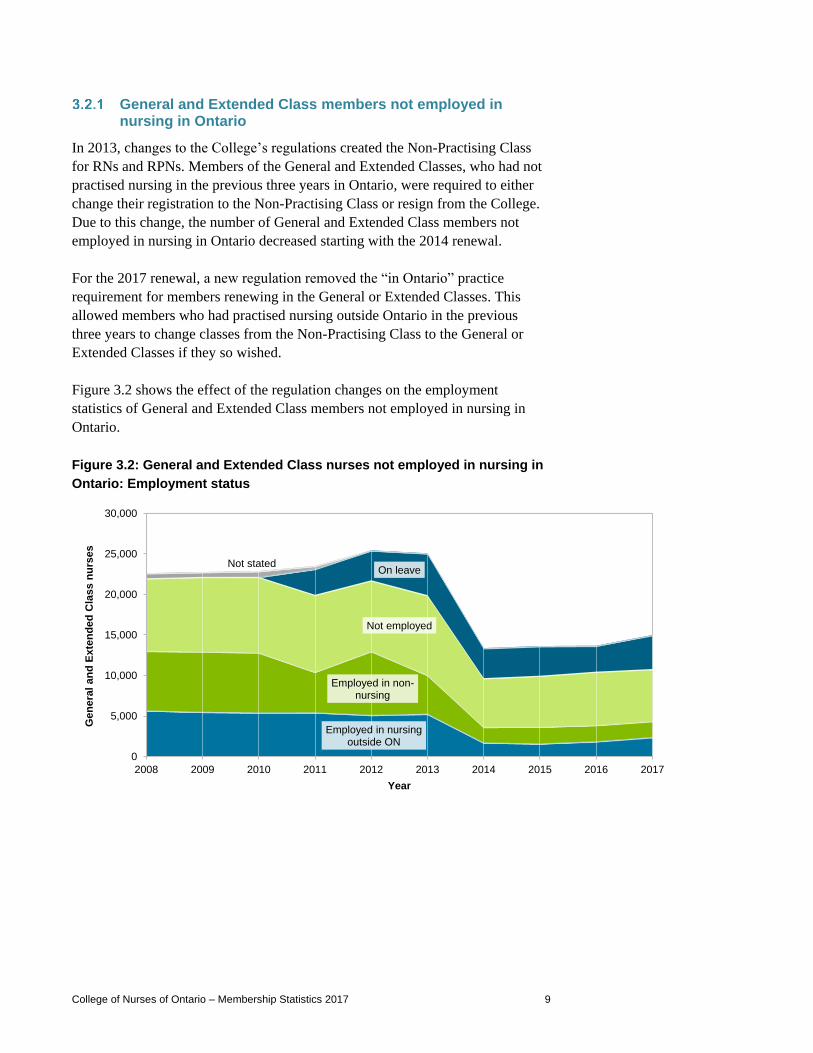
General and Extended Class members not employed in nursing in Ontario
In 2013, changes to the College’s regulations created the Non-Practising Class
for RNs and RPNs. Members of the General and Extended Classes, who had not
practised nursing in the previous three years in Ontario, were required to either
change their registration to the Non-Practising Class or resign from the College.
Due to this change, the number of General and Extended Class members not
employed in nursing in Ontario decreased starting with the 2014 renewal.
For the 2017 renewal, a new regulation removed the “in Ontario” practice
requirement for members renewing in the General or Extended Classes. This
allowed members who had practised nursing outside Ontario in the previous
three years to change classes from the Non-Practising Class to the General or
Extended Classes if they so wished.
Figure 3.2 shows the effect of the regulation changes on the employment
statistics of General and Extended Class members not employed in nursing in
Ontario.
Figure 3.2: General and Extended Class nurses not employed in nursing in
Ontario: Employment status
Employed in nursing outside ON
Employed in non-nursing
Not employed
On leaveNot stated
0
5,000
10,000
15,000
20,000
25,000
30,000
2008 2009 2010 2011 2012 2013 2014 2015 2016 2017
Gen
era
l an
d E
xte
nd
ed
Cla
ss n
urs
es
Year

College of Nurses of Ontario – Membership Statistics 2017 10
General and Extended Class members employed in nursing in Ontario
Figure 3.3 shows the number of General and Extended Class members who
renewed over the past 10 years, compared with the number of those members
who were employed in nursing in Ontario. For example, in 2017, 141,317 (90%)
of the 156,314 General and Extended Class members who renewed their
membership were employed in nursing in Ontario.
Figure 3.3: General or Extended Class members employed in nursing in
Ontario
142,898 145,853 148,729 149,920 153,059 156,820
148,678 151,163 153,850 156,314
120,265 123,091 125,844 126,400 127,603 131,728 135,280 137,525 140,167 141,317
84% 84% 85% 84% 83% 84%
91% 91% 91% 90%
0%
10%
20%
30%
40%
50%
60%
70%
80%
90%
100%
0
20,000
40,000
60,000
80,000
100,000
120,000
140,000
160,000
180,000
200,000
2008 2009 2010 2011 2012 2013 2014 2015 2016 2017
Perc
en
tag
e o
f n
urs
es
em
plo
ye
d i
n n
urs
ing
in
On
tari
o
Gen
era
l an
d E
xte
nd
ed
Cla
ss n
urs
es
Year
Nurses renewed in the General or Extended Classes
Nurses employed in Ontario
Percentage of nurses employed in nursing in Ontario
College of Nurses of Ontario – Membership Statistics 2017 11
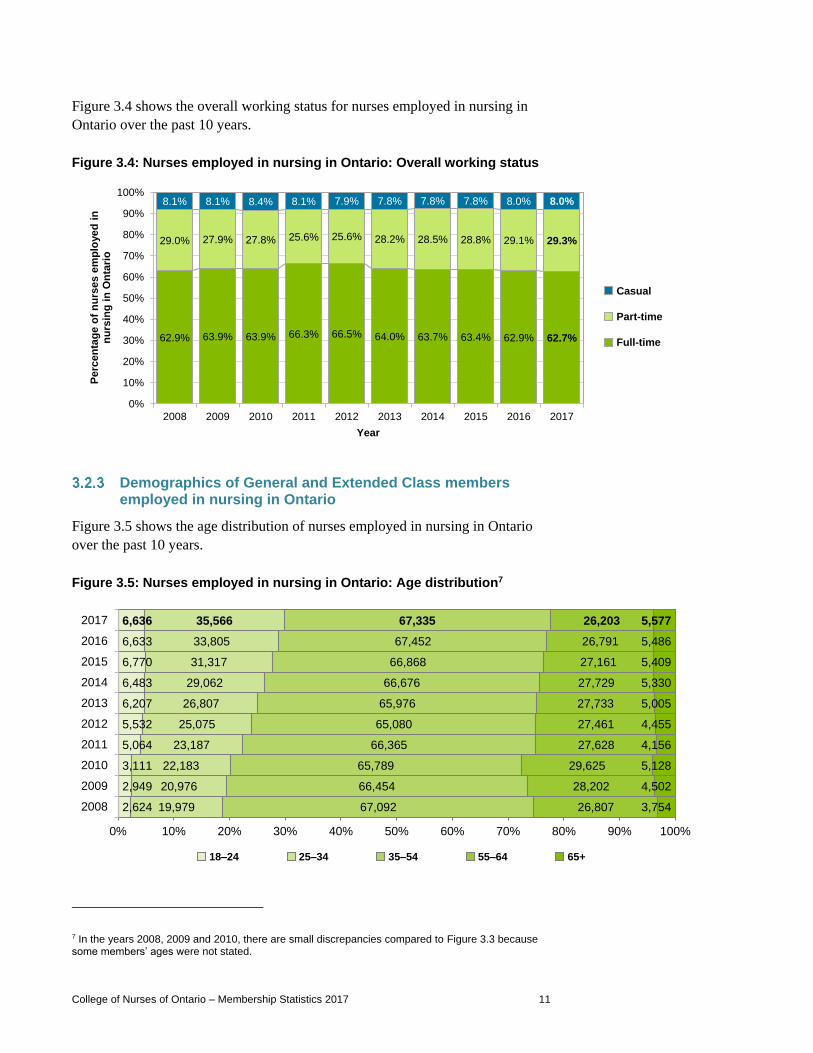
Figure 3.4 shows the overall working status for nurses employed in nursing in
Ontario over the past 10 years.
Figure 3.4: Nurses employed in nursing in Ontario: Overall working status
Demographics of General and Extended Class members employed in nursing in Ontario
Figure 3.5 shows the age distribution of nurses employed in nursing in Ontario
over the past 10 years.
Figure 3.5: Nurses employed in nursing in Ontario: Age distribution7
7 In the years 2008, 2009 and 2010, there are small discrepancies compared to Figure 3.3 because some members’ ages were not stated.
62.9% 63.9% 63.9% 66.3% 66.5% 64.0% 63.7% 63.4% 62.9% 62.7%
29.0% 27.9% 27.8% 25.6% 25.6% 28.2% 28.5% 28.8% 29.1% 29.3%
8.1% 8.1% 8.4% 8.1% 7.9% 7.8% 7.8% 7.8% 8.0% 8.0%
0%
10%
20%
30%
40%
50%
60%
70%
80%
90%
100%
2008 2009 2010 2011 2012 2013 2014 2015 2016 2017
Perc
en
tag
e o
f n
urs
es
em
plo
ye
d i
n
nu
rsin
g i
n O
nta
rio
Year
Casual
Part-time
Full-time
2,624
2,949
3,111
5,064
5,532
6,207
6,483
6,770
6,633
6,636
19,979
20,976
22,183
23,187
25,075
26,807
29,062
31,317
33,805
35,566
67,092
66,454
65,789
66,365
65,080
65,976
66,676
66,868
67,452
67,335
26,807
28,202
29,625
27,628
27,461
27,733
27,729
27,161
26,791
26,203
3,754
4,502
5,128
4,156
4,455
5,005
5,330
5,409
5,486
5,577
0% 10% 20% 30% 40% 50% 60% 70% 80% 90% 100%
2008
2009
2010
2011
2012
2013
2014
2015
2016
2017
18–24 25–34 35–54 55–64 65+

College of Nurses of Ontario – Membership Statistics 2017 12
Figure 3.6 shows the gender distribution of nurses employed in nursing in
Ontario over the past 10 years.
Figure 3.6: Nurses employed in nursing in Ontario: Gender distribution
Figure 3.7 shows the location of nursing education for nurses employed in
nursing in Ontario.
Figure 3.7: Nurses employed in nursing in Ontario: Location of nursing
education
114,271 116,694 119,064 119,210 120,073 123,363 126,348 127,962 129,955 130,558
5,994 6,397 6,780 7,190 7,530 8,365 8,932 9,563 10,212 10,759
0%
10%
20%
30%
40%
50%
60%
70%
80%
90%
100%
2008 2009 2010 2011 2012 2013 2014 2015 2016 2017
Perc
en
tag
e o
f n
urs
es
em
plo
ye
d i
n n
urs
ing
in
On
tari
o
Year
Male
Female
Ontario:119,214 (84.4%)
International:15,457 (10.9%)
Other Canadian province or territory:6,629 (4.7%)
Not stated:17 (0.0%)

College of Nurses of Ontario – Membership Statistics 2017 13
4 REGISTERED NURSES IN THE GENERAL
CLASS
4.1 Employment status
Table 4.1 shows the employment statuses of RN General Class members over the
past five years.
Table 4.1: RN General Class members: Employment status
2013 2014 2015 2016 2017
# % # % # % # % # %
Employed in nursing 96,723 85.9 94,665 90.8 94,617 90.6 94,808 91.0 94,600 90.5
In Ontario 91,455 92,615 92,739 92,698 92,049
In and outside Ontario 596 694 673 720 743
Outside Ontario 4,665 1,349 1,205 1,390 1,808
Not stated 7 7 0 0 0
Employed in nursing & non-nursing
2,471 2.2 2,552 2.4 2,675 2.6 2,666 2.6 2,660 2.5
In Ontario 2,311 2,452 2,571 2,558 2,522
In and outside Ontario 24 26 24 28 36
Outside Ontario 136 74 80 80 102
Employed in non-nursing 2,971 2.6 829 0.8 831 0.8 662 0.6 625 0.6
Seeking nursing employment
629 452 479 407 379
Not employed 6,746 6.0 3,738 3.6 3,828 3.7 3,922 3.8 3,916 3.7
Seeking nursing employment
2,640 2,187 2,267 2,233 2,185
On leave 3,671 3.3 2,508 2.4 2,450 2.3 2,082 2.0 2,682 2.6
Not stated 0 0.0 6 0.0 0 0.0 0 0.0 0 0.0
Total 112,582 100 104,298 100 104,401 100 104,140 100 104,483 100
The College asks members not employed in nursing if they are seeking nursing
employment, and if so, if their employment preference is for full-time, part-time
or casual nursing employment.
Table 4.2 shows the employment preference of RNs in the General Class who are
seeking nursing employment.

College of Nurses of Ontario – Membership Statistics 2017 14
Table 4.2: RNs in the General Class seeking nursing employment:
Employment preference
2013 2014 2015 2016 2017
# % # % # % # % # %
Full-time 1,474 45.1 1,118 42.4 1,279 46.6 1,192 45.2 1,084 42.3
Part-time 951 29.1 785 29.7 787 28.7 760 28.8 801 31.2
Casual 842 25.8 736 27.9 678 24.7 686 26.0 677 26.4
Not stated 2 0.1 0 0.0 2 0.1 2 0.1 2 0.1
Total 3,269 100 2,639 100 2,746 100 2,640 100 2,564 100
4.2 Renewal gains and losses of Registered Nurses in the General Class8
Every year, some RN members join the College, get reinstated or join the
General Class from another class. These changes are gains to the General Class.
Some other RN members resign, join a different class or do not renew their
membership. These changes are losses to the General Class.9
Overall gains and losses of Registered Nurses in the General Class
Figure 4.1 shows the RN General Class gains and losses and Figure 4.2 shows
the RN General Class net gain/loss, both over the past 10 years.
During the 2014 renewal, there was a higher number of losses than usual in the
General Class, which was largely attributed to the new registration regulation
requirement: the declaration of practice.10 With this new requirement, members
could only renew in the General Class if they had:
practised nursing in Ontario within the past three years, or
registered or reinstated with the College within the past three years.
Members who did not meet these conditions could register in the Non-Practising
Class, resign their membership or have the College revoke their membership.
8 See Section 9.1 in Appendix 1: RNs in the General Class for more trends in RN General Class renewal gains and losses. 9 See Section 2.4.1 for more information about renewal gains and losses. 10 Visit www.cno.org/en/maintain-your-membership1/declaration-of-practice/ for more information about the declaration of practice requirement.

College of Nurses of Ontario – Membership Statistics 2017 15
Figure 4.1: RNs in the General Class: Gains and losses
Figure 4.2: RNs in the General Class: Net gain/loss
4,0054,029 4,098
4,127
4,7575,395
3,989
4,907
4,231
4,821
3,055 2,838
3,395
4,312
4,095 5,007
12,273
4,804
4,492
4,478
0
2,000
4,000
6,000
8,000
10,000
12,000
14,000
2008 2009 2010 2011 2012 2013 2014 2015 2016 2017
RN
Gen
era
l C
lass g
ain
s &
lo
sses
Year
Gain
Loss
950 1,191703
-185662 388
-8,284
103 -261343
-10,000
-8,000
-6,000
-4,000
-2,000
0
2,000
4,000
6,000
8,000
10,000
2008 2009 2010 2011 2012 2013 2014 2015 2016 2017
RN
Gen
era
l C
lass n
et
gain
/lo
ss
Year

College of Nurses of Ontario – Membership Statistics 2017 16
Renewal gains of Registered Nurses in the General Class
Figure 4.3 shows the categorization of the RN General Class gains over the past
10 years.
Figure 4.3: RN General Class gains: Categorization
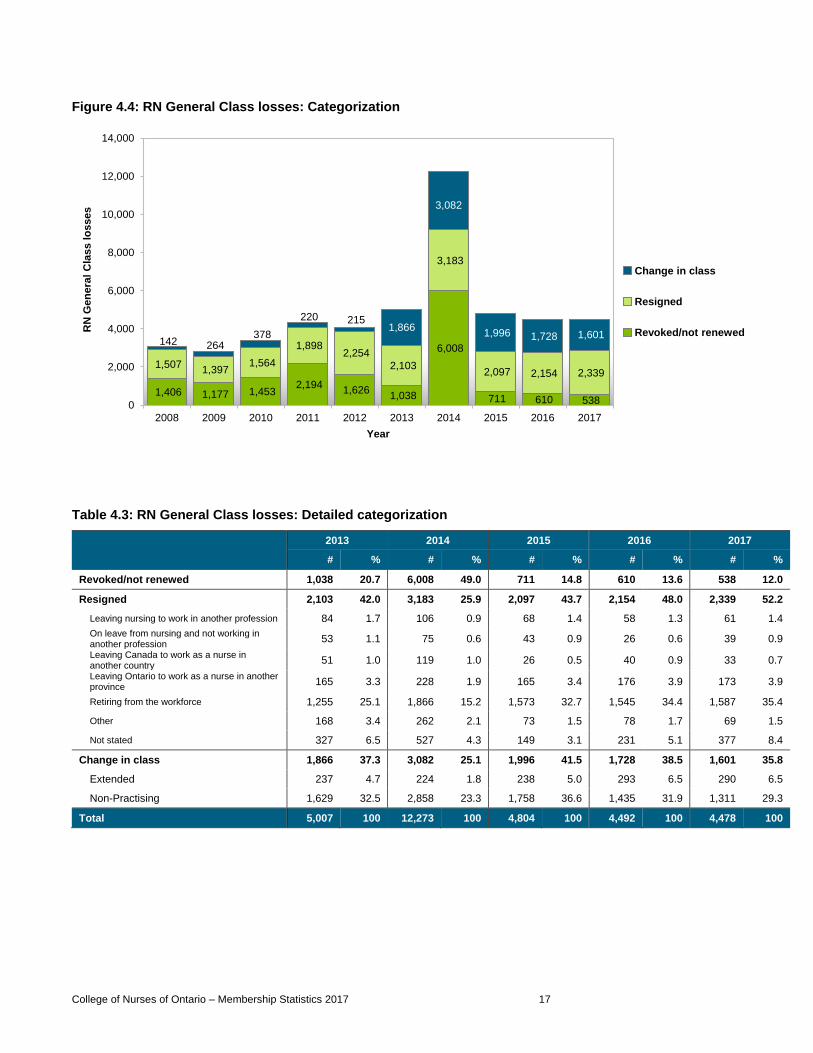
Renewal losses of Registered Nurses in the General Class
Figure 4.4 shows the categorization of the RN General Class losses over the past
10 years. Table 4.3 shows a more detailed categorization of losses over the past
five years.
For more tables about RN General Class losses, see Section 9.1.1.
3,267 3,388 3,536 3,522
4,183
4,838
3,766
4,611
3,920 4,507
738 641 562 604
574
550
176
243
180
192
47
53
131
122
0
1,000
2,000
3,000
4,000
5,000
6,000
2008 2009 2010 2011 2012 2013 2014 2015 2016 2017
RN
Gen
era
l C
lass g
ain
s
Year
Change in class
Reinstatements
New members
College of Nurses of Ontario – Membership Statistics 2017 17
Figure 4.4: RN General Class losses: Categorization
Table 4.3: RN General Class losses: Detailed categorization
2013 2014 2015 2016 2017
# % # % # % # % # %
Revoked/not renewed 1,038 20.7 6,008 49.0 711 14.8 610 13.6 538 12.0
Resigned 2,103 42.0 3,183 25.9 2,097 43.7 2,154 48.0 2,339 52.2
Leaving nursing to work in another profession 84 1.7 106 0.9 68 1.4 58 1.3 61 1.4
On leave from nursing and not working in another profession 53 1.1 75 0.6 43 0.9 26 0.6 39 0.9
Leaving Canada to work as a nurse in another country
51 1.0 119 1.0 26 0.5 40 0.9 33 0.7
Leaving Ontario to work as a nurse in another province
165 3.3 228 1.9 165 3.4 176 3.9 173 3.9
Retiring from the workforce 1,255 25.1 1,866 15.2 1,573 32.7 1,545 34.4 1,587 35.4
Other 168 3.4 262 2.1 73 1.5 78 1.7 69 1.5
Not stated 327 6.5 527 4.3 149 3.1 231 5.1 377 8.4
Change in class 1,866 37.3 3,082 25.1 1,996 41.5 1,728 38.5 1,601 35.8
Extended 237 4.7 224 1.8 238 5.0 293 6.5 290 6.5
Non-Practising 1,629 32.5 2,858 23.3 1,758 36.6 1,435 31.9 1,311 29.3
Total 5,007 100 12,273 100 4,804 100 4,492 100 4,478 100
1,406 1,177 1,453 2,194
1,626 1,038
6,008
711 610 538
1,507 1,397
1,564
1,898 2,254
2,103
3,183
2,097 2,154 2,339
142 264 378
220 215 1,866
3,082
1,996 1,728 1,601
0
2,000
4,000
6,000
8,000
10,000
12,000
14,000
2008 2009 2010 2011 2012 2013 2014 2015 2016 2017
RN
Gen
era
l C
lass l
osses
Year
Change in class
Resigned
Revoked/not renewed

College of Nurses of Ontario – Membership Statistics 2017 18
4.3 Registered Nurses in the General Class employed in nursing in Ontario
Figure 4.5 shows the number of RNs in the General Class employed in nursing in
Ontario over the past 10 years.
Figure 4.5: Number of RNs in the General Class employed in nursing in
Ontario
Table 4.4 shows the overall working statuses of RNs in the General Class
employed in nursing in Ontario over the past five years.11
Table 4.4: RNs in the General Class employed in nursing in Ontario: Overall
working status
2013 2014 2015 2016 2017
# % # % # % # % # %
Full-time 62,554 66.3 63,544 66.3 63,669 66.3 63,591 66.2 63,138 66.2
Part-time 24,609 26.1 25,114 26.2 25,237 26.3 25,239 26.3 25,197 26.4
Casual 7,223 7.7 7,129 7.4 7,101 7.4 7,174 7.5 7,012 7.4
Not stated 0 0.0 0 0.0 0 0.0 0 0.0 3 0.0
Total 94,386 100 95,787 100 96,007 100 96,004 100 95,350 100
11 See Section 2.4.3 for information about overall working status.
91,965
93,171
93,916
93,315 92,879
94,386
95,787 96,007 96,004
95,350
89,000
90,000
91,000
92,000
93,000
94,000
95,000
96,000
97,000
2008 2009 2010 2011 2012 2013 2014 2015 2016 2017
RN
s i
n t
he G
en
era
l C
lass e
mp
loye
d i
n n
urs
ing
in
O
nta
rio
Year
College of Nurses of Ontario – Membership Statistics 2017 19
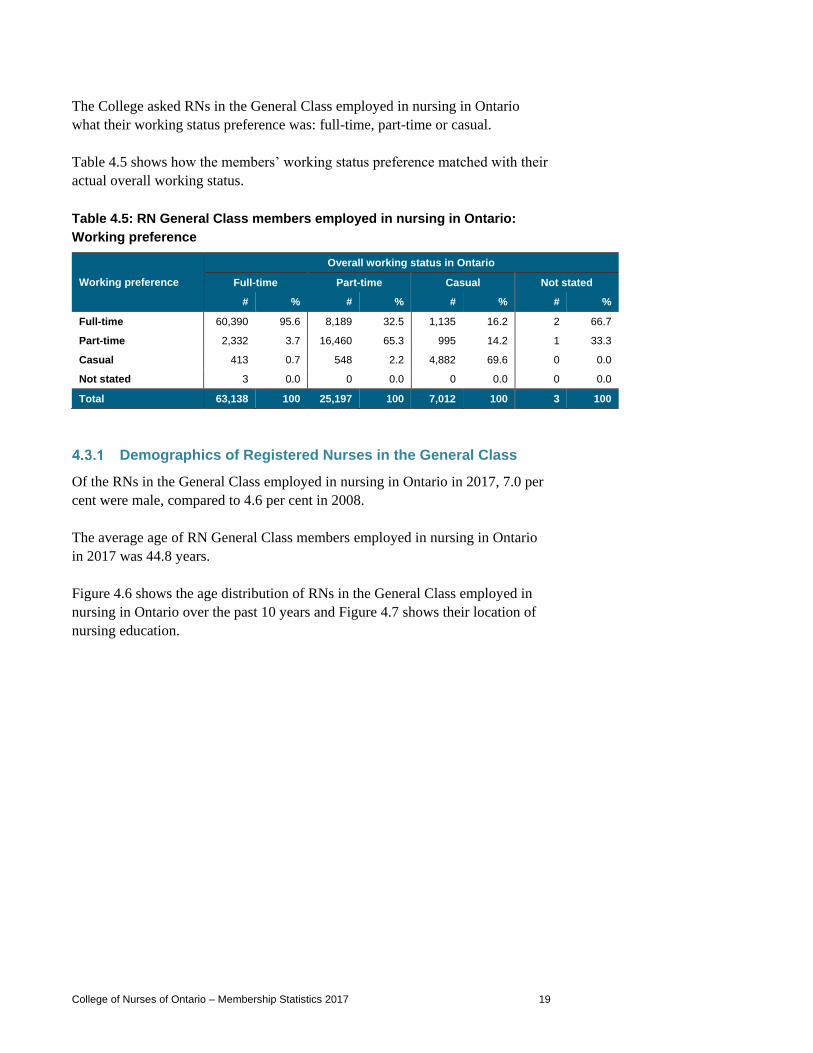
The College asked RNs in the General Class employed in nursing in Ontario
what their working status preference was: full-time, part-time or casual.
Table 4.5 shows how the members’ working status preference matched with their
actual overall working status.
Table 4.5: RN General Class members employed in nursing in Ontario:
Working preference
Working preference
Overall working status in Ontario
Full-time Part-time Casual Not stated
# % # % # % # %
Full-time 60,390 95.6 8,189 32.5 1,135 16.2 2 66.7
Part-time 2,332 3.7 16,460 65.3 995 14.2 1 33.3
Casual 413 0.7 548 2.2 4,882 69.6 0 0.0
Not stated 3 0.0 0 0.0 0 0.0 0 0.0
Total 63,138 100 25,197 100 7,012 100 3 100
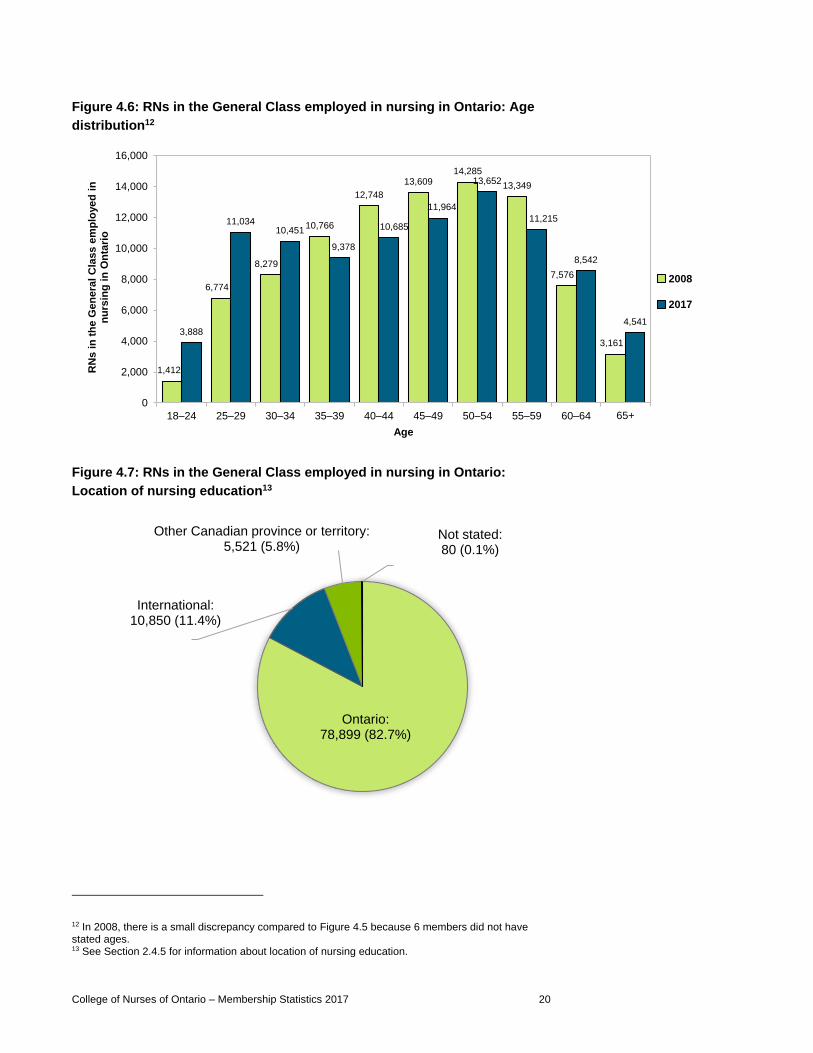
Demographics of Registered Nurses in the General Class
Of the RNs in the General Class employed in nursing in Ontario in 2017, 7.0 per
cent were male, compared to 4.6 per cent in 2008.
The average age of RN General Class members employed in nursing in Ontario
in 2017 was 44.8 years.
Figure 4.6 shows the age distribution of RNs in the General Class employed in
nursing in Ontario over the past 10 years and Figure 4.7 shows their location of
nursing education.
College of Nurses of Ontario – Membership Statistics 2017 20
Figure 4.6: RNs in the General Class employed in nursing in Ontario: Age
distribution12
Figure 4.7: RNs in the General Class employed in nursing in Ontario:
Location of nursing education13
12 In 2008, there is a small discrepancy compared to Figure 4.5 because 6 members did not have stated ages. 13 See Section 2.4.5 for information about location of nursing education.
1,412
6,774
8,279
10,766
12,748
13,60914,285
13,349
7,576
3,161
3,888
11,03410,451
9,378
10,685
11,964
13,652
11,215
8,542
4,541
0
2,000
4,000
6,000
8,000
10,000
12,000
14,000
16,000
18–24 25–29 30–34 35–39 40–44 45–49 50–54 55–59 60–64 65+
RN
s i
n t
he G
en
era
l C
lass e
mp
loye
d i
n
nu
rsin
g i
n O
nta
rio
Age
2008
2017
Ontario:78,899 (82.7%)
International:10,850 (11.4%)
Other Canadian province or territory:5,521 (5.8%)
Not stated:80 (0.1%)
College of Nurses of Ontario – Membership Statistics 2017 21
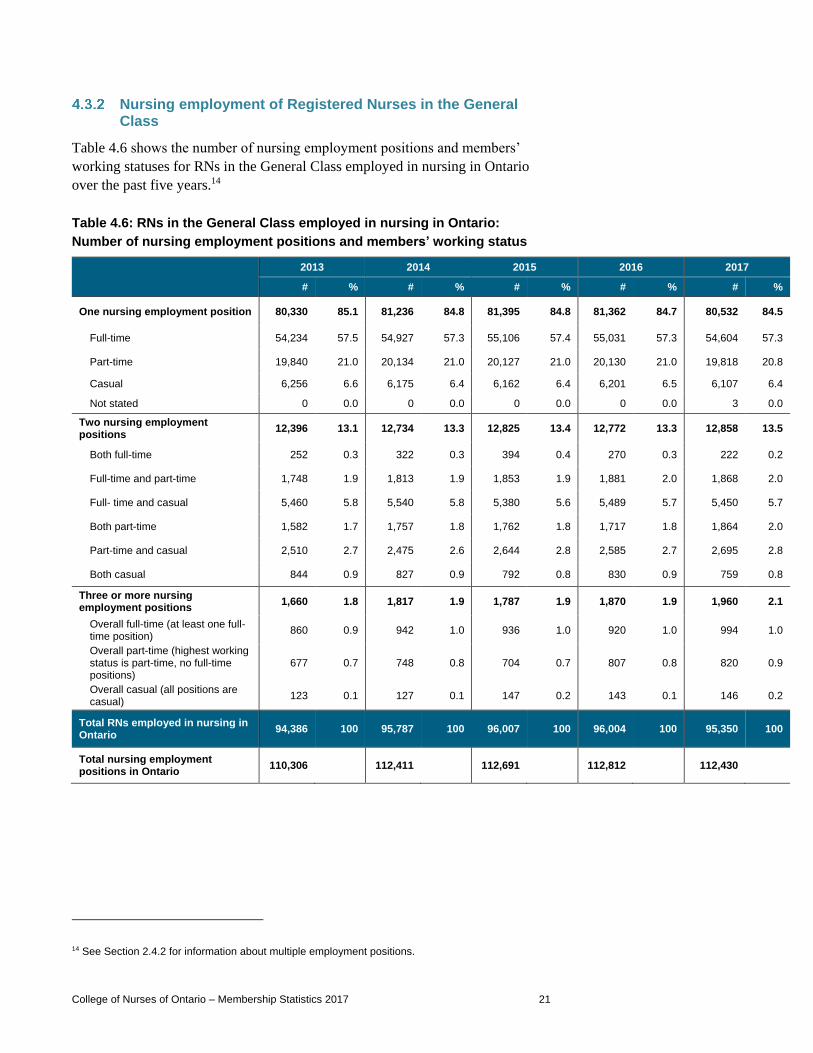
Nursing employment of Registered Nurses in the General Class
Table 4.6 shows the number of nursing employment positions and members’
working statuses for RNs in the General Class employed in nursing in Ontario
over the past five years.14
Table 4.6: RNs in the General Class employed in nursing in Ontario:
Number of nursing employment positions and members’ working status
2013 2014 2015 2016 2017
# % # % # % # % # %
One nursing employment position 80,330 85.1 81,236 84.8 81,395 84.8 81,362 84.7 80,532 84.5
Full-time 54,234 57.5 54,927 57.3 55,106 57.4 55,031 57.3 54,604 57.3
Part-time 19,840 21.0 20,134 21.0 20,127 21.0 20,130 21.0 19,818 20.8
Casual 6,256 6.6 6,175 6.4 6,162 6.4 6,201 6.5 6,107 6.4
Not stated 0 0.0 0 0.0 0 0.0 0 0.0 3 0.0
Two nursing employment positions
12,396 13.1 12,734 13.3 12,825 13.4 12,772 13.3 12,858 13.5
Both full-time 252 0.3 322 0.3 394 0.4 270 0.3 222 0.2
Full-time and part-time 1,748 1.9 1,813 1.9 1,853 1.9 1,881 2.0 1,868 2.0
Full- time and casual 5,460 5.8 5,540 5.8 5,380 5.6 5,489 5.7 5,450 5.7
Both part-time 1,582 1.7 1,757 1.8 1,762 1.8 1,717 1.8 1,864 2.0
Part-time and casual 2,510 2.7 2,475 2.6 2,644 2.8 2,585 2.7 2,695 2.8
Both casual 844 0.9 827 0.9 792 0.8 830 0.9 759 0.8
Three or more nursing employment positions
1,660 1.8 1,817 1.9 1,787 1.9 1,870 1.9 1,960 2.1
Overall full-time (at least one full-time position)
860 0.9 942 1.0 936 1.0 920 1.0 994 1.0
Overall part-time (highest working status is part-time, no full-time positions)
677 0.7 748 0.8 704 0.7 807 0.8 820 0.9
Overall casual (all positions are casual)
123 0.1 127 0.1 147 0.2 143 0.1 146 0.2
Total RNs employed in nursing in Ontario
94,386 100 95,787 100 96,007 100 96,004 100 95,350 100
Total nursing employment positions in Ontario
110,306 112,411 112,691 112,812 112,430
14 See Section 2.4.2 for information about multiple employment positions.
College of Nurses of Ontario – Membership Statistics 2017 22
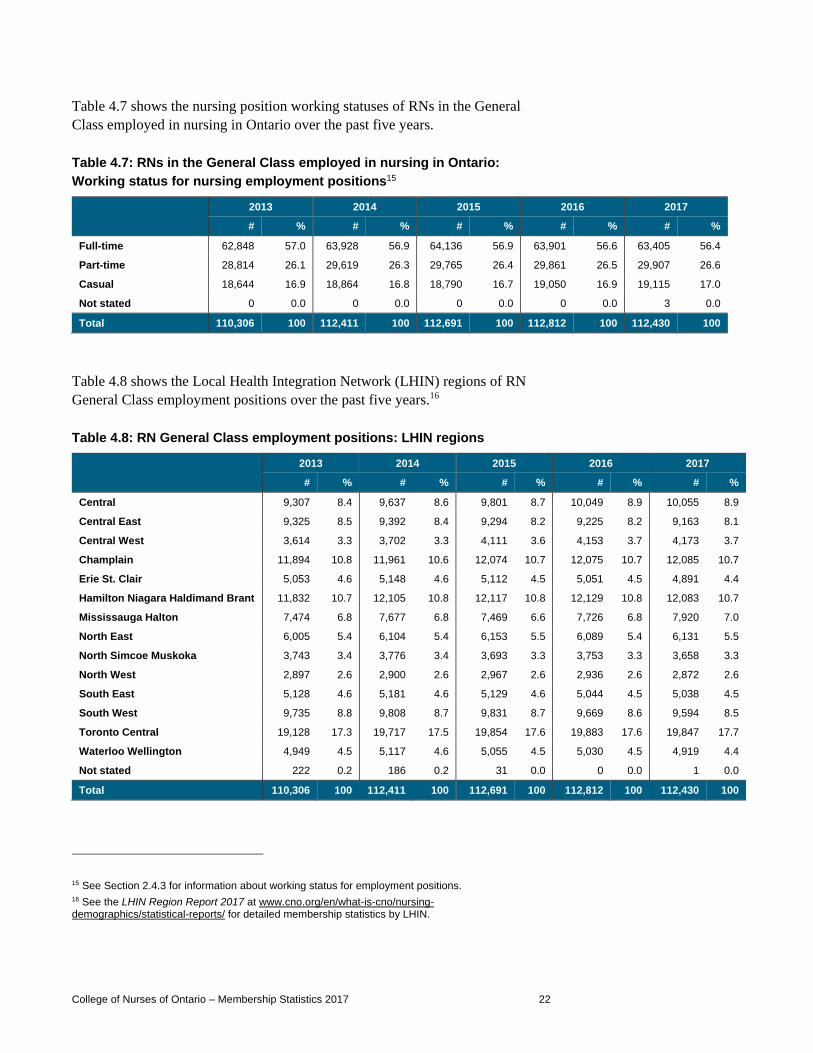
Table 4.7 shows the nursing position working statuses of RNs in the General
Class employed in nursing in Ontario over the past five years.
Table 4.7: RNs in the General Class employed in nursing in Ontario:
Working status for nursing employment positions15
2013 2014 2015 2016 2017
# % # % # % # % # %
Full-time 62,848 57.0 63,928 56.9 64,136 56.9 63,901 56.6 63,405 56.4
Part-time 28,814 26.1 29,619 26.3 29,765 26.4 29,861 26.5 29,907 26.6
Casual 18,644 16.9 18,864 16.8 18,790 16.7 19,050 16.9 19,115 17.0
Not stated 0 0.0 0 0.0 0 0.0 0 0.0 3 0.0
Total 110,306 100 112,411 100 112,691 100 112,812 100 112,430 100
Table 4.8 shows the Local Health Integration Network (LHIN) regions of RN
General Class employment positions over the past five years.16
Table 4.8: RN General Class employment positions: LHIN regions
2013 2014 2015 2016 2017
# % # % # % # % # %
Central 9,307 8.4 9,637 8.6 9,801 8.7 10,049 8.9 10,055 8.9
Central East 9,325 8.5 9,392 8.4 9,294 8.2 9,225 8.2 9,163 8.1
Central West 3,614 3.3 3,702 3.3 4,111 3.6 4,153 3.7 4,173 3.7
Champlain 11,894 10.8 11,961 10.6 12,074 10.7 12,075 10.7 12,085 10.7
Erie St. Clair 5,053 4.6 5,148 4.6 5,112 4.5 5,051 4.5 4,891 4.4
Hamilton Niagara Haldimand Brant 11,832 10.7 12,105 10.8 12,117 10.8 12,129 10.8 12,083 10.7
Mississauga Halton 7,474 6.8 7,677 6.8 7,469 6.6 7,726 6.8 7,920 7.0
North East 6,005 5.4 6,104 5.4 6,153 5.5 6,089 5.4 6,131 5.5
North Simcoe Muskoka 3,743 3.4 3,776 3.4 3,693 3.3 3,753 3.3 3,658 3.3
North West 2,897 2.6 2,900 2.6 2,967 2.6 2,936 2.6 2,872 2.6
South East 5,128 4.6 5,181 4.6 5,129 4.6 5,044 4.5 5,038 4.5
South West 9,735 8.8 9,808 8.7 9,831 8.7 9,669 8.6 9,594 8.5
Toronto Central 19,128 17.3 19,717 17.5 19,854 17.6 19,883 17.6 19,847 17.7
Waterloo Wellington 4,949 4.5 5,117 4.6 5,055 4.5 5,030 4.5 4,919 4.4
Not stated 222 0.2 186 0.2 31 0.0 0 0.0 1 0.0
Total 110,306 100 112,411 100 112,691 100 112,812 100 112,430 100
15 See Section 2.4.3 for information about working status for employment positions. 16 See the LHIN Region Report 2017 at www.cno.org/en/what-is-cno/nursing-demographics/statistical-reports/ for detailed membership statistics by LHIN.

College of Nurses of Ontario – Membership Statistics 2017 23
4.4 Registered Nurses in the General Class employed in nursing outside of Ontario17
In 2013, the College created the Non-Practising Class. As a result, during the
2014 renewal, members of the General and Extended Classes who had not
practised nursing in Ontario in the previous three years were required to either
register in the Non-Practising Class or resign their membership.18 Due to this, the
number of RNs in the General Class employed in nursing outside Ontario
decreased from 5,979 for 2013 to 2,397 for 2014.
Table 4.9 shows the employment position locations for RNs in the General Class
employed in nursing outside Ontario over the past five years.
Table 4.9: RNs in the General Class employed in nursing outside Ontario:
Employment position locations
2013 2014 2015 2016 2017
# %† # %† # %† # %† # %†
Alberta 277 12.0 174 13.1 181 14.3 204 14.8 191 12.8
British Columbia 361 15.6 227 17.1 178 14.1 230 16.7 285 19.2
Manitoba 222 9.6 160 12.0 177 14.0 186 13.5 201 13.5
New Brunswick 65 2.8 32 2.4 36 2.9 44 3.2 45 3.0
Newfoundland and Labrador 23 1.0 11 0.8 16 1.3 19 1.4 26 1.7
Northwest Territories 38 1.6 25 1.9 27 2.1 34 2.5 44 3.0
Nova Scotia 75 3.3 52 3.9 52 4.1 68 4.9 88 5.9
Nunavut 62 2.7 43 3.2 44 3.5 41 3.0 44 3.0
Prince Edward Island 19 0.8 14 1.1 7 0.6 10 0.7 17 1.1
Quebec 1,064 46.1 498 37.5 469 37.2 469 34.1 471 31.7
Saskatchewan 82 3.6 71 5.3 57 4.5 57 4.1 61 4.1
Yukon 19 0.8 21 1.6 18 1.4 13 0.9 15 1.0
# % # % # % # % # %
Canada total 2,307 38.6 1,328 55.4 1,262 57.4 1,375 55.9 1,488 51.0
United States 3,086 51.6 840 35.0 767 34.9 886 36.0 1,171 40.1
Other (outside Canada & United States) 569 9.5 194 8.1 169 7.7 197 8.0 259 8.9
Not stated (outside Ontario) 17 0.3 35 1.5 0 0.0 0 0.0 0 0.0
Total 5,979 100 2,397 100 2,198 100 2,458 100 2,918 100
†Percentage of Canada total
17 Employed in nursing outside Ontario includes all members who reported at least one nursing employment position outside Ontario. 18 See Section 2.3.3 for more information about the Non-Practising Class.

College of Nurses of Ontario – Membership Statistics 2017 24
4.5 Registered Nurses in the General Class who are registered in other jurisdictions
Members of the College can be registered in multiple jurisdictions. The following
tables present data on Canadian, U.S. and international jurisdictions where RNs
in the General Class are registered.
In 2017, 7,505 (7.2 per cent) of RNs in the General Class were registered in other
jurisdictions, totalling 8,805 registrations.
Table 4.10: RNs in the General Class: Concurrent registration locations in
Canada
Province 2016 2017
# % # %
Alberta 246 13.2 284 12.6
British Columbia 363 19.5 458 20.3
Manitoba 211 11.4 240 10.6
New Brunswick 40 2.2 50 2.2
Newfoundland and Labrador 38 2.0 53 2.3
Northwest Territories 71 3.8 86 3.8
Nova Scotia 86 4.6 115 5.1
Nunavut 143 7.7 163 7.2
Prince Edward Island 13 0.7 20 0.9
Quebec 526 28.3 627 27.8
Saskatchewan 92 4.9 124 5.5
Yukon 30 1.6 38 1.7
Canada total 1,859 100 2,258 100

College of Nurses of Ontario – Membership Statistics 2017 25
Table 4.11: RNs in the General Class: Top 10 concurrent registration
locations within the U.S.
State 2016
State 2017
# % # %
Michigan 1,396 37.7 Michigan 1,609 37.9
Minnesota 477 12.9 Minnesota 527 12.4
New York 449 12.1 New York 510 12.0
Florida 332 9.0 Florida 335 7.9
California 260 7.0 California 290 6.8
Texas 162 4.4 Texas 218 5.1
North Carolina 55 1.5 Arizona 60 1.4
Arizona 46 1.2 North Carolina 58 1.4
Massachusetts 42 1.1 Illinois 56 1.3
Connecticut 41 1.1 Massachusetts 46 1.1
Other states 444 12.0 Other states 531 12.5
United States total 3,704 100 United States total 4,240 100
Table 4.12: RNs in the General Class: Top 10 international concurrent
registration locations
Country 2016
Country 2017
# % # %
India 432 22.2 India 575 24.9
United Kingdom 204 10.5 Philippines 231 10.0
Philippines 186 9.5 United Kingdom 188 8.1
Australia 160 8.2 Australia 174 7.5
Israel 130 6.7 Israel 151 6.5
Hong Kong 123 6.3 Hong Kong 133 5.8
Iran 54 2.8 Iran 79 3.4
South Korea 44 2.3 South Korea 55 2.4
Jamaica 37 1.9 Jamaica 50 2.2
Saudi Arabia 33 1.7 United Arab Emirates
42 1.8
Other countries 545 28.0 Other countries 629 27.3
International total 1,948 100 International total 2,307 100

College of Nurses of Ontario – Membership Statistics 2017 26
4.6 Appendix table references for Registered Nurses in the General Class
Table 9.1: Gains and losses ................................................................................................................. 66
Table 9.2: Type of gain ........................................................................................................................ 66
Table 9.3: Gains by age group ............................................................................................................. 67
Table 9.4: Type of loss ......................................................................................................................... 67
Table 9.5: Losses by age group ........................................................................................................... 68
Table 9.6: Loss reasons by age group ................................................................................................. 69
Table 9.7: Employment status of losses in the previous practice year ................................................ 70
Table 9.8: Losses by employment status during previous practice year: Categorization .................... 71
Table 9.9: Nursing employers in Ontario: RN General Class .............................................................. 74
Table 9.10: Nursing positions in Ontario: RN General Class ............................................................... 75
Table 9.11: Areas of practice in Ontario: RN General Class ............................................................... 76

College of Nurses of Ontario – Membership Statistics 2017 27
5 REGISTERED NURSES IN THE NON-PRACTISING CLASS
The College established the Non-Practising Class on Jan. 1, 2013, so members
were first able to renew in this class during the 2014 renewal. The Non-Practising
Class includes RN members who were formerly members of the General,
Extended or Retired Classes.
5.1 Employment status
Table 5.1 shows the employment statuses of RN Non-Practising Class members
over the past four years.
Table 5.1: RNs in the Non-Practising Class: Employment status
2014 2015 2016 2017
# % # % # % # %
Employed in nursing outside Ontario 1,309 28.3 2,801 33.3 2,936 33.3 3,001 33.8
Employed in nursing & non-nursing outside Ontario 21 0.5 27 0.3 58 0.7 58 0.7
Employed in non-nursing 795 17.2 1,518 18.0 1,555 17.6 1,498 16.9
Seeking nursing employment 25 0.5 72 0.9 44 0.5 41 0.5
Not employed 2,176 47.0 3,355 39.9 3,569 40.4 3,597 40.5
Seeking nursing employment 80 1.7 151 1.8 197 2.2 188 2.1
On leave 326 7.0 716 8.5 712 8.1 731 8.2
Total 4,627 100 8,417 100 8,830 100 8,885 100
5.2 Renewal gains and losses of Registered Nurses in the Non-Practising Class
Every year, some RN members get reinstated or join the Non-Practising Class
from another class. These changes are gains to the Non-Practising Class. Some
other RN members resign, join a different class or do not renew their
membership. These changes are losses to the Non-Practising Class.19
Table 5.2 shows the RN Non-Practising Class gains and losses and the net
gain/loss over the past four years.
19 See Section 2.4.1 for more information about renewal gains and losses.
College of Nurses of Ontario – Membership Statistics 2017 28
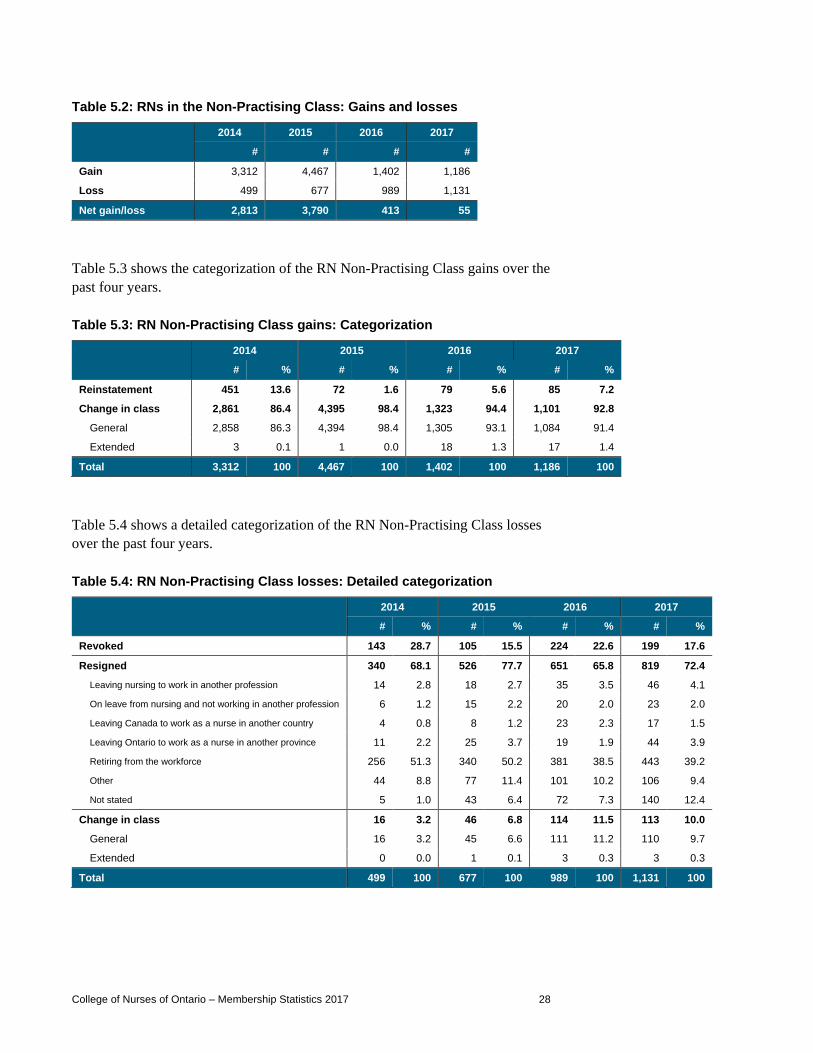
Table 5.2: RNs in the Non-Practising Class: Gains and losses
2014 2015 2016 2017
# # # #
Gain 3,312 4,467 1,402 1,186
Loss 499 677 989 1,131
Net gain/loss 2,813 3,790 413 55
Table 5.3 shows the categorization of the RN Non-Practising Class gains over the
past four years.
Table 5.3: RN Non-Practising Class gains: Categorization
2014 2015 2016 2017
# % # % # % # %
Reinstatement 451 13.6 72 1.6 79 5.6 85 7.2
Change in class 2,861 86.4 4,395 98.4 1,323 94.4 1,101 92.8
General 2,858 86.3 4,394 98.4 1,305 93.1 1,084 91.4
Extended 3 0.1 1 0.0 18 1.3 17 1.4
Total 3,312 100 4,467 100 1,402 100 1,186 100
Table 5.4 shows a detailed categorization of the RN Non-Practising Class losses
over the past four years.
Table 5.4: RN Non-Practising Class losses: Detailed categorization
2014 2015 2016 2017
# % # % # % # %
Revoked 143 28.7 105 15.5 224 22.6 199 17.6
Resigned 340 68.1 526 77.7 651 65.8 819 72.4
Leaving nursing to work in another profession 14 2.8 18 2.7 35 3.5 46 4.1
On leave from nursing and not working in another profession 6 1.2 15 2.2 20 2.0 23 2.0
Leaving Canada to work as a nurse in another country 4 0.8 8 1.2 23 2.3 17 1.5
Leaving Ontario to work as a nurse in another province 11 2.2 25 3.7 19 1.9 44 3.9
Retiring from the workforce 256 51.3 340 50.2 381 38.5 443 39.2
Other 44 8.8 77 11.4 101 10.2 106 9.4
Not stated 5 1.0 43 6.4 72 7.3 140 12.4
Change in class 16 3.2 46 6.8 114 11.5 113 10.0
General 16 3.2 45 6.6 111 11.2 110 9.7
Extended 0 0.0 1 0.1 3 0.3 3 0.3
Total 499 100 677 100 989 100 1,131 100
College of Nurses of Ontario – Membership Statistics 2017 29
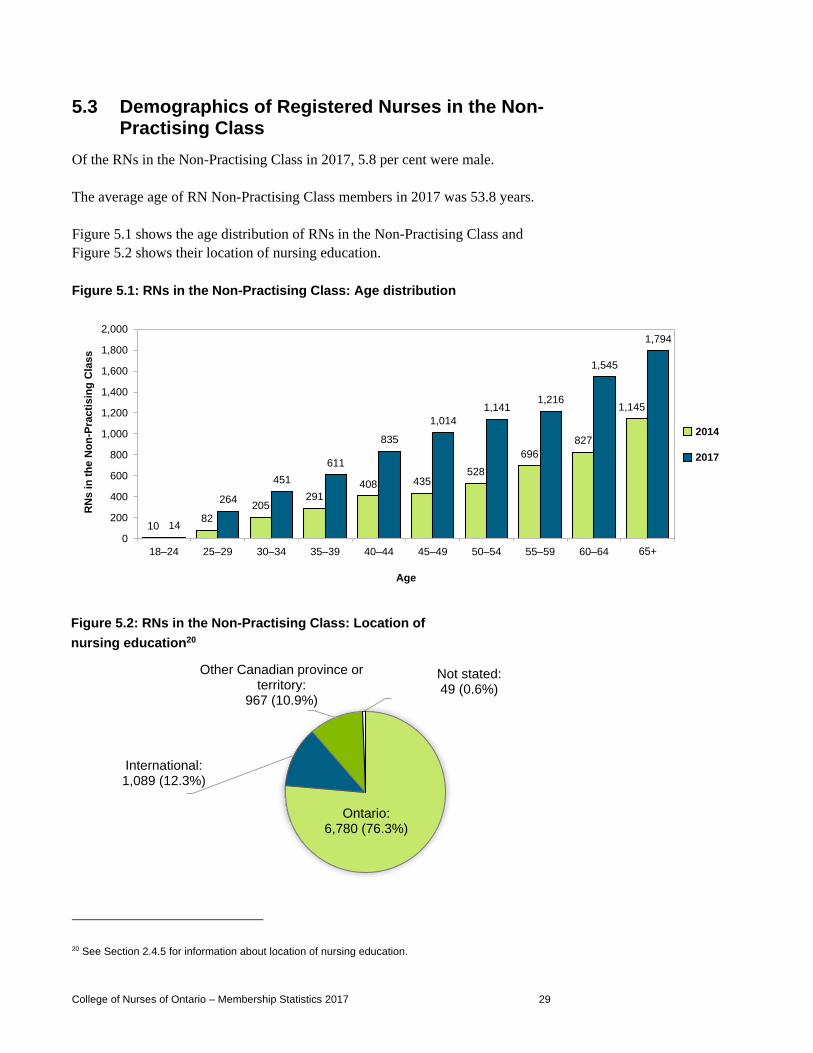
5.3 Demographics of Registered Nurses in the Non-Practising Class
Of the RNs in the Non-Practising Class in 2017, 5.8 per cent were male.
The average age of RN Non-Practising Class members in 2017 was 53.8 years.
Figure 5.1 shows the age distribution of RNs in the Non-Practising Class and
Figure 5.2 shows their location of nursing education.
Figure 5.1: RNs in the Non-Practising Class: Age distribution
Figure 5.2: RNs in the Non-Practising Class: Location of
nursing education20
20 See Section 2.4.5 for information about location of nursing education.
Ontario:6,780 (76.3%)
International: 1,089 (12.3%)
Other Canadian province or territory:
967 (10.9%)
Not stated:49 (0.6%)
1082
205291
408 435528
696
827
1,145
14
264
451
611
835
1,014
1,1411,216
1,545
1,794
0
200
400
600
800
1,000
1,200
1,400
1,600
1,800
2,000
18–24 25–29 30–34 35–39 40–44 45–49 50–54 55–59 60–64 65+
RN
s i
n t
he N
on
-Pra
cti
sin
g C
lass
2014
2017
Age

College of Nurses of Ontario – Membership Statistics 2017 30
5.4 Registered Nurses in the Non-Practising Class employed in nursing outside of Ontario21
Table 5.5 shows the employment position locations for RNs in the Non-
Practising Class employed in nursing outside Ontario over the past four years.
Table 5.5: RNs in the Non-Practising Class employed in nursing outside
Ontario: Employment position locations
2014 2015 2016 2017
# %† # %† # %† # %†
Alberta 59 12.6 149 15.7 196 17.7 197 17.0
British Columbia 79 16.9 138 14.5 192 17.3 195 16.9
Manitoba 24 5.1 52 5.5 72 6.5 82 7.1
New Brunswick 5 1.1 13 1.4 15 1.4 17 1.5
Newfoundland and Labrador 4 0.9 9 0.9 8 0.7 11 1.0
Northwest Territories 5 1.1 13 1.4 16 1.4 18 1.6
Nova Scotia 19 4.1 30 3.2 33 3.0 36 3.1
Nunavut 5 1.1 14 1.5 14 1.3 13 1.1
Prince Edward Island 2 0.4 4 0.4 5 0.5 8 0.7
Quebec 252 53.8 487 51.3 499 45.0 493 42.6
Saskatchewan 11 2.4 38 4.0 54 4.9 77 6.7
Yukon 3 0.6 3 0.3 6 0.5 9 0.8
# % # % # % # %
Canada total 468 32.3 950 30.4 1,110 33.3 1,156 33.9
United States 870 60.1 1,885 60.4 1,935 58.0 1,943 57.0
Other (outside Canada & United States) 109 7.5 287 9.2 293 8.8 309 9.1
Total 1,447 100 3,122 100 3,338 100 3,408 100
†Percentage of Canada total
21 Employed in nursing outside Ontario includes all members who reported at least one nursing employment position outside Ontario.
College of Nurses of Ontario – Membership Statistics 2017 31
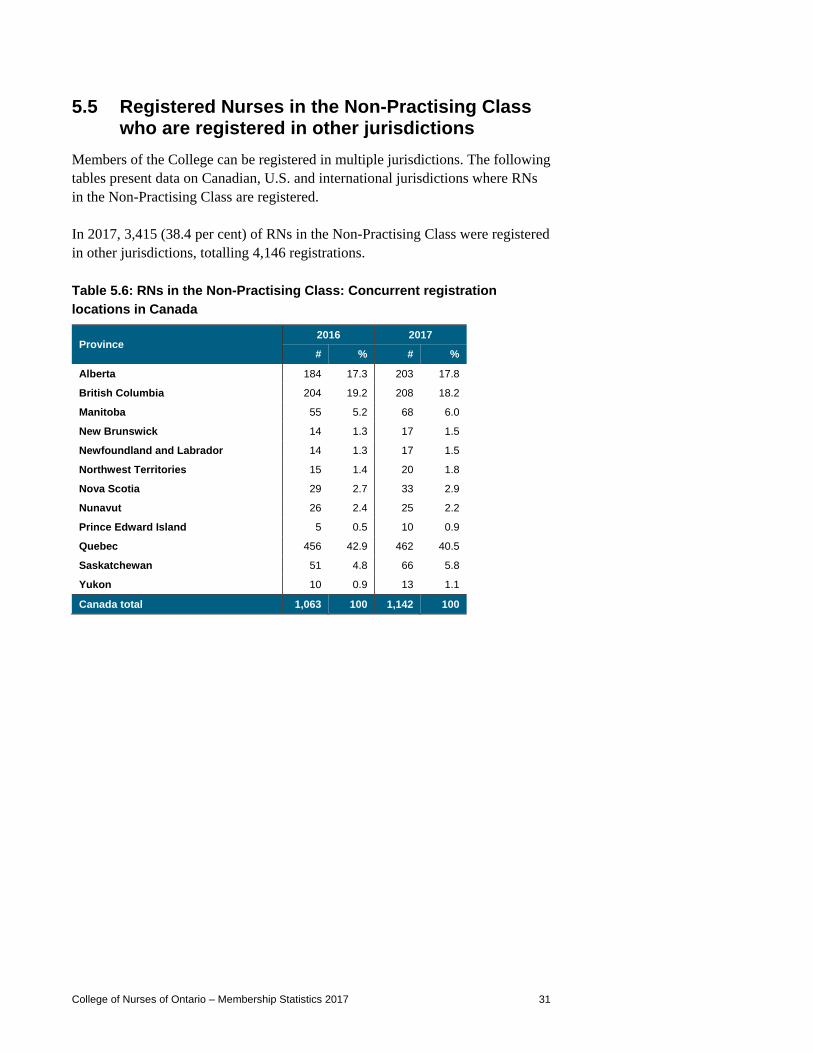
5.5 Registered Nurses in the Non-Practising Class who are registered in other jurisdictions
Members of the College can be registered in multiple jurisdictions. The following
tables present data on Canadian, U.S. and international jurisdictions where RNs
in the Non-Practising Class are registered.
In 2017, 3,415 (38.4 per cent) of RNs in the Non-Practising Class were registered
in other jurisdictions, totalling 4,146 registrations.
Table 5.6: RNs in the Non-Practising Class: Concurrent registration
locations in Canada
Province 2016 2017
# % # %
Alberta 184 17.3 203 17.8
British Columbia 204 19.2 208 18.2
Manitoba 55 5.2 68 6.0
New Brunswick 14 1.3 17 1.5
Newfoundland and Labrador 14 1.3 17 1.5
Northwest Territories 15 1.4 20 1.8
Nova Scotia 29 2.7 33 2.9
Nunavut 26 2.4 25 2.2
Prince Edward Island 5 0.5 10 0.9
Quebec 456 42.9 462 40.5
Saskatchewan 51 4.8 66 5.8
Yukon 10 0.9 13 1.1
Canada total 1,063 100 1,142 100

College of Nurses of Ontario – Membership Statistics 2017 32
Table 5.7: RNs in the Non-Practising Class: Top 10 concurrent registration
locations within the U.S.
State 2016
State 2017
# % # %
Michigan 635 25.7 Michigan 660 25.9
California 336 13.6 California 345 13.6
Florida 298 12.1 Florida 287 11.3
Texas 204 8.3 Texas 215 8.4
New York 164 6.6 New York 180 7.1
North Carolina 93 3.8 North Carolina 94 3.7
Arizona 60 2.4 Minnesota 69 2.7
Minnesota 57 2.3 Arizona 60 2.4
Georgia 44 1.8 Washington 47 1.8
Washington 43 1.7 Pennsylvania 45 1.8
Other states 533 21.6 Other states 544 21.4
United States total 2,467 100 United States total 2,546 100
Table 5.8: RNs in the Non-Practising Class: Top 10 international concurrent
registration locations
Country 2016
Country 2017
# % # %
Hong Kong 73 17.7 Hong Kong 78 17.0
Australia 71 17.2 Australia 76 16.6
United Kingdom 65 15.7 United Kingdom 66 14.4
Saudi Arabia 24 5.8 India 27 5.9
Philippines 19 4.6 Saudi Arabia 24 5.2
New Zealand 16 3.9 Philippines 20 4.4
India 16 3.9 New Zealand 18 3.9
Bermuda 13 3.1 Bermuda 13 2.8
United Arab Emirates 8 1.9 Israel 11 2.4
Ireland 8 1.9 United Arab Emirates
10 2.2
Other countries 100 24.2 Other countries 115 25.1
International total 413 100 International total 458 100
College of Nurses of Ontario – Membership Statistics 2017 33
6 REGISTERED PRACTICAL NURSES IN THE
GENERAL CLASS
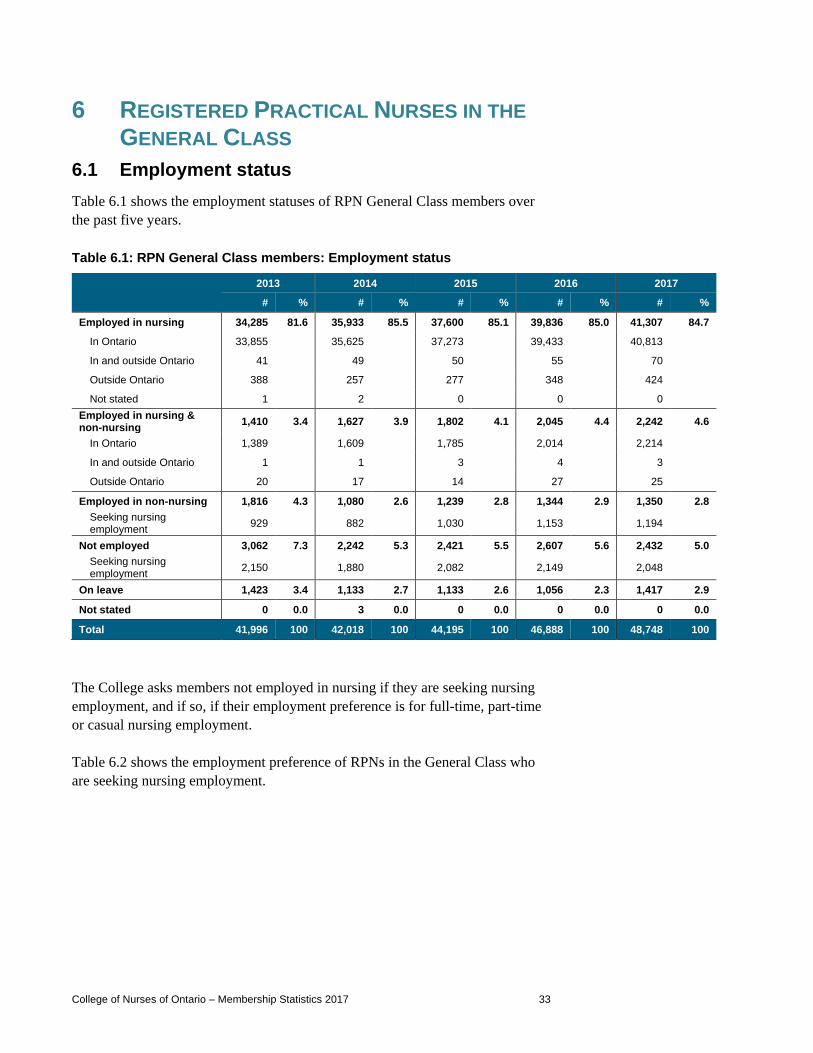
6.1 Employment status
Table 6.1 shows the employment statuses of RPN General Class members over
the past five years.
Table 6.1: RPN General Class members: Employment status
2013 2014 2015 2016 2017
# % # % # % # % # %
Employed in nursing 34,285 81.6 35,933 85.5 37,600 85.1 39,836 85.0 41,307 84.7
In Ontario 33,855 35,625 37,273 39,433 40,813
In and outside Ontario 41 49 50 55 70
Outside Ontario 388 257 277 348 424
Not stated 1 2 0 0 0
Employed in nursing & non-nursing
1,410 3.4 1,627 3.9 1,802 4.1 2,045 4.4 2,242 4.6
In Ontario 1,389 1,609 1,785 2,014 2,214
In and outside Ontario 1 1 3 4 3
Outside Ontario 20 17 14 27 25
Employed in non-nursing 1,816 4.3 1,080 2.6 1,239 2.8 1,344 2.9 1,350 2.8
Seeking nursing employment
929 882 1,030 1,153 1,194
Not employed 3,062 7.3 2,242 5.3 2,421 5.5 2,607 5.6 2,432 5.0
Seeking nursing employment
2,150 1,880 2,082 2,149 2,048
On leave 1,423 3.4 1,133 2.7 1,133 2.6 1,056 2.3 1,417 2.9
Not stated 0 0.0 3 0.0 0 0.0 0 0.0 0 0.0
Total 41,996 100 42,018 100 44,195 100 46,888 100 48,748 100
The College asks members not employed in nursing if they are seeking nursing
employment, and if so, if their employment preference is for full-time, part-time
or casual nursing employment.
Table 6.2 shows the employment preference of RPNs in the General Class who
are seeking nursing employment.

College of Nurses of Ontario – Membership Statistics 2017 34
Table 6.2: RPNs in the General Class seeking nursing employment:
Employment preference
2013 2014 2015 2016 2017
# % # % # % # % # %
Full-time 1,869 60.7 1,645 59.6 1,857 59.7 1,947 59.0 1,817 56.0
Part-time 813 26.4 771 27.9 850 27.3 954 28.9 969 29.9
Casual 391 12.7 346 12.5 401 12.9 394 11.9 449 13.8
Not stated 6 0.2 0 0.0 4 0.1 7 0.2 7 0.2
Total 3,079 100 2,762 100 3,112 100 3,302 100 3,242 100
6.2 Renewal gains and losses of Registered Practical Nurses in the General Class22
Every year, some RPN members join the College, get reinstated or join the
General Class from the Non-Practising Class. These changes are gains to the
General Class. Some other RPN members resign, join the Non-Practising Class
or do not renew their membership. These changes are losses to the General
Class.23
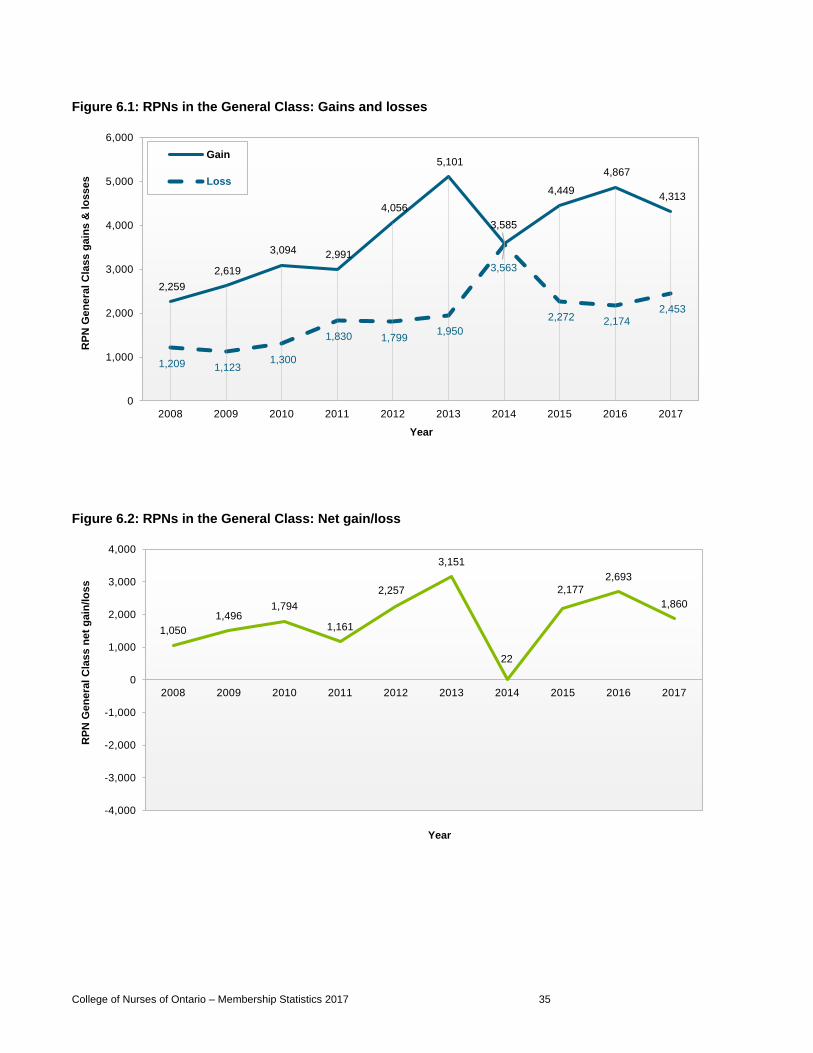
Overall gains and losses of Registered Practical Nurses in the General Class
Figure 6.1 shows the RPN General Class gains and losses and Figure 6.2 shows
the RPN General Class net gain/loss, both over the past 10 years.
During the 2014 renewal, there was a higher number of losses than usual in the
General Class, which was largely attributed to the new registration regulation
requirement: the declaration of practice.24 With this new requirement, members
could only renew in the General Class if they had:
practised nursing in Ontario within the past three years, or
registered or reinstated with the College within the past three years.
Members who did not meet these conditions could register in the Non-Practising
Class, resign their membership or have the College revoke their membership.
22 See Section 10.1 in Appendix 2: RPNs in the General Class for more trends in RPN General Class renewal gains and losses. 23 See Section 2.4.1 for more information about renewal gains and losses. 24 Visit www.cno.org/en/maintain-your-membership1/declaration-of-practice/ for more information about the Declaration of Practice requirement.
College of Nurses of Ontario – Membership Statistics 2017 35
Figure 6.1: RPNs in the General Class: Gains and losses
Figure 6.2: RPNs in the General Class: Net gain/loss
2,259
2,619
3,094 2,991
4,056
5,101
3,585
4,449
4,867
4,313
1,209 1,123 1,300
1,830 1,799 1,950
3,563
2,272 2,174 2,453
0
1,000
2,000
3,000
4,000
5,000
6,000
2008 2009 2010 2011 2012 2013 2014 2015 2016 2017
RP
N G
en
era
l C
lass g
ain
s &
lo
sses
Year
Gain
Loss
1,050
1,4961,794
1,161
2,257
3,151
22
2,177
2,693
1,860
-4,000
-3,000
-2,000
-1,000
0
1,000
2,000
3,000
4,000
2008 2009 2010 2011 2012 2013 2014 2015 2016 2017
RP
N G
en
era
l C
lass n
et
gain
/lo
ss
Year

College of Nurses of Ontario – Membership Statistics 2017 36
Renewal gains of Registered Practical Nurses in the General Class
Figure 6.3 shows the categorization of the RPN General Class gains over the past
10 years.
Figure 6.3: RPN General Class gains: Categorization
Renewal losses of Registered Practical Nurses in the General Class
Figure 6.4 shows the categorization of the RPN General Class losses over the
past 10 years. Table 6.3 shows a more detailed categorization of losses over the
past five years.
For more tables about RPN General Class losses, see Section 10.1.1.
229 194 201 244 262 244 76 74 72 79
2,030 2,425
2,893 2,747
3,794
4,857
3,505
4,363 4,759
4,202
4
12
36
32
0
1,000
2,000
3,000
4,000
5,000
6,000
2008 2009 2010 2011 2012 2013 2014 2015 2016 2017
RP
N G
en
era
l C
lass g
ain
s
Year
Change in class
New members
Reinstatements

College of Nurses of Ontario – Membership Statistics 2017 37
Figure 6.4: RPN General Class losses: Categorization
Table 6.3: RPN General Class losses: Detailed categorization
2013 2014 2015 2016 2017
# % # % # % # % # %
Revoked/not renewed 489 25.1 1,651 46.3 1,019 44.9 451 20.7 464 18.9
Resigned 1,119 57.4 1,450 40.7 1,216 53.5 1,156 53.2 1,458 59.4
Leaving nursing to work in another profession
70 3.6 99 2.8 47 2.1 63 2.9 73 3.0
On leave from nursing and not working in another profession
27 1.4 31 0.9 25 1.1 24 1.1 30 1.2
Leaving Canada to work as a nurse in another country
3 0.2 12 0.3 6 0.3 5 0.2 8 0.3
Leaving Ontario to work as a nurse in another province
49 2.5 81 2.3 68 3.0 53 2.4 72 2.9
Retiring from the workforce 369 18.9 561 15.7 481 21.2 424 19.5 504 20.5
Other 443 22.7 485 13.6 496 21.8 465 21.4 603 24.6
Not stated 158 8.1 181 5.1 93 4.1 122 5.6 168 6.8
Change in class to Non-Practising 342 17.5 462 13.0 37 1.6 567 26.1 531 21.6
Total 1,950 100 3,563 100 2,272 100 2,174 100 2,453 100
636 558 645
1,073
681 489
1,651
1,019
451 464
573 565
655
757
1,118
1,119
1,450
1,216
1,156 1,458
342
462
37
567
531
0
500
1,000
1,500
2,000
2,500
3,000
3,500
4,000
2008 2009 2010 2011 2012 2013 2014 2015 2016 2017
RP
N G
en
era
l C
lass l
osses
Year
Change in class
Resigned
Revoked/not renewed
College of Nurses of Ontario – Membership Statistics 2017 38
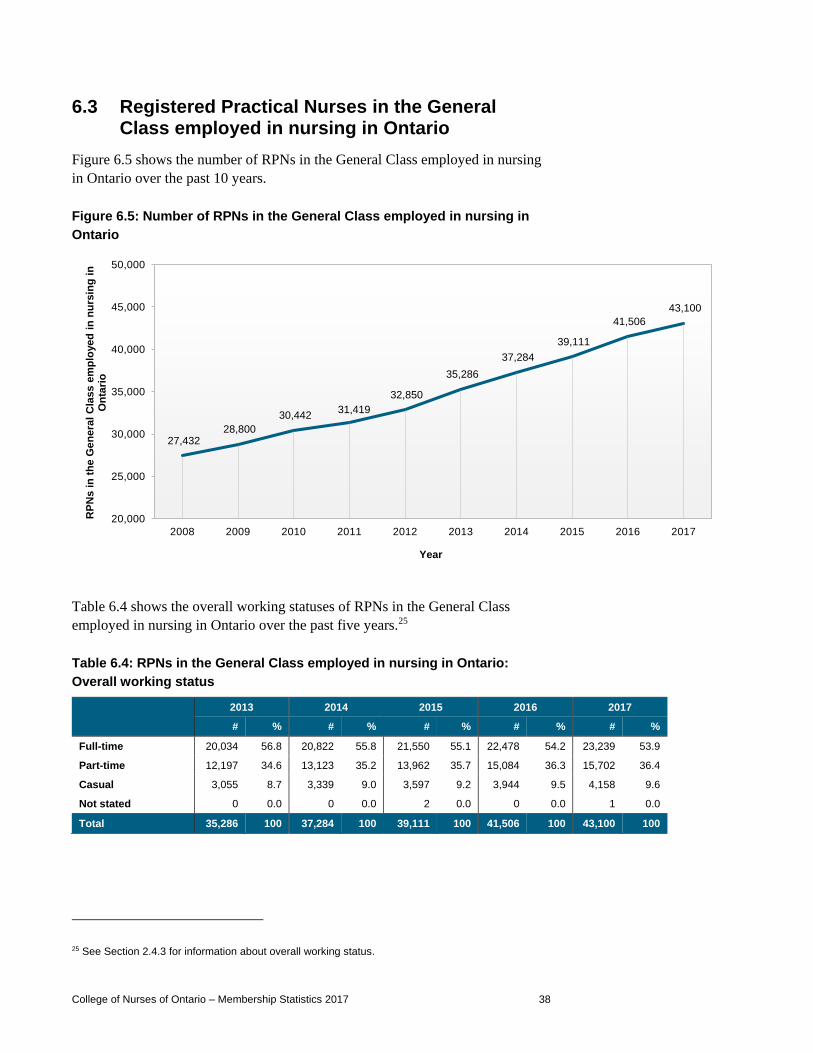
6.3 Registered Practical Nurses in the General Class employed in nursing in Ontario
Figure 6.5 shows the number of RPNs in the General Class employed in nursing
in Ontario over the past 10 years.
Figure 6.5: Number of RPNs in the General Class employed in nursing in
Ontario
Table 6.4 shows the overall working statuses of RPNs in the General Class
employed in nursing in Ontario over the past five years.25
Table 6.4: RPNs in the General Class employed in nursing in Ontario:
Overall working status
2013 2014 2015 2016 2017
# % # % # % # % # %
Full-time 20,034 56.8 20,822 55.8 21,550 55.1 22,478 54.2 23,239 53.9
Part-time 12,197 34.6 13,123 35.2 13,962 35.7 15,084 36.3 15,702 36.4
Casual 3,055 8.7 3,339 9.0 3,597 9.2 3,944 9.5 4,158 9.6
Not stated 0 0.0 0 0.0 2 0.0 0 0.0 1 0.0
Total 35,286 100 37,284 100 39,111 100 41,506 100 43,100 100
25 See Section 2.4.3 for information about overall working status.
27,432 28,800
30,442 31,419
32,850
35,286
37,284
39,111
41,506
43,100
20,000
25,000
30,000
35,000
40,000
45,000
50,000
2008 2009 2010 2011 2012 2013 2014 2015 2016 2017
RP
Ns i
n t
he G
en
era
l C
lass e
mp
loyed
in
nu
rsin
g i
n
On
tari
o
Year

College of Nurses of Ontario – Membership Statistics 2017 39
The College asked RPNs in the General Class employed in nursing in Ontario
what their working status preference was: full-time, part-time or casual.
Table 6.5 shows how the members’ working status preference matched with their
actual overall working status.
Table 6.5: RPN General Class members employed in nursing in Ontario:
Working preference
Working preference
Overall working status in Ontario
Full-time Part-time Casual Not stated
# % # % # % # %
Full-time 22,485 96.8 8,653 55.1 1,849 44.5 0 0.0
Part-time 615 2.6 6,880 43.8 878 21.1 1 100
Casual 139 0.6 169 1.1 1,431 34.4 0 0.0
Total 23,239 100 15,702 100 4,158 100 1 100
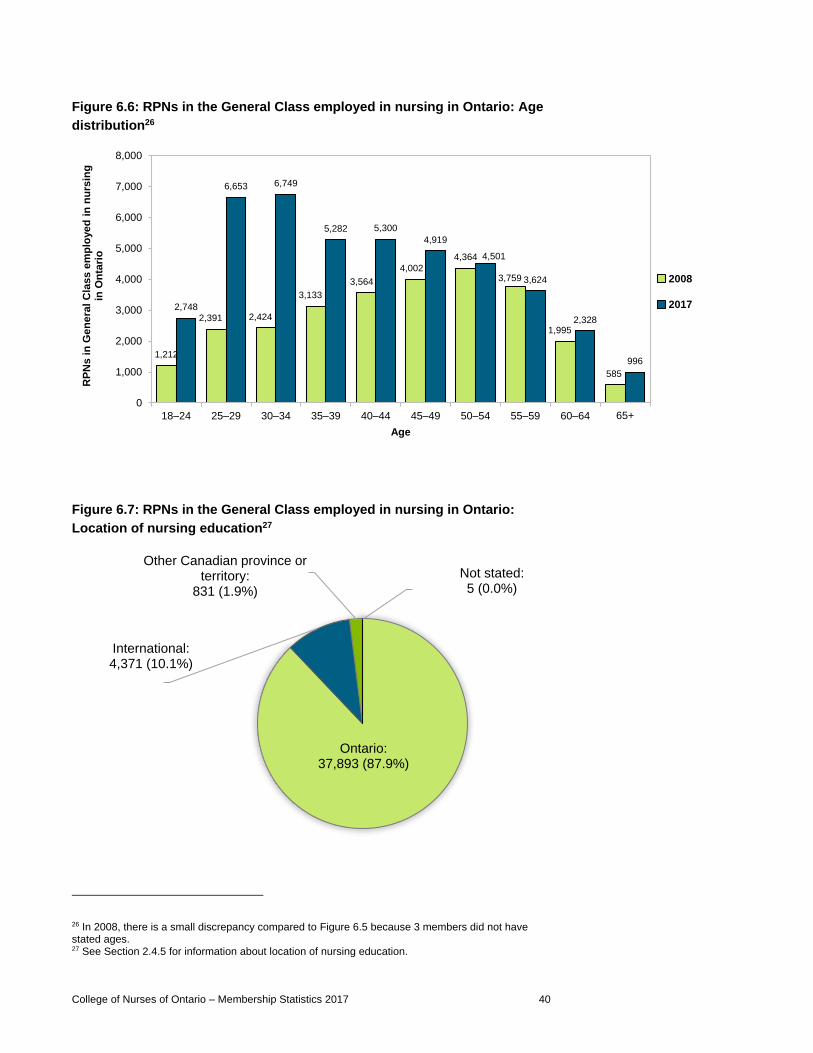
Demographics of Registered Practical Nurses in the General Class
Of the RPNs in the General Class employed in nursing in Ontario in 2017, 9.1
per cent were male, compared to 6.2 per cent in 2008.
The average age of RPN General Class members employed in nursing in Ontario
in 2017 was 40.8 years.
Figure 6.6 shows the age distribution of RPNs in the General Class employed in
nursing in Ontario over the past 10 years and Figure 6.7 shows their location of
nursing education.
College of Nurses of Ontario – Membership Statistics 2017 40
Figure 6.6: RPNs in the General Class employed in nursing in Ontario: Age
distribution26
Figure 6.7: RPNs in the General Class employed in nursing in Ontario:
Location of nursing education27
26 In 2008, there is a small discrepancy compared to Figure 6.5 because 3 members did not have stated ages. 27 See Section 2.4.5 for information about location of nursing education.
1,212
2,391 2,424
3,133
3,564
4,002
4,364
3,759
1,995
585
2,748
6,653 6,749
5,282 5,300
4,919
4,501
3,624
2,328
996
0
1,000
2,000
3,000
4,000
5,000
6,000
7,000
8,000
18–24 25–29 30–34 35–39 40–44 45–49 50–54 55–59 60–64 65+
RP
Ns i
n G
en
era
l C
lass e
mp
loyed
in
nu
rsin
g
in O
nta
rio
Age
2008
2017
Ontario:37,893 (87.9%)
International:4,371 (10.1%)
Other Canadian province or territory:
831 (1.9%)
Not stated:5 (0.0%)

College of Nurses of Ontario – Membership Statistics 2017 41
Nursing employment of Registered Practical Nurses in the General Class
Table 6.6 shows the number of nursing employment positions and members’
working statuses for RPNs in the General Class employed in nursing in Ontario
over the past five years.28
Table 6.6: RPNs in the General Class employed in nursing in Ontario:
Number of nursing employment positions and members’ working status
2013 2014 2015 2016 2017
# % # % # % # % # %
One nursing employer 28,373 80.4 29,805 79.9 31,257 79.9 33,294 80.2 34,512 80.1
Full-time 16,740 47.4 17,387 46.6 18,108 46.3 18,974 45.7 19,661 45.6
Part-time 9,064 25.7 9,665 25.9 10,219 26.1 11,050 26.6 11,384 26.4
Casual 2,569 7.3 2,753 7.4 2,928 7.5 3,270 7.9 3,466 8.0
Not stated 0 0.0 0 0.0 2 0.0 0 0.0 1 0.0
Two nursing employers 6,133 17.4 6,609 17.7 6,963 17.8 7,247 17.5 7,590 17.6
Both full-time 130 0.4 174 0.5 201 0.5 149 0.4 148 0.3
Full-time and part-time 1,103 3.1 1,137 3.0 1,159 3.0 1,209 2.9 1,260 2.9
Full-time and casual 1,780 5.0 1,818 4.9 1,785 4.6 1,840 4.4 1,839 4.3
Both part-time 1,201 3.4 1,298 3.5 1,430 3.7 1,512 3.6 1,664 3.9
Part-time and casual 1,500 4.3 1,676 4.5 1,805 4.6 1,952 4.7 2,086 4.8
Both casual 419 1.2 506 1.4 583 1.5 585 1.4 592 1.4
Part-time and not stated 0 0.0 0 0.0 0 0.0 0 0.0 1 0.0
Three or more nursing employers 780 2.2 870 2.3 891 2.3 965 2.3 998 2.3
Overall full-time (at least one full-time position)
281 0.8 306 0.8 297 0.8 306 0.7 331 0.8
Overall part-time (highest working status is part-time, no full-time positions)
432 1.2 484 1.3 508 1.3 570 1.4 567 1.3
Overall casual (all positions are casual) 67 0.2 80 0.2 86 0.2 89 0.2 100 0.2
Total RPNs employed in nursing in Ontario
35,286 100 37,284 100 39,111 100 41,506 100 43,100 100
Total nursing employment positions in Ontario
43,060 45,742 47,981 50,805 52,820
28 See Section 2.4.2 for information about multiple employment positions.

College of Nurses of Ontario – Membership Statistics 2017 42
Table 6.7 shows the nursing position working statuses of RPNs in the General
Class employed in nursing in Ontario over the past five years.
Table 6.7: RPNs in the General Class employed in nursing in Ontario:
Working status for nursing employment positions29
2013 2014 2015 2016 2017
# % # % # % # % # %
Full-time 20,186 46.9 21,034 46.0 21,788 45.4 22,643 44.6 23,414 44.3
Part-time 14,936 34.7 16,061 35.1 17,092 35.6 18,387 36.2 19,210 36.4
Casual 7,938 18.4 8,647 18.9 9,099 19.0 9,775 19.2 10,193 19.3
Not stated 0 0.0 0 0.0 2 0.0 0 0.0 3 0.0
Total 43,060 100 45,742 100 47,981 100 50,805 100 52,820 100
Table 6.8 shows the Local Health Integration Network (LHIN) regions of RPN
General Class employment positions over the past five years.30
Table 6.8: RPN General Class employment positions: LHIN regions
2013 2014 2015 2016 2017
# % # % # % # % # %
Central 3,869 9.0 4,189 9.2 4,646 9.7 4,913 9.7 5,280 10.0
Central East 4,325 10.0 4,484 9.8 4,825 10.1 5,267 10.4 5,468 10.4
Central West 1,439 3.3 1,486 3.2 1,597 3.3 1,727 3.4 1,867 3.5
Champlain 4,428 10.3 4,655 10.2 4,886 10.2 5,188 10.2 5,195 9.8
Erie St. Clair 2,351 5.5 2,568 5.6 2,713 5.7 2,844 5.6 2,994 5.7
Hamilton Niagara Haldimand Brant 5,085 11.8 5,535 12.1 5,774 12.0 6,034 11.9 6,268 11.9
Mississauga Halton 2,393 5.6 2,599 5.7 2,862 6.0 3,253 6.4 3,524 6.7
North East 2,932 6.8 3,050 6.7 3,154 6.6 3,269 6.4 3,291 6.2
North Simcoe Muskoka 1,873 4.3 1,971 4.3 2,056 4.3 2,161 4.3 2,170 4.1
North West 1,348 3.1 1,430 3.1 1,428 3.0 1,468 2.9 1,451 2.7
South East 2,369 5.5 2,472 5.4 2,474 5.2 2,530 5.0 2,581 4.9
South West 3,749 8.7 3,889 8.5 4,063 8.5 4,214 8.3 4,379 8.3
Toronto Central 4,326 10.0 4,594 10.0 4,734 9.9 5,014 9.9 5,319 10.1
Waterloo Wellington 2375 5.5 2,567 5.6 2,765 5.8 2,923 5.8 3,030 5.7
Not stated 198 0.5 253 0.6 4 0.0 0 0.0 3 0.0
Total 43,060 100 45,742 100 47,981 100 50,805 100 52,820 100
29 See Section 2.4.3 for information about working status for employment positions. 30 See the LHIN Region Report 2017 at www.cno.org/en/what-is-cno/nursing-demographics/statistical-reports/ for detailed membership statistics by LHIN.

College of Nurses of Ontario – Membership Statistics 2017 43
6.4 Registered Practical Nurses in the General Class employed in nursing outside of Ontario31
In 2013, the College created the Non-Practising Class. As a result, during the
2014 renewal, members of the General Class who had not practised nursing in
Ontario in the previous three years were required to either register in the Non-
Practising Class or resign their membership.32 Due to this, the number of RPNs in
the General Class employed in nursing outside Ontario decreased from 525 for
2013 to 388 for 2014.
Table 6.9 shows the employment position locations for RPNs in the General
Class employed in nursing outside Ontario over the past five years.
Table 6.9: RPNs in the General Class employed in nursing outside Ontario:
Employment position locations
2013 2014 2015 2016 2017
# %† # %† # %† # %† # %†
Alberta 121 30.9 104 31.8 127 37.4 135 30.1 133 24.4
British Columbia 56 14.3 41 12.5 30 8.8 47 10.5 72 13.2
Manitoba 23 5.9 30 9.2 39 11.5 42 9.4 58 10.6
New Brunswick 6 1.5 9 2.8 5 1.5 9 2.0 8 1.5
Newfoundland and Labrador 3 0.8 4 1.2 3 0.9 21 4.7 29 5.3
Northwest Territories 10 2.6 4 1.2 6 1.8 8 1.8 11 2.0
Nova Scotia 15 3.8 12 3.7 13 3.8 51 11.4 68 12.5
Nunavut 8 2.0 4 1.2 6 1.8 9 2.0 12 2.2
Prince Edward Island 3 0.8 2 0.6 1 0.3 15 3.3 14 2.6
Quebec 114 29.2 89 27.2 76 22.4 71 15.8 83 15.2
Saskatchewan 30 7.7 25 7.6 31 9.1 37 8.2 52 9.5
Yukon 2 0.5 3 0.9 3 0.9 4 0.9 5 0.9
# % # % # % # % # %
Canada total 391 74.5 327 84.3 340 85.4 449 88.0 545 84.5
United States 102 19.4 44 11.3 46 11.6 48 9.4 76 11.8
Other (outside Canada & United States) 31 5.9 15 3.9 12 3.0 13 2.5 24 3.7
Not stated (outside Ontario) 1 0.2 2 0.5 0 0.0 0 0.0 0 0.0
Total 525 100 388 100 398 100 510 100 645 100
†Percentage of Canada total
31 Employed in nursing outside Ontario includes all members who reported at least one nursing employment position outside Ontario.
32 See Section 2.3.3 for more information about the Non-Practising Class.
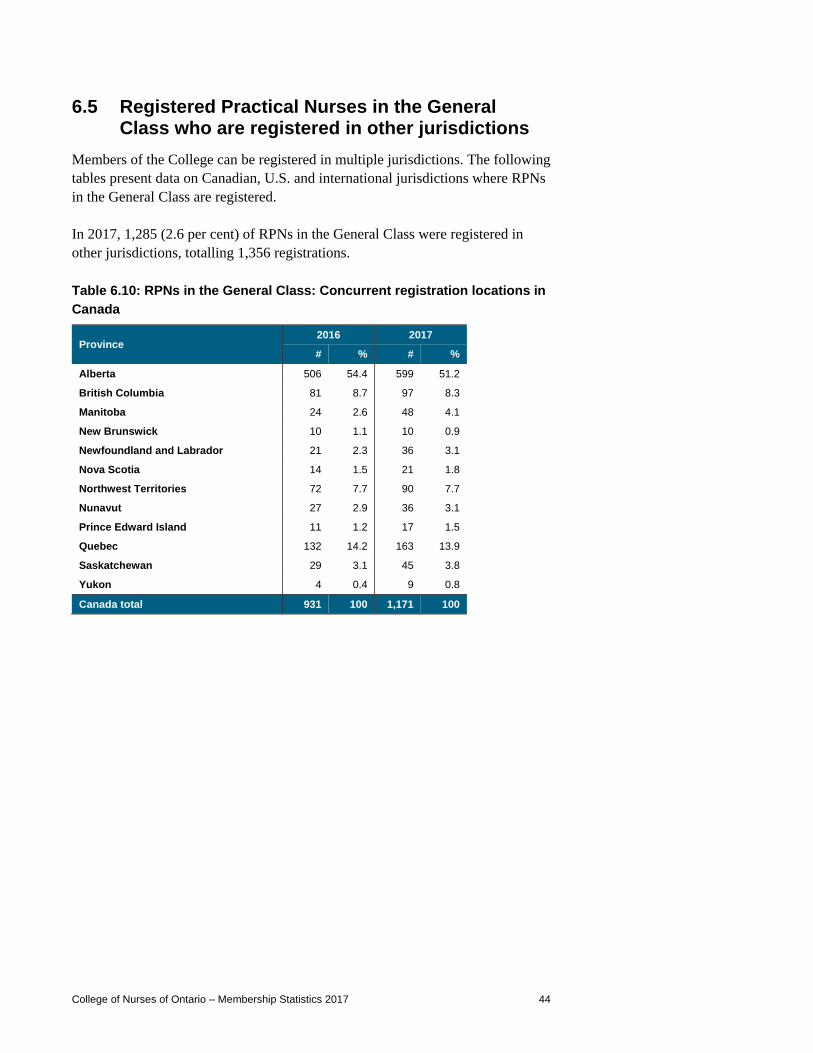
College of Nurses of Ontario – Membership Statistics 2017 44
6.5 Registered Practical Nurses in the General Class who are registered in other jurisdictions
Members of the College can be registered in multiple jurisdictions. The following
tables present data on Canadian, U.S. and international jurisdictions where RPNs
in the General Class are registered.
In 2017, 1,285 (2.6 per cent) of RPNs in the General Class were registered in
other jurisdictions, totalling 1,356 registrations.
Table 6.10: RPNs in the General Class: Concurrent registration locations in
Canada
Province 2016 2017
# % # %
Alberta 506 54.4 599 51.2
British Columbia 81 8.7 97 8.3
Manitoba 24 2.6 48 4.1
New Brunswick 10 1.1 10 0.9
Newfoundland and Labrador 21 2.3 36 3.1
Nova Scotia 14 1.5 21 1.8
Northwest Territories 72 7.7 90 7.7
Nunavut 27 2.9 36 3.1
Prince Edward Island 11 1.2 17 1.5
Quebec 132 14.2 163 13.9
Saskatchewan 29 3.1 45 3.8
Yukon 4 0.4 9 0.8
Canada total 931 100 1,171 100
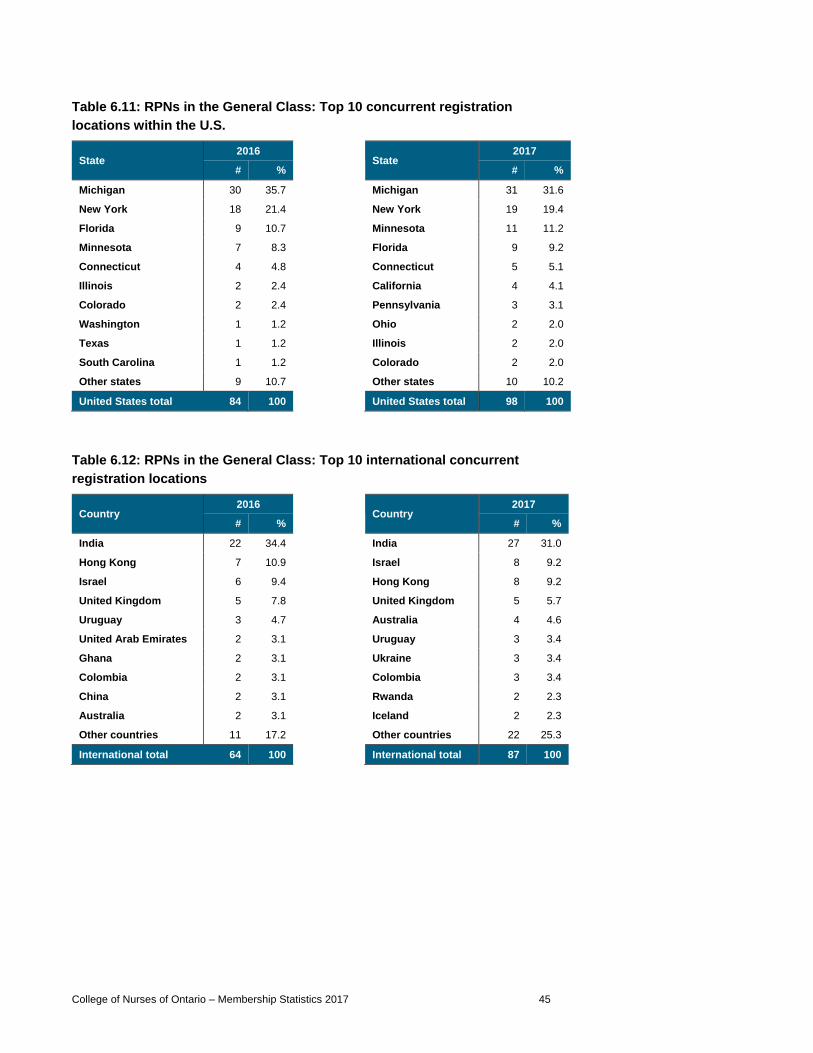
College of Nurses of Ontario – Membership Statistics 2017 45
Table 6.11: RPNs in the General Class: Top 10 concurrent registration
locations within the U.S.
State 2016
State 2017
# % # %
Michigan 30 35.7 Michigan 31 31.6
New York 18 21.4 New York 19 19.4
Florida 9 10.7 Minnesota 11 11.2
Minnesota 7 8.3 Florida 9 9.2
Connecticut 4 4.8 Connecticut 5 5.1
Illinois 2 2.4 California 4 4.1
Colorado 2 2.4 Pennsylvania 3 3.1
Washington 1 1.2 Ohio 2 2.0
Texas 1 1.2 Illinois 2 2.0
South Carolina 1 1.2 Colorado 2 2.0
Other states 9 10.7 Other states 10 10.2
United States total 84 100 United States total 98 100
Table 6.12: RPNs in the General Class: Top 10 international concurrent
registration locations
Country 2016
Country 2017
# % # %
India 22 34.4 India 27 31.0
Hong Kong 7 10.9 Israel 8 9.2
Israel 6 9.4 Hong Kong 8 9.2
United Kingdom 5 7.8 United Kingdom 5 5.7
Uruguay 3 4.7 Australia 4 4.6
United Arab Emirates 2 3.1 Uruguay 3 3.4
Ghana 2 3.1 Ukraine 3 3.4
Colombia 2 3.1 Colombia 3 3.4
China 2 3.1 Rwanda 2 2.3
Australia 2 3.1 Iceland 2 2.3
Other countries 11 17.2 Other countries 22 25.3
International total 64 100 International total 87 100
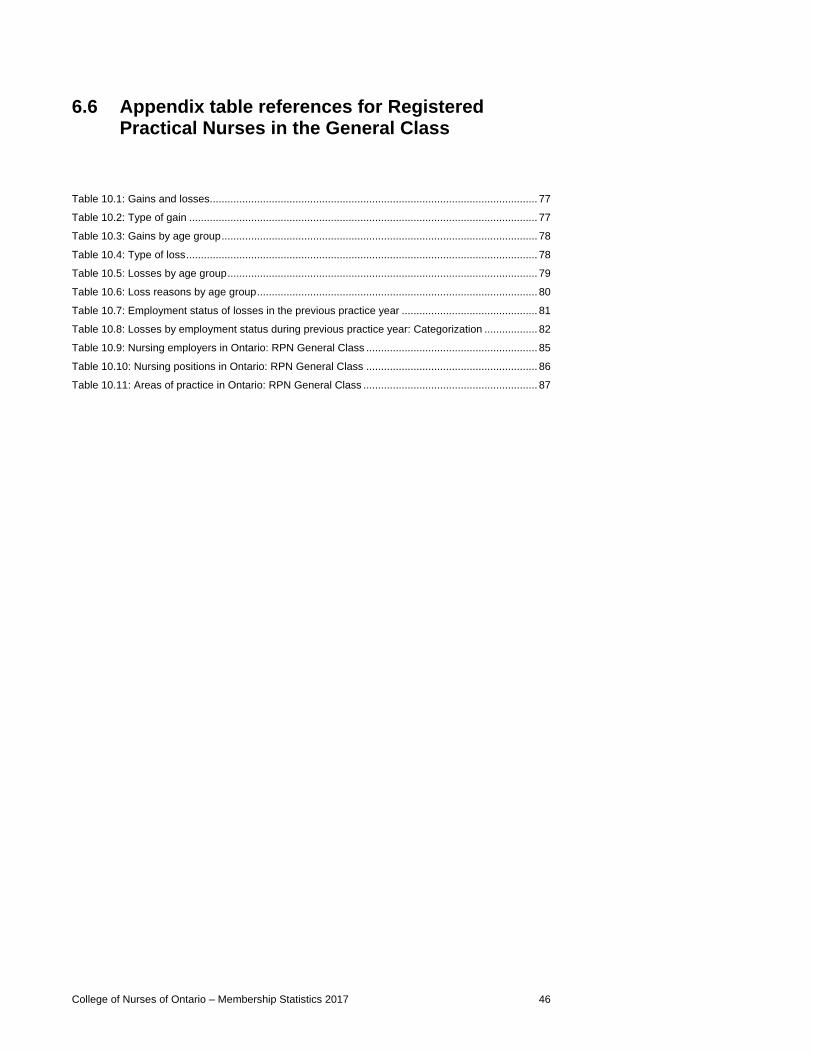
College of Nurses of Ontario – Membership Statistics 2017 46
6.6 Appendix table references for Registered Practical Nurses in the General Class
Table 10.1: Gains and losses............................................................................................................... 77
Table 10.2: Type of gain ...................................................................................................................... 77
Table 10.3: Gains by age group ........................................................................................................... 78
Table 10.4: Type of loss ....................................................................................................................... 78
Table 10.5: Losses by age group ......................................................................................................... 79
Table 10.6: Loss reasons by age group ............................................................................................... 80
Table 10.7: Employment status of losses in the previous practice year .............................................. 81
Table 10.8: Losses by employment status during previous practice year: Categorization .................. 82
Table 10.9: Nursing employers in Ontario: RPN General Class .......................................................... 85
Table 10.10: Nursing positions in Ontario: RPN General Class .......................................................... 86
Table 10.11: Areas of practice in Ontario: RPN General Class ........................................................... 87
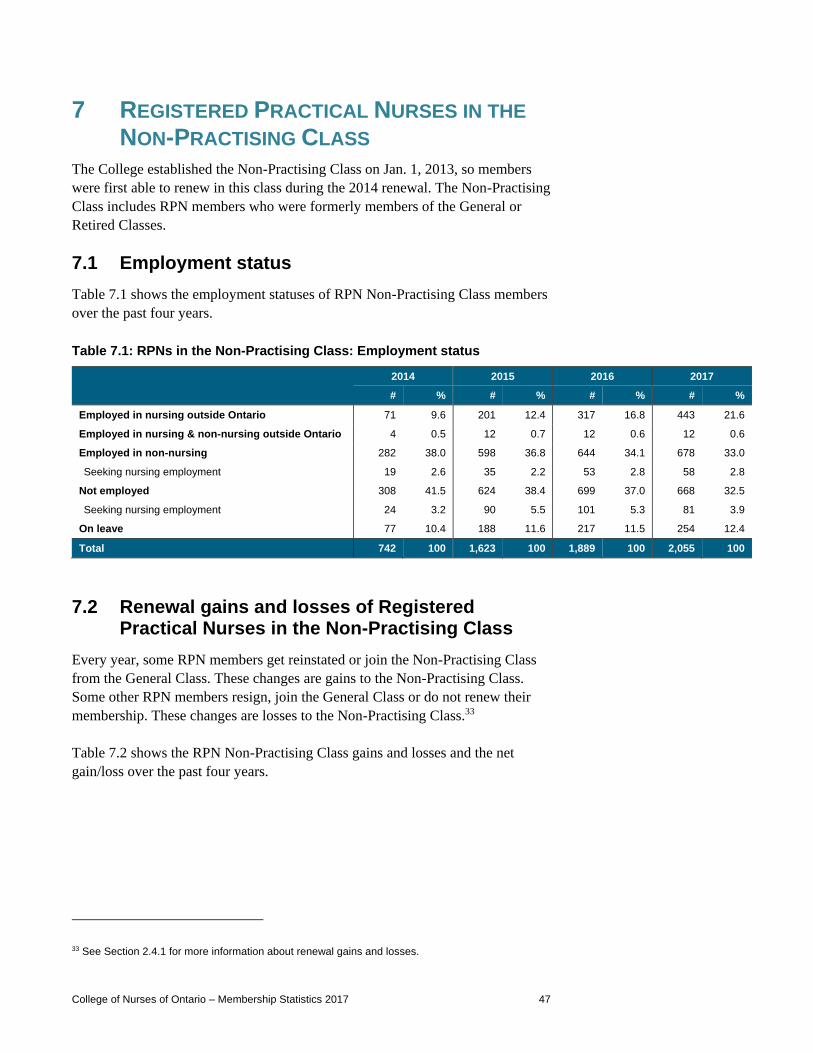
College of Nurses of Ontario – Membership Statistics 2017 47
7 REGISTERED PRACTICAL NURSES IN THE
NON-PRACTISING CLASS
The College established the Non-Practising Class on Jan. 1, 2013, so members
were first able to renew in this class during the 2014 renewal. The Non-Practising
Class includes RPN members who were formerly members of the General or
Retired Classes.
7.1 Employment status
Table 7.1 shows the employment statuses of RPN Non-Practising Class members
over the past four years.
Table 7.1: RPNs in the Non-Practising Class: Employment status
2014 2015 2016 2017
# % # % # % # %
Employed in nursing outside Ontario 71 9.6 201 12.4 317 16.8 443 21.6
Employed in nursing & non-nursing outside Ontario 4 0.5 12 0.7 12 0.6 12 0.6
Employed in non-nursing 282 38.0 598 36.8 644 34.1 678 33.0
Seeking nursing employment 19 2.6 35 2.2 53 2.8 58 2.8
Not employed 308 41.5 624 38.4 699 37.0 668 32.5
Seeking nursing employment 24 3.2 90 5.5 101 5.3 81 3.9
On leave 77 10.4 188 11.6 217 11.5 254 12.4
Total 742 100 1,623 100 1,889 100 2,055 100
7.2 Renewal gains and losses of Registered Practical Nurses in the Non-Practising Class
Every year, some RPN members get reinstated or join the Non-Practising Class
from the General Class. These changes are gains to the Non-Practising Class.
Some other RPN members resign, join the General Class or do not renew their
membership. These changes are losses to the Non-Practising Class.33
Table 7.2 shows the RPN Non-Practising Class gains and losses and the net
gain/loss over the past four years.
33 See Section 2.4.1 for more information about renewal gains and losses.

College of Nurses of Ontario – Membership Statistics 2017 48
Table 7.2: RPNs in the Non-Practising Class: Gains and losses
2014 2015 2016 2017
# # # #
Gain 498 996 525 529
Loss 167 115 259 363
Net gain/loss 331 881 266 166
Table 7.3 shows the categorization of the RPN Non-Practising Class gains over
the past four years.
Table 7.3: RPN Non-Practising Class gains: Categorization
2014 2015 2016 2017
# % # % # % # %
Reinstatement 38 7.6 29 2.9 67 12.8 7 1.3
Change in class 460 92.4 967 97.1 458 87.2 522 98.7
Total 498 100 996 100 525 100 529 100
Table 7.4 shows a detailed categorization of the RPN Non-Practising Class losses
over the past four years.
Table 7.4: RPN Non-Practising Class losses: Detailed categorization
2014 2015 2016 2017
# % # % # % # %
Revoked 90 53.9 22 19.1 81 31.3 106 29.2
Resigned 75 44.9 81 70.4 149 57.5 225 62.0
Leaving nursing to work in another profession 12 7.2 6 5.2 19 7.3 37 10.2
On leave from nursing and not working in another profession 3 1.8 6 5.2 9 3.5 15 4.1
Leaving Canada to work as a nurse in another country 1 0.6 3 2.6 1 0.4 2 0.6
Leaving Ontario to work as a nurse in another province 4 2.4 2 1.7 19 7.3 18 5.0
Retiring from the workforce 45 26.9 35 30.4 68 26.3 81 22.3
Other 10 6.0 17 14.8 22 8.5 32 8.8
Not stated 0 0.0 12 10.4 11 4.2 40 11.0
Change in class to General 2 1.2 12 10.4 29 11.2 32 8.8
Total 167 100 115 100 259 100 363 100
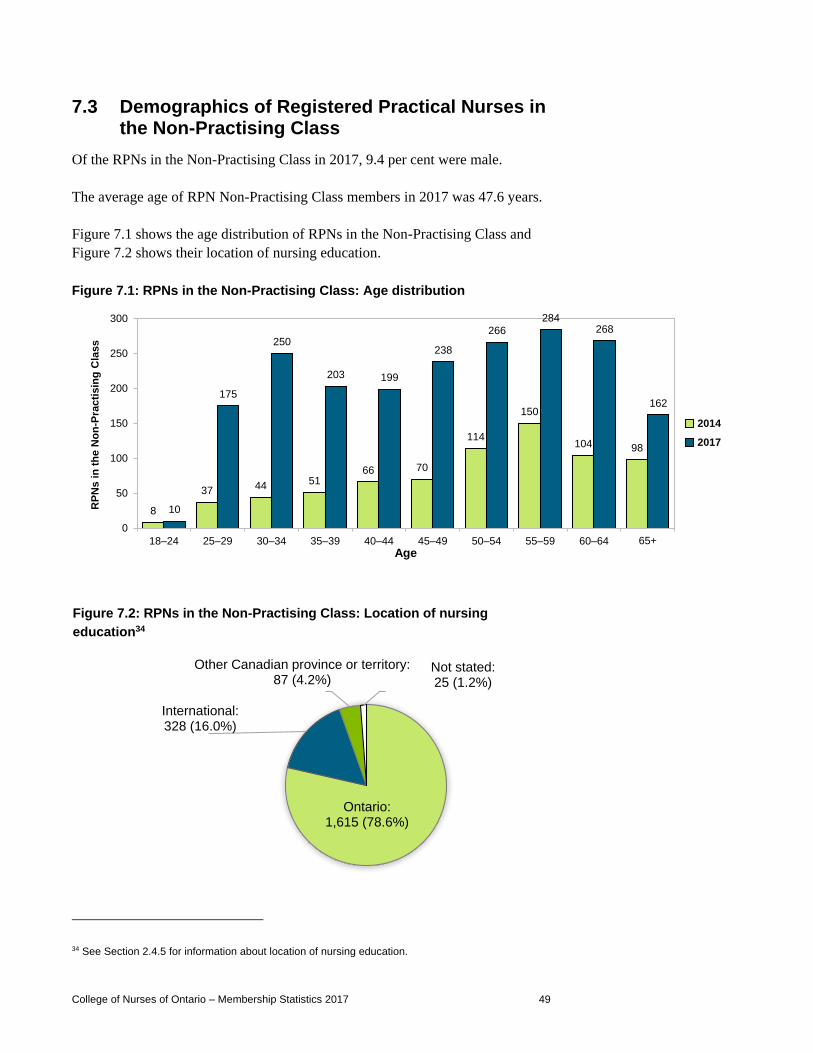
College of Nurses of Ontario – Membership Statistics 2017 49
7.3 Demographics of Registered Practical Nurses in the Non-Practising Class
Of the RPNs in the Non-Practising Class in 2017, 9.4 per cent were male.
The average age of RPN Non-Practising Class members in 2017 was 47.6 years.
Figure 7.1 shows the age distribution of RPNs in the Non-Practising Class and
Figure 7.2 shows their location of nursing education.
Figure 7.1: RPNs in the Non-Practising Class: Age distribution
Figure 7.2: RPNs in the Non-Practising Class: Location of nursing
education34
34 See Section 2.4.5 for information about location of nursing education.
8
37 44 5166 70
114
150
104 98
10
175
250
203 199
238
266
284268
162
0
50
100
150
200
250
300
18–24 25–29 30–34 35–39 40–44 45–49 50–54 55–59 60–64 65+
RP
Ns i
n t
he N
on
-Pra
cti
sin
g C
lass
Age
2014
2017
Ontario:1,615 (78.6%)
International:328 (16.0%)
Other Canadian province or territory:87 (4.2%)
Not stated:25 (1.2%)

College of Nurses of Ontario – Membership Statistics 2017 50
7.4 Registered Practical Nurses in the Non-Practising Class employed in nursing outside of Ontario35
Table 7.5 shows the employment position locations for RNs in the Non-
Practising Class employed in nursing outside Ontario over the past four years.
Table 7.5: RPNs in the Non-Practising Class employed in nursing outside
Ontario: Employment position locations
2014 2015 2016 2017
# %† # %† # %† # %†
Alberta 23 33.8 86 43.4 156 47.6 253 52.3
British Columbia 12 17.6 25 12.6 41 12.5 49 10.1
Manitoba 6 8.8 12 6.1 22 6.7 36 7.4
New Brunswick 3 4.4 4 2.0 10 3.0 8 1.7
Newfoundland and Labrador 1 1.5 2 1.0 6 1.8 9 1.9
Nova Scotia 2 2.9 2 1.0 4 1.2 4 0.8
Northwest Territories 1 1.5 8 4.0 24 7.3 46 9.5
Nunavut 1 1.5 3 1.5 4 1.2 3 0.6
Prince Edward Island 0 0.0 2 1.0 2 0.6 2 0.4
Quebec 9 13.2 26 13.1 29 8.8 35 7.2
Saskatchewan 7 10.3 22 11.1 26 7.9 35 7.2
Yukon 3 4.4 6 3.0 4 1.2 4 0.8
# % # % # % # %
Canada total 68 76.4 198 78.0 328 82.4 484 83.9
United States 19 21.3 51 20.1 63 15.8 78 13.5
Other (outside Canada & United States) 2 2.2 5 2.0 7 1.8 15 2.6
Total 89 100 254 100 398 100 577 100
†Percentage of Canada total.
35 Employed in nursing outside Ontario includes all members who reported having at least one nursing employment position outside Ontario.
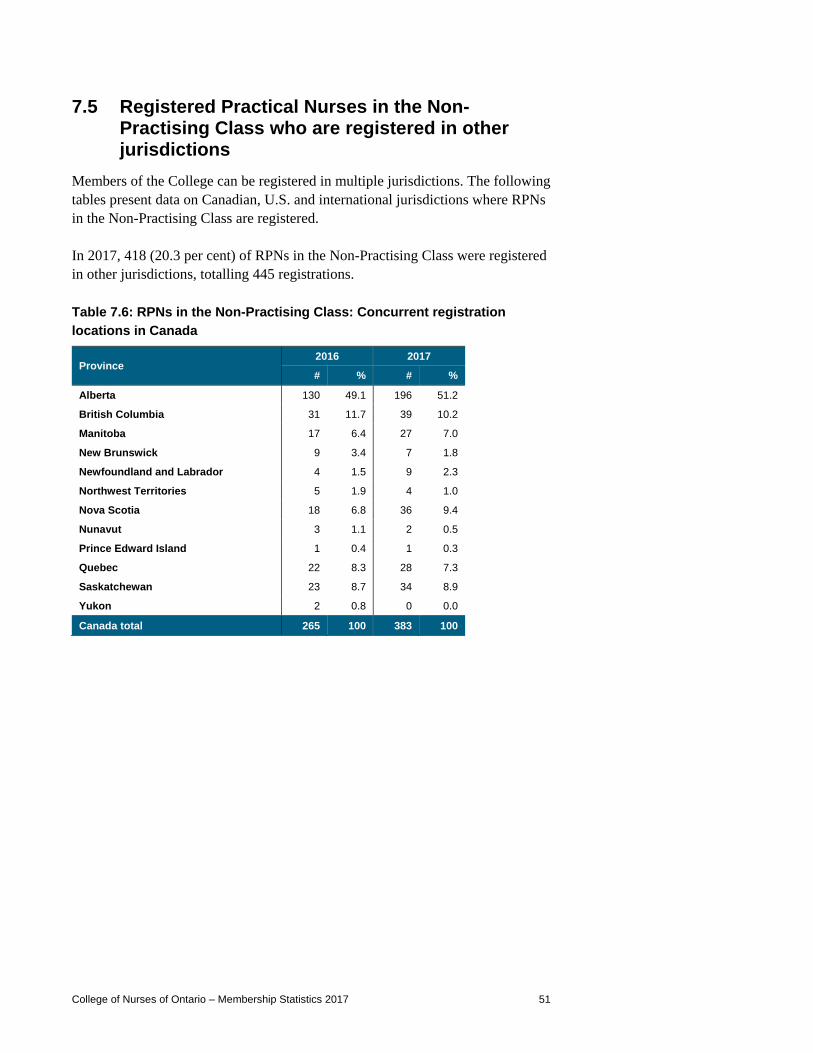
College of Nurses of Ontario – Membership Statistics 2017 51
7.5 Registered Practical Nurses in the Non-Practising Class who are registered in other jurisdictions
Members of the College can be registered in multiple jurisdictions. The following
tables present data on Canadian, U.S. and international jurisdictions where RPNs
in the Non-Practising Class are registered.
In 2017, 418 (20.3 per cent) of RPNs in the Non-Practising Class were registered
in other jurisdictions, totalling 445 registrations.
Table 7.6: RPNs in the Non-Practising Class: Concurrent registration
locations in Canada
Province 2016 2017
# % # %
Alberta 130 49.1 196 51.2
British Columbia 31 11.7 39 10.2
Manitoba 17 6.4 27 7.0
New Brunswick 9 3.4 7 1.8
Newfoundland and Labrador 4 1.5 9 2.3
Northwest Territories 5 1.9 4 1.0
Nova Scotia 18 6.8 36 9.4
Nunavut 3 1.1 2 0.5
Prince Edward Island 1 0.4 1 0.3
Quebec 22 8.3 28 7.3
Saskatchewan 23 8.7 34 8.9
Yukon 2 0.8 0 0.0
Canada total 265 100 383 100
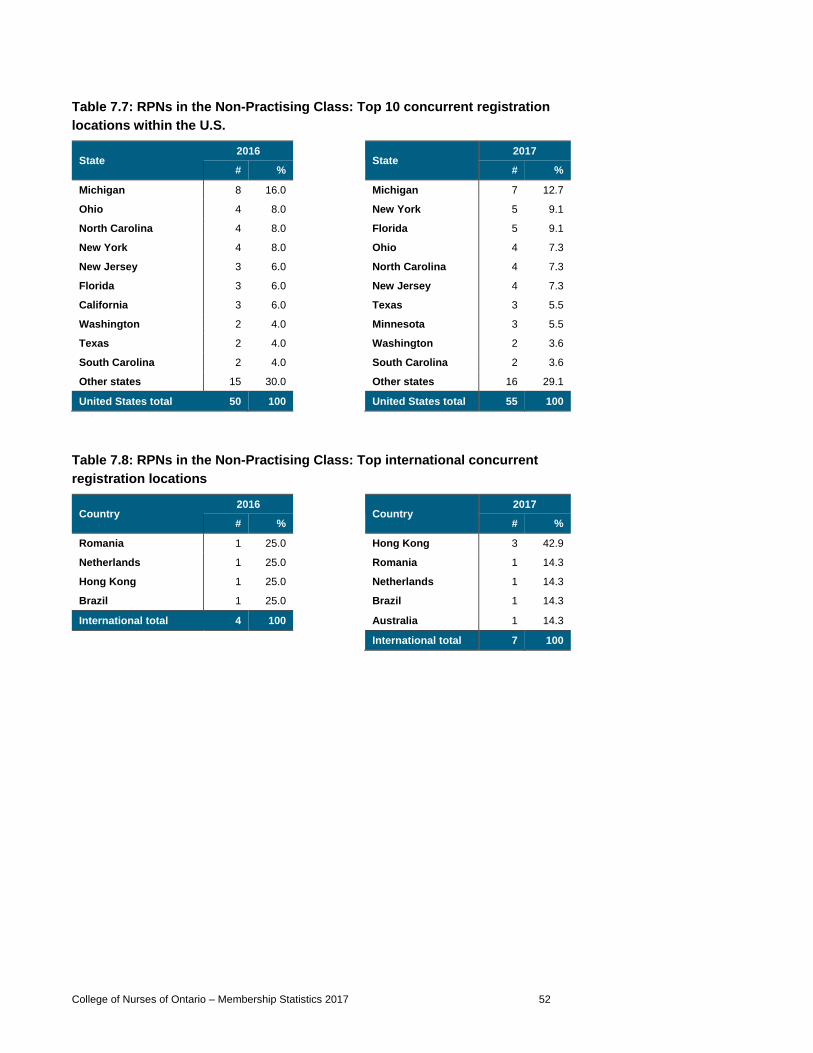
College of Nurses of Ontario – Membership Statistics 2017 52
Table 7.7: RPNs in the Non-Practising Class: Top 10 concurrent registration
locations within the U.S.
State 2016
State 2017
# % # %
Michigan 8 16.0 Michigan 7 12.7
Ohio 4 8.0 New York 5 9.1
North Carolina 4 8.0 Florida 5 9.1
New York 4 8.0 Ohio 4 7.3
New Jersey 3 6.0 North Carolina 4 7.3
Florida 3 6.0 New Jersey 4 7.3
California 3 6.0 Texas 3 5.5
Washington 2 4.0 Minnesota 3 5.5
Texas 2 4.0 Washington 2 3.6
South Carolina 2 4.0 South Carolina 2 3.6
Other states 15 30.0 Other states 16 29.1
United States total 50 100 United States total 55 100
Table 7.8: RPNs in the Non-Practising Class: Top international concurrent
registration locations
Country 2016
Country 2017
# % # %
Romania 1 25.0 Hong Kong 3 42.9
Netherlands 1 25.0 Romania 1 14.3
Hong Kong 1 25.0 Netherlands 1 14.3
Brazil 1 25.0 Brazil 1 14.3
International total 4 100 Australia 1 14.3
International total 7 100

College of Nurses of Ontario – Membership Statistics 2017 53
8 REGISTERED NURSES IN THE EXTENDED
CLASS (NURSE PRACTITIONERS)36
8.1 Employment status
Table 8.1 shows the employment statuses of RN Extended Class (NP) members
over the past five years.
Table 8.1: RNs in the Extended Class (NPs): Employment status
2013 2014 2015 2016 2017
# % # % # % # % # %
Employed in nursing 2,041 91.0 2,164 91.6 2,348 91.5 2,582 91.5 2,802 90.9
In Ontario 1,939 2,091 2,279 2,505 2,704
In and outside Ontario 35 37 29 39 52
Outside Ontario 67 36 40 38 46
Employed in nursing & non-nursing 84 3.7 86 3.6 101 3.9 116 4.1 115 3.7
In Ontario 81 79 97 113 108
In and outside Ontario 1 2 2 0 3
Outside Ontario 2 5 2 3 4
Employed in non-nursing 6 0.3 6 0.3 4 0.2 3 0.1 7 0.2
Seeking nursing employment 1 4 3 3 4
Not employed 46 2.1 45 1.9 41 1.6 58 2.1 70 2.3
Seeking nursing employment 29 32 29 42 55
On leave 65 2.9 61 2.6 73 2.8 63 2.2 89 2.9
Total 2,242 100 2,362 100 2,567 100 2,822 100 3,083 100
The College asks members not employed in nursing if they are seeking nursing
employment, and if so, if their employment preference is for full-time, part-time
or casual nursing employment.
Table 8.2 shows the employment preference of RNs in the Extended Class (NPs)
who are seeking nursing employment.
36 Registered Nurses in the Extended Class are also known as Nurse Practitioners (NPs). Visit www.cno.org/en/become-a-nurse/classes-of-registration/ for information about the College’s classes of registration.

College of Nurses of Ontario – Membership Statistics 2017 54
Table 8.2: RNs in the Extended Class (NPs) seeking nursing employment:
Employment preference
2013 2014 2015 2016 2017
# % # % # % # % # %
Full-time 16 53.3 21 58.3 17 53.1 24 53.3 31 52.5
Part-time 9 30.0 14 38.9 9 28.1 13 28.9 19 32.2
Casual 5 16.7 1 2.8 6 18.8 8 17.8 9 15.3
Total 30 100 36 100 32 100 45 100 59 100
The College registers RNs in the Extended Class (NPs) in three specialties:
Adult, Paediatrics and Primary Health Care. A member can have more than one
specialty. Table 8.3 shows the number of specialties that RNs in the Extended
Class (NPs) have.
Table 8.3: RNs in the Extended Class (NPs): Specialties
2013 2014 2015 2016 2017
# % # % # % # % # %
Adult 425 18.8 466 19.6 484 18.7 513 18.1 557 17.9
Paediatrics 196 8.7 202 8.5 206 8.0 220 7.7 230 7.4
Primary Health Care 1,637 72.5 1,711 71.9 1,897 73.3 2,108 74.2 2,320 74.7
Total 2,258 100 2,379 100 2,587 100 2,841 100 3,107 100
Members with two specialties 16 17 20 19 24
8.2 Renewal gains and losses of RNs in the Extended Class (NPs)
Every year, some NP members join the College, get reinstated or join the
Extended Class from another class. These changes are gains to the Extended
Class. Some other NP members resign, join a different class or do not renew their
membership. These changes are losses to the Extended Class.37
Overall gains and losses of RNs in the Extended Class (NPs)
Figure 8.1 shows the RN Extended Class (NP) gains and losses and
37 See Section 2.4.1 for more information about renewal gains and losses.

College of Nurses of Ontario – Membership Statistics 2017 55
Figure 8.2 shows the RN Extended Class (NP) net gain/loss, both over the past
10 years.
During the 2014 renewal, there was a higher number of losses than usual in the
Extended Class, which was largely attributed to the new registration regulation
requirement: the declaration of practice.38 With this new requirement, members
could only renew in the Extended Class if they had:
practised nursing in Ontario within the past three years, or
registered or reinstated with the College within the past three years.
Members who did not meet these conditions could register in the Non-Practising
Class, resign their membership or have the College revoke their membership.
Figure 8.1: RNs in the Extended Class (NPs): Gains and losses
38 Visit www.cno.org/en/maintain-your-membership1/declaration-of-practice/ for more information about the declaration of practice requirement.
145
272
392
229 238
261
230
254
313 317
7 4 13 14 18
39
110
49 58 56
0
50
100
150
200
250
300
350
400
450
2008 2009 2010 2011 2012 2013 2014 2015 2016 2017
RN
s i
n t
he E
xte
nd
ed
Cla
ss
(NP
s)
gain
s a
nd
lo
sses
Year
Gain
Loss

College of Nurses of Ontario – Membership Statistics 2017 56
Figure 8.2: RNs in the Extended Class (NPs): Net gain/loss
Renewal gains for RNs in the Extended Class (NPs)
Figure 8.3 shows the categorization of the RN Extended Class (NP) gains over
the past 10 years.
Figure 8.3: RNs in the Extended Class (NPs) gains: Categorization
138
268
379
215 220 222
120
205
255 261
-400
-300
-200
-100
0
100
200
300
400
500
2008 2009 2010 2011 2012 2013 2014 2015 2016 2017
RN
s i
n t
he E
xte
nd
ed
Cla
ss
(NP
s)
net
gain
/lo
ss
Year
3 6 12 6 20 20 6 12 13 24
142
264
378
220215
237224
239
297 293
2
2
33
4 3
3
0
50
100
150
200
250
300
350
400
450
2008 2009 2010 2011 2012 2013 2014 2015 2016 2017
RN
s i
n t
he E
xte
nd
ed
Cla
ss
(NP
s)
gain
s
Year
Reinstatements
Change in class
New members
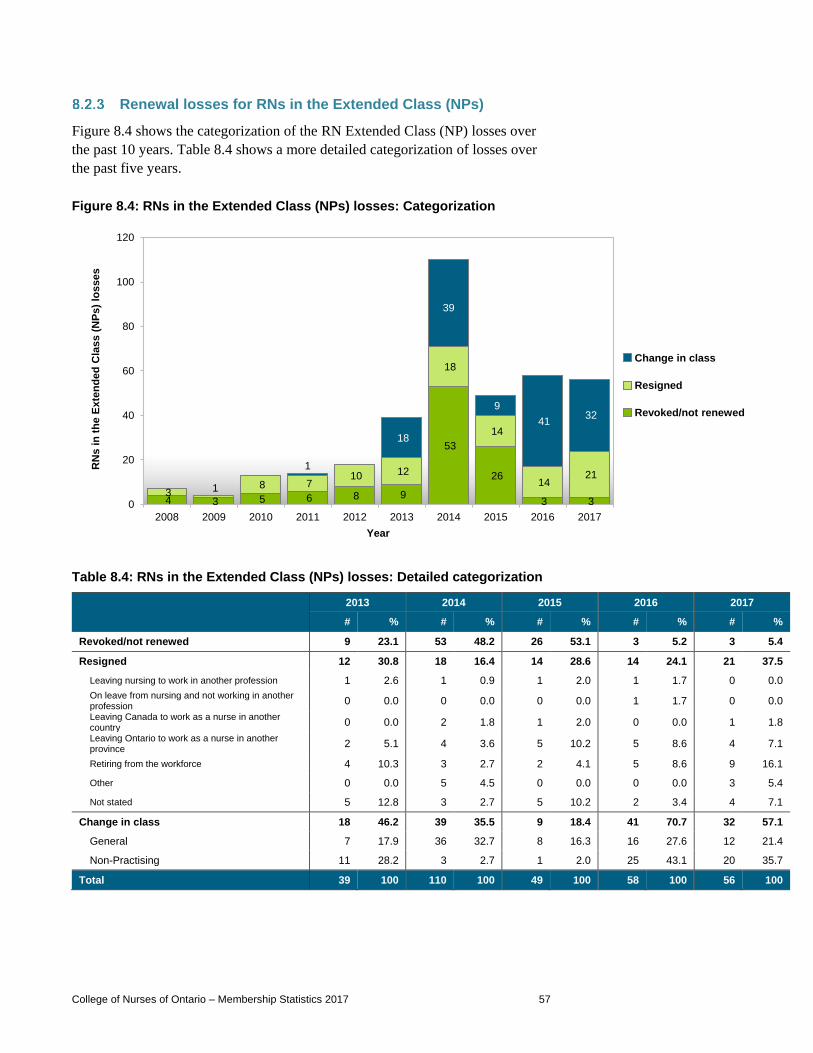
College of Nurses of Ontario – Membership Statistics 2017 57
Renewal losses for RNs in the Extended Class (NPs)
Figure 8.4 shows the categorization of the RN Extended Class (NP) losses over
the past 10 years. Table 8.4 shows a more detailed categorization of losses over
the past five years.
Figure 8.4: RNs in the Extended Class (NPs) losses: Categorization
Table 8.4: RNs in the Extended Class (NPs) losses: Detailed categorization
2013 2014 2015 2016 2017
# % # % # % # % # %
Revoked/not renewed 9 23.1 53 48.2 26 53.1 3 5.2 3 5.4
Resigned 12 30.8 18 16.4 14 28.6 14 24.1 21 37.5
Leaving nursing to work in another profession 1 2.6 1 0.9 1 2.0 1 1.7 0 0.0
On leave from nursing and not working in another profession
0 0.0 0 0.0 0 0.0 1 1.7 0 0.0
Leaving Canada to work as a nurse in another country
0 0.0 2 1.8 1 2.0 0 0.0 1 1.8
Leaving Ontario to work as a nurse in another province
2 5.1 4 3.6 5 10.2 5 8.6 4 7.1
Retiring from the workforce 4 10.3 3 2.7 2 4.1 5 8.6 9 16.1
Other 0 0.0 5 4.5 0 0.0 0 0.0 3 5.4
Not stated 5 12.8 3 2.7 5 10.2 2 3.4 4 7.1
Change in class 18 46.2 39 35.5 9 18.4 41 70.7 32 57.1
General 7 17.9 36 32.7 8 16.3 16 27.6 12 21.4
Non-Practising 11 28.2 3 2.7 1 2.0 25 43.1 20 35.7
Total 39 100 110 100 49 100 58 100 56 100
4 3 5 6 8 9
53
26
3 3 3 1 8 7
10 12
18
14
14 21
1
18
39
9
41 32
0
20
40
60
80
100
120
2008 2009 2010 2011 2012 2013 2014 2015 2016 2017
RN
s i
n t
he E
xte
nd
ed
Cla
ss (
NP
s)
losses
Year
Change in class
Resigned
Revoked/not renewed

College of Nurses of Ontario – Membership Statistics 2017 58
8.3 RNs in the Extended Class (NPs) employed in nursing in Ontario
Figure 8.5 shows the number of RNs in the Extended Class (NPs) employed in
nursing in Ontario over the past 10 years.
Figure 8.5: Number of RNs in the Extended Class (NPs) employed in
nursing in Ontario
Table 8.5 shows the overall working statuses of RNs in the Extended Class (NPs)
employed in nursing in Ontario over the past five years.39
Table 8.5: RNs in the Extended Class (NPs) employed in nursing in Ontario:
Overall working status
2013 2014 2015 2016 2017
# % # % # % # % # %
Full-time 1,711 83.2 1,827 82.7 1,961 81.5 2,133 80.3 2,205 76.9
Part-time 300 14.6 337 15.3 384 16.0 458 17.2 564 19.7
Casual 45 2.2 45 2.0 62 2.6 66 2.5 98 3.4
Total 2,056 100 2,209 100 2,407 100 2,657 100 2,867 100
39 See Section 2.4.3 for information about overall working status.
868
1,120
1,486 1,666
1,874
2,056 2,209
2,407
2,657
2,867
0
500
1,000
1,500
2,000
2,500
3,000
3,500
2008 2009 2010 2011 2012 2013 2014 2015 2016 2017
RN
s i
n t
he E
xte
nd
ed
Cla
ss (
NP
s)
em
plo
yed
in
n
urs
ing
in
On
tari
o
Year

College of Nurses of Ontario – Membership Statistics 2017 59
The College asked RNs in the Extended Class (NPs) employed in nursing in
Ontario what their working status preference was: full-time, part-time or casual.
Table 8.6 shows how the members’ working status preference matched with their
actual overall working status.
Table 8.6: RNs in the Extended Class (NPs) employed in nursing in Ontario:
Working preference
Working preference
Overall working status in Ontario
Full-Time Part-Time Casual
# % # % # %
Full-time 2,080 94.3 203 36.0 42 42.9
Part-time 117 5.3 352 62.4 13 13.3
Casual 8 0.4 9 1.6 43 43.9
Total 2,205 100 564 100 98 100
Demographics of RNs in the Extended Class (NPs)
Of the RNs in the Extended Class (NPs) employed in nursing in Ontario in 2017,
6.5 per cent were male, compared to 4.6 per cent in 2008.
The average age of RN Extended Class (NP) members employed in nursing in
Ontario in 2017 was 44.0 years.
Figure 8.6 shows the age distribution of RNs in the Extended Class (NPs)
employed in nursing in Ontario over the past 10 years and Figure 8.7 shows their
location of nursing education.
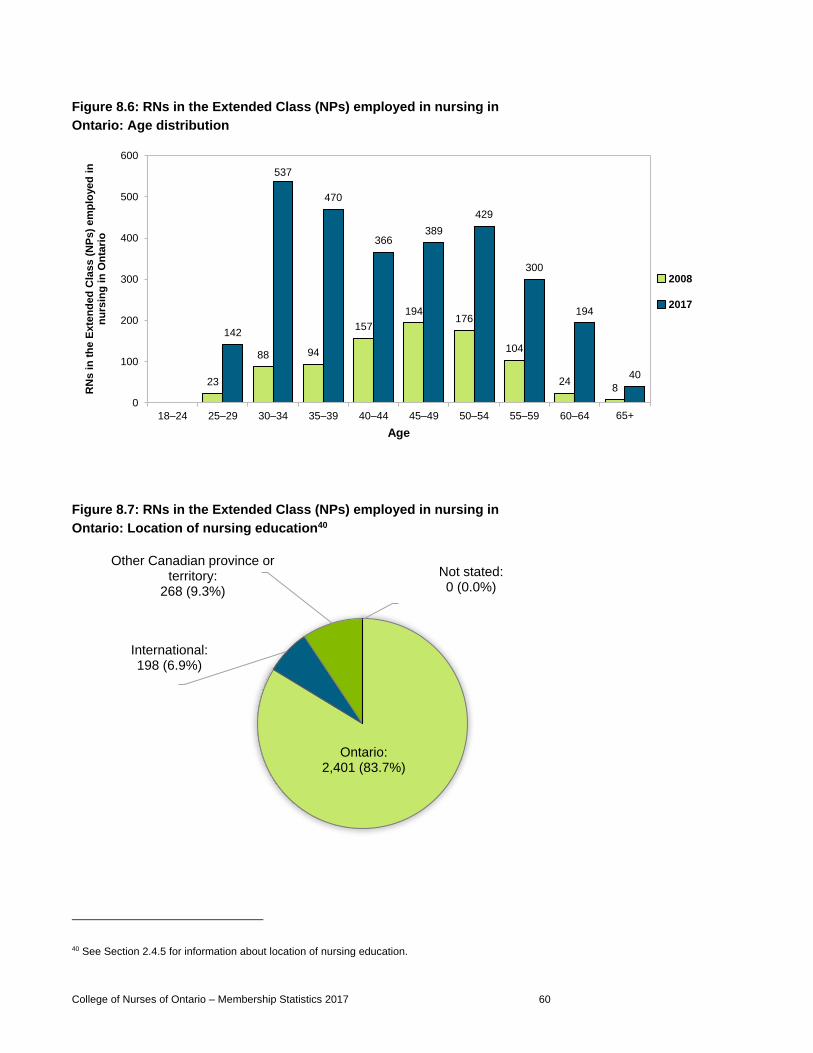
College of Nurses of Ontario – Membership Statistics 2017 60
Figure 8.6: RNs in the Extended Class (NPs) employed in nursing in
Ontario: Age distribution
Figure 8.7: RNs in the Extended Class (NPs) employed in nursing in
Ontario: Location of nursing education40
40 See Section 2.4.5 for information about location of nursing education.
23
88 94
157
194176
104
248
142
537
470
366389
429
300
194
40
0
100
200
300
400
500
600
18–24 25–29 30–34 35–39 40–44 45–49 50–54 55–59 60–64 65+
RN
s i
n t
he E
xte
nd
ed
Cla
ss
(NP
s)
em
plo
yed
in
n
urs
ing
in
On
tari
o
Age
2008
2017
Ontario:2,401 (83.7%)
International:198 (6.9%)
Other Canadian province or territory:
268 (9.3%)
Not stated:0 (0.0%)
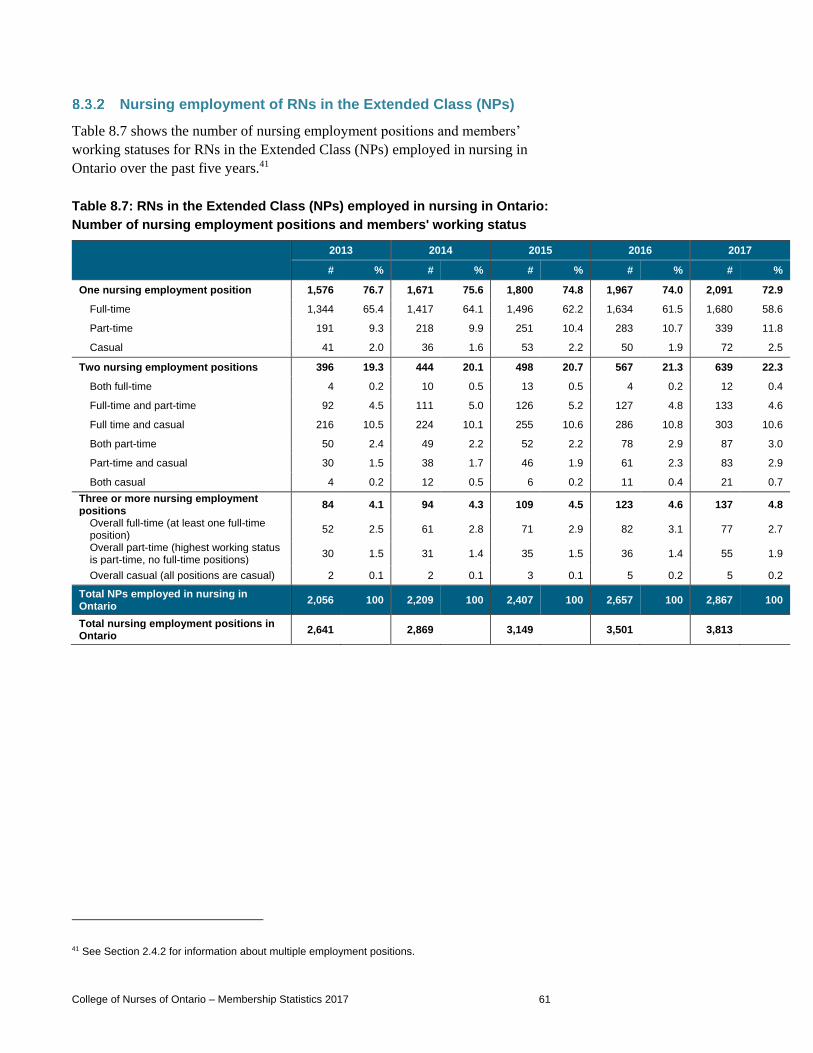
College of Nurses of Ontario – Membership Statistics 2017 61
Nursing employment of RNs in the Extended Class (NPs)
Table 8.7 shows the number of nursing employment positions and members’
working statuses for RNs in the Extended Class (NPs) employed in nursing in
Ontario over the past five years.41
Table 8.7: RNs in the Extended Class (NPs) employed in nursing in Ontario:
Number of nursing employment positions and members' working status
2013 2014 2015 2016 2017
# % # % # % # % # %
One nursing employment position 1,576 76.7 1,671 75.6 1,800 74.8 1,967 74.0 2,091 72.9
Full-time 1,344 65.4 1,417 64.1 1,496 62.2 1,634 61.5 1,680 58.6
Part-time 191 9.3 218 9.9 251 10.4 283 10.7 339 11.8
Casual 41 2.0 36 1.6 53 2.2 50 1.9 72 2.5
Two nursing employment positions 396 19.3 444 20.1 498 20.7 567 21.3 639 22.3
Both full-time 4 0.2 10 0.5 13 0.5 4 0.2 12 0.4
Full-time and part-time 92 4.5 111 5.0 126 5.2 127 4.8 133 4.6
Full time and casual 216 10.5 224 10.1 255 10.6 286 10.8 303 10.6
Both part-time 50 2.4 49 2.2 52 2.2 78 2.9 87 3.0
Part-time and casual 30 1.5 38 1.7 46 1.9 61 2.3 83 2.9
Both casual 4 0.2 12 0.5 6 0.2 11 0.4 21 0.7
Three or more nursing employment positions
84 4.1 94 4.3 109 4.5 123 4.6 137 4.8
Overall full-time (at least one full-time position)
52 2.5 61 2.8 71 2.9 82 3.1 77 2.7
Overall part-time (highest working status is part-time, no full-time positions)
30 1.5 31 1.4 35 1.5 36 1.4 55 1.9
Overall casual (all positions are casual) 2 0.1 2 0.1 3 0.1 5 0.2 5 0.2
Total NPs employed in nursing in Ontario
2,056 100 2,209 100 2,407 100 2,657 100 2,867 100
Total nursing employment positions in Ontario
2,641 2,869 3,149 3,501 3,813
41 See Section 2.4.2 for information about multiple employment positions.
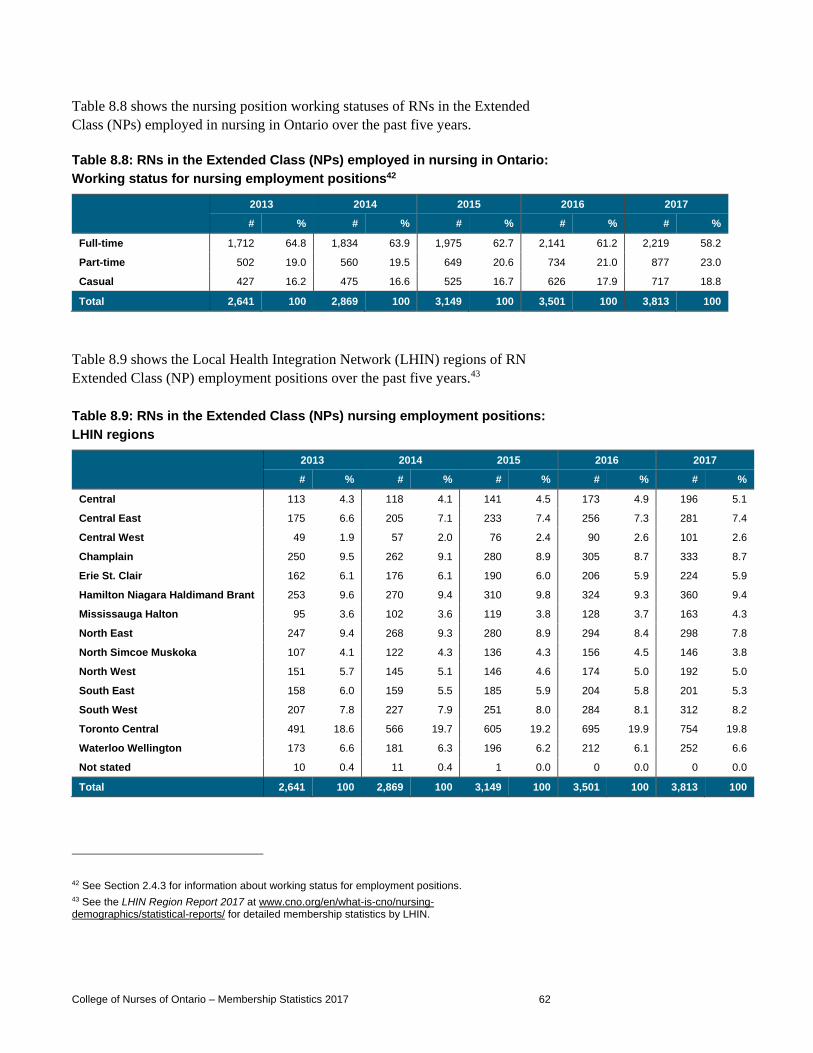
College of Nurses of Ontario – Membership Statistics 2017 62
Table 8.8 shows the nursing position working statuses of RNs in the Extended
Class (NPs) employed in nursing in Ontario over the past five years.
Table 8.8: RNs in the Extended Class (NPs) employed in nursing in Ontario:
Working status for nursing employment positions42
2013 2014 2015 2016 2017
# % # % # % # % # %
Full-time 1,712 64.8 1,834 63.9 1,975 62.7 2,141 61.2 2,219 58.2
Part-time 502 19.0 560 19.5 649 20.6 734 21.0 877 23.0
Casual 427 16.2 475 16.6 525 16.7 626 17.9 717 18.8
Total 2,641 100 2,869 100 3,149 100 3,501 100 3,813 100
Table 8.9 shows the Local Health Integration Network (LHIN) regions of RN
Extended Class (NP) employment positions over the past five years.43
Table 8.9: RNs in the Extended Class (NPs) nursing employment positions:
LHIN regions
2013 2014 2015 2016 2017
# % # % # % # % # %
Central 113 4.3 118 4.1 141 4.5 173 4.9 196 5.1
Central East 175 6.6 205 7.1 233 7.4 256 7.3 281 7.4
Central West 49 1.9 57 2.0 76 2.4 90 2.6 101 2.6
Champlain 250 9.5 262 9.1 280 8.9 305 8.7 333 8.7
Erie St. Clair 162 6.1 176 6.1 190 6.0 206 5.9 224 5.9
Hamilton Niagara Haldimand Brant 253 9.6 270 9.4 310 9.8 324 9.3 360 9.4
Mississauga Halton 95 3.6 102 3.6 119 3.8 128 3.7 163 4.3
North East 247 9.4 268 9.3 280 8.9 294 8.4 298 7.8
North Simcoe Muskoka 107 4.1 122 4.3 136 4.3 156 4.5 146 3.8
North West 151 5.7 145 5.1 146 4.6 174 5.0 192 5.0
South East 158 6.0 159 5.5 185 5.9 204 5.8 201 5.3
South West 207 7.8 227 7.9 251 8.0 284 8.1 312 8.2
Toronto Central 491 18.6 566 19.7 605 19.2 695 19.9 754 19.8
Waterloo Wellington 173 6.6 181 6.3 196 6.2 212 6.1 252 6.6
Not stated 10 0.4 11 0.4 1 0.0 0 0.0 0 0.0
Total 2,641 100 2,869 100 3,149 100 3,501 100 3,813 100
42 See Section 2.4.3 for information about working status for employment positions. 43 See the LHIN Region Report 2017 at www.cno.org/en/what-is-cno/nursing-demographics/statistical-reports/ for detailed membership statistics by LHIN.

College of Nurses of Ontario – Membership Statistics 2017 63
RNs in the Extended Class (NPs) employed as Nurse Practitioners in Ontario
RNs in the Extended Class (NPs) do not work only as Nurse Practitioners.44
While Sections 8.3.1 and 8.3.2 reported all nursing positions in Ontario held by
RNs in the Extended Class (NPs), this section reports only nursing positions
where RNs in the Extended Class (NPs) are employed as Nurse Practitioners. In
2017, 2,604 RNs in the Extended Class (NPs) had at least one employment
position as a Nurse Practitioner in Ontario, totalling 2,973 Nurse Practitioner
positions.
Regarding specialty:
90.6 per cent of RNs in the Extended Class (NPs) with an Adult
specialty worked as a Nurse Practitioner in Ontario
90.5 per cent of RNs in the Extended Class (NPs) with a Paediatrics
specialty worked as a Nurse Practitioner in Ontario
89.9 per cent of RNs in the Extended Class (NPs) with a Primary Health
Care specialty worked as a Nurse Practitioner in Ontario.
Table 8.10 shows the employment position locations for RNs in the Extended
Class (NPs) employed as Nurse Practitioners in Ontario over the past five years.
44 The position in nursing “Nurse Practitioner (NP)” is only applicable to RNs in the Extended Class (NPs). See Table 11.2 for a breakdown of RNs in the Extended Class (NPs) by position in nursing.

College of Nurses of Ontario – Membership Statistics 2017 64
Table 8.10: RNs in the Extended Class (NPs) employed in NP positions in
Ontario: LHIN regions
2013 2014 2015 2016 2017
# % # % # % # % # %
Central 79 4.0 83 3.7 95 3.9 123 4.5 140 4.7
Central East 143 7.2 173 7.8 197 8.0 228 8.3 242 8.1
Central West 36 1.8 46 2.1 55 2.2 65 2.4 71 2.4
Champlain 176 8.8 191 8.6 203 8.3 222 8.1 246 8.3
Erie St. Clair 133 6.7 147 6.6 162 6.6 171 6.2 180 6.1
Hamilton Niagara Haldimand Brant
200 10.0 217 9.8 258 10.5 284 10.3 300 10.1
Mississauga Halton 74 3.7 81 3.6 96 3.9 106 3.9 134 4.5
North East 206 10.3 219 9.9 226 9.2 242 8.8 245 8.2
North Simcoe Muskoka 85 4.3 98 4.4 109 4.4 127 4.6 122 4.1
North West 97 4.9 104 4.7 109 4.4 131 4.8 145 4.9
South East 114 5.7 125 5.6 146 6.0 161 5.9 166 5.6
South West 173 8.7 193 8.7 218 8.9 242 8.8 266 8.9
Toronto Central 347 17.4 397 17.9 430 17.5 479 17.4 518 17.4
Waterloo Wellington 127 6.4 141 6.3 148 6.0 165 6.0 198 6.7
Not stated 6 0.3 7 0.3 0 0.0 0 0.0 0 0.0
Total 1,996 100 2,222 100 2,452 100 2,746 100 2,973 100
Table 8.11 shows the employment sector breakdown for RNs in the Extended
Class (NPs) employed as Nurse Practitioners in Ontario.
Table 8.11: RNs in the Extended Class (NPs) employed in NP positions in
Ontario: Employment sectors
2013 2014 2015 2016 2017
# % # % # % # % # %
Hospital 700 35.1 796 35.8 874 35.6 954 34.7 1,017 34.2
Community 1,180 59.1 1,311 59.0 1,436 58.6 1,609 58.6 1,707 57.4
Long-term care 67 3.4 69 3.1 83 3.4 94 3.4 131 4.4
Other 49 2.5 46 2.1 59 2.4 89 3.2 118 4.0
Total 1,996 100 2,222 100 2,452 100 2,746 100 2,973 100

College of Nurses of Ontario – Membership Statistics 2017 65
The top five employers and areas of practice for RNs in the Extended Class
(NPs) employed as Nurse Practitioners are as follows:
Table 8.12: RNs in the Extended Class (NPs) employed in NP positions in
Ontario: Top five nursing employers
2016
2017
# % # %
Acute care hospital 830 30.2 Acute care hospital 888 29.9
Family health team 548 20.0 Family health team 563 18.9
Community health centre 461 16.8 Community health centre 462 15.5
Physician's office 135 4.9 Physician's office 165 5.5
NP-led clinic 127 4.6 NP-led clinic 127 4.3
Other employers 645 23.5 Other employers 768 25.8
Total 2,746 100 Total 2,973 100
Table 8.13: RNs in the Extended Class (NPs) employed in NP positions in
Ontario: Top five areas of practice
2016
2017
# % # %
Primary care 1,426 51.9 Primary care 1,527 51.4
Geriatrics 188 6.8 Geriatrics 227 7.6
Acute care 147 5.4 Acute care 157 5.3
Cardiac care 113 4.1 Cardiac care 106 3.6
Emergency 96 3.5 Emergency 98 3.3
Other areas of practice 776 28.3 Other areas of practice 858 28.9
Total 2,746 100 Total 2,973 100
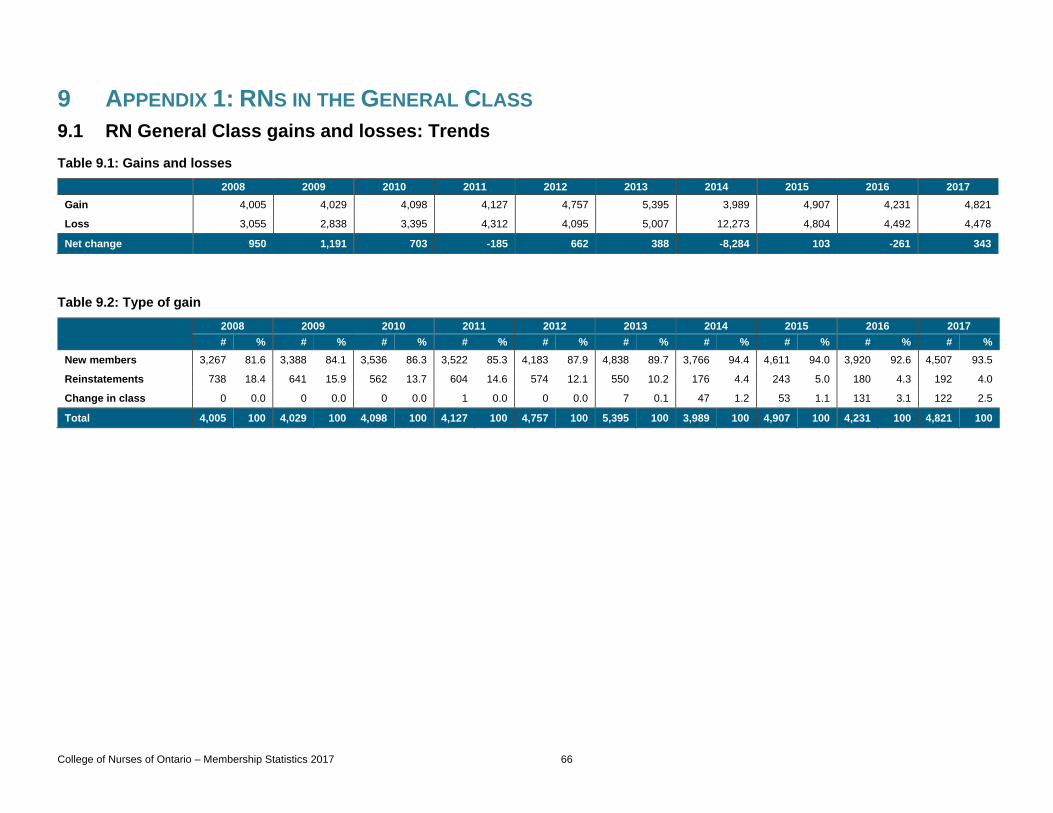
College of Nurses of Ontario – Membership Statistics 2017 66
9 APPENDIX 1: RNS IN THE GENERAL CLASS
9.1 RN General Class gains and losses: Trends
Table 9.1: Gains and losses
2008 2009 2010 2011 2012 2013 2014 2015 2016 2017
Gain 4,005 4,029 4,098 4,127 4,757 5,395 3,989 4,907 4,231 4,821
Loss 3,055 2,838 3,395 4,312 4,095 5,007 12,273 4,804 4,492 4,478
Net change 950 1,191 703 -185 662 388 -8,284 103 -261 343
Table 9.2: Type of gain
2008 2009 2010 2011 2012 2013 2014 2015 2016 2017
# % # % # % # % # % # % # % # % # % # %
New members 3,267 81.6 3,388 84.1 3,536 86.3 3,522 85.3 4,183 87.9 4,838 89.7 3,766 94.4 4,611 94.0 3,920 92.6 4,507 93.5
Reinstatements 738 18.4 641 15.9 562 13.7 604 14.6 574 12.1 550 10.2 176 4.4 243 5.0 180 4.3 192 4.0
Change in class 0 0.0 0 0.0 0 0.0 1 0.0 0 0.0 7 0.1 47 1.2 53 1.1 131 3.1 122 2.5
Total 4,005 100 4,029 100 4,098 100 4,127 100 4,757 100 5,395 100 3,989 100 4,907 100 4,231 100 4,821 100

Appendix 1: RNs in the General Class
College of Nurses of Ontario – Membership Statistics 2017 67
Table 9.3: Gains by age group
2008 2009 2010 2011 2012 2013 2014 2015 2016 2017
# % # % # % # % # % # % # % # % # % # %
18–24 1,357 33.9 1,153 28.6 1,163 28.4 1,538 37.3 1,895 39.8 2,087 38.7 1,915 48.0 2,155 43.9 1,749 41.3 2,062 42.8
25–29 1,065 26.6 1,147 28.5 1,242 30.3 991 24.0 1,249 26.3 1,432 26.5 996 25.0 1,274 26.0 1,136 26.8 1,279 26.5
30–34 444 11.1 494 12.3 502 12.2 488 11.8 511 10.7 667 12.4 411 10.3 583 11.9 519 12.3 616 12.8
35–39 374 9.3 426 10.6 384 9.4 354 8.6 377 7.9 421 7.8 247 6.2 326 6.6 306 7.2 324 6.7
40–44 245 6.1 315 7.8 300 7.3 289 7.0 306 6.4 313 5.8 184 4.6 254 5.2 198 4.7 221 4.6
45–49 214 5.3 221 5.5 219 5.3 210 5.1 188 4.0 202 3.7 116 2.9 145 3.0 148 3.5 148 3.1
50–54 128 3.2 125 3.1 118 2.9 122 3.0 96 2.0 133 2.5 51 1.3 80 1.6 82 1.9 90 1.9
55–59 91 2.3 72 1.8 88 2.1 71 1.7 82 1.7 67 1.2 44 1.1 48 1.0 63 1.5 40 0.8
60–64 56 1.4 36 0.9 50 1.2 44 1.1 33 0.7 39 0.7 16 0.4 33 0.7 23 0.5 27 0.6
65+ 31 0.8 39 1.0 30 0.7 20 0.5 20 0.4 34 0.6 9 0.2 9 0.2 7 0.2 14 0.3
Not stated 0 0.0 1 0.0 2 0.0 0 0.0 0 0.0 0 0.0 0 0.0 0 0.0 0 0.0 0 0.0
Total 4,005 100 4,029 100 4,098 100 4,127 100 4,757 100 5,395 100 3,989 100 4,907 100 4,231 100 4,821 100
Table 9.4: Type of loss
2008 2009 2010 2011 2012 2013 2014 2015 2016 2017
# % # % # % # % # % # % # % # % # % # %
Revoked 1,406 46.0 1,177 41.5 1,453 42.8 2,194 50.9 1,626 39.7 969 19.4 6,008 49.0 711 14.8 610 13.6 538 12.0
Resigned 1,507 49.3 1,397 49.2 1,564 46.1 1,898 44.0 2,254 55.0 2,103 42.0 3,183 25.9 2,097 43.7 2,154 48.0 2,339 52.2
Change in class 142 4.6 264 9.3 378 11.1 220 5.1 215 5.3 1,935 38.6 3,082 25.1 1,996 41.5 1,728 38.5 1,601 35.8
Total 3,055 100 2,838 100 3,395 100 4,312 100 4,095 100 5,007 100 12,273 100 4,804 100 4,492 100 4,478 100

Appendix 1: RNs in the General Class
College of Nurses of Ontario – Membership Statistics 2017 68
Table 9.5: Losses by age group
2008 2009 2010 2011 2012 2013 2014 2015 2016 2017
# % # % # % # % # % # % # % # % # % # %
18–24 32 1.0 27 1.0 34 1.0 26 0.6 50 1.2 59 1.2 96 0.8 103 2.1 94 2.1 98 2.2
25–29 177 5.8 153 5.4 153 4.5 194 4.5 247 6.0 272 5.4 452 3.7 369 7.7 365 8.1 357 8.0
30–34 232 7.6 194 6.8 238 7.0 196 4.5 220 5.4 223 4.5 667 5.4 255 5.3 296 6.6 237 5.3
35–39 215 7.0 246 8.7 265 7.8 239 5.5 187 4.6 219 4.4 796 6.5 217 4.5 178 4.0 160 3.6
40–44 233 7.6 211 7.4 272 8.0 227 5.3 202 4.9 220 4.4 1,125 9.2 196 4.1 143 3.2 152 3.4
45–49 206 6.7 224 7.9 264 7.8 260 6.0 204 5.0 276 5.5 1,245 10.1 210 4.4 188 4.2 156 3.5
50–54 246 8.1 221 7.8 271 8.0 262 6.1 250 6.1 330 6.6 1,353 11.0 285 5.9 245 5.5 224 5.0
55–59 464 15.2 371 13.1 461 13.6 564 13.1 673 16.4 889 17.8 2,189 17.8 713 14.8 657 14.6 648 14.5
60–64 684 22.4 605 21.3 714 21.0 1,013 23.5 1166 28.5 1,413 28.2 2,581 21.0 1,360 28.3 1,294 28.8 1,314 29.3
65+ 566 18.5 586 20.6 723 21.3 1,331 30.9 896 21.9 1,106 22.1 1,769 14.4 1,096 22.8 1,032 23.0 1,132 25.3
Not stated 0 0.0 0 0.0 0 0.0 0 0.0 0 0.0 0 0.0 0 0.0 0 0.0 0 0.0 0 0.0
Total 3,055 100 2,838 100 3,395 100 4,312 100 4,095 100 5,007 100 12,273 100 4,804 100 4,492 100 4,478 100

Appendix 1: RNs in the General Class
College of Nurses of Ontario – Membership Statistics 2017 69
Detailed breakdown of RN General Class losses
Table 9.6 shows loss reasons (revoked, resigned and change in class) for
members broken down into three age groups (18–29, 30–54 and 55+).
Table 9.6: Loss reasons by age group
a) Losses aged 18–29
Loss category 2013 2014 2015 2016 2017
# % # % # % # % # %
Revoked/not renewed 95 28.7 299 54.6 97 20.6 82 17.9 79 17.4
Resigned 85 25.7 114 20.8 91 19.3 115 25.1 105 23.1
Change in class 151 45.6 135 24.6 284 60.2 262 57.1 271 59.6
Extended 88 26.6 74 13.5 85 18.0 99 21.6 121 26.6
Non-Practising 63 19.0 61 11.1 199 42.2 163 35.5 150 33.0
Total 331 100 548 100 472 100 459 100 455 100
b) Losses aged 30–54
Loss category 2013 2014 2015 2016 2017
# % # % # % # % # %
Revoked/not renewed 348 27.4 2,958 57.0 253 21.8 200 19.0 156 16.8
Resigned 334 26.3 529 10.2 213 18.3 238 22.7 261 28.1
Change in class 586 46.2 1,699 32.8 697 59.9 612 58.3 512 55.1
Extended 145 11.4 140 2.7 150 12.9 192 18.3 165 17.8
Non-Practising 441 34.8 1,559 30.1 547 47.0 420 40.0 347 37.4
Total 1,268 100 5,186 100 1,163 100 1,050 100 929 100
c) Losses aged 55+
Loss category 2013 2014 2015 2016 2017
# % # % # % # % # %
Revoked/not renewed 526 15.4 2,751 42.1 361 11.4 328 11.0 303 9.8
Resigned 1,684 49.4 2,540 38.8 1,793 56.6 1,801 60.4 1,973 63.8
Change in class 1,198 35.2 1,248 19.1 1,015 32.0 854 28.6 818 26.4
Extended 4 0.1 10 0.2 3 0.1 2 0.1 4 0.1
Non-Practising 1,194 35.0 1,238 18.9 1,012 31.9 852 28.6 814 26.3
Total 3,408 100 6,539 100 3,169 100 2,983 100 3,094 100

Appendix 1: RNs in the General Class
College of Nurses of Ontario – Membership Statistics 2017 70
Table 9.7 shows the employment status of RNs in the General Class in the
practice year before they became a loss.
For example, of the 4,492 RN losses from the General Class for 2016, 63.3 per
cent reported being employed in nursing during the 2015 renewal, 24.3 per cent
were not employed, 3.1 percent were employed in non-nursing only and 9.3 per
cent were on leave.
Table 9.7: Employment status of losses in the previous practice year
2013 2014 2015 2016 2017
# % # % # % # % # %
Employed in nursing or both nursing & non-nursing
2,397 47.9 5,783 47.1 2,940 61.2 2,845 63.3 2,752 61.5
In Ontario or inside and outside Ontario
1,914 38.2 2,304 18.8 2,485 51.7 2,517 56.0 2,521 56.3
Outside Ontario 482 9.6 3,477 28.3 455 9.5 328 7.3 231 5.2
Location not stated 1 0.0 2 0.0 0 0.0 0 0.0 0 0.0
Employed in non-nursing 630 12.6 1,614 13.2 161 3.4 138 3.1 109 2.4
Seeking nursing employment 43 0.9 163 1.3 58 1.2 62 1.4 37 0.8
Not employed 1,331 26.6 3,723 30.3 1,241 25.8 1,092 24.3 1,218 27.2
Seeking nursing employment 214 4.3 747 6.1 444 9.2 365 8.1 414 9.2
On leave 649 13.0 1,153 9.4 462 9.6 417 9.3 399 8.9
Not stated 0 0.0 0 0.0 0 0.0 0 0.0 0 0.0
Total 5,007 100 12,273 100 4,804 100 4,492 100 4,478 100

Appendix 1: RNs in the General Class
College of Nurses of Ontario – Membership Statistics 2017 71
Table 9.8 shows a breakdown of losses by employment status in Table 9.7.
Table 9.8: Losses by employment status during previous practice year:
Categorization
a) Employed in nursing in Ontario45
2013 2014 2015 2016 2017
# % # % # % # % # %
Revoked/not renewed 429 22.4 939 40.8 433 17.4 357 14.2 314 12.5
Resigned 886 46.3 1,177 51.1 1,291 52.0 1,356 53.9 1,428 56.6
Change in class 599 31.3 188 8.2 761 30.6 804 31.9 779 30.9
Extended 201 10.5 180 7.8 210 8.5 255 10.1 256 10.2
Non-Practising 398 20.8 8 0.3 551 22.2 549 21.8 523 20.7
Total 1,914 100 2,304 100 2,485 100 2,517 100 2,521 100
b) Employed in nursing outside Ontario
2013 2014 2015 2016 2017
# % # % # % # % # %
Revoked/not renewed 124 25.7 1,902 54.7 63 13.8 48 14.6 48 20.8
Resigned 171 35.5 389 11.2 60 13.2 71 21.6 69 29.9
Change in class 187 38.8 1,186 34.1 332 73.0 209 63.7 114 49.4
Extended 12 2.5 13 0.4 6 1.3 3 0.9 6 2.6
Non-Practising 175 36.3 1173 33.7 326 71.6 206 62.8 108 46.8
Total 482 100 3,477 100 455 100 328 100 231 100
c) Employed in non-nursing
2013 2014 2015 2016 2017
# % # % # % # % # %
Revoked/not renewed 104 16.5 822 50.9 17 10.6 21 15.2 10 9.2
Resigned 217 34.4 229 14.2 42 26.1 48 34.8 45 41.3
Change in class 309 49.0 563 34.9 102 63.4 69 50.0 54 49.5
Extended 5 0.8 2 0.1 1 0.6 3 2.2 1 0.9
Non-Practising 304 48.3 561 34.8 101 62.7 66 47.8 53 48.6
Total 630 100 1,614 100 161 100 138 100 109 100
45 This status combines the following statuses: employed in nursing in Ontario; employed in nursing in and outside Ontario; employed in nursing and non-nursing in Ontario; and employed in nursing and non-nursing in and outside Ontario.
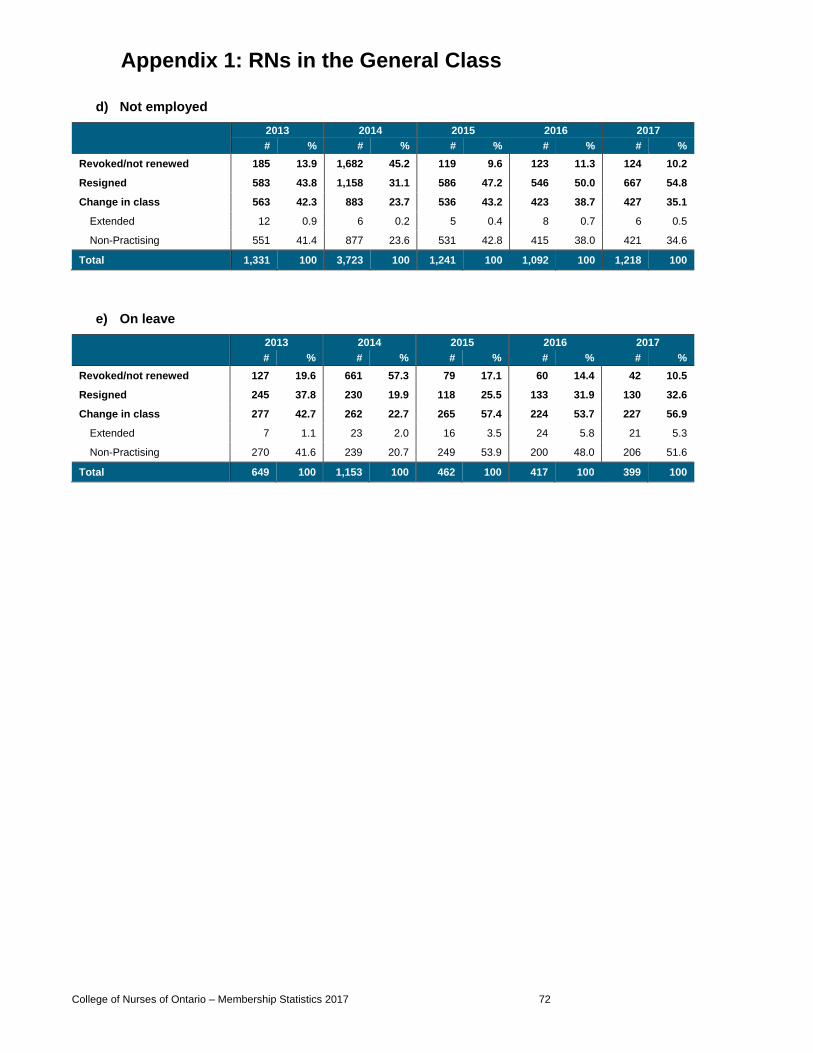
Appendix 1: RNs in the General Class
College of Nurses of Ontario – Membership Statistics 2017 72
d) Not employed
2013 2014 2015 2016 2017
# % # % # % # % # %
Revoked/not renewed 185 13.9 1,682 45.2 119 9.6 123 11.3 124 10.2
Resigned 583 43.8 1,158 31.1 586 47.2 546 50.0 667 54.8
Change in class 563 42.3 883 23.7 536 43.2 423 38.7 427 35.1
Extended 12 0.9 6 0.2 5 0.4 8 0.7 6 0.5
Non-Practising 551 41.4 877 23.6 531 42.8 415 38.0 421 34.6
Total 1,331 100 3,723 100 1,241 100 1,092 100 1,218 100
e) On leave
2013 2014 2015 2016 2017
# % # % # % # % # %
Revoked/not renewed 127 19.6 661 57.3 79 17.1 60 14.4 42 10.5
Resigned 245 37.8 230 19.9 118 25.5 133 31.9 130 32.6
Change in class 277 42.7 262 22.7 265 57.4 224 53.7 227 56.9
Extended 7 1.1 23 2.0 16 3.5 24 5.8 21 5.3
Non-Practising 270 41.6 239 20.7 249 53.9 200 48.0 206 51.6
Total 649 100 1,153 100 462 100 417 100 399 100
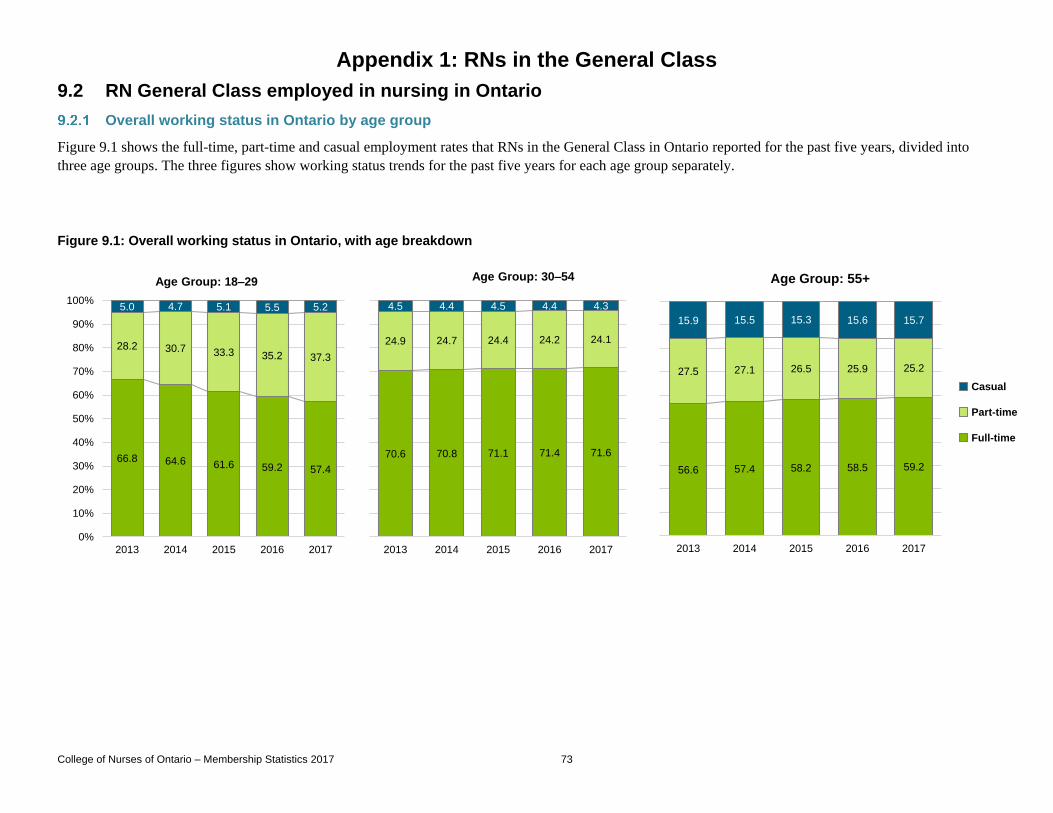
Appendix 1: RNs in the General Class
College of Nurses of Ontario – Membership Statistics 2017 73
9.2 RN General Class employed in nursing in Ontario
Overall working status in Ontario by age group
Figure 9.1 shows the full-time, part-time and casual employment rates that RNs in the General Class in Ontario reported for the past five years, divided into
three age groups. The three figures show working status trends for the past five years for each age group separately.
Figure 9.1: Overall working status in Ontario, with age breakdown
66.8 64.6 61.6 59.2 57.4
28.2 30.7 33.3 35.2 37.3
5.0 4.7 5.1 5.5 5.2
0%
10%
20%
30%
40%
50%
60%
70%
80%
90%
100%
2013 2014 2015 2016 2017
Age Group: 18–29
70.6 70.8 71.1 71.4 71.6
24.9 24.7 24.4 24.2 24.1
4.5 4.4 4.5 4.4 4.3
2013 2014 2015 2016 2017
Age Group: 30–54
56.6 57.4 58.2 58.5 59.2
27.5 27.1 26.5 25.9 25.2
15.9 15.5 15.3 15.6 15.7
2013 2014 2015 2016 2017
Age Group: 55+
Casual
Part-time
Full-time

Appendix 1: RNs in the General Class
College of Nurses of Ontario – Membership Statistics 2017 74
Ontario nursing employment sector statistics
Table 9.9: Nursing employers in Ontario: RN General Class46
Hospital Community Long-term care Other
Total nursing positions
# % # % # % # % # %
Acute care hospital 60,823 88.5 60,823 54.1
Addiction and mental health centre / psychiatric hospital
3,154 4.6 3,154 2.8
Complex continuing care hospital 1,671 2.4 1,671 1.5
Rehabilitation hospital 1,562 2.3 1,562 1.4
Other hospital 1,545 2.2 1,545 1.4
Blood transfusion centre 82 0.4 82 0.1
Cancer centre 640 2.9 640 0.6
Children’s treatment centre 60 0.3 60 0.1
Client's environment 443 2.0 443 0.4
Community Care Access Centre 4,244 19.0 4,244 3.8
Community health centre 1,225 5.5 1,225 1.1
Community mental health program
640 2.9 640 0.6
Diabetes education centre 194 0.9 194 0.2
Family health team 1,136 5.1 1,136 1.0
Hospice 542 2.4 542 0.5
Nurse Practitioner-led clinic 55 0.2 55 0.0
Nursing/staffing agency 2,255 10.1 2,255 2.0
Physician's office 2,541 11.4 2,541 2.3
Public health unit / department 3,937 17.6 3,937 3.5
Remote nursing station 312 1.4 312 0.3
Other community 4,055 18.1 4,055 3.6
Long-term care facility 9,278 92.4 9,278 8.3
Retirement home 527 5.2 527 0.5
Other long-term care facility 239 2.4 239 0.2
College / university 4,203 37.3 4,203 3.7
Correctional facility 755 6.7 755 0.7
Government / association / regulatory body / union
1,412 12.5 1,412 1.3
Health-related business / industry 1,851 16.4 1,851 1.6
Industry (not health-related) 368 3.3 368 0.3
School 442 3.9 442 0.4
Spa 88 0.8 88 0.1
Telephone health advisory services
222 2.0 222 0.2
Other 1,929 17.1 1,929 1.7
Sector total 68,755 100 22,361 100 10,044 100 11,270 100 112,430 100
46 See Section 12.1 for descriptions of listed nursing employers.
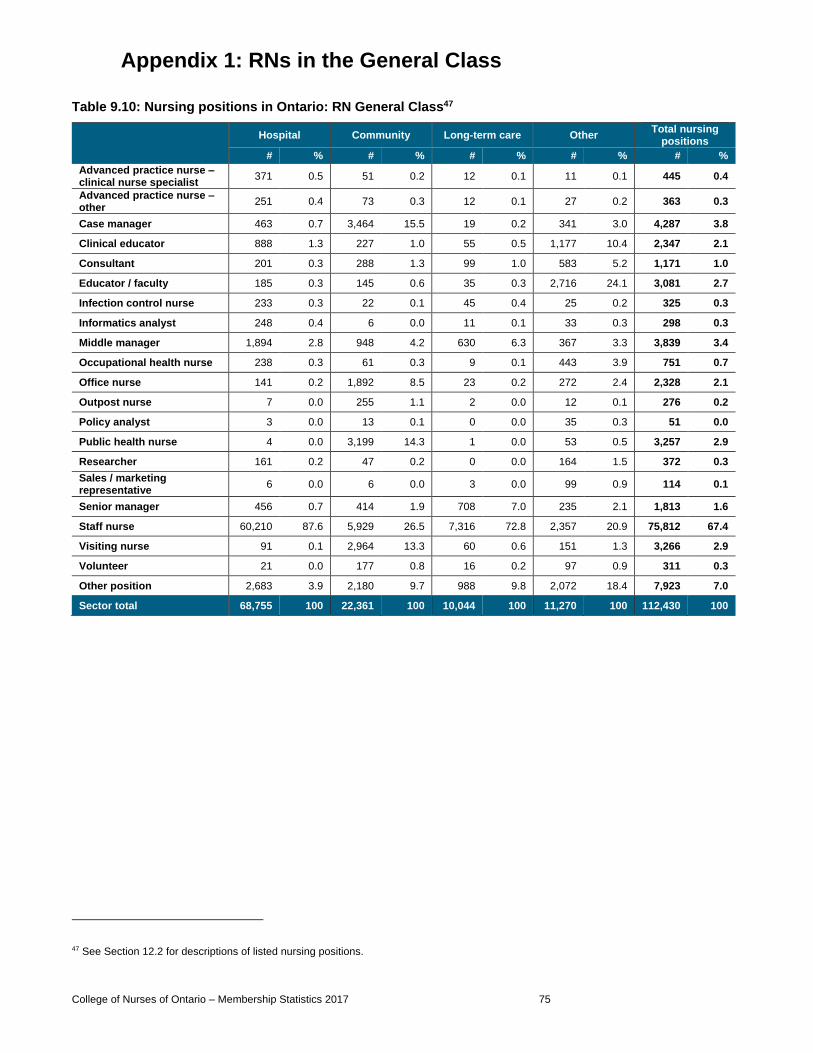
Appendix 1: RNs in the General Class
College of Nurses of Ontario – Membership Statistics 2017 75
Table 9.10: Nursing positions in Ontario: RN General Class47
Hospital Community Long-term care Other
Total nursing positions
# % # % # % # % # %
Advanced practice nurse –clinical nurse specialist
371 0.5 51 0.2 12 0.1 11 0.1 445 0.4
Advanced practice nurse –other
251 0.4 73 0.3 12 0.1 27 0.2 363 0.3
Case manager 463 0.7 3,464 15.5 19 0.2 341 3.0 4,287 3.8
Clinical educator 888 1.3 227 1.0 55 0.5 1,177 10.4 2,347 2.1
Consultant 201 0.3 288 1.3 99 1.0 583 5.2 1,171 1.0
Educator / faculty 185 0.3 145 0.6 35 0.3 2,716 24.1 3,081 2.7
Infection control nurse 233 0.3 22 0.1 45 0.4 25 0.2 325 0.3
Informatics analyst 248 0.4 6 0.0 11 0.1 33 0.3 298 0.3
Middle manager 1,894 2.8 948 4.2 630 6.3 367 3.3 3,839 3.4
Occupational health nurse 238 0.3 61 0.3 9 0.1 443 3.9 751 0.7
Office nurse 141 0.2 1,892 8.5 23 0.2 272 2.4 2,328 2.1
Outpost nurse 7 0.0 255 1.1 2 0.0 12 0.1 276 0.2
Policy analyst 3 0.0 13 0.1 0 0.0 35 0.3 51 0.0
Public health nurse 4 0.0 3,199 14.3 1 0.0 53 0.5 3,257 2.9
Researcher 161 0.2 47 0.2 0 0.0 164 1.5 372 0.3
Sales / marketing representative
6 0.0 6 0.0 3 0.0 99 0.9 114 0.1
Senior manager 456 0.7 414 1.9 708 7.0 235 2.1 1,813 1.6
Staff nurse 60,210 87.6 5,929 26.5 7,316 72.8 2,357 20.9 75,812 67.4
Visiting nurse 91 0.1 2,964 13.3 60 0.6 151 1.3 3,266 2.9
Volunteer 21 0.0 177 0.8 16 0.2 97 0.9 311 0.3
Other position 2,683 3.9 2,180 9.7 988 9.8 2,072 18.4 7,923 7.0
Sector total 68,755 100 22,361 100 10,044 100 11,270 100 112,430 100
47 See Section 12.2 for descriptions of listed nursing positions.

Appendix 1: RNs in the General Class
College of Nurses of Ontario – Membership Statistics 2017 76
Table 9.11: Areas of practice in Ontario: RN General Class48
Hospital Community
Long-term care
Other Total nursing
positions
# % # % # % # % # %
Acute care 9,359 13.6 563 2.5 31 0.3 600 5.3 10,553 9.4
Administration 909 1.3 591 2.6 413 4.1 461 4.1 2,374 2.1
Cancer care 1,993 2.9 673 3.0 1 0.0 77 0.7 2,744 2.4
Cardiac care 2,776 4.0 104 0.5 1 0.0 66 0.6 2,947 2.6
Case management 158 0.2 3,145 14.1 19 0.2 494 4.4 3,816 3.4
Chronic disease prevention / management
149 0.2 723 3.2 45 0.4 110 1.0 1,027 0.9
Complex continuing care 1,364 2.0 455 2.0 253 2.5 90 0.8 2,162 1.9
Critical care 7,497 10.9 44 0.2 4 0.0 126 1.1 7,671 6.8
Diabetes care 272 0.4 435 1.9 0 0.0 52 0.5 759 0.7
Education 290 0.4 319 1.4 53 0.5 2,796 24.8 3,458 3.1
Emergency 7,288 10.6 103 0.5 1 0.0 89 0.8 7,481 6.7
Foot care 5 0.0 294 1.3 41 0.4 76 0.7 416 0.4
Geriatrics 703 1.0 441 2.0 8,303 82.7 276 2.4 9,723 8.6
Infection prevention / control 227 0.3 161 0.7 42 0.4 57 0.5 487 0.4
Informatics 310 0.5 38 0.2 12 0.1 107 0.9 467 0.4
Maternal / newborn 5,401 7.9 522 2.3 2 0.0 232 2.1 6,157 5.5
Medicine 5,090 7.4 431 1.9 61 0.6 299 2.7 5,881 5.2
Mental health / psychiatric / addiction
5,487 8.0 933 4.2 36 0.4 453 4.0 6,909 6.1
Nephrology 2,380 3.5 90 0.4 1 0.0 48 0.4 2,519 2.2
Occupational health 294 0.4 96 0.4 14 0.1 557 4.9 961 0.9
Palliative care 547 0.8 1,431 6.4 86 0.9 55 0.5 2,119 1.9
Perioperative care 4,268 6.2 272 1.2 0 0.0 214 1.9 4,754 4.2
Policy 19 0.0 24 0.1 8 0.1 94 0.8 145 0.1
Primary care 315 0.5 3,076 13.8 283 2.8 621 5.5 4,295 3.8
Public health 13 0.0 3,577 16.0 5 0.0 255 2.3 3,850 3.4
Rehabilitation 1,791 2.6 120 0.5 40 0.4 121 1.1 2,072 1.8
Sales 3 0.0 6 0.0 1 0.0 69 0.6 79 0.1
Surgery 5,125 7.5 465 2.1 5 0.0 310 2.8 5,905 5.3
Telehealth services 70 0.1 58 0.3 0 0.0 229 2.0 357 0.3
Other responsibility 4,652 6.8 3,171 14.2 283 2.8 2,236 19.8 10,342 9.2
Sector total 68,755 100 22,361 100 10,044 100 11,270 100 112,430 100
48 See Section 12.3 for descriptions of listed areas of practice.
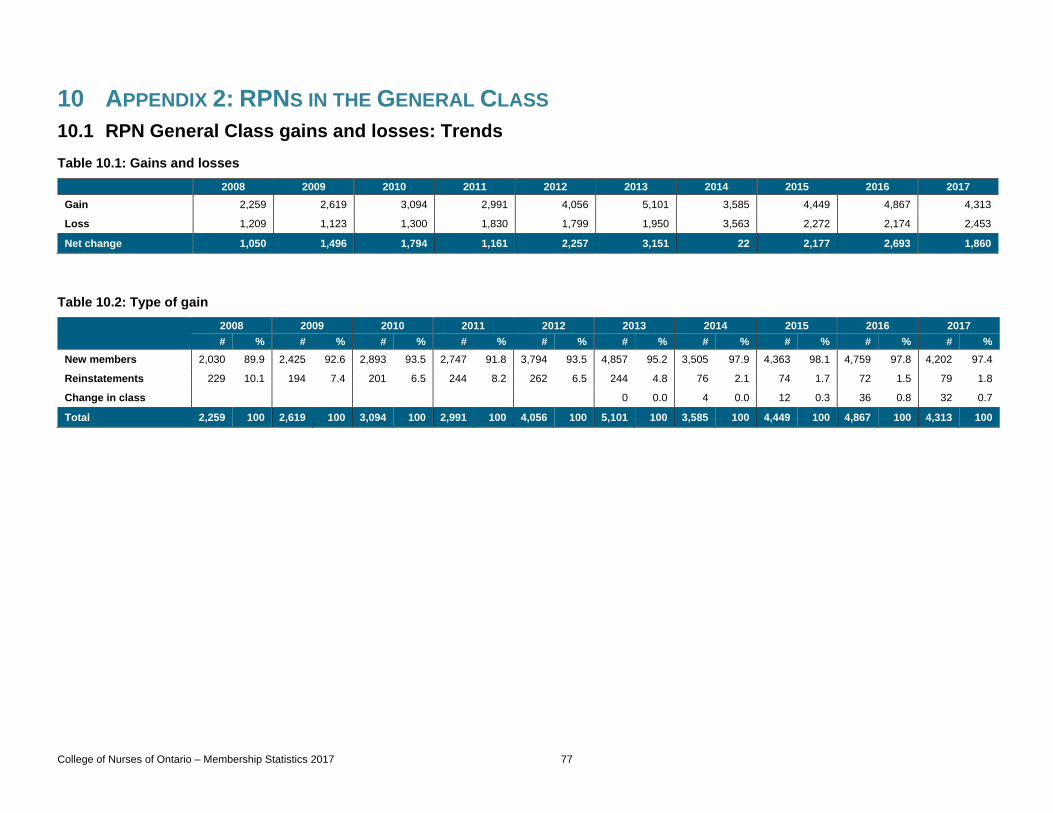
College of Nurses of Ontario – Membership Statistics 2017 77
10 APPENDIX 2: RPNS IN THE GENERAL CLASS
10.1 RPN General Class gains and losses: Trends
Table 10.1: Gains and losses
2008 2009 2010 2011 2012 2013 2014 2015 2016 2017
Gain 2,259 2,619 3,094 2,991 4,056 5,101 3,585 4,449 4,867 4,313
Loss 1,209 1,123 1,300 1,830 1,799 1,950 3,563 2,272 2,174 2,453
Net change 1,050 1,496 1,794 1,161 2,257 3,151 22 2,177 2,693 1,860
Table 10.2: Type of gain
2008 2009 2010 2011 2012 2013 2014 2015 2016 2017
# % # % # % # % # % # % # % # % # % # %
New members 2,030 89.9 2,425 92.6 2,893 93.5 2,747 91.8 3,794 93.5 4,857 95.2 3,505 97.9 4,363 98.1 4,759 97.8 4,202 97.4
Reinstatements 229 10.1 194 7.4 201 6.5 244 8.2 262 6.5 244 4.8 76 2.1 74 1.7 72 1.5 79 1.8
Change in class 0 0.0 4 0.0 12 0.3 36 0.8 32 0.7
Total 2,259 100 2,619 100 3,094 100 2,991 100 4,056 100 5,101 100 3,585 100 4,449 100 4,867 100 4,313 100
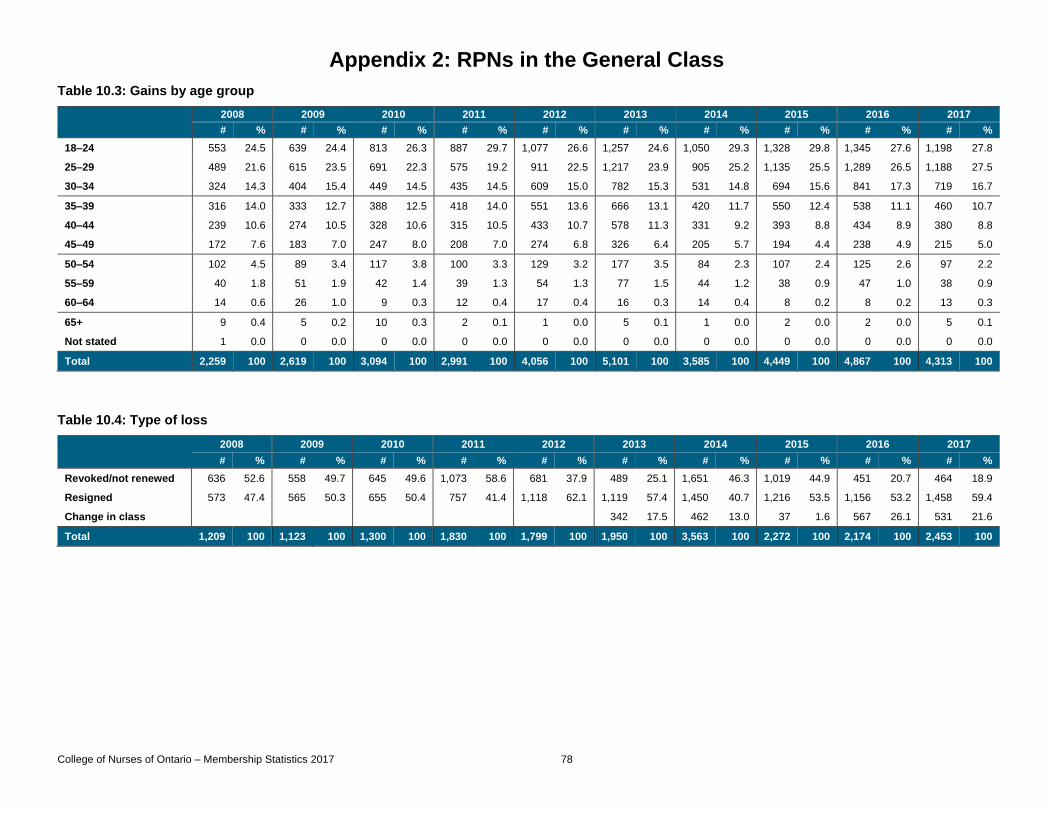
Appendix 2: RPNs in the General Class
College of Nurses of Ontario – Membership Statistics 2017 78
Table 10.3: Gains by age group
2008 2009 2010 2011 2012 2013 2014 2015 2016 2017
# % # % # % # % # % # % # % # % # % # %
18–24 553 24.5 639 24.4 813 26.3 887 29.7 1,077 26.6 1,257 24.6 1,050 29.3 1,328 29.8 1,345 27.6 1,198 27.8
25–29 489 21.6 615 23.5 691 22.3 575 19.2 911 22.5 1,217 23.9 905 25.2 1,135 25.5 1,289 26.5 1,188 27.5
30–34 324 14.3 404 15.4 449 14.5 435 14.5 609 15.0 782 15.3 531 14.8 694 15.6 841 17.3 719 16.7
35–39 316 14.0 333 12.7 388 12.5 418 14.0 551 13.6 666 13.1 420 11.7 550 12.4 538 11.1 460 10.7
40–44 239 10.6 274 10.5 328 10.6 315 10.5 433 10.7 578 11.3 331 9.2 393 8.8 434 8.9 380 8.8
45–49 172 7.6 183 7.0 247 8.0 208 7.0 274 6.8 326 6.4 205 5.7 194 4.4 238 4.9 215 5.0
50–54 102 4.5 89 3.4 117 3.8 100 3.3 129 3.2 177 3.5 84 2.3 107 2.4 125 2.6 97 2.2
55–59 40 1.8 51 1.9 42 1.4 39 1.3 54 1.3 77 1.5 44 1.2 38 0.9 47 1.0 38 0.9
60–64 14 0.6 26 1.0 9 0.3 12 0.4 17 0.4 16 0.3 14 0.4 8 0.2 8 0.2 13 0.3
65+ 9 0.4 5 0.2 10 0.3 2 0.1 1 0.0 5 0.1 1 0.0 2 0.0 2 0.0 5 0.1
Not stated 1 0.0 0 0.0 0 0.0 0 0.0 0 0.0 0 0.0 0 0.0 0 0.0 0 0.0 0 0.0
Total 2,259 100 2,619 100 3,094 100 2,991 100 4,056 100 5,101 100 3,585 100 4,449 100 4,867 100 4,313 100
Table 10.4: Type of loss
2008 2009 2010 2011 2012 2013 2014 2015 2016 2017
# % # % # % # % # % # % # % # % # % # %
Revoked/not renewed 636 52.6 558 49.7 645 49.6 1,073 58.6 681 37.9 489 25.1 1,651 46.3 1,019 44.9 451 20.7 464 18.9
Resigned 573 47.4 565 50.3 655 50.4 757 41.4 1,118 62.1 1,119 57.4 1,450 40.7 1,216 53.5 1,156 53.2 1,458 59.4
Change in class 342 17.5 462 13.0 37 1.6 567 26.1 531 21.6
Total 1,209 100 1,123 100 1,300 100 1,830 100 1,799 100 1,950 100 3,563 100 2,272 100 2,174 100 2,453 100
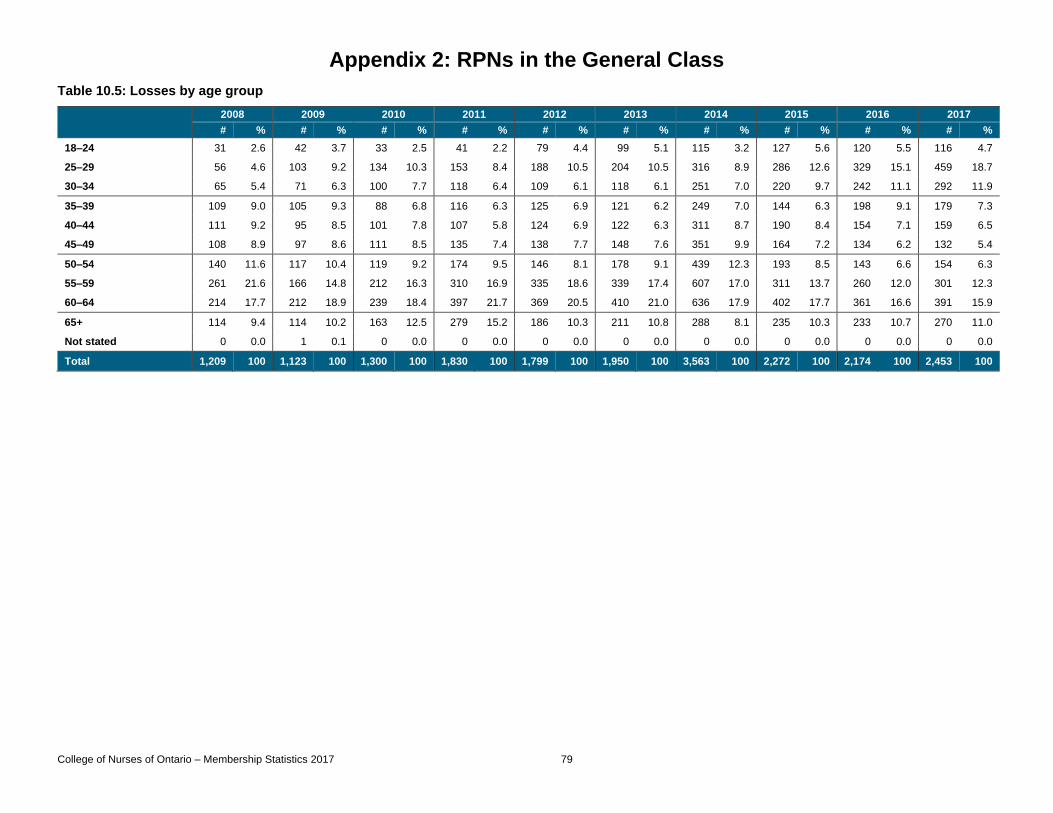
Appendix 2: RPNs in the General Class
College of Nurses of Ontario – Membership Statistics 2017 79
Table 10.5: Losses by age group
2008 2009 2010 2011 2012 2013 2014 2015 2016 2017
# % # % # % # % # % # % # % # % # % # %
18–24 31 2.6 42 3.7 33 2.5 41 2.2 79 4.4 99 5.1 115 3.2 127 5.6 120 5.5 116 4.7
25–29 56 4.6 103 9.2 134 10.3 153 8.4 188 10.5 204 10.5 316 8.9 286 12.6 329 15.1 459 18.7
30–34 65 5.4 71 6.3 100 7.7 118 6.4 109 6.1 118 6.1 251 7.0 220 9.7 242 11.1 292 11.9
35–39 109 9.0 105 9.3 88 6.8 116 6.3 125 6.9 121 6.2 249 7.0 144 6.3 198 9.1 179 7.3
40–44 111 9.2 95 8.5 101 7.8 107 5.8 124 6.9 122 6.3 311 8.7 190 8.4 154 7.1 159 6.5
45–49 108 8.9 97 8.6 111 8.5 135 7.4 138 7.7 148 7.6 351 9.9 164 7.2 134 6.2 132 5.4
50–54 140 11.6 117 10.4 119 9.2 174 9.5 146 8.1 178 9.1 439 12.3 193 8.5 143 6.6 154 6.3
55–59 261 21.6 166 14.8 212 16.3 310 16.9 335 18.6 339 17.4 607 17.0 311 13.7 260 12.0 301 12.3
60–64 214 17.7 212 18.9 239 18.4 397 21.7 369 20.5 410 21.0 636 17.9 402 17.7 361 16.6 391 15.9
65+ 114 9.4 114 10.2 163 12.5 279 15.2 186 10.3 211 10.8 288 8.1 235 10.3 233 10.7 270 11.0
Not stated 0 0.0 1 0.1 0 0.0 0 0.0 0 0.0 0 0.0 0 0.0 0 0.0 0 0.0 0 0.0
Total 1,209 100 1,123 100 1,300 100 1,830 100 1,799 100 1,950 100 3,563 100 2,272 100 2,174 100 2,453 100
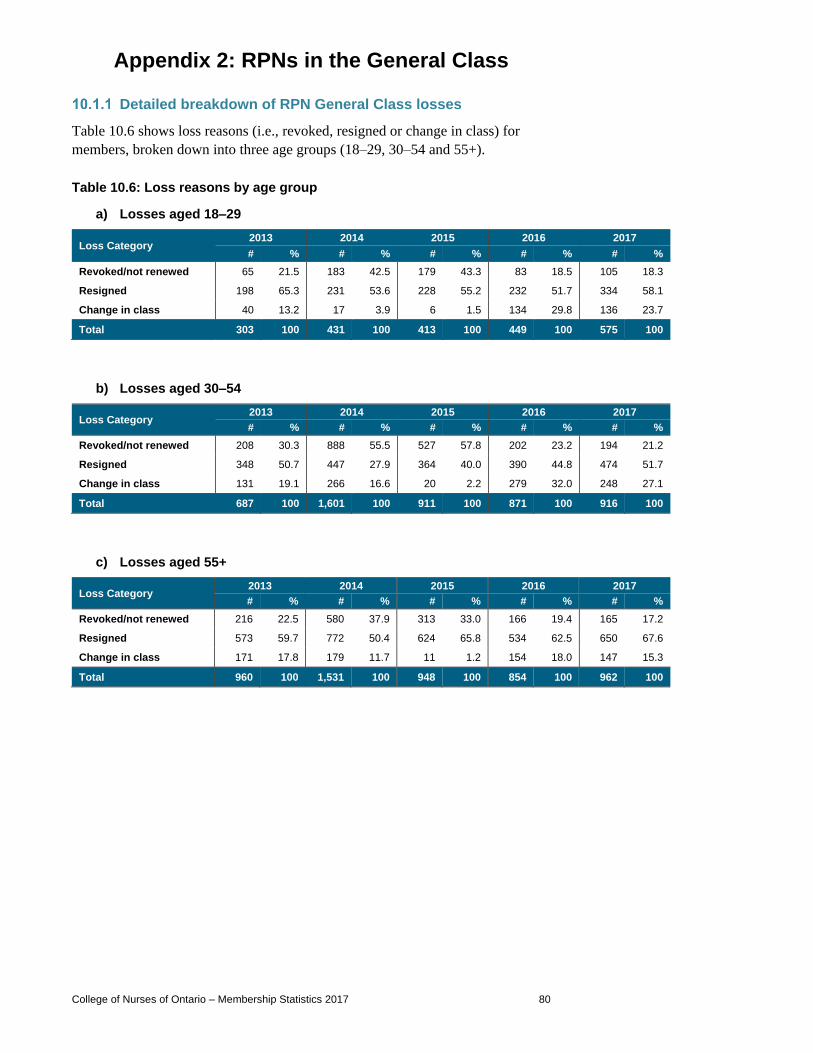
Appendix 2: RPNs in the General Class
College of Nurses of Ontario – Membership Statistics 2017 80
Detailed breakdown of RPN General Class losses
Table 10.6 shows loss reasons (i.e., revoked, resigned or change in class) for
members, broken down into three age groups (18–29, 30–54 and 55+).
Table 10.6: Loss reasons by age group
a) Losses aged 18–29
Loss Category 2013 2014 2015 2016 2017
# % # % # % # % # %
Revoked/not renewed 65 21.5 183 42.5 179 43.3 83 18.5 105 18.3
Resigned 198 65.3 231 53.6 228 55.2 232 51.7 334 58.1
Change in class 40 13.2 17 3.9 6 1.5 134 29.8 136 23.7
Total 303 100 431 100 413 100 449 100 575 100
b) Losses aged 30–54
Loss Category 2013 2014 2015 2016 2017
# % # % # % # % # %
Revoked/not renewed 208 30.3 888 55.5 527 57.8 202 23.2 194 21.2
Resigned 348 50.7 447 27.9 364 40.0 390 44.8 474 51.7
Change in class 131 19.1 266 16.6 20 2.2 279 32.0 248 27.1
Total 687 100 1,601 100 911 100 871 100 916 100
c) Losses aged 55+
Loss Category 2013 2014 2015 2016 2017
# % # % # % # % # %
Revoked/not renewed 216 22.5 580 37.9 313 33.0 166 19.4 165 17.2
Resigned 573 59.7 772 50.4 624 65.8 534 62.5 650 67.6
Change in class 171 17.8 179 11.7 11 1.2 154 18.0 147 15.3
Total 960 100 1,531 100 948 100 854 100 962 100

Appendix 2: RPNs in the General Class
College of Nurses of Ontario – Membership Statistics 2017 81
Table 10.7 shows the employment status of RPNs in the General Class in the
practice year before they became a loss.
For example, of the 2,174 RPN losses from the General Class for 2016, 60.4 per
cent reported employment in nursing during the 2015 renewal, 21.6 per cent were
not employed, 9.3 per cent were on leave and 8.6 per cent were employed in non-
nursing.
Table 10.7: Employment status of losses in the previous practice year
2013 2014 2015 2016 2017
# % # % # % # % # %
Employed in nursing or both nursing & non-nursing
1,097 56.3 1,436 40.3 1,431 63.0 1,314 60.4 1,562 63.7
In Ontario/in and outside Ontario 1,047 53.7 1,215 34.1 1,331 58.6 1,201 55.2 1,455 59.3
Outside Ontario 50 2.6 220 6.2 99 4.4 113 5.2 107 4.4
Location not stated 0 0.0 1 0.0 1 0.0 0 0.0 0 0.0
Employed in non-nursing 263 13.5 744 20.9 162 7.1 187 8.6 201 8.2
Seeking nursing employment 42 2.2 168 4.7 105 4.6 133 6.1 150 6.1
Not employed 359 18.4 980 27.5 443 19.5 470 21.6 509 20.8
Seeking nursing employment 150 7.7 414 11.6 286 12.6 333 15.3 324 13.2
On leave 231 11.8 403 11.3 236 10.4 203 9.3 181 7.4
Total 1,950 100 3,563 100 2,272 100 2,174 100 2,453 100
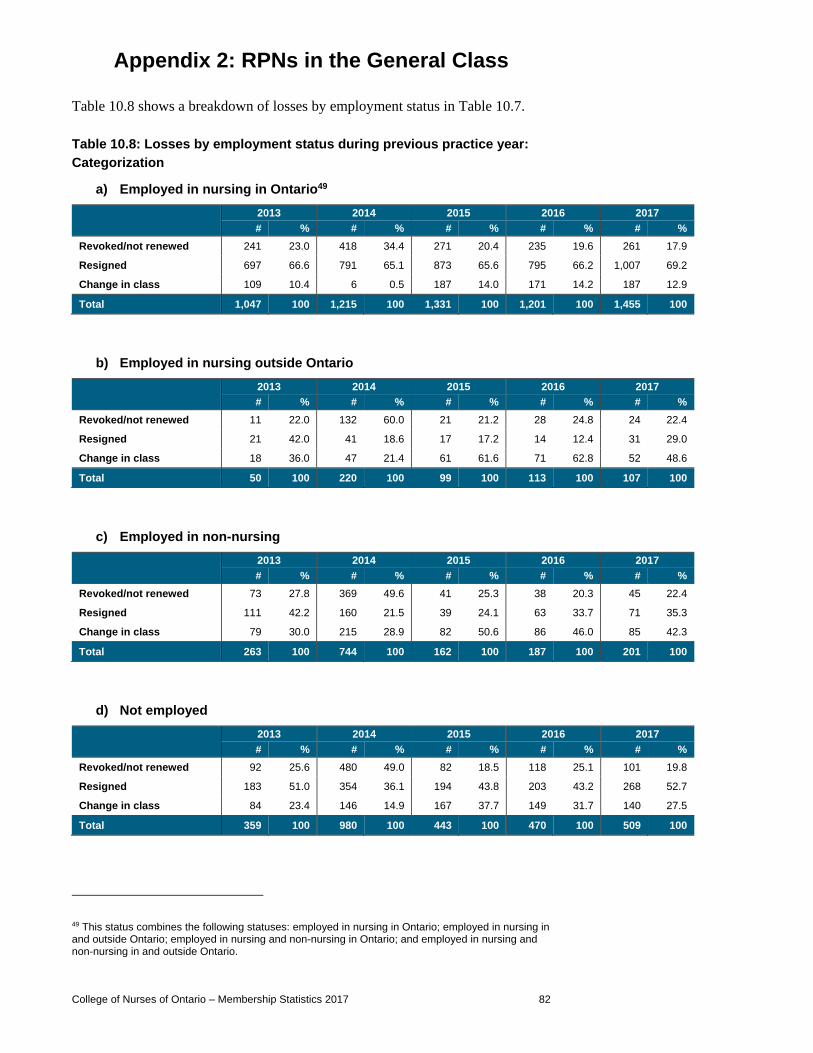
Appendix 2: RPNs in the General Class
College of Nurses of Ontario – Membership Statistics 2017 82
Table 10.8 shows a breakdown of losses by employment status in Table 10.7.
Table 10.8: Losses by employment status during previous practice year:
Categorization
a) Employed in nursing in Ontario49
2013 2014 2015 2016 2017
# % # % # % # % # %
Revoked/not renewed 241 23.0 418 34.4 271 20.4 235 19.6 261 17.9
Resigned 697 66.6 791 65.1 873 65.6 795 66.2 1,007 69.2
Change in class 109 10.4 6 0.5 187 14.0 171 14.2 187 12.9
Total 1,047 100 1,215 100 1,331 100 1,201 100 1,455 100
b) Employed in nursing outside Ontario
2013 2014 2015 2016 2017
# % # % # % # % # %
Revoked/not renewed 11 22.0 132 60.0 21 21.2 28 24.8 24 22.4
Resigned 21 42.0 41 18.6 17 17.2 14 12.4 31 29.0
Change in class 18 36.0 47 21.4 61 61.6 71 62.8 52 48.6
Total 50 100 220 100 99 100 113 100 107 100
c) Employed in non-nursing
2013 2014 2015 2016 2017
# % # % # % # % # %
Revoked/not renewed 73 27.8 369 49.6 41 25.3 38 20.3 45 22.4
Resigned 111 42.2 160 21.5 39 24.1 63 33.7 71 35.3
Change in class 79 30.0 215 28.9 82 50.6 86 46.0 85 42.3
Total 263 100 744 100 162 100 187 100 201 100
d) Not employed
2013 2014 2015 2016 2017
# % # % # % # % # %
Revoked/not renewed 92 25.6 480 49.0 82 18.5 118 25.1 101 19.8
Resigned 183 51.0 354 36.1 194 43.8 203 43.2 268 52.7
Change in class 84 23.4 146 14.9 167 37.7 149 31.7 140 27.5
Total 359 100 980 100 443 100 470 100 509 100
49 This status combines the following statuses: employed in nursing in Ontario; employed in nursing in and outside Ontario; employed in nursing and non-nursing in Ontario; and employed in nursing and non-nursing in and outside Ontario.
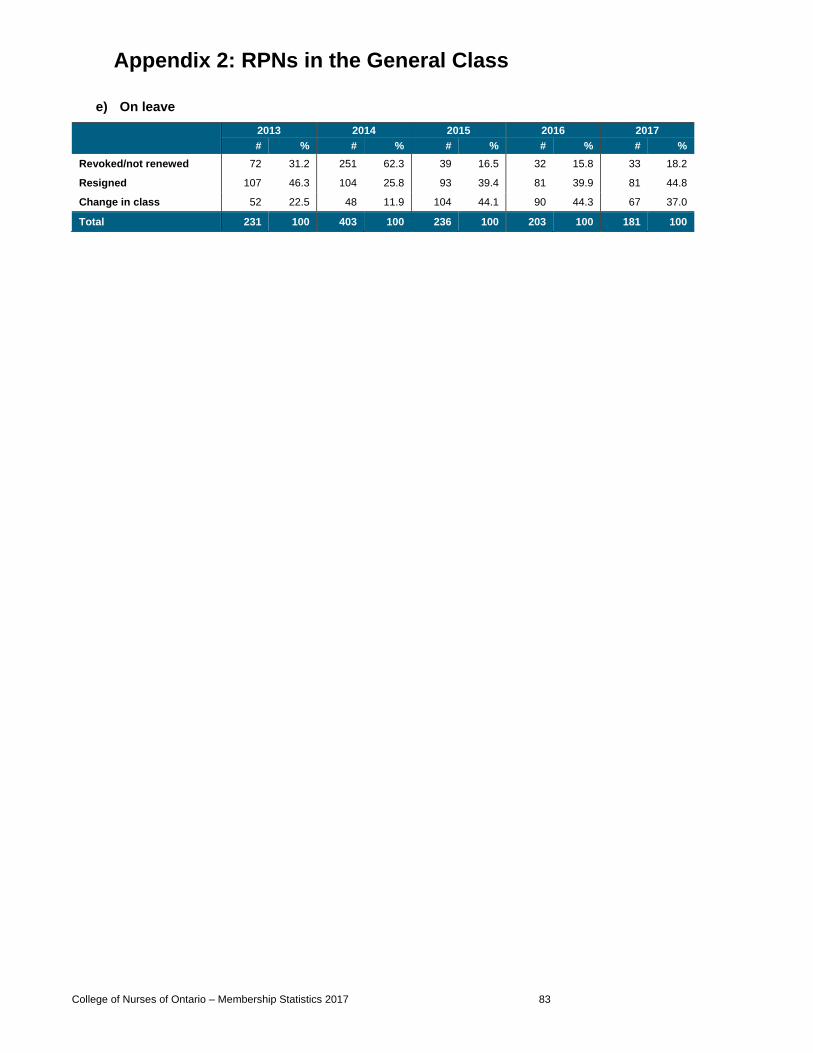
Appendix 2: RPNs in the General Class
College of Nurses of Ontario – Membership Statistics 2017 83
e) On leave
2013 2014 2015 2016 2017
# % # % # % # % # %
Revoked/not renewed 72 31.2 251 62.3 39 16.5 32 15.8 33 18.2
Resigned 107 46.3 104 25.8 93 39.4 81 39.9 81 44.8
Change in class 52 22.5 48 11.9 104 44.1 90 44.3 67 37.0
Total 231 100 403 100 236 100 203 100 181 100
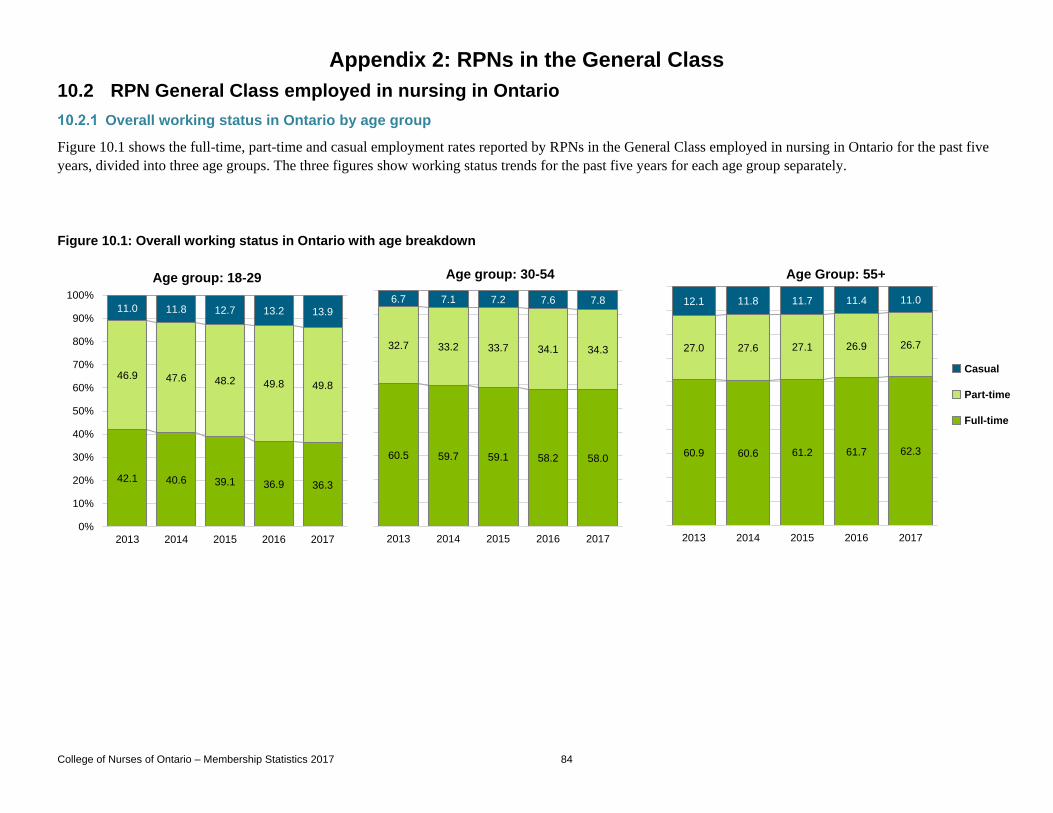
Appendix 2: RPNs in the General Class
College of Nurses of Ontario – Membership Statistics 2017 84
10.2 RPN General Class employed in nursing in Ontario
Overall working status in Ontario by age group
Figure 10.1 shows the full-time, part-time and casual employment rates reported by RPNs in the General Class employed in nursing in Ontario for the past five
years, divided into three age groups. The three figures show working status trends for the past five years for each age group separately.
Figure 10.1: Overall working status in Ontario with age breakdown
42.1 40.6 39.1 36.9 36.3
46.9 47.6 48.2 49.8 49.8
11.0 11.8 12.7 13.2 13.9
0%
10%
20%
30%
40%
50%
60%
70%
80%
90%
100%
2013 2014 2015 2016 2017
Age group: 18-29
60.5 59.7 59.1 58.2 58.0
32.7 33.2 33.7 34.1 34.3
6.7 7.1 7.2 7.6 7.8
2013 2014 2015 2016 2017
Age group: 30-54
60.9 60.6 61.2 61.7 62.3
27.0 27.6 27.1 26.9 26.7
12.1 11.8 11.7 11.4 11.0
2013 2014 2015 2016 2017
Age Group: 55+
Casual
Part-time
Full-time
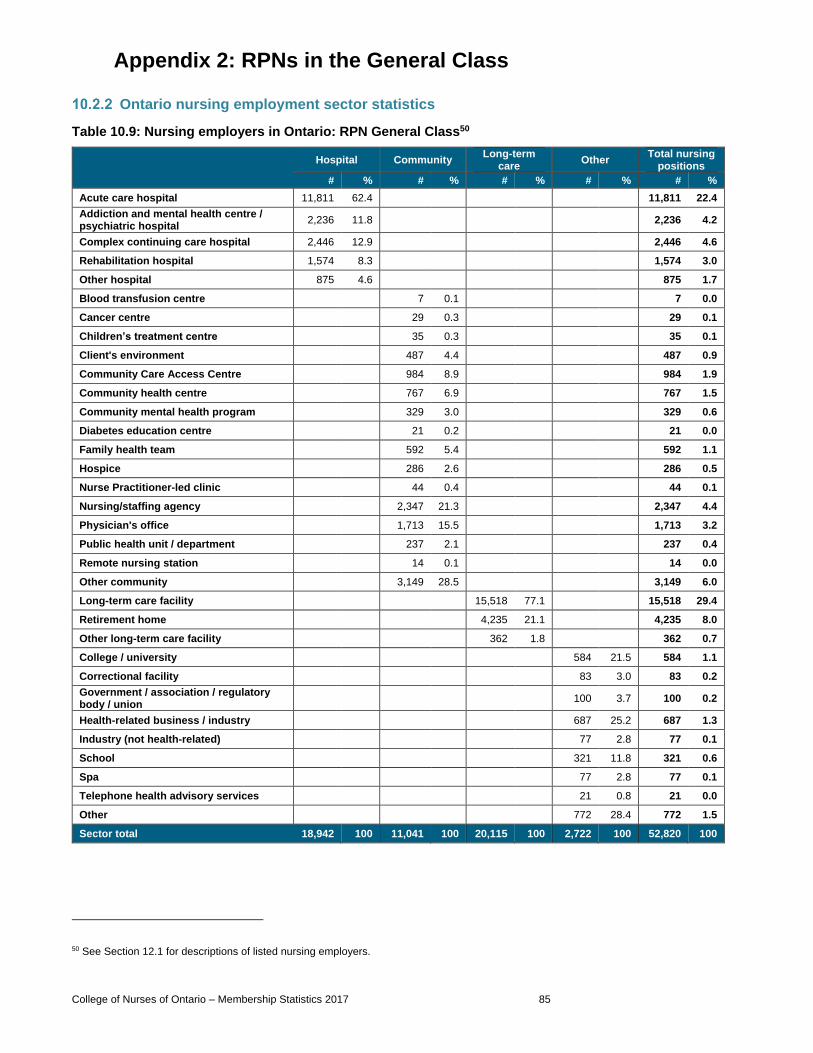
Appendix 2: RPNs in the General Class
College of Nurses of Ontario – Membership Statistics 2017 85
Ontario nursing employment sector statistics
Table 10.9: Nursing employers in Ontario: RPN General Class50
Hospital Community
Long-term care
Other Total nursing
positions
# % # % # % # % # %
Acute care hospital 11,811 62.4 11,811 22.4
Addiction and mental health centre / psychiatric hospital
2,236 11.8 2,236 4.2
Complex continuing care hospital 2,446 12.9 2,446 4.6
Rehabilitation hospital 1,574 8.3 1,574 3.0
Other hospital 875 4.6 875 1.7
Blood transfusion centre 7 0.1 7 0.0
Cancer centre 29 0.3 29 0.1
Children’s treatment centre 35 0.3 35 0.1
Client's environment 487 4.4 487 0.9
Community Care Access Centre 984 8.9 984 1.9
Community health centre 767 6.9 767 1.5
Community mental health program 329 3.0 329 0.6
Diabetes education centre 21 0.2 21 0.0
Family health team 592 5.4 592 1.1
Hospice 286 2.6 286 0.5
Nurse Practitioner-led clinic 44 0.4 44 0.1
Nursing/staffing agency 2,347 21.3 2,347 4.4
Physician's office 1,713 15.5 1,713 3.2
Public health unit / department 237 2.1 237 0.4
Remote nursing station 14 0.1 14 0.0
Other community 3,149 28.5 3,149 6.0
Long-term care facility 15,518 77.1 15,518 29.4
Retirement home 4,235 21.1 4,235 8.0
Other long-term care facility 362 1.8 362 0.7
College / university 584 21.5 584 1.1
Correctional facility 83 3.0 83 0.2
Government / association / regulatory body / union
100 3.7 100 0.2
Health-related business / industry 687 25.2 687 1.3
Industry (not health-related) 77 2.8 77 0.1
School 321 11.8 321 0.6
Spa 77 2.8 77 0.1
Telephone health advisory services 21 0.8 21 0.0
Other 772 28.4 772 1.5
Sector total 18,942 100 11,041 100 20,115 100 2,722 100 52,820 100
50 See Section 12.1 for descriptions of listed nursing employers.

Appendix 2: RPNs in the General Class
College of Nurses of Ontario – Membership Statistics 2017 86
Table 10.10: Nursing positions in Ontario: RPN General Class51
Hospital Community Long-term care Other
Total nursing positions
# % # % # % # % # %
Case manager 39 0.2 251 2.3 14 0.1 110 4.0 414 0.8
Clinical educator 19 0.1 33 0.3 39 0.2 295 10.8 386 0.7
Consultant 3 0.0 23 0.2 14 0.1 49 1.8 89 0.2
Educator / faculty 6 0.0 26 0.2 25 0.1 358 13.2 415 0.8
Infection control nurse 14 0.1 3 0.0 14 0.1 2 0.1 33 0.1
Informatics analyst 26 0.1 1 0.0 41 0.2 7 0.3 75 0.1
Middle manager 16 0.1 202 1.8 306 1.5 33 1.2 557 1.1
Occupational health nurse
35 0.2 21 0.2 22 0.1 82 3.0 160 0.3
Office nurse 87 0.5 1,334 12.1 127 0.6 147 5.4 1,695 3.2
Outpost nurse 8 0.0 8 0.1 8 0.0 2 0.1 26 0.0
Policy analyst 0 0.0 0 0.0 0 0.0 1 0.0 1 0.0
Public health nurse 9 0.0 136 1.2 19 0.1 9 0.3 173 0.3
Researcher 10 0.1 11 0.1 0 0.0 13 0.5 34 0.1
Sales / marketing representative
0 0.0 1 0.0 3 0.0 16 0.6 20 0.0
Senior manager 4 0.0 57 0.5 195 1.0 25 0.9 281 0.5
Staff nurse 17,768 93.8 3,431 31.1 16,879 83.9 705 25.9 38,783 73.4
Visiting nurse 63 0.3 3,646 33.0 187 0.9 170 6.2 4,066 7.7
Volunteer 15 0.1 35 0.3 15 0.1 30 1.1 95 0.2
Other position 820 4.3 1,822 16.5 2,207 11.0 668 24.5 5,517 10.4
Sector total 18,942 100 11,041 100 20,115 100 2,722 100 52,820 100
51 See Section 12.2 for descriptions of listed nursing positions.

Appendix 2: RPNs in the General Class
College of Nurses of Ontario – Membership Statistics 2017 87
Table 10.11: Areas of practice in Ontario: RPN General Class52
Hospital Community Long-term care Other
Total nursing positions
# % # % # % # % # %
Acute care 2,650 14.0 651 5.9 156 0.8 75 2.8 3,532 6.7
Administration 36 0.2 213 1.9 182 0.9 87 3.2 518 1.0
Cancer care 137 0.7 34 0.3 1 0.0 7 0.3 179 0.3
Cardiac care 199 1.1 19 0.2 1 0.0 7 0.3 226 0.4
Case management 11 0.1 283 2.6 17 0.1 98 3.6 409 0.8
Chronic disease prevention / management
38 0.2 293 2.7 69 0.3 47 1.7 447 0.8
Complex continuing care 2,265 12.0 697 6.3 639 3.2 72 2.6 3,673 7.0
Critical care 27 0.1 11 0.1 5 0.0 0 0.0 43 0.1
Diabetes care 4 0.0 79 0.7 3 0.0 20 0.7 106 0.2
Education 20 0.1 94 0.9 39 0.2 485 17.8 638 1.2
Emergency 603 3.2 26 0.2 1 0.0 17 0.6 647 1.2
Foot care 19 0.1 563 5.1 163 0.8 140 5.1 885 1.7
Geriatrics 670 3.5 895 8.1 16,288 81.0 190 7.0 18,043 34.2
Infection prevention / control 12 0.1 40 0.4 24 0.1 10 0.4 86 0.2
Informatics 24 0.1 11 0.1 61 0.3 19 0.7 115 0.2
Maternal / newborn 644 3.4 80 0.7 0 0.0 11 0.4 735 1.4
Medicine 2,421 12.8 370 3.4 425 2.1 67 2.5 3,283 6.2
Mental health / psychiatric / addiction
2,809 14.8 484 4.4 116 0.6 112 4.1 3,521 6.7
Nephrology 370 2.0 16 0.1 0 0.0 0 0.0 386 0.7
Occupational health 23 0.1 25 0.2 4 0.0 101 3.7 153 0.3
Palliative care 414 2.2 780 7.1 250 1.2 28 1.0 1,472 2.8
Perioperative care 706 3.7 81 0.7 2 0.0 37 1.4 826 1.6
Policy 1 0.0 1 0.0 0 0.0 10 0.4 12 0.0
Primary care 276 1.5 2,335 21.1 1,012 5.0 167 6.1 3,790 7.2
Public health 5 0.0 522 4.7 11 0.1 48 1.8 586 1.1
Rehabilitation 1,879 9.9 88 0.8 80 0.4 36 1.3 2,083 3.9
Sales 0 0.0 4 0.0 2 0.0 36 1.3 42 0.1
Surgery 1,702 9.0 110 1.0 1 0.0 85 3.1 1,898 3.6
Telehealth services 18 0.1 39 0.4 1 0.0 24 0.9 82 0.2
Other responsibility 959 5.1 2,197 19.9 562 2.8 686 25.2 4,404 8.3
Sector total 18,942 100 11,041 100 20,115 100 2,722 100 52,820 100
52 See Section 12.3 for descriptions of listed areas of practice.
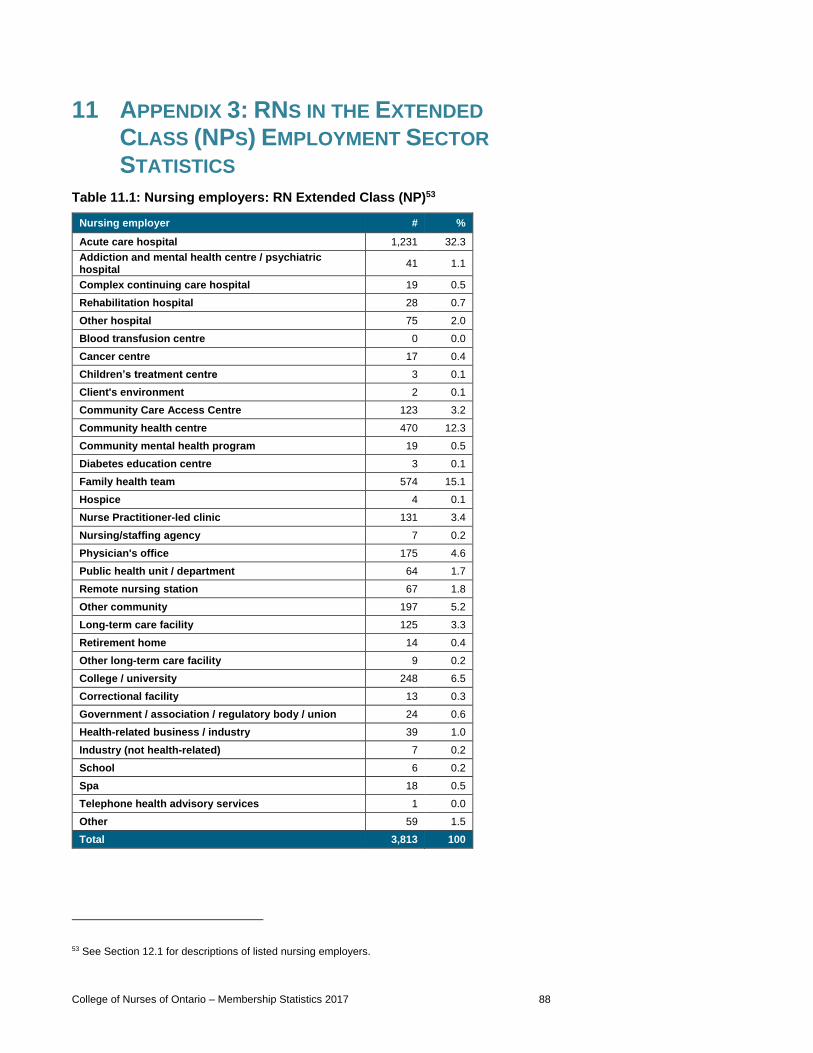
College of Nurses of Ontario – Membership Statistics 2017 88
11 APPENDIX 3: RNS IN THE EXTENDED
CLASS (NPS) EMPLOYMENT SECTOR
STATISTICS
Table 11.1: Nursing employers: RN Extended Class (NP)53
Nursing employer # %
Acute care hospital 1,231 32.3
Addiction and mental health centre / psychiatric hospital
41 1.1
Complex continuing care hospital 19 0.5
Rehabilitation hospital 28 0.7
Other hospital 75 2.0
Blood transfusion centre 0 0.0
Cancer centre 17 0.4
Children’s treatment centre 3 0.1
Client's environment 2 0.1
Community Care Access Centre 123 3.2
Community health centre 470 12.3
Community mental health program 19 0.5
Diabetes education centre 3 0.1
Family health team 574 15.1
Hospice 4 0.1
Nurse Practitioner-led clinic 131 3.4
Nursing/staffing agency 7 0.2
Physician's office 175 4.6
Public health unit / department 64 1.7
Remote nursing station 67 1.8
Other community 197 5.2
Long-term care facility 125 3.3
Retirement home 14 0.4
Other long-term care facility 9 0.2
College / university 248 6.5
Correctional facility 13 0.3
Government / association / regulatory body / union 24 0.6
Health-related business / industry 39 1.0
Industry (not health-related) 7 0.2
School 6 0.2
Spa 18 0.5
Telephone health advisory services 1 0.0
Other 59 1.5
Total 3,813 100
53 See Section 12.1 for descriptions of listed nursing employers.

Appendix 3: RNs in the Extended Class (NPs) Employment Sector Statistics
College of Nurses of Ontario – Membership Statistics 2017 89
Table 11.2: Positions in nursing: RN Extended Class (NP)54
Position in nursing # %
Advanced practice nurse – clinical nurse specialist
16 0.4
Advanced practice nurse - other 17 0.4
Case manager 7 0.2
Clinical educator 53 1.4
Consultant 27 0.7
Educator / faculty 187 4.9
Informatics analyst 0 0.0
Middle manager 28 0.7
Nurse Practitioner (NP) 2,973 78.0
Occupational health nurse 3 0.1
Office nurse 4 0.1
Outpost nurse 21 0.6
Policy analyst 0 0.0
Public health nurse 15 0.4
Researcher 10 0.3
Sales / marketing representative 1 0.0
Senior manager 19 0.5
Staff nurse 335 8.8
Visiting nurse 14 0.4
Volunteer 1 0.0
Other position 82 2.2
Total 3,813 100
54 See Section 12.2 for descriptions of listed nursing positions.
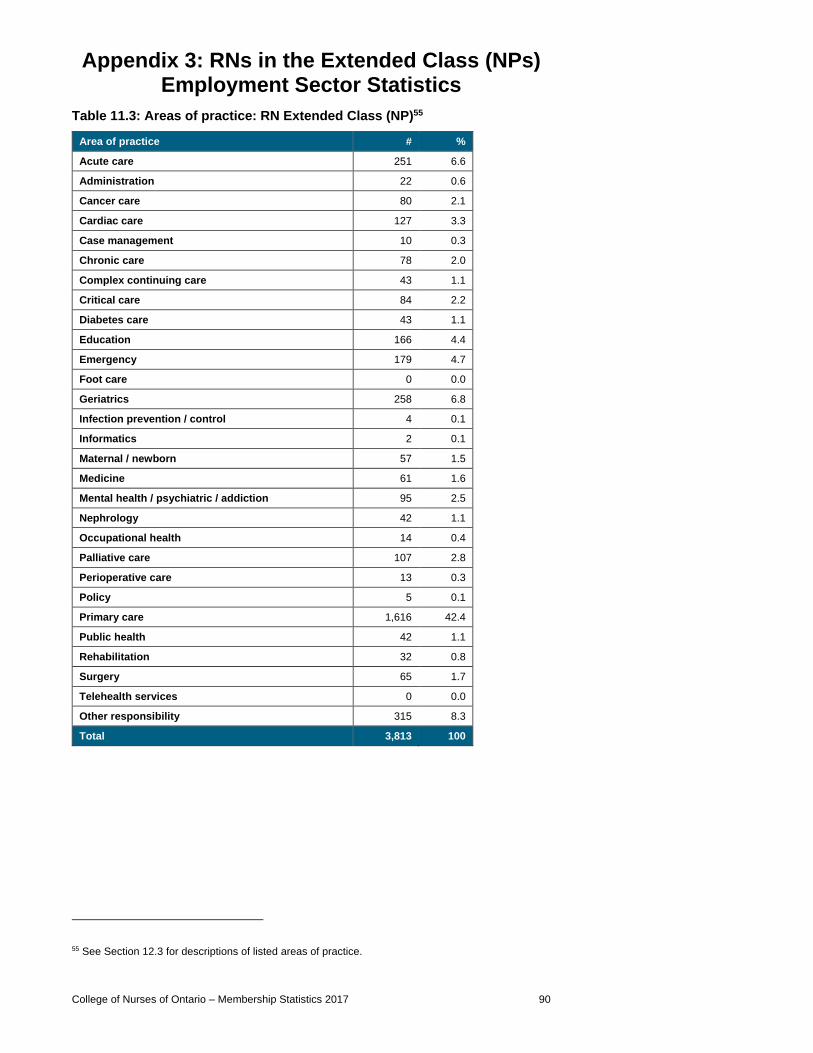
Appendix 3: RNs in the Extended Class (NPs) Employment Sector Statistics
College of Nurses of Ontario – Membership Statistics 2017 90
Table 11.3: Areas of practice: RN Extended Class (NP)55
Area of practice # %
Acute care 251 6.6
Administration 22 0.6
Cancer care 80 2.1
Cardiac care 127 3.3
Case management 10 0.3
Chronic care 78 2.0
Complex continuing care 43 1.1
Critical care 84 2.2
Diabetes care 43 1.1
Education 166 4.4
Emergency 179 4.7
Foot care 0 0.0
Geriatrics 258 6.8
Infection prevention / control 4 0.1
Informatics 2 0.1
Maternal / newborn 57 1.5
Medicine 61 1.6
Mental health / psychiatric / addiction 95 2.5
Nephrology 42 1.1
Occupational health 14 0.4
Palliative care 107 2.8
Perioperative care 13 0.3
Policy 5 0.1
Primary care 1,616 42.4
Public health 42 1.1
Rehabilitation 32 0.8
Surgery 65 1.7
Telehealth services 0 0.0
Other responsibility 315 8.3
Total 3,813 100
55 See Section 12.3 for descriptions of listed areas of practice.
College of Nurses of Ontario – Membership Statistics 2017 91
12 APPENDIX 4: PRACTICE AND EMPLOYMENT
DEFINITIONS
12.1 Nursing employer
Hospitals
Acute care hospital
A category of health care facility that is staffed and equipped to deliver care to
clients in an acute phase of illness. Acute care hospitals have medical, surgical,
nursing and allied health professionals available at all times to provide rapid,
intensive interventions. These hospitals commonly provide diagnostic services
utilizing high technology. An acute care hospital may also provide other non-
acute services, such as rehabilitation or chronic care.
Addiction and mental health centre/psychiatric hospital
A health care facility that specializes in treating persons with mental health
and/or addiction problems. Psychiatric hospitals that are part of a larger
organization and short-term treatment programs are included in this group.
Complex continuing care hospital
A complex continuing care hospital provides care to patients who are unstable
and require 24-hour nursing care for chronic or fluctuating serious illness.
Complex continuing care hospitals that are part of a larger organization are
included in this group.
Rehabilitation hospital
A rehabilitation hospital primarily provides the continuing assessment and
treatment of clients whose conditions are expected to improve significantly
through the provision of physical medicine and other rehabilitative services.
Rehabilitation hospitals that are part of a larger organization are included in this
group.
Other hospital
Any other hospital, excluding teaching hospitals, community hospitals, addiction
and mental health centres/psychiatric hospitals, complex continuing care
hospitals, and rehabilitation hospitals.
Community
Blood transfusion centre
Refers to a facility that collects, screens, tests, processes, stores and/or supplies
blood, blood products, or its alternatives for the purposes of transfusion (e.g.,
Canadian Blood Services).

Appendix 4: Practice and Employment Definitions
College of Nurses of Ontario – Membership Statistics 2017 92
Cancer centre
A facility that specializes in services related to the treatment, prevention and
research of cancer.
Children’s treatment centre
A centre that is a community-based organization serving children with physical
disabilities and multiple special needs. The centre provides physiotherapy,
occupational therapy and speech therapy along with other additional services.
There are 19 children’s treatment centres in Ontario.
Client’s environment
The nurse travels to one or more sites that may be the client’s home, school
and/or workplace environment to provide services.
Community Care Access Centre
An organization providing simplified service access to visiting professional- and
personal-support health services at home and in schools; long-term care
placement; service planning and case management and information; and referrals
to other long-term care services, including volunteer-based community services.
Community health centre
A not-for-profit, community-governed organization that provides primary health
care, health promotion and community development services using
multidisciplinary teams of health care providers.
Community mental health program
A community program that is not hospital bed-based and serves people with
mental health or addiction problems.
Diabetes education centre
A diabetes education centre, usually staffed by nurses and dietitians, provides
education and support to people with diabetes, their families, friends and
community agencies.
Family health team
A family health team (FHT) is a group that includes physicians and other
interdisciplinary providers, such as Nurse Practitioners, nurses, pharmacists,
mental health workers and dietitians. The FHT provides comprehensive primary
health care services. The FHT provides services on a 24/7 basis through a
combination of regular office hours, after-hours services and access to a
Registered Nurse through the Telephone Health Advisory Service. The FHT
emphasizes health promotion, disease prevention and chronic disease

Appendix 4: Practice and Employment Definitions
College of Nurses of Ontario – Membership Statistics 2017 93
management based on local population health needs. The FHT must enroll
patients.
Hospice
An organization with a mission to help people with life-threatening illnesses live
at home or in a home-like setting.
Nurse Practitioner-led clinic
This clinic is led by a Nurse Practitioner and provides primary health care in
collaboration with family physicians and other interdisciplinary health care
providers. The focus of the clinic is on comprehensive primary health care
services in areas where access to family health care is limited.
Nursing/staffing agency
An agency that provides a range of nursing services to support client care in the
community and health care facilities. Services are delivered in homes, hospitals
and other settings, such as schools and retirement homes.
Physician’s office
A group or solo practice that provides episodic or continuing, comprehensive
primary care (e.g., doctor's office, walk-in clinic, urgent care centre).
Public health unit/department
An official health agency established by a group of urban and/or rural
municipalities to develop and provide comprehensive community health care
programs.
Remote nursing station
A remote and/or rural stand-alone centre that has nurses as the on-site managers
and practitioners.
Other community
Other community sector employers not listed above.
Long-term care
Long-term care facility
A facility for people who are unable to live independently or in their own homes,
and who require 24-hour nursing service to be available to meet their
personal-care needs (e.g., nursing home, home for the aged).

Appendix 4: Practice and Employment Definitions
College of Nurses of Ontario – Membership Statistics 2017 94
Retirement home
A residential complex primarily occupied by persons who are 65 years of age or
older, for the purpose of receiving care services, whether or not receiving the
services is the primary purpose of occupancy (e.g., care home, rest home, lodge,
manor, assisted living).
Other long-term care facility
A long-term care facility not listed in the above definitions such as group home,
respite care centre, homes for special care.
Other
College/university
Post-secondary educational organization offering nursing programs.
Correctional facility
A stand-alone organization/facility that has as its primary focus the treatment and
rehabilitation of persons detained or on probation due to a criminal act.
Government/association/regulatory body/union
The federal, provincial and municipal government and their agencies, boards and
commissions; the various associations involved in supporting professions and
organizations; and the bodies charged with regulating health professions
recognized under the Regulated Health Professions Act (e.g., Armed Forces,
tribal council, LHINs).
Health-related business/industry
A business or industry whose focus of activities is not in the direct delivery of
health care services, but rather the health of workers, health-related product
development or the selling of health-related products (e.g., medical device
companies, pharmaceutical companies).
Industry (not health-related)
A commercial or industrial enterprise involved in the production, manufacturing,
processing or sales of goods and/or services.
School
Elementary and secondary schools, public or private.
Spa
A facility that focuses on providing services related to health, fitness, beauty and
relaxation.
Appendix 4: Practice and Employment Definitions
College of Nurses of Ontario – Membership Statistics 2017 95
Telephone Health Advisory Service
A program that provides free, confidential 24/7 access to health information via
telephone (e.g., Telehealth Ontario).
Other
Employers not listed in other definitions.
12.2 Position in Nursing
Advanced practice nurse–Clinical nurse specialist
An RN in the General Class who has gained additional knowledge and skills
through graduate education and experience. A clinical nurse specialist (CNS) has
expertise in a specialized area of nursing. A CNS provides direct care,
participates in research, provides leadership, educates and consults with health
care teams. A CNS may work with individuals, families, communities,
employees or organizations, and may focus on illness care or wellness care.
Advanced practice nurse–other
A Registered Nurse in the General Class with additional education at the
graduate level who has the competencies and uses authorizing mechanisms (e.g.,
directives) to diagnose, order and interpret diagnostic tests, prescribe
pharmaceuticals and perform procedures.
Case manager
A nurse in health and/or social services who provides assessment, service
planning and implementation, coordination, monitoring, reassessment, advocacy,
evaluation of outcomes and discharge planning. Service is provided for
individuals and caregivers who require health or social services (e.g., service
coordinator, placement coordinator, discharge planner).
Clinical educator
A nurse whose role is teaching a broad range of topics to clients/residents and/or
other health care professionals (e.g., nurse instructor, clinical practice leader).
Consultant
A nurse who provides professional advice or services to organizations.
Educator/faculty
A nurse whose role is teaching nursing and nursing-related topics to students of
health care disciplines.

Appendix 4: Practice and Employment Definitions
College of Nurses of Ontario – Membership Statistics 2017 96
Infection control nurse
A nurse who ensures the implementation and maintenance of evidence-based
practices through education, surveillance and the coordination of results in a
variety of practice settings.
Informatics analyst
A nurse who facilitates the integration of data, information and knowledge to
support clinical care, health services, administration, research and teaching (e.g.,
data/information analyst, utilization analyst).
Middle manager
A nurse who supervises staff, and is responsible and accountable for the
management of a designated service area(s) within an organization (e.g.,
manager, assistant manager, supervisor, program manager, program leader).
Nurse Practitioner (NP)
A Registered Nurse in the Extended Class with additional education and
experience who has the competencies and legal authority to diagnose, order and
interpret diagnostic tests, prescribe pharmaceuticals and perform procedures
within their legislated scope of practice.
Occupational health nurse
A nurse who provides integrated occupational health and safety services to
employers and employees. An occupational health nurse works closely with
managers, supervisors and individual employees to maintain, promote and restore
employee health, safety and well-being.
Office nurse
A nurse providing nursing services to support the care delivered by a physician
or group of physicians.
Outpost nurse
A nurse who practises nursing at a nursing station in a remote community.
Policy analyst
A nurse who gathers information, analyzes data and provides policy advice to
influence an organization's decisions and strategies.
Public health nurse
A nurse involved in disease prevention programs, health promotion and
education programs for all age groups.

Appendix 4: Practice and Employment Definitions
College of Nurses of Ontario – Membership Statistics 2017 97
Researcher
A nurse who studies the concerns of nursing and the application of knowledge to
nursing practice.
Sales/marketing representative
A nurse whose major role is in the sales or marketing of health-related products
and services.
Senior manager
A nurse who is responsible for administrating, planning and evaluating an
organization, department or program (e.g., chief executive officer, president,
executive director, administrator, vice-president, chief nursing officer/executive,
director of nursing, program director).
Staff nurse
A nurse who provides direct care to clients in a hospital, long-term care and other
type of facility.
Visiting nurse
A nurse providing a range of nursing services primarily in the home but also in
other settings such as retirement homes (e.g., home visiting nurse, community
visiting nurse).
Volunteer
A nurse who donates professional nursing services to an organization and is
accountable to that organization's standards of conduct and practice.
Other
A nurse holding a position in nursing not listed above (e.g., foot care nurse,
parish nurse).
12.3 Area of Practice
Acute care
Services provided primarily to clients who have an acute medical condition or
injury that is generally of short duration.
Administration
This area is responsible for administrating, planning and evaluating an
organization, department or program.

Appendix 4: Practice and Employment Definitions
College of Nurses of Ontario – Membership Statistics 2017 98
Cancer care
Services provided primarily to clients with a variety of cancer and cancer-related
illnesses.
Cardiac care
Programs and services concerned with the prevention and management of acute
and chronic cardiovascular disease.
Case management
A collaborative service consisting of interrelated processes to support clients in
their efforts to achieve optimal health and independence in a complex health,
social and fiscal environment (e.g., assessment, discharge planning, placement
coordination).
Chronic disease prevention/management
Services are provided primarily to address chronic diseases early in the disease
cycle to prevent disease progression and reduce potential health complications.
Diseases can include diabetes, hypertension, congestive heart failure, asthma,
chronic lung disease, renal failure, liver disease and rheumatoid and
osteoarthritis.
Complex continuing care
Services for clients whose health is unstable and requires 24-hour nursing care
for a chronic or fluctuating serious illness (e.g., reactivation, mental
health/cognitive support, chronic care).
Critical care
Care of acutely ill clients, typically delivered in intensive care units and cardiac
care units.
Diabetes care
Programs and services concerned with the prevention and management of
diabetes and diabetes-related health issues.
Education
Programs and services aimed at developing the knowledge and skills of clients,
other health care professionals and/or students on a broad range of health topics.
Emergency
Services for individuals with serious, often life-threatening health problems or
situations that require immediate action.

Appendix 4: Practice and Employment Definitions
College of Nurses of Ontario – Membership Statistics 2017 99
Foot care
Services provided to prevent and manage diseases or injury of the foot.
Geriatrics
The care of the elderly and the treatment of diseases associated with aging.
Informatics
The use of information science for discipline-specific applications in the
management and processing of data, information and knowledge to generate or
support designs, decisions and discoveries (e.g., information management,
utilization management).
Infection prevention/control
Services are provided to primarily prevent and control health care-associated
infections and other epidemiologically significant organisms. This includes
providing services to reduce the risk, spread and incidence of infections in
populations. This includes pandemic planning.
Maternal/newborn
Programs and services geared to meeting the health needs of expectant/new
parents and newborns.
Medicine
Programs and services concerned with non-surgical techniques to prevent, cure
or alleviate disease or injury.
Mental health/psychiatric/addiction
Programs and services that meet the needs of individuals with mental
health/psychiatric illness and/or addictions.
Nephrology
Programs and services concerned with kidney function and kidney disease
processes.
Occupational health
The development and provision of wellness programs; the implementation of safe
workplace strategies; the liaising with employees and insurance companies on
illnesses, injuries and back-to-work strategies.
Palliative care
Programs and services concerned with the study and management of clients with
an active, progressive, far-advanced disease for whom the prognosis is limited
and the focus of care is quality of life.

Appendix 4: Practice and Employment Definitions
College of Nurses of Ontario – Membership Statistics 2017 100
Perioperative care
Services related to the operating room for clients needing surgical care. The
services cover the preoperative, intra-operative and immediate post-operative
periods.
Policy
The gathering of information, analysis of data and provision of policy advice to
support an organization’s decisions and strategies.
Primary care
Programs and services provided from the first contact with a client, including
assessment, and preventative, sustaining or curative nursing care.
Public health
Programs and services concerned with disease prevention, health promotion and
education for all age groups (e.g., community health).
Rehabilitation
The provision of time-limited, goal-oriented therapeutic services for all ages
geared toward the optimization of health.
Sales
Focus of activities is in the sales and/or service of health-related apparatus or
equipment.
Surgery
Programs and services concerned with surgical techniques to cure or alleviate
disease or injury.
Telehealth services
Programs and services concerned with the provision of free, confidential 24/7
access to health information via telephone.
Other
An area of practice not represented by any of the above terms.

101 Davenport Road Toronto, Ontario Canada M5R 3P1 www.cno.org
Telephone 416 928-0900 Toll Free (Canada) 1 800 387-5526 Facsimile 416 928-6507E-mail [email protected]


![1 Developed by the Canadian Nurses Association and the Registered Nurses Association of Ontario Adapted for use by [name of PEACE site]](https://img.dokumen.tips/doc/110x75/5516abfd550346f0208b5068/1-developed-by-the-canadian-nurses-association-and-the-registered-nurses-association-of-ontario-adapted-for-use-by-name-of-peace-site.jpg)


![1 Developed by the Canadian Nurses Association and the Registered Nurses’ Association of Ontario Adapted for use by [name of PEACE site]](https://img.dokumen.tips/doc/110x75/56649c735503460f94926050/1-developed-by-the-canadian-nurses-association-and-the-registered-nurses.jpg)