Embed Size (px)
Citation preview
College of Engineering
Department of Electrical Engineering
Spring 2019-2020
Senior Design Project Report
Smart meter
In partial fulfillment of the requirements for the Degree of Bachelor of Science in Electrical Engineering
Team Members
Student Name Student ID 1 Feras AlKhowaiter 201202578
2 Majed Aldohailan 201500975
3 Abdullah Aldagani 201502518
4 Abdullah Alqarni 201302190
Project Advisors:
Advisor Name: Dr. Chedley Yahya

Abstract
This report will show the procedures that we carried out to implement a “Smart
Power Meter” as our senior design project. Our system design can compute the power
and energy consumed from different loads, and can shut down loads based on the concept
of dynamic pricing and price limit. Also, the system will provide easy coordination
between the electrical company and the consumer. This will be achieved by creating a
user-friendly interface that can be accessed wirelessly through Wi-Fi.

Table of Contents
Abstract
1. Introduction
1.1 Project Definition
1.2 Project Objectives
1.3 Project Specifications
1.4 Product Architecture and Components
1.5 Applications
2. Literature Review
2.1 Project background
2.2 Previous Work
2.3 Comparative Study
3. System Design
3.1 Design Constraints
3.2 Design Methodology
3.3 Product Subsystems and Components
3.3.1 Subsystem1
3.3.2 Subsystem2
3.3.3 Subsystem 3 3.3.4 Subsystem 4 3.4 Components 3.5 Implementation 3.6 Future Work 4. Prototype
5. Challenges and Decisions 6. Budget 7. Appendix 7.1Appendix A code used 7.2Appendix B progress report of design course 7.3Appendix C progress report of Assessment course 8. Conclusion 9. References

List of Figures
Figure 1: Product Architecture and Components.
Figure 2: Smart sensory energy metering block diagram.
Figure 3: IOT based smart energy meter for efficient energy utilization in smart grid
block diagram.
Figure 4: design and implementation of the smart meter in vehicle to grid block diagram.
Figure 5: smart metering and functionalities of smart meters in smart grid- a review block
diagram.
Figure 6: Implementation of Smart Meter working as IEEE1888-6LoWPAN Gateway for
the Building Energy Management Systems block diagram.
Figure 7: Implementation of Smart Meter block diagram.
Figure8: Current Transformer Split Core
Figure 9: Voltage Measurement Circuit
Figure 10: current reading diagram
Figure 11: Interface of Power Meter
Figure 12: power factor module
Figure 13: ZMPT1014 module diagram
Figure14: SPDT Relay
Figure 15: Price and Bill in LCD
Figure 16: Power and Energy in LCD
Figure 17: Final Prototype of the Smart Meter
List of Tables
Table1: Comparative Study
Table 2: List of Constraints
Table 3: List of Components

1. Introduction
1.1 Project Definition
In this project, we will implement a smart meter that will compute the power
consumption and communicate with the control office over the internet. Also, it will have
the capability to disable some of the loads based on the current electricity price and
demand.
1.2 Project Objectives
ꞏ To compute the consumed energy from the house.
ꞏ To calculate the accumulated cost of the consumed energy.
ꞏ To update the customer with the current cost.
ꞏ To provide the electricity bill to the customer and to the company.
ꞏ To disable the least necessary loads in the house to reduce the consumed power.
1.3 Project Specifications
ꞏ Provide a two-way communication between the company and the user using the internet.
ꞏ Deal with the dynamic pricing.
ꞏ Ability to disconnect loads during peak times.
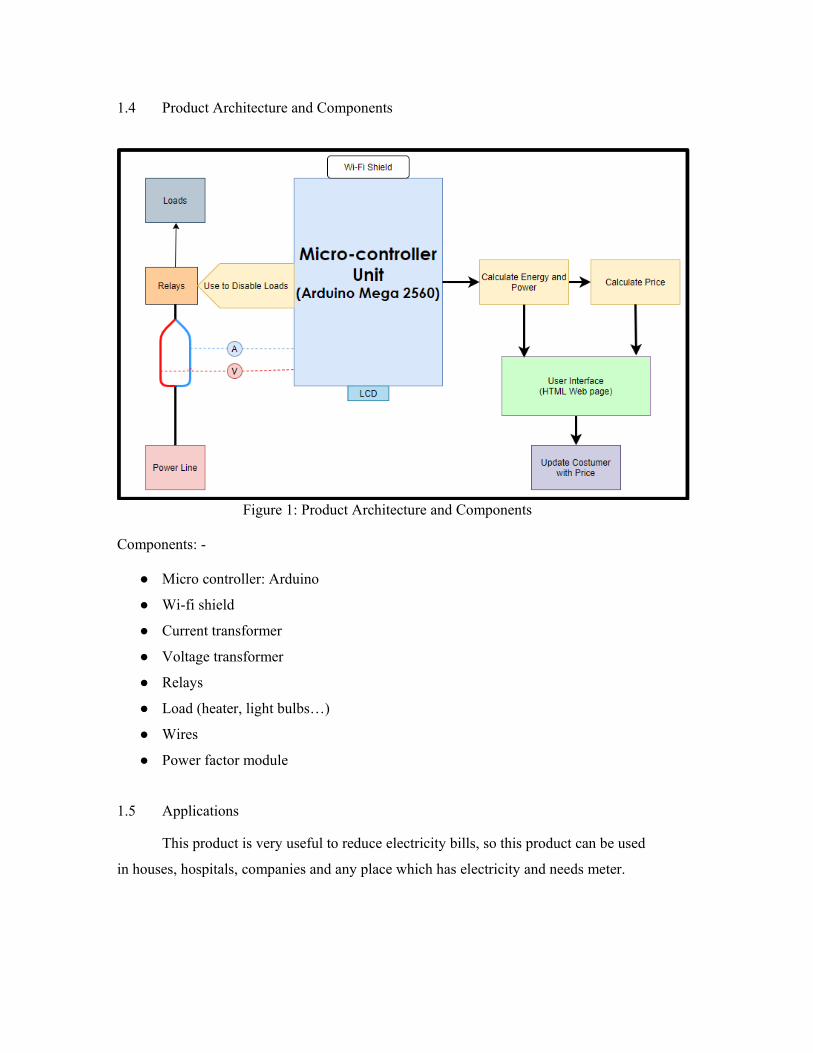
1.4 Product Architecture and Components
Figure 1: Product Architecture and Components
Components: -
Micro controller: Arduino
Wi-fi shield
Current transformer
Voltage transformer
Relays
Load (heater, light bulbs…)
Wires
Power factor module
1.5 Applications
This product is very useful to reduce electricity bills, so this product can be used
in houses, hospitals, companies and any place which has electricity and needs meter.

2. Literature Review
2.1 Project background
Nowadays, the demand for electricity is rapidly increasing around the world, and
most specifically in Saudi Arabia. In fact, a study that was conducted three years ago, and
published by the Saudi Press Agency (SPA), recorded an unprecedented energy
consumption in the Kingdom. On August 31st, 2014, the electricity usage during the peak
time reached 56.500 MW, that’s an increase by 7.7% of the recorded values of the
summer of 2013.
Moreover, studies showed that Saudi Arabia is one of the highest countries in the
world in regard to electricity demand, where the per capita usage is equal to more than
double the international average, with an annual increase of 5.5%. In addition, a recent
study that was carried out back in October of 2016 estimated the per capita usage/month
in Saudi Arabia in the entire year of 2015 to be 779 kWh.
On the other hand, although this high demand might be due to the economic
growth, industrial transformation, urbanism, as well as the constant growth of population,
a big part of this extremely high usage can be related to the wastage, and the inefficiency
of electricity consumption especially in houses. As a matter of fact, this forced the
Electricity Company to expand its power plants, which cost hundreds of billions of Saudi
Riyals.
2.2 Previous Work
Title 1: Smart sensory energy metering Introduction:
SSEM (Smart Sensory Energy Metering) is an electronic device that
records consumption of electric energy and allows customers to program how
and when their home uses energy.

Block diagram:
Functionality:
In this project they use A/C current sensor, AC current adapter, Sensor
Controller (Arduino mega), Ethernet shield, Voltage and Current sensor and
server as showing in figures 1 As its show in the diagram where each hardware
will be. And with the electrical panel which contain several circuits switch each
switch control of some part of the home that use electric current, they connected
each switch with the sensor and will allow as to read the current that move in that
wire that come out from the switch to a room, the AC current sensor will be
install inside the electric panel and connect the sensor with wire. The sensor will
be connected to the adapter shield by wire, each AC current sensor has it won
channel that provided by AC current sensor adapter. The Ac current sensor
adapter shield will be connected to the sensor controller by small pins “male pins
“come from the adapter shield connect to the female pins on the sensor controller
node. The sensor controller node will be programmed to convert the analog value
that came from sensor to digital, the sensor controller will be connect to the
Ethernet shield by long wire or it can be connect by the small pin that are been
on adapter shield. The Ethernet shield will be connected to the sensor node, at
same time the Ethernet will be connect to the laptop or PC that are work as home
server. The home server will include to part server and client the server is web
server include the web control, receiving the data that are collect it to the
webserver database , the database c be design by MySQL and connect it to the
webserver , the databases will have many thing such as cost of the electric usage
, time of electric usage , number of room , the value of the current .The user
device “Client “it is a web page will be make it be the HTML and JQuree the
Home Server
(Data Storage) User Device
AC current sensor node 3
AC voltage and current
sensor
Ethernet shield Arduino unio
AC currentsensor adapter
AC current sensor node 2
Electrical panel
AC current sensor node 1

client will be able to choose many option from the webpage such as select the
limit of cost and time and for each room that connect to the system, there will be
an application for the user using just to showing the electric usage on live time,
and receiving the message when there is high electric usage. The hole part will
be connected to each other and work as one system.

Title 2: IOT Based Smart Energy Meter for Efficient Energy Utilization in Smart Grid
Introduction:
Smart grid plays an important role in our current society and in our networks.
Smart meters play a vital role. Smart meter provides immediate monitoring of reliable
status, automatic information collection, user interaction and energy control. It also
provides a double flow of information between consumers and suppliers, provides better
control and efficiency. It also provides real-time consumption information and provides
power control. As long as the customer's maximum load demand exceeds the maximum
value, the electricity supply to customers will be separated with the help of an intelligent
power meter. In an ideal environment with normal workload conditions, the smart meter
has a service life of 5 to 6 years. In this project, the use age of the smart meter with IOT
technology is introduced. The IOT-based power meter system consists mainly of three
main parts, which are remote control, Wi-Fi and theft detection part. When there is an
error or theft, the theft detection sensor detects the error response and the circuit
according to the information it receives. The console plays a key role in the system to
ensure that all components work well. Therefore, Internet of things can improve the
performance and efficiency of the smart grid mainly in the three phases.
Block Diagram:
Figure 3: IOT Based Smart Energy Meter for Efficient Energy Utilization in Smart Grid.
Functionality:
The proposed system is cost effective and compact. Therefore, the premium
becomes much easier. In this proposed system, the power meter is connected to the
microcontroller through an opt coupler. The OLED screen is also connected to the
system. In the controller circuit, ULN2003 is used to drive the relay to change loads. The
current sensor is also equipped to determine energy theft. Figure 3 illustrates the

11
functional block diagram of the proposed intelligent monitoring system. The main
functional unit of this system is discussed. The Wi-Fi module is used here and is
programmable with an 80 MHz microcontroller. Then, the OLED screen used here that
does not require backlight. You can illuminate the screen with high resolution. Then, the
optical coupler detects the calibrated lamp of the energy meter and sends its output to a
microcontroller. The optocoupler mainly produces infrared light and a semiconductor
image sensor is used to detect the emitted infrared radiation. The Wi-Fi module is
programmed using the Arduino IDE software to calculate the pulse of the power meter.
The optocoupler pulse sensor and sends the data obtained to the cloud by microcontroller.
The lamp blinks 3200 times in one unit. The LED flashing of the energy consumed in the
units is calculated with the unit cost. Monitoring is carried out at each interval. The
system also provides power theft with the current sensor connected to the system.
Therefore, the system does not imply providing a less human error.
.

12
Title 3: Design and Implementation of the Smart Meter in Vehicle to Grid
Introduction:
Today, EV is an important area for researchers due to its attractive properties of
reducing the use of gasoline and greenhouse gas emissions compared to conventional
compounds. In this paper, the authors described that electrical vehicles achieve this by
using a larger capacity battery pack that can be recharged using the power provided by
the power grid. If the diesel generator of the electrical vehicles is considered, there should
be a bi-directional smart meter that not only measures the charged car but also measures
the energy saved in the network. The smart meter is the interface between electric cars
and the network. It has two special functions compared to the traditional meter. The smart
meter has a bidirectional scale and a bidirectional connection compared to a conventional
meter. You can judge the direction of the energy consumption of a system by the
different phase between the current and voltage wave in the mains. You can calculate the
energy consumption or import power of the car. Basically, the smart meter is the interface
between the network and the electric car. You can achieve a change of address between
the electric vehicle and the network through GPRS. In this document, they provide a
detailed description of the hardware and software.
Block diagram:
Figure 4: Design and Implementation of the Smart Meter in Vehicle to Grid
Functionality:
The smart meter consists of a microprocessor controller (MCU) and an external
interface circuit, which includes the measurement of electrical energy, clock, keyboard,
LCD screen, system connections and data memory. The integrated circuit measures

13
various parameters of the electrical signal, such as active, reactive and visual energy,
peak values, signal duration, temperature, etc. After the measurement, the signal is
transferred to the MCU, which is primarily responsible for the process here. This circuit
designed in this document has an input for current sampling and an input for measuring
voltage. Then, Samsung IC is designed for mobile devices and general applications with
a compact solution, low consumption and high performance. Its low power and simple
and stable design are especially suitable for cost and energy sensitive applications. It is
based on a new bus architecture known as Advanced Microcomputer Engineering. Then
the communication module is the core part of the system. The system uses two main
communication methods: RS485 and GPRS connections. To solve data in large
quantities, save the function in case of power failure and other problems, the smart meter
designed with 2M*32-bit flash memory. The data and program preservation requirements
can be saved, without loss of data in case of power failure, and ensuring the speed meter
reading. It has unlimited meter reading and writing functions, and is low in power
consumption.
Title 4: Smart Metering and Functionalities of Smart Meters in Smart Grid- a Review
Introduction:
The Smart grid application may be a possible solution to meet the growing
demand for energy use and the increased use of smart meters. The intelligent
measurement application and various algorithms also have the ability to make defects in
the energy, isolation and recovery system with high precision. There are many equipment
and energy measurement solutions available to address and control energy usage
problems. The capabilities and functions of smart meters are currently used commercially
by several comprehensive utilities. One of the objectives of this article is to identify and
review the functionality and functionality of commercially implemented smart meters.
Smart meters are powerful digital displays and capabilities to record how much energy is
consumed and when this information is automatically transferred to the meter's data
management system (MDMS) for further processing and storage. To maintain
interoperability between different smart meter providers and MDMS solution providers,
data collection and storage standards and data communication standards must be
followed. The other objective of this article is to review the literature on intelligent
metadata data structures, information flow, measurement data management solutions and

14
data use. To capture the rapid development and deployment of smart meters when trying
to identify emerging opportunities, this document provides an overview of smart meters
and the functions of smart meters in the smart grid and associated systems.
Block Diagram:
Figure 5: smart metering and functionalities of smart meters in smart grid- a review block
diagram
Functionality:
Smart meters include a range of hardware, software and calibration systems.
Metrics, security and communications are essential elements of smart meters. The Figure
5 shows a block diagram of an intelligent scale showing the building blocks of an
integrated solution for intelligent measurement. An intelligent meter system may include:
accurate real-time clock (RTC), data communication module, chip measurement system
(SoC), security module, power management system, monitoring unit, tamper detection,
power adapter and voltage reference (VREF). The Smart Device Center is based on an
SOC processor, which includes the architecture to support measurements. The analog
front end of the meter consists of digital converters that support differential inputs. The
integrated gain phase provides gains for low production sensors. The hardware multiplier
(HW) can be used on the SOC chip to further accelerate the intensive operations of
mathematics while calculating energy. On the other hand, the program supports the
calculation of several parameters. RMS current and voltage, active and reactive energy,
power factor and frequency are the main parameters calculated during energy
measurements. The measured and calculated data are stored by the smart meter and
transmitted according to the different standards required by public utilities.

15
Title 5: Implementation of Smart Meter Working as IEEE1888-6LoWPAN Gateway for
the Building Energy Management Systems
Introduction:
When building the power management system, Smart Meter (SM) plays an
important role in helping users feel active and determine energy consumption. As a
result, multiple efforts have been made to improve the function of this device in order to
contribute to the reduction of energy consumption towards a green economy and
sustainable development. In addition to SM, other protocols have been developed to
achieve intelligent, convenient and safe management and control between buildings or
building blocks. With the growing growth of devices connected to the Internet, the
Internet of things, the integration of millions of devices into the Internet IPv4 is not the
best option. Therefore, IPv6 is designed to solve this problem. IPv6 allows more Internet-
based devices. IPv6 is more complex than IPv4; therefore, devices usually consume more
energy. Based on previous concerns, the low power IPv6 protocol was developed for the
wireless personal area network to reduce consumption.
Block diagram:
Figure 6: Implementation of Smart Meter Working as IEEE1888-6LoWPAN Gateway for
the Building Energy Management Systems

16
Functionality:
The form represents the system architecture, including SM, which acts as a GW
to transfer data from an FB network to storage in the control center through a Wi-Fi
connection. Communication with small sensors or actuators that use the FB is a built-in
FB Internet device that packages IEEE packages and communicates with storage and
applications via Wi-Fi. The microcontroller acts like the SM CPU and is connected to
measure the IC power using the SPI connection. The combined power processor was used
to calculate the amount of electricity from the specified AC voltage and current. The SM
Wi-Fi module is used to transmit electricity consumption and FB data to control the
center using the standard IEEE protocol. It provides wireless connectivity with complete
and independent IP, but communicates with the CPU through a simple USART port.
Therefore, a module is designed in a small form, which consumes very little energy. The
FB network has some client nodes that integrate small temperature sensors and can
transfer temperature data to the server node connected to the MCU through a USART
connection.
Title 6: Implementation of Smart Meter
Introduction:
In our actual project, we are going to implement a smart meter that will compute
the power consumption. Once it is done, then next it will communicate with the control
office over the internet. Also, it will have the capability to disable some of the loads
based on the current electricity price and demand. Basically, our project is majorly based
on a system in which we can save the unused power from the system. Like if we talk
about the metering then it will first measure the used power of the system and transfer the
whole data to the nearest office for the billing. And as this device is called smart so it has
a smart option like it can disable the load if the demand is increasing from the main
supply.
17
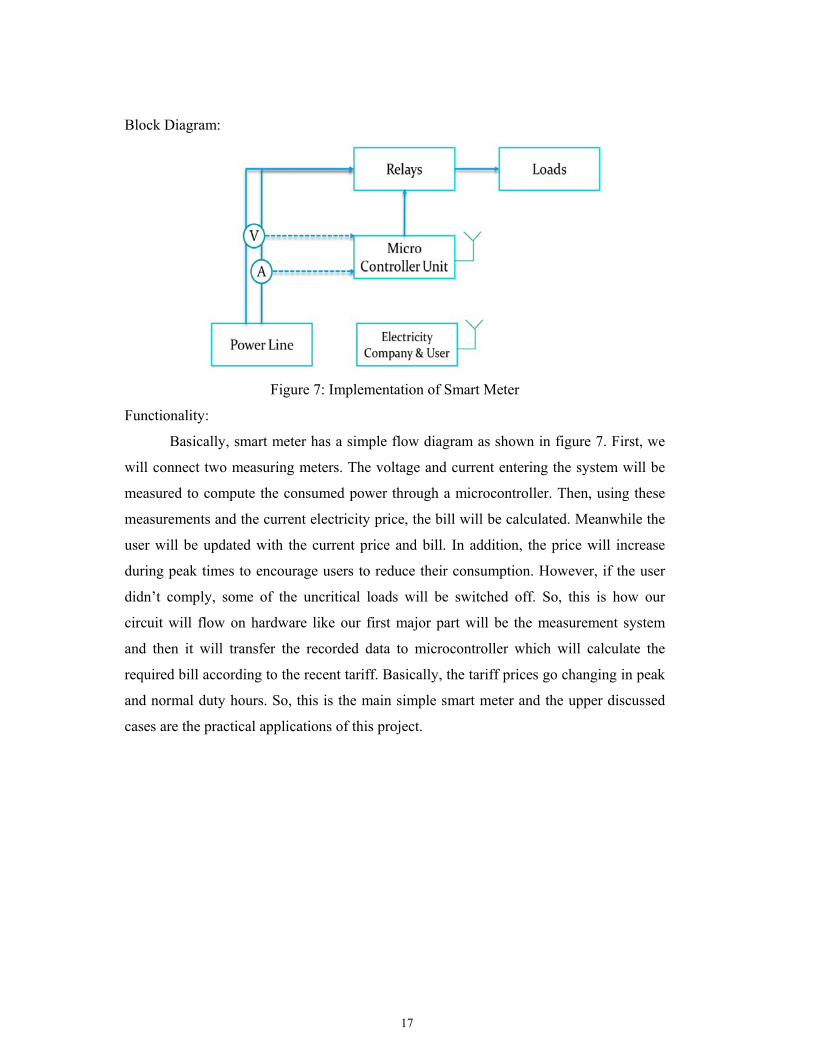
Block Diagram:
Figure 7: Implementation of Smart Meter
Functionality:
Basically, smart meter has a simple flow diagram as shown in figure 7. First, we
will connect two measuring meters. The voltage and current entering the system will be
measured to compute the consumed power through a microcontroller. Then, using these
measurements and the current electricity price, the bill will be calculated. Meanwhile the
user will be updated with the current price and bill. In addition, the price will increase
during peak times to encourage users to reduce their consumption. However, if the user
didn’t comply, some of the uncritical loads will be switched off. So, this is how our
circuit will flow on hardware like our first major part will be the measurement system
and then it will transfer the recorded data to microcontroller which will calculate the
required bill according to the recent tariff. Basically, the tariff prices go changing in peak
and normal duty hours. So, this is the main simple smart meter and the upper discussed
cases are the practical applications of this project.

18
2.3 Comparative Study
Projects 1 2 3 4 5 Our projectSmart meter Yes Yes Yes Yes Yes Yes
Communication GSM, Wi-Fi
Internet shield
Wi-Fi RS-485 GPRS
GSM Wi-Fi Wi-Fi
Billing Yes No Yes No No YesEnergy
consumption monitoring
Yes Yes Yes No Yes Yes
Table1: comparative study
We can see that from the previous projects the nearest one to our project was
smart sensory energy metering cause it’s a smart meter it also has a communication way
and its energy consumption monitoring. The other projects have a simple relationship
with our project but Almost most of them have loads, relays, voltage and current sensors
so we considered that as a similar project.
3. System Design
3.1 Design Constraints
Standards
ANSI C12.1-2014. American National Standard for electric meters-code for
electricity metering.
Table 2: list of Constraints
Economically Available budget 1500 SR.
Sustainability Product lifetime: expected 20 years.
Temperature can affect the phase shift of the transformers leading to in correct readings.
Health and Safety
The system must be closed.
Requires fire extinguisher and fuses during experimentation.
The electrical engineering labs in KFUPM are limited to 2.5A.
Socially Requires high security for communication.
Manufacturability The materials used are available in the market (except the current transformer) and can be easily constructed and programmed.

19
3.2 Design Methodology
The way we acquired voltage readings is using a voltage transformer with voltage
ratio 220V: 3V by connecting the secondary windings to a circuit before connecting it to
Arduino input. Open Energy Monitor website guided us through interfacing the
transformers outputs with the Arduino.
1.1.1.1 Components
1- Voltage transformer with voltage ratio 220V: 3V.
2- 22k Ω, (3x) 100k Ω Resistors.
3- 10 µF Capacitor.
Finally, after doing some research we agreed to use a split core current sensor
shown in Figure 8 with a ratio of 100A: 50mA. This type of current transformer was the
closest to our requirements.
Figure8: Current Transformer Split Core

20
3.3 Product Subsystems and Components
3.3.1 Subsystem 1
Voltage reading: -
Acquiring the voltage readings is the first step in building a basic power meter.
However, some of the power meters that we came across, during the research stage, did
not advice to use voltage readings, instead, they only preset a specific voltage level that
will be constant throughout the whole process of calculation. Even though this step would
be very significant in saving time and efforts in both implementation and calibration
stages, we chose not to use it in our design for some accuracy reasons. Moreover, we
came across some designs that advised the use of power adapters as voltage transformer
As we stated earlier, in order to calculate the power in the Arduino, both current and
voltage readings must be obtained previously.
Figure 9: Voltage Measurement Circuit
3.3.2 Subsystem 2
Current reading: -
Adding a bias to the current signal using a voltage source created by voltage
divider connected across the Arduino's power supply because Arduino only accept
positive values.
Also, Arduino can only deal with voltage so a small resistor was added so that when the
secondary current of the transformer pass through its voltage will be produced and
measured.

21
Figure 10: current reading diagram
During the research stage we came across multiple of methods that is used to get
the current values. One of which was using current transducer. This option was not very
optimal since it required power supply as well as its core was not of the split type that
would make the connection easier.

22
3.3.3 Subsystem 3
Initial Web Page: -
Integrating the HTML Code to the Arduino Code:
After developing our final code for the web page, we had to integrate it into the
overall Arduino code for the entire system. This was by no means a straightforward
process to perform because of the many differences between the two languages and their
constructions.
We can see in figure 11 the rates of the energy, the real power and the bill rates in
the interface that we made.
Unfortunately, the Wi-Fi module broke and we could not get a new one due to the
Covid-19 outbreak. Therefore, we had to find a new solution; and that is by keeping the
Arduino connected to a PC that is connected to a Wi-Fi and using the internet through it.
Next, we used an app called ‘Blynk’ as the interface for the user as seen in the figure 11.
Figure 11: Interface of Power Meter

23
3.3.4 subsystem (4)
Power factor:-
Figure 12: power factor module
This module is very useful for electrical projects. It has many applications such as,
measuring AC voltage, sensing overload current, testing equipment and relay protection
and measuring the power factor.
In figure 13, you can see the ZMPT1014 module diagram.
Figure 13: ZMPT1014 module diagram
Because of unknown circumstances the module has arrived but DHL returned it but there
is a way to calculate the power factor by using the equations below.

24
3.4 Components: -
Relays:
A relay is an electrical switch that operates using the principle of either
electromagnet or solid state. There are many types of relays regarding the pole and throw.
The pole is a part of the relay that controls the circuit by connecting it to the throw by the
help of the electromagnet. These types are: single pole single throw (SPST), single pole
double throw (SPDT), and double pole double throw (DPDT).
In our project, we used multiple SPDT relays as shown in Figure 14. This relay is
Normally Closed (NC).
Also, this relay used to control 4 loads.
Figure14: SPDT Relay
Results: -
At this time, we couldn’t test the relays to find the results.
LCD: -
In our project, we had to add LCD. The LCD stand for Liquid Crystal Display.
There are many types of LCDs, but the one we were concerned about is the 16x2 LCD,
which displays 2 lines each with 16 characters. We preferred this one over the other
displays such as 7-seqments and other segments LEDs. The reason is that we can easily
program it with the Arduino which allows us to display both numbers and letters in
addition to the symbols.

25
And we could show the power, energy, bill and the price in the LCD below. And it shown
in figures 15 and 16.
Figure 15: Price and Bill in LCD Figure 16: Power and Energy in LCD
3.5 Implementation
The current measurement circuit is similar to the voltage measurement circuit
where we added a DC bias because Arduino only accepts positive values. However, the
difference between the two circuits is the fact that Arduino deals with voltage
measurements only. Hence, we added a small resistor called "Burden" so that when the
secondary current of the transformer passes through it, voltage will be produced and then
measured using Arduino.
There will always be a current flowing in the primary side inducing current in the
secondary side regardless of load existence. For this reason, a burden resistor is required.
Implementation Process: -
Making sure that the Arduino can measure the voltage of the system.
Measuring current from a system.
Build a code that computes the power and energy consumed.
Applying the dynamic pricing concept and bill calculation.
Communicate wirelessly with the microcontroller and change the pricing.
Display the information on Liquid Crystalized Display (LCD) screen.
Develop the loads
Calibrate the system and compare it to other products.
3.6 Future work: -
Adding excel to website
Having SD card
Results after using relays

26
Implement industrial design
Power factor module
4.Final Prototype:
Figure 17: Final Prototype of the Smart Meter
The expected work in the future regarding the prototype is adding more than one
load. We can see in the video that we have only one load which is heater but our plan to
have more than one and put them in a designed box to make it look organized. Also,
connecting the relays to see the results after.

27
5. Challenges and Decision Making
We tried to add excel to the website, but adding excel to website didn’t work
because we need an SD card slot that is attached to the Arduino. Unfortunately, the
module we needed we will not receive it until mid-May. The other challenges that
everyone has faced regarding the situation that the world facing this time. Also, due these
difficult times we have faced a number of problems to complete and finish our senior
project. COVID-19 has played a giant role in preventing the production of our final
project. Because of COVID-19, we couldn’t meet as a group, we couldn't have our parts
that we ordered online due the lockdown of the air traffic, COVID-19 played a role in
challenging us to proceed in continuing our project any further step.
6. Budget
The budget found as expected and not expensive, so economically the project budget
is easy to be obtained.
Table 3: list of Components

28
7.Appendix
7.1 Appendix A : codes
Code: #include <SPI.h> #include <WiFi.h> #include <LiquidCrystal.h> byte skip = 254; // offset correction control unsigned long t1; unsigned long t2= micros(); unsigned long td; float cumulative_Energy=0; // In Joule float price=1000; // In SR/kWh float bill=0; // scaled down by /3600000 SR float P_real=0; // Real power In Watt float PF=0; // Power factor float price_th1=2000; // threshold of load 1 2000SR/kWh float Bill_th1=10; // threshold of load 1 10SR float price_th2=3000; // threshold of load 2 3000SR/kWh float Bill_th2=20; // threshold of load 2 20SR // Offset found when there is no load. float V_offset = 514; float I_offset = 510.61; // Current and Voltage ratios // Conversion factor = ADC(5.0/1024.0) * Transformer Ratio(132.3/4.24) * Voltage Divider(122.0/22.0) const float V_ratio = 0.84489; // Conversoin factor = ADC(5.0/1024.0) * Transformer Ratio(100.0/0.05) / Burden resistance(33.0) const float I_ratio = 0.29593 ; // Wifi information char ssid[] = "house"; // your network SSID (name) char pass[] = "12345678"; // your network password int status = WL_IDLE_STATUS; WiFiServer server(80); while (!Serial) /////////////////////////////////////////////////////////////////////// void setup() lcd.begin(16, 2); pinMode(30, OUTPUT); pinMode(31, OUTPUT); Serial.begin(9600);

29
; if (WiFi.status() == WL_NO_SHIELD) Serial.println("WiFi shield not present"); while (true); String fv = WiFi.firmwareVersion(); if (fv != "1.1.0") Serial.println("Please upgrade the firmware"); while (status != WL_CONNECTED) Serial.print("Attempting to connect to SSID: "); Serial.println(ssid); status = WiFi.begin(ssid, pass); delay(10000); server.begin(); printWifiStatus(); //////////////////////////////////////////////////////////////// void loop() skip++; if (skip%100==0) // Update the stored DC shift values update_offsets(); // Compute Power and do bill calculations compute(); // Disconnect/connect loads according to price limits control(); // Print to website printToPage(); // if(skip%25==0) if(skip%2==0) // screen(); else screen2(); ///////////////////////////////////////////////////////////////////////// void compute() // Variables initilized each cycle float V_rms = 0; float I_rms = 0; float P_apparent = 0;

30
float Energy = 0; // Variables to read analog inputs int V_start = 0; int V_sensor = 0; int I_sensor = 0; float sump = 0; int samples; t1 = t2; //T=micros(); // 29 samples -> T = ~ 8.350ms for loop which is equavalant to 120Hz cycle m 0.287 seconds for 1000 samples for(samples=0; samples<1000;samples++) V_sensor = analogRead(A0); I_sensor = analogRead(A1); Serial.print(V_sensor); Serial.print(" "); Serial.println(I_sensor); float V = (V_sensor-V_offset); float I = (I_sensor-I_offset); sump = sump +V*I; I_rms = I_rms + I*I; V_rms = V_rms + V*V; Serial.print(V_sensor); Serial.print(" "); Serial.println(I_sensor); T=micros()-T; t2= micros(); td=t2-t1; // Period time in micro seconds P_real = abs (sump/samples)* V_ratio* I_ratio; // to counter the out of phase issue we use absolute. I_rms = sqrt(I_rms/samples) * I_ratio; V_rms = sqrt(V_rms/samples) * V_ratio; P_apparent= I_rms*V_rms; PF=P_real/P_apparent; Energy = P_real*td/1000000.0; // Energy consumed this cycle in Joule cumulative_Energy = cumulative_Energy + Energy; // Energy consumed since arduino start Joule bill = bill + Energy*price; Serial.println(); Serial.print("Power Factor: "); Serial.print(PF); Serial.print(" Real Power: ");

31
Serial.print(P_real); Serial.print(" Apparent Power: "); Serial.print(P_apparent); Serial.print(" Voltage rms: "); Serial.print(V_rms); Serial.print(" Current rms"); Serial.print(I_rms); //////////////////////////////////////////////////////////////////////// void update_offsets() int V; int I; long sumV=0; long sumI=0; int samples=0; //T=micros(); for(samples;samples<3700;samples++) // 74 samples -> T = ~1.66 ms which is a full 60Hz cycle V=analogRead(A0); I=analogRead(A1); sumV = sumV + V; sumI = sumI + I; //T=micros()-T; V_offset= V_offset + ((1.0*sumV/samples)-V_offset)/16.0; I_offset= I_offset + ((1.0*sumI/samples)-I_offset)/16.0; Serial.println(); Serial.print("Voltage offset: "); Serial.print(V_offset); Serial.print(" Current offset: "); Serial.println(I_offset); ///////////////////////////////////////////////////////////////// void printToPage() boolean f1= false; // if price changes set flag boolean f2= false; // if price_threshold 1 changes set flag boolean f3= false; // if Bill_threshold 1 changes set flag boolean f4= false; // if price_threshold 2 changes set flag boolean f5= false; // if Bill_threshold 2 changes set flag WiFiClient client = server.available(); if (client) Serial.println("new client"); String currentLine = ""; String newPrice = ""; while (client.connected()) if (client.available()) char c = client.read(); Serial.write(c); if (c == '\n') if (currentLine.length()==0) client.println("HTTP/1.1 200 OK"); client.println("Content-Type: text/html");
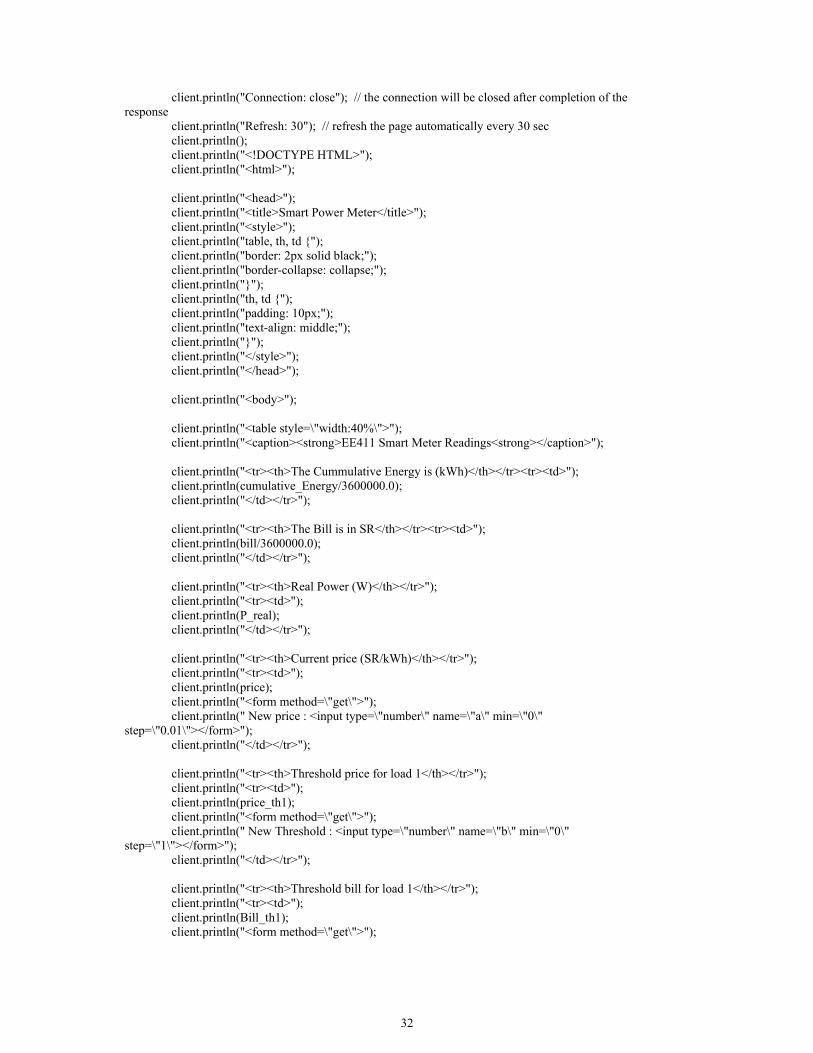
32
client.println("Connection: close"); // the connection will be closed after completion of the response client.println("Refresh: 30"); // refresh the page automatically every 30 sec client.println(); client.println("<!DOCTYPE HTML>"); client.println("<html>"); client.println("<head>"); client.println("<title>Smart Power Meter</title>"); client.println("<style>"); client.println("table, th, td "); client.println("border: 2px solid black;"); client.println("border-collapse: collapse;"); client.println(""); client.println("th, td "); client.println("padding: 10px;"); client.println("text-align: middle;"); client.println(""); client.println("</style>"); client.println("</head>"); client.println("<body>"); client.println("<table style=\"width:40%\">"); client.println("<caption><strong>EE411 Smart Meter Readings<strong></caption>"); client.println("<tr><th>The Cummulative Energy is (kWh)</th></tr><tr><td>"); client.println(cumulative_Energy/3600000.0); client.println("</td></tr>"); client.println("<tr><th>The Bill is in SR</th></tr><tr><td>"); client.println(bill/3600000.0); client.println("</td></tr>"); client.println("<tr><th>Real Power (W)</th></tr>"); client.println("<tr><td>"); client.println(P_real); client.println("</td></tr>"); client.println("<tr><th>Current price (SR/kWh)</th></tr>"); client.println("<tr><td>"); client.println(price); client.println("<form method=\"get\">"); client.println(" New price : <input type=\"number\" name=\"a\" min=\"0\" step=\"0.01\"></form>"); client.println("</td></tr>"); client.println("<tr><th>Threshold price for load 1</th></tr>"); client.println("<tr><td>"); client.println(price_th1); client.println("<form method=\"get\">"); client.println(" New Threshold : <input type=\"number\" name=\"b\" min=\"0\" step=\"1\"></form>"); client.println("</td></tr>"); client.println("<tr><th>Threshold bill for load 1</th></tr>"); client.println("<tr><td>"); client.println(Bill_th1); client.println("<form method=\"get\">");

33
client.println(" New Threshold : <input type=\"number\" name=\"c\" min=\"0\" step=\"1\"></form>"); client.println("</td></tr>"); client.println("<tr><th>Threshold price for load 2</th></tr>"); client.println("<tr><td>"); client.println(price_th2); client.println("<form method=\"get\">"); client.println(" New Threshold : <input type=\"number\" name=\"d\" min=\"0\" step=\"1\"></form>"); client.println("</td></tr>"); client.println("<tr><th>Threshold bill for load 2</th></tr>"); client.println("<tr><td>"); client.println(Bill_th2); client.println("<form method=\"get\">"); client.println(" New Threshold : <input type=\"number\" name=\"e\" min=\"0\" step=\"1\"></form>"); client.println("</td></tr></table></body></html>"); break; else currentLine = ""; Serial.println(newPrice); if(f1) price = newPrice.toFloat(); newPrice= ""; f1 = false; if(f2) price_th1 = newPrice.toFloat(); newPrice= ""; f2 = false; if(f3) Bill_th1 = newPrice.toFloat(); newPrice= ""; f3 = false; if(f4) price_th2 = newPrice.toFloat(); newPrice= ""; f4 = false; if(f5) Bill_th2 = newPrice.toFloat(); newPrice= ""; f5 = false; client.stop(); Serial.println("client disonnected");

34
/////////////////////////////////////////////////////////////// void printWifiStatus() // print the SSID of the network you're attached to: Serial.print("SSID: "); Serial.println(WiFi.SSID()); // print your WiFi shield's IP address: IPAddress ip = WiFi.localIP(); Serial.print("IP Address: "); Serial.println(ip); // print the received signal strength: long rssi = WiFi.RSSI(); Serial.print("signal strength (RSSI):"); Serial.print(rssi); Serial.println(" dBm"); ///////////////////////////////////////////////////////////////////////////// void control() if ((bill/3600000.0)>= Bill_th1) digitalWrite(30, HIGH); else if (price>=price_th1) digitalWrite(30, HIGH); else digitalWrite(30, LOW); if ((bill/3600000.0)>= Bill_th2) digitalWrite(31, HIGH); else if (price>=price_th2) digitalWrite(31, HIGH); else digitalWrite(31, LOW); /////////////////////////////////////////////////////////////////////////////// void screen() lcd.setCursor(0, 0); lcd.print("Price : "); lcd.print(price); lcd.setCursor(0, 1); lcd.print("Bill : "); lcd.print(bill/3600000.0); void screen2() lcd.setCursor(0, 0); lcd.print("Power : "); lcd.print(P_real); lcd.setCursor(0, 1); lcd.print("Energy : "); lcd.print(cumulative_Energy/3600000.0);

35
7.2 Appendix B: last Progress report for design course
" Smart Meter"
At this stage we have completed most of the work of this semester and I will show it in
the steps below.
Step 1:
We have completed 80% of the circuit implementation using the Arduino and the
transformers.
Step 2:
We have completed the program and the codes that we are going to use for this semester.
Step 3:
In these days, we are trying to calculate the bill for the customer and to show it in the
LCD.
Step 4:
We have computed the current and the power.
36
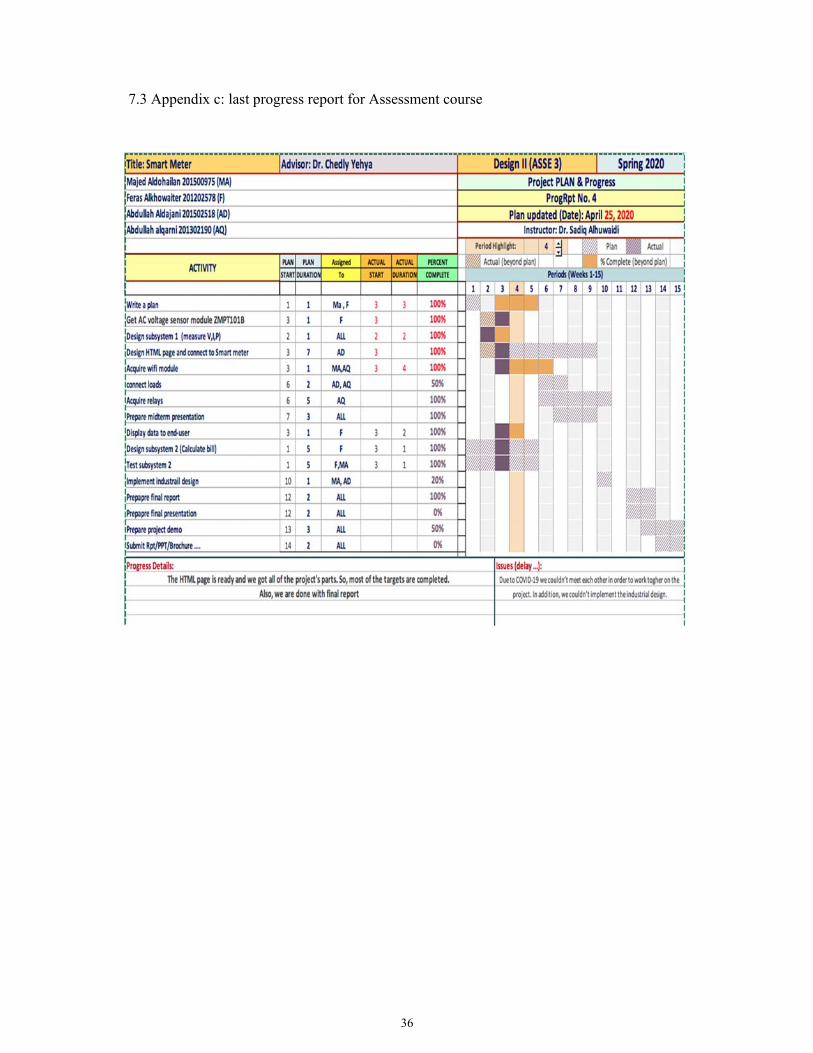
7.3 Appendix c: last progress report for Assessment course

37
8. Conclusion
In conclusion, this report can explain the way to implement a smart meter which
can compute the power, the energy, the bill and disconnecting loads. We start the report
by giving the definition of the project and the objectives and applications. We aimed to
evaluate the different steps and procedures that we took to obtain the voltage and current
readings, the power calculations, the graphical user-friendly interface, Arduino coding,
the load-disconnection techniques, and the LCD which provided an attractive display of
the price and electricity bill. Most of the challenges that we faced in implementing the
system was that some of the components didn’t arrive in time and some of the
components was ruined. Also, we took long time to implement the system in Fall
semester. At the end of the Fall semester, we did a big mistake that we dissembled the
circuit and I think some of the components was ruined because of that and this cost us the
delay of reimplementing the system. At the end, the components arrived but due to the
Covid-19 situation it was very hard to make the project in the way we want. The project
couldn’t cost us a lot. It should cost us around 1500 SR but it cost us around 1200 SR
because we didn’t buy the whole loads yet. Finally, we are very sad that we couldn’t
finish it. We always waited for a stress at the time of discussions or the time of showing
the demo of the project but there is nothing to do. We must say thank you for taking care
of us and make it easy for the whole students.

38
9. References:
https://innovatorsguru.com/zmpt101b/
(n.d.). Retrieved from https://forum.arduino.cc/index.php?topic=320818.0
(n.d.). Retrieved from https://forum.arduino.cc/index.php?topic=347984.0
Archived Forum. (n.d.). Retrieved from https://openenergymonitor.org/forum-
archive/node/156.html
Archived Forum. (n.d.). Retrieved from https://openenergymonitor.org/forum-
archive/node/156.html
Electrical Relay and Solid State Relays. (2018, February 11). Retrieved from
https://www.electronics-tutorials.ws/io/io_5.html
OpenEnergyMonitor. (n.d.). Retrieved from https://learn.openenergymonitor.org/electricity-
monitoring/voltage-sensing/measuring-voltage-with-an-acac-power-adapter
OpenEnergyMonitor. (n.d.). Retrieved from https://learn.openenergymonitor.org/electricity-
monitoring/voltage-sensing/acac-component-tolerances
STEM, H. (2019, December 14). Hacking STEM Electroconductivity Meter. Retrieved from
https://www.hackster.io/HackingSTEM/hacking-stem-electroconductivity-meter-a82c58
Stream Data from Arduino into Excel. (n.d.). Retrieved from
https://create.arduino.cc/projecthub/HackingSTEM/stream-data-from-arduino-into-excel-
f1bede
Stream Data from Arduino into Excel. (n.d.). Retrieved from
https://create.arduino.cc/projecthub/HackingSTEM/stream-data-from-arduino-into-excel-
f1bede
Wendt, Z. (2020, March 6). Solid State vs. Electromechanical Relays. Retrieved from
https://www.arrow.com/en/research-and-events/articles/crydom-solid-state-relays-vs-
electromechanical-relays