Embed Size (px)
Citation preview
FACT BOOKCOLLEGE OF ENGINEERING 2017-18
®

General Information
1
®
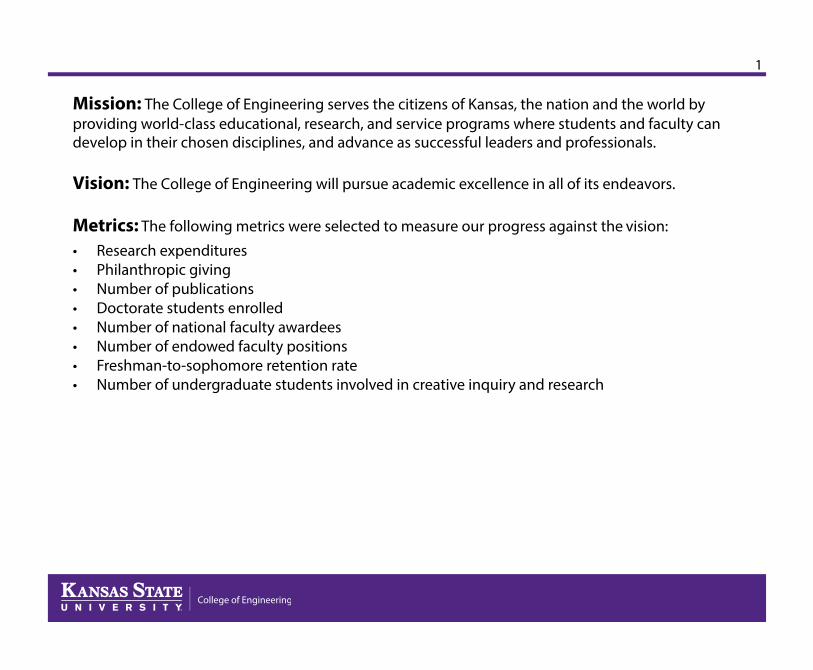
Mission: The College of Engineering serves the citizens of Kansas, the nation and the world by providing world-class educational, research, and service programs where students and faculty can develop in their chosen disciplines, and advance as successful leaders and professionals.
Vision: The College of Engineering will pursue academic excellence in all of its endeavors.
Metrics: The following metrics were selected to measure our progress against the vision:
• Research expenditures• Philanthropic giving• Number of publications• Doctorate students enrolled• Number of national faculty awardees• Number of endowed faculty positions• Freshman-to-sophomore retention rate• Number of undergraduate students involved in creative inquiry and research

2
®
B.S. M.S. Ph.D.Architectural Engineering
Biological and Agricultural Engineering
Biological Systems Engineering
Biomedical Engineering
Chemical Engineering
Civil Engineering
Computer Engineering
Computer Science
Construction Science and Management
Electrical Engineering
Engineering Management
Industrial Engineering
Information Systems
Mechanical Engineering
Nuclear Engineering
Operations Research
Software Engineering
X
X
X
X
X
X
X
X
X
X
X
X
X
X
X
X
X
X
X
X
X
X
X
X
X
X
X
X
X
X
X
X
Programs of Study
3
®
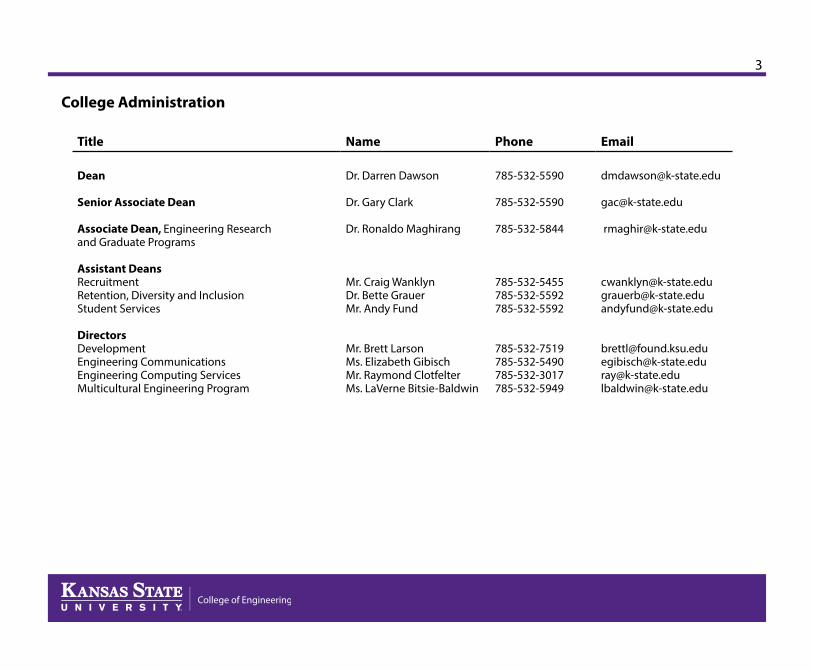
Title Name Phone Email
Dean
Senior Associate Dean
Associate Dean, Engineering Researchand Graduate Programs
Assistant DeansRecruitmentRetention, Diversity and InclusionStudent Services
DirectorsDevelopmentEngineering CommunicationsEngineering Computing ServicesMulticultural Engineering Program
Dr. Darren Dawson
Dr. Gary Clark
Dr. Ronaldo Maghirang
Mr. Craig WanklynDr. Bette GrauerMr. Andy Fund
Mr. Brett LarsonMs. Elizabeth GibischMr. Raymond ClotfelterMs. LaVerne Bitsie-Baldwin
785-532-5590
785-532-5590
785-532-5844
785-532-5455785-532-5592785-532-5592
785-532-7519785-532-5490785-532-3017785-532-5949
[email protected]@[email protected]
[email protected]@[email protected]@k-state.edu
College Administration
4
®
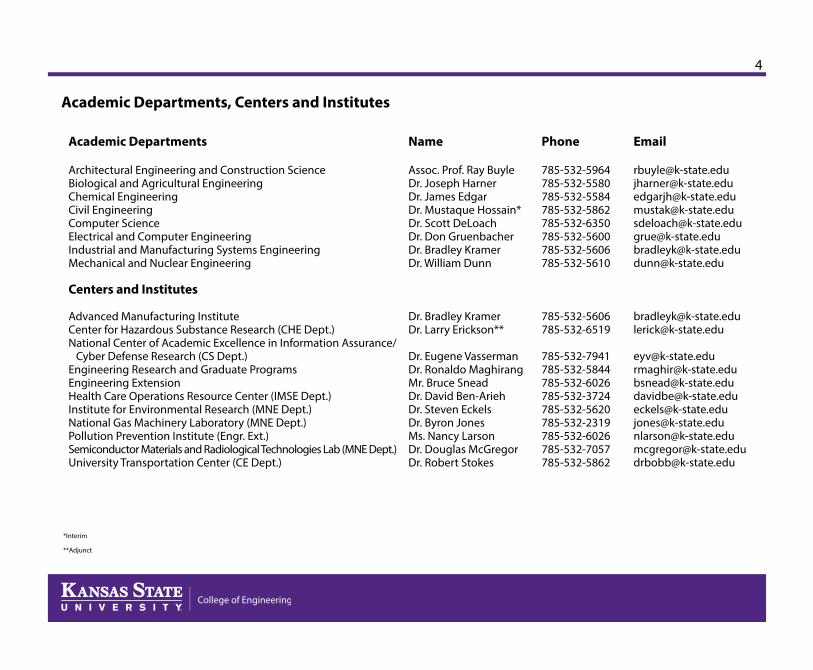
Academic Departments, Centers and Institutes
Academic Departments Name Phone Email
Architectural Engineering and Construction Science Biological and Agricultural EngineeringChemical EngineeringCivil EngineeringComputer ScienceElectrical and Computer EngineeringIndustrial and Manufacturing Systems EngineeringMechanical and Nuclear Engineering
Centers and Institutes Advanced Manufacturing InstituteCenter for Hazardous Substance Research (CHE Dept.)National Center of Academic Excellence in Information Assurance/ Cyber Defense Research (CS Dept.)Engineering Research and Graduate ProgramsEngineering ExtensionHealth Care Operations Resource Center (IMSE Dept.)Institute for Environmental Research (MNE Dept.)National Gas Machinery Laboratory (MNE Dept.)Pollution Prevention Institute (Engr. Ext.)Semiconductor Materials and Radiological Technologies Lab (MNE Dept.)University Transportation Center (CE Dept.)
Assoc. Prof. Ray BuyleDr. Joseph HarnerDr. James EdgarDr. Mustaque Hossain*Dr. Scott DeLoachDr. Don GruenbacherDr. Bradley KramerDr. William Dunn
Dr. Bradley KramerDr. Larry Erickson**
Dr. Eugene VassermanDr. Ronaldo Maghirang Mr. Bruce SneadDr. David Ben-AriehDr. Steven EckelsDr. Byron JonesMs. Nancy LarsonDr. Douglas McGregorDr. Robert Stokes
785-532-5964785-532-5580785-532-5584785-532-5862785-532-6350785-532-5600785-532-5606785-532-5610
785-532-5606785-532-6519
785-532-7941785-532-5844785-532-6026785-532-3724785-532-5620785-532-2319785-532-6026785-532-7057785-532-5862
[email protected]@[email protected]@[email protected]@[email protected]@k-state.edu
[email protected]@k-state.edu
[email protected]@[email protected]@[email protected]@[email protected]@[email protected]
*Interim
**Adjunct
5
®
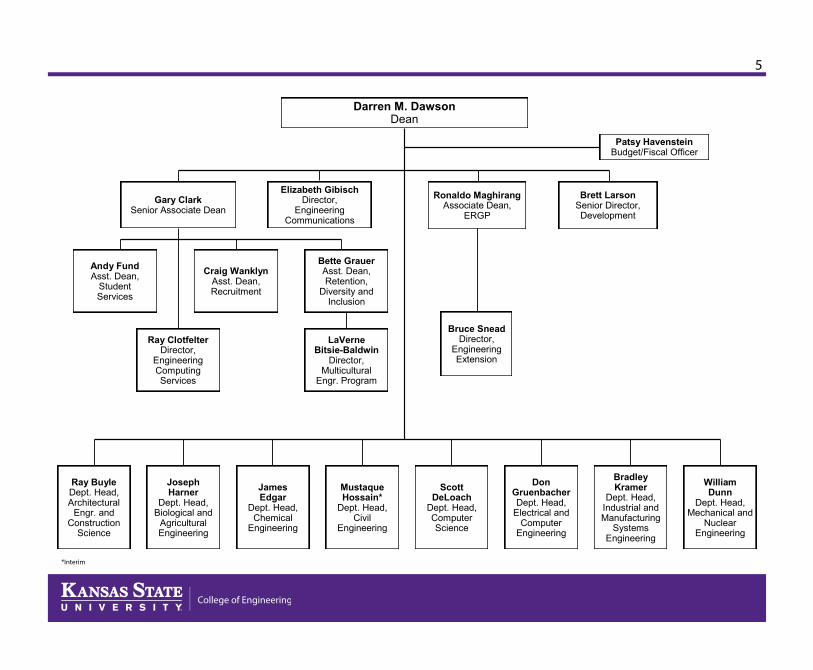
Darren M. Dawson Dean
Patsy Havenstein Budget/Fiscal Officer
Gary Clark Senior Associate Dean
Ronaldo Maghirang Associate Dean,
ERGP
Brett Larson Senior Director, Development
Andy Fund Asst. Dean,
Student Services
Craig Wanklyn Asst. Dean, Recruitment
Bruce Snead Director,
Engineering Extension
Elizabeth Gibisch Director,
Engineering Communications
LaVerne Bitsie-Baldwin
Director, Multicultural
Engr. Program
Ray Clotfelter Director,
Engineering Computing Services
Ray Buyle Dept. Head, Architectural
Engr. and Construction
Science
Joseph Harner
Dept. Head, Biological and
Agricultural Engineering
James Edgar
Dept. Head, Chemical
Engineering
Mustaque Hossain*
Dept. Head, Civil
Engineering
Scott DeLoach
Dept. Head, Computer Science
Don Gruenbacher Dept. Head,
Electrical and Computer
Engineering
Bradley Kramer
Dept. Head, Industrial and Manufacturing
Systems Engineering
William Dunn
Dept. Head, Mechanical and
Nuclear Engineering
Bette Grauer Asst. Dean, Retention,
Diversity and Inclusion
*Interim

6
®
Deans of the College of Engineering
Name Term
Edmund B. McCormick
A. A. Potter
Roy A. Seaton
M. A. Durland
John Shupe (Acting)
Paul Russell
Ralph G. Nevins
Donald E. Rathbone
Terry S. King
Richard R. Gallagher (Interim)
John R. English
Gary A. Clark (Interim)
Darren M. Dawson
1908 - 1913
1913 - 1920
1920 - 1949
1949 - 1961
1961 - 1963
1963 - 1967
1967 - 1973
1973 - 1997
1997 - 2006
2006 - 2007
2007 - 2013
2013 - 2014
2014 -

7
®
MemberKevin Burke Stan Clark Jim Coen Gib Compton Darold Davis Lynda Dawson Roger Farrell Chuck Grier Kevin Honomichl Steve Johnson Warren Kennedy Mike King Mark Nyquist Robert Reichenberger Mark Schonhoff Sabrina Schriner Mitch Snyder Doug Sterbenz Robin Sterling Spencer Tholstrup Steven Wade Cindy Wallis-Lage Beth Ward Keith Warta Mike Wiegers Kent Wray
TitlePresidentRetired Engineering Manager, Mobile ProductsVice PresidentPresidentRetired Transportation Senior Project Manager, Quality ControlOwnerCEO Chairman/CEOPartner/PresidentVice President of Government RelationsSenior Vice President Houston OperationsRegion Director, Plains Area of ResponsibilityCEOPresidentRetired Vice President, Software DevelopmentFounder/President/OwnerPresident/CEORetired Executive Vice President and COOPresidentRetired Key Account Manager DownstreamVP Attack Helicopter Programs & Sr. Site ExecutivePresident of Global Water BusinessSenior Vice President - Supply ChainCEOVP Consumer EngineeringVice Chancellor for Global & Strategic Partnership
CompanyBurke Construction Group Inc.AGCOMV PurchasingCompton Construction CorporationGarver Engineers LLCW.L. CassellXplorer Midstream LLCUtility Contractors Inc.BHC RhodesONEOK IncBurns & McDonnellMurphy Tractor & Equiptment Co Inc.Dyna Ten CorpSolar PrimeCerner CorporationBusiness Excellence Consulting Inc.Bell HelicopterWestar EnergySkyline Construction CompanyNalco Champion Energy Services CompanyThe Boeing CompanyBlack & Veatch CorporationHallmark CardsBartlett & West Engineers Inc.Garmin International Inc.Missouri University of Science & Technology
College of Engineering Advisory Council

Faculty
8
®
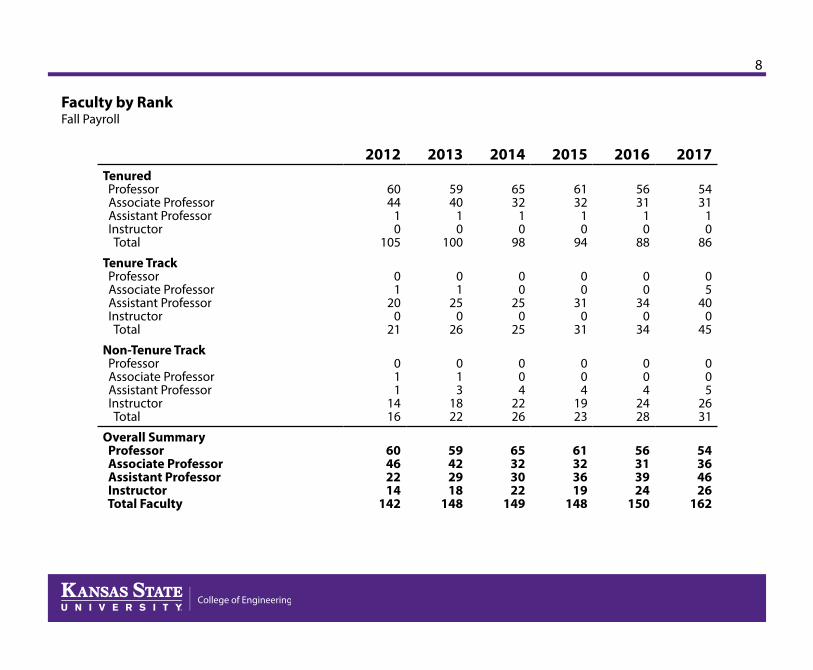
Faculty by RankFall Payroll
2012 2013 2014 2015 2016 2017Tenured Professor Associate Professor Assistant Professor Instructor Total
6044
10
105
5940
10
100
6532
10
98
6132
10
94
5631
10
88
5431
10
86
Tenure Track Professor Associate Professor Assistant Professor Instructor Total
01
200
21
01
250
26
00
250
25
00
310
31
00
340
34
05
400
45
Non-Tenure Track Professor Associate Professor Assistant Professor Instructor Total
011
1416
013
1822
004
2226
004
1923
004
2428
005
2631
Overall Summary Professor Associate Professor Assistant Professor Instructor Total Faculty
60462214
142
59422918
148
65323022
149
61323619
148
56313924
150
54364626
162
9
®
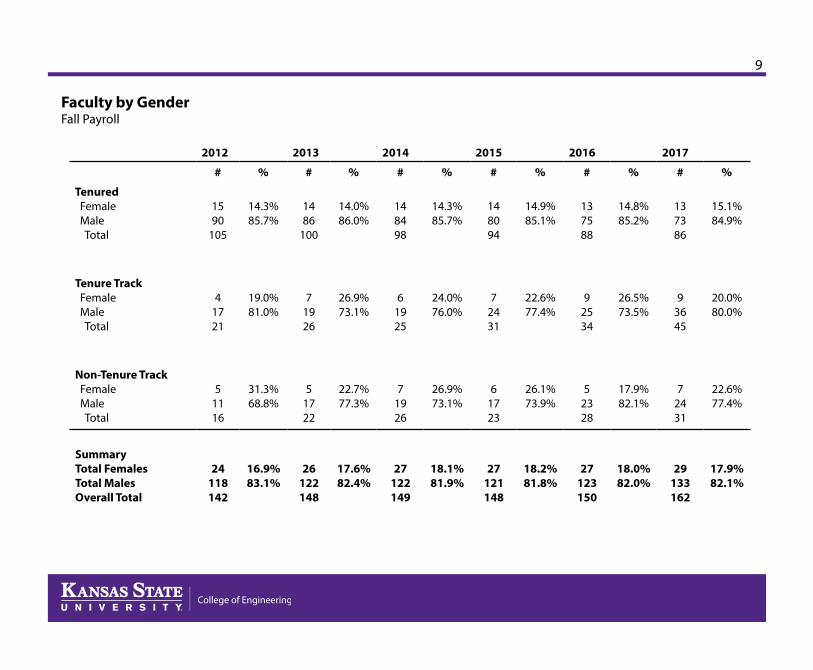
Faculty by GenderFall Payroll
2012 2013 2014 2015 2016 2017
# % # % # % # % # % # %
Tenured Female Male Total
1590
105
14.3%85.7%
1486
100
14.0%86.0%
148498
14.3%85.7%
148094
14.9%85.1%
137588
14.8%85.2%
137386
15.1%84.9%
Tenure Track Female Male Total
41721
19.0% 81.0%
71926
26.9%73.1%
61925
24.0%76.0%
72431
22.6%77.4%
92534
26.5%73.5%
93645
20.0%80.0%
Non-Tenure Track Female Male Total
51116
31.3%68.8%
51722
22.7%77.3%
71926
26.9%73.1%
61723
26.1%73.9%
52328
17.9%82.1%
72431
22.6%77.4%
SummaryTotal FemalesTotal MalesOverall Total
24118142
16.9%83.1%
26122148
17.6%82.4%
27122149
18.1%81.9%
27121148
18.2%81.8%
27123150
18.0%82.0%
29133162
17.9%82.1%
10
®
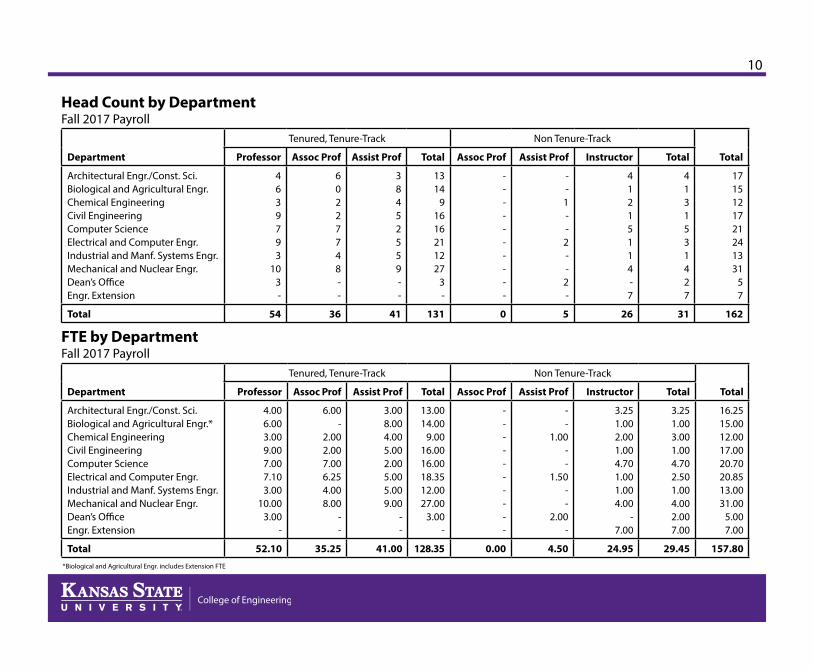
Head Count by DepartmentFall 2017 Payroll
FTE by DepartmentFall 2017 Payroll
Department
Tenured, Tenure-Track Non Tenure-Track
TotalProfessor Assoc Prof Assist Prof Total Assoc Prof Assist Prof Instructor Total
Architectural Engr./Const. Sci.Biological and Agricultural Engr.*Chemical EngineeringCivil EngineeringComputer ScienceElectrical and Computer Engr.Industrial and Manf. Systems Engr.Mechanical and Nuclear Engr.Dean’s OfficeEngr. Extension
4.006.003.009.007.007.103.00
10.003.00
-
6.00-
2.002.007.006.254.008.00
--
3.008.004.005.002.005.005.009.00
--
13.0014.00
9.0016.0016.0018.3512.0027.00
3.00-
----------
--
1.00--
1.50--
2.00-
3.251.002.001.004.701.001.004.00
-7.00
3.251.003.001.004.702.501.004.002.007.00
16.2515.0012.0017.0020.7020.8513.0031.00
5.007.00
Total 52.10 35.25 41.00 128.35 0.00 4.50 24.95 29.45 157.80
Department
Tenured, Tenure-Track Non Tenure-Track
TotalProfessor Assoc Prof Assist Prof Total Assoc Prof Assist Prof Instructor Total
Architectural Engr./Const. Sci.Biological and Agricultural Engr.Chemical EngineeringCivil EngineeringComputer ScienceElectrical and Computer Engr.Industrial and Manf. Systems Engr.Mechanical and Nuclear Engr.Dean’s OfficeEngr. Extension
4639793
103-
60227748--
38452559--
1314
91616211227
3-
----------
--1--2--2-
41215114-7
4131531427
1715121721241331
57
Total 54 36 41 131 0 5 26 31 162
*Biological and Agricultural Engr. includes Extension FTE
11
®
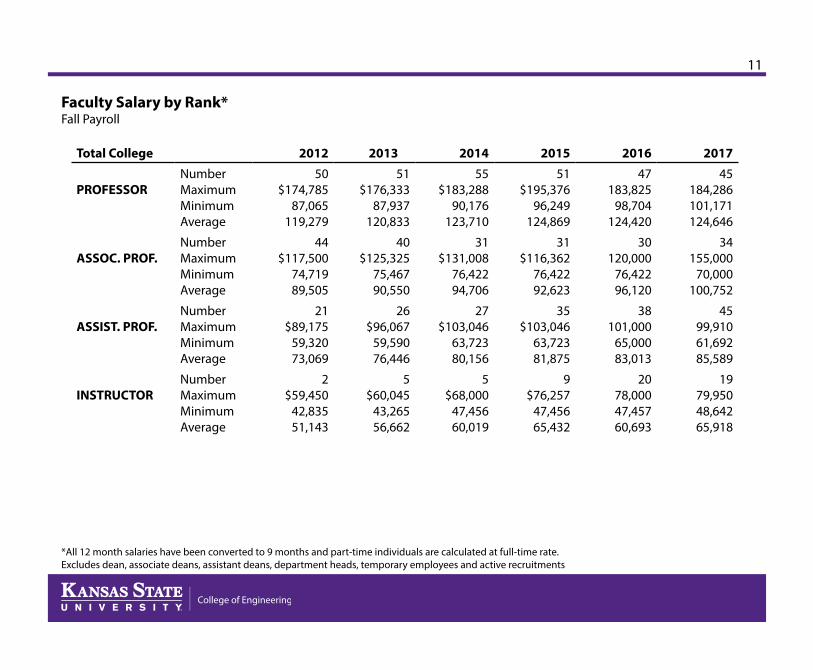
Faculty Salary by Rank*Fall Payroll
Total College 2012 2013 2014 2015 2016 2017
PROFESSORNumberMaximumMinimumAverage
50$174,785
87,065119,279
51$176,333
87,937120,833
55$183,288
90,176123,710
51$195,376
96,249124,869
47183,825
98,704124,420
45184,286101,171124,646
ASSOC. PROF.NumberMaximumMinimumAverage
44$117,500
74,71989,505
40$125,325
75,46790,550
31$131,008
76,42294,706
31$116,362
76,42292,623
30120,000
76,42296,120
34155,000
70,000100,752
ASSIST. PROF.NumberMaximumMinimumAverage
21$89,175
59,32073,069
26$96,067
59,59076,446
27$103,046
63,72380,156
35$103,046
63,72381,875
38101,000
65,00083,013
4599,91061,69285,589
INSTRUCTORNumberMaximumMinimumAverage
2$59,450
42,83551,143
5$60,045
43,26556,662
5$68,000
47,45660,019
9$76,257
47,45665,432
2078,00047,45760,693
1979,95048,64265,918
*All 12 month salaries have been converted to 9 months and part-time individuals are calculated at full-time rate.Excludes dean, associate deans, assistant deans, department heads, temporary employees and active recruitments
12
®
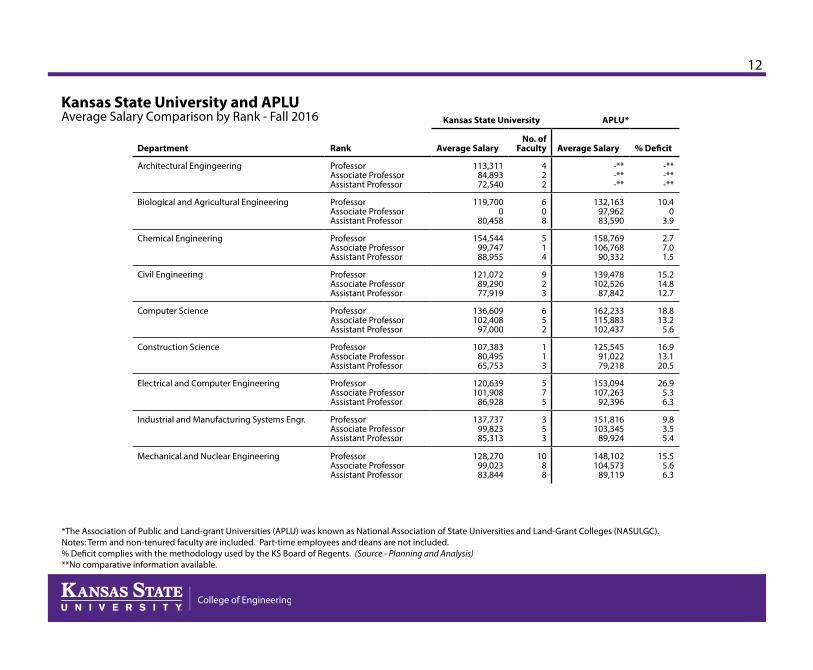
Kansas State University and APLUAverage Salary Comparison by Rank - Fall 2016 Kansas State University APLU*
Department Rank Average SalaryNo. of
Faculty Average Salary % Deficit
Architectural Engingeering ProfessorAssociate ProfessorAssistant Professor
113,31184,89372,540
422
-**-**-**
-**-**-**
Biological and Agricultural Engineering ProfessorAssociate ProfessorAssistant Professor
119,7000
80,458
608
132,16397,96283,590
10.40
3.9
Chemical Engineering ProfessorAssociate ProfessorAssistant Professor
154,54499,74788,955
514
158,769106,768
90,332
2.77.01.5
Civil Engineering ProfessorAssociate ProfessorAssistant Professor
121,07289,29077,919
923
139,478102,526
87,842
15.214.812.7
Computer Science ProfessorAssociate ProfessorAssistant Professor
136,609102,408
97,000
652
162,233115,883102,437
18.813.2
5.6
Construction Science ProfessorAssociate ProfessorAssistant Professor
107,38380,49565,753
113
125,54591,02279,218
16.913.120.5
Electrical and Computer Engineering ProfessorAssociate ProfessorAssistant Professor
120,639101,908
86,928
575
153,094107,263
92,396
26.95.36.3
Industrial and Manufacturing Systems Engr. ProfessorAssociate ProfessorAssistant Professor
137,73799,82385,313
353
151,816103,345
89,924
9.83.55.4
Mechanical and Nuclear Engineering ProfessorAssociate ProfessorAssistant Professor
128,27099,02383,844
1088
148,102104,573
89,119
15.55.66.3
*The Association of Public and Land-grant Universities (APLU) was known as National Association of State Universities and Land-Grant Colleges (NASULGC).Notes: Term and non-tenured faculty are included. Part-time employees and deans are not included.% Deficit complies with the methodology used by the KS Board of Regents. (Source - Planning and Analysis)**No comparative information available.

13
®
$25,000
$45,000
$65,000
$85,000
$105,000
$125,000
$145,000
$165,000
FY08 FY09 FY10 FY11 FY12 FY13 FY14 FY15 FY16 FY17
K-State APLU K-State APLU K-State APLU
Assistant Professor
Professor
Associate Professor
Kansas State University and APLU ComparisonsFall 2016*
Faculty salary survey of institutions belonging to the Association of Public and Land-Grant Universities (APLU) Note: Previously known as NASULGC.
*Note: Fall 2017 salary information for APLU is unavailable
Professor Assoc Professor Assist Professor All Ranks
K-StateAPLU% Deficit
$127,754$150,508
17.8
$98,236$105,889
7.8
$82,392$91,221
10.7
$105,391$122,553
16.3
Presented using weighted averages

14
®
Name DesigneeTom H. Barrett University Faculty Chair in Chemical Engineering James Edgar
Boyd D. Brainard Departmental Faculty Chair in Mechanical Engineering Douglas McGregor
Mark and Brenda Brown Professorship in Electrical and Computer Engineering Future
John W. and Dorothy M. Burke Architectural Engineering Chair Fred Hasler
Gib and Brenda Compton Construction Science Faculty Award Future
Darold and Debbie Davis Cornerstone Teaching Scholar Hani Melhem
DOW Multicultural Engineering Program Director LaVerne Bitsie-Baldwin
Martin K. Eby Distinguished Professorship Katie Loughmiller
Peggy and Gary Edwards Chair in Engineering Pavithra Prabhakar
Ike and Letty Evans Cornerstone Teaching Scholar Todd Easton, Kenneth Shultis
Ike and Letty Evans Engineering Chair Bradley Kramer
George J. and Alice D. Fiedler Distinguished Chair in Electrical and Computer Engineering Don Gruenbacher
Charles and Nona Frankenhoff Chair in Engineering Mohammad Hosni
James Garrison and Lisa Pfannenstiel-Garrison Agricultural Engineering Faculty Fellowship Future
Donald Gemaehlich Electrical and Computer Engineering Professorship Future
Jim and Carolyn Grier Construction Science Chair Future
Named Positions
Continued on next page

15
®
Name DesigneeWilliam H. Honstead Professorship in Chemical Engineering Keith Hohn
Steve Hsu Keystone Research Faculty Scholar Hitesh Bindra, James Chen, Melanie Derby, Jeremy Roberts, Jessica Heier Stamm, Meng Zhang
Mark H. and Margaret H. Hulings Chair in Engineering Robert Peterman
Hutton Family Distinguished Faculty Fund in Construction Science James Goddard
Carl R. and Mary T. Ice Industrial Engineering Professorship Shuting Lei
G.E. Johnson Construction Science Chair Kimberly Kramer
James M. and Laura E. Johnson Engineering Faculty Endowment Future
Logan-Fetterhoof Electrical and Computer Engineering Faculty of Distinction Chair Anil Pahwa
Lucas-Rathbone Professorship in Engineering John Hatcliff
Louie T. Marshall Engineering Professorship Future
Munger Professorship in Civil Engineering Mustaque Hossain
Michelle Munson-Serban Simu Keystone Research Faculty Scholar George Amariucai, Jungkwun Kim, Sungo Kim, Behrooz Mirafzal, Arslan Munir, Punit Prakash, Mohammad Shadmand, Eugene Vasserman, Hongyu Wu
Harold O. and Jane C. Massey Neff Professorship in Mechanical Engineering Gurpreet Singh, Mingjun Wei
Clair N. Palmer and Sara M. Palmer Electrical Engineering Professorship Bala Natarajan
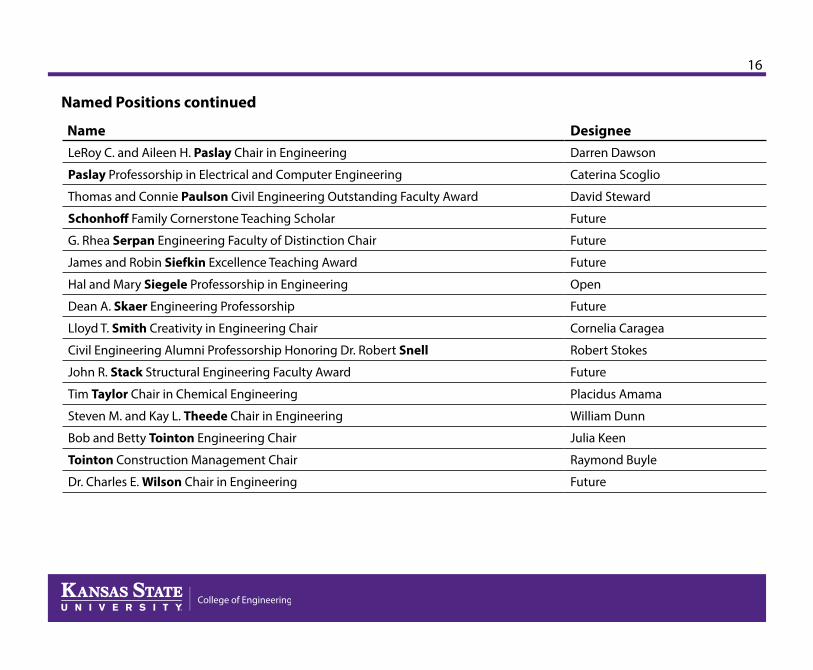
Named Positions continued
Continued on next page
16
®
Name DesigneeLeRoy C. and Aileen H. Paslay Chair in Engineering Darren Dawson
Paslay Professorship in Electrical and Computer Engineering Caterina Scoglio
Thomas and Connie Paulson Civil Engineering Outstanding Faculty Award David Steward
Schonhoff Family Cornerstone Teaching Scholar Future
G. Rhea Serpan Engineering Faculty of Distinction Chair Future
James and Robin Siefkin Excellence Teaching Award Future
Hal and Mary Siegele Professorship in Engineering Open
Dean A. Skaer Engineering Professorship Future
Lloyd T. Smith Creativity in Engineering Chair Cornelia Caragea
Civil Engineering Alumni Professorship Honoring Dr. Robert Snell Robert Stokes
John R. Stack Structural Engineering Faculty Award Future
Tim Taylor Chair in Chemical Engineering Placidus Amama
Steven M. and Kay L. Theede Chair in Engineering William Dunn
Bob and Betty Tointon Engineering Chair Julia Keen
Tointon Construction Management Chair Raymond Buyle
Dr. Charles E. Wilson Chair in Engineering Future
Named Positions continued

Students

17
®
Source: 20th day reports
Undergraduate Enrollment by College
0
1000
2000
3000
4000
5000
6000
7000
8000
2008 2009 2010 2011 2012 2013 2014 2015 2016 2017
Agriculture
Arch. & Design
Arts & Sciences
Business
Education
Engineering
Human Ecology
Technology
18
®
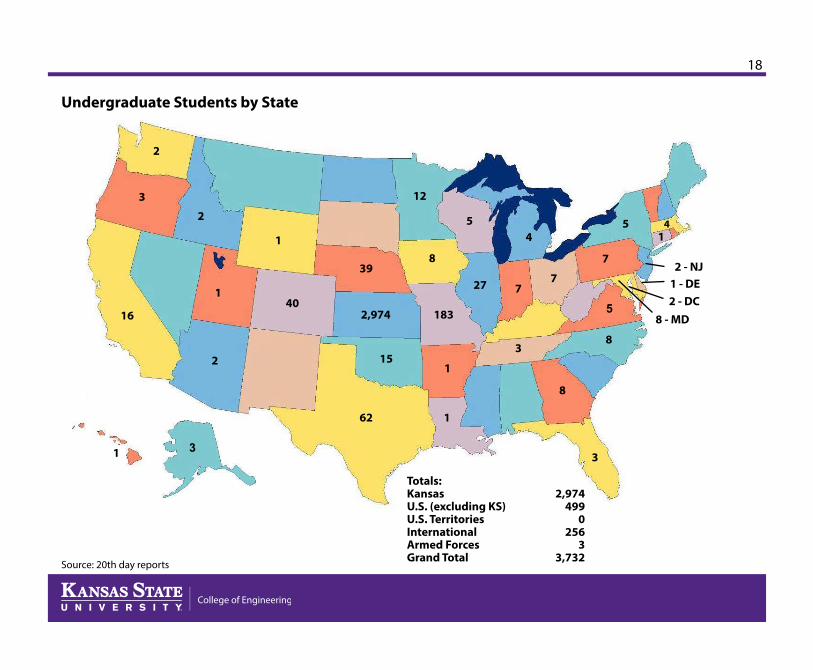
Undergraduate Students by State
2
3
1640
2
39
2,974
15
62
12
5
8
183
1
4
7
3
8
3
8
7
5 4
2 - NJ
8 - MD
1 - DE2 - DC
Totals:KansasU.S. (excluding KS)U.S. TerritoriesInternationalArmed ForcesGrand Total
2,974499
0256
33,732
27
5
2
1
1 7
11
Source: 20th day reports
31
19
®
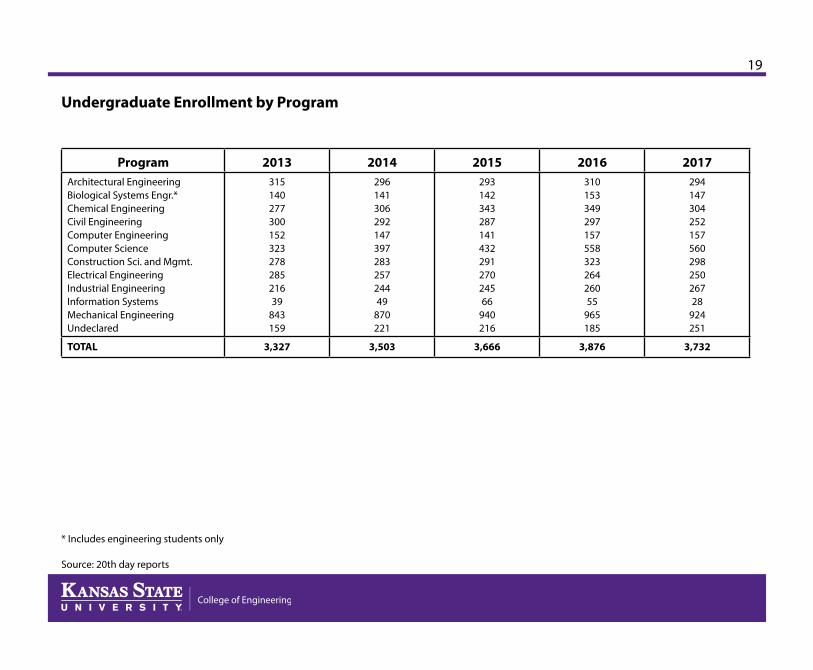
Undergraduate Enrollment by Program
* Includes engineering students only
Source: 20th day reports
Program 2013 2014 2015 2016 2017Architectural EngineeringBiological Systems Engr.*Chemical EngineeringCivil EngineeringComputer EngineeringComputer ScienceConstruction Sci. and Mgmt.Electrical EngineeringIndustrial EngineeringInformation SystemsMechanical EngineeringUndeclared
31514027730015232327828521639
843159
29614130629214739728325724449
870221
29314234328714143229127024566
940216
310 153 349 297157 558 323264 26055
965 185
29414730425215756029825026728
924251
TOTAL 3,327 3,503 3,666 3,876 3,732
20
®
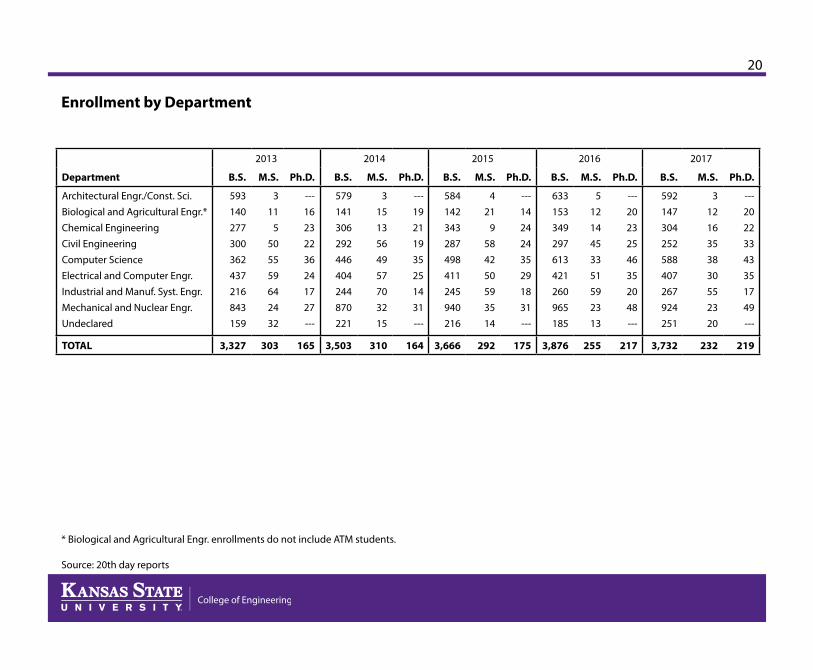
Enrollment by Department
2013 2014 2015 2016 2017
Department B.S. M.S. Ph.D. B.S. M.S. Ph.D. B.S. M.S. Ph.D. B.S. M.S. Ph.D. B.S. M.S. Ph.D.
Architectural Engr./Const. Sci.Biological and Agricultural Engr.*Chemical EngineeringCivil EngineeringComputer ScienceElectrical and Computer Engr.Industrial and Manuf. Syst. Engr.Mechanical and Nuclear Engr.Undeclared
593140277300362437216843159
311
5505559642432
---16232236241727---
579141306292446404244870221
31513564957703215
---19211935251431---
584142343287498411245940216
421
9584250593514
---14242435291831---
633 153 349 297 613 421 260 965 185
5 12 14 45 33 51 59 23 13
--- 20 23 25 46 35 20 48 ---
592147304252588407267924251
31216353830552320
--- 20223343351749 ---
TOTAL 3,327 303 165 3,503 310 164 3,666 292 175 3,876 255 217 3,732 232 219
* Biological and Agricultural Engr. enrollments do not include ATM students.
Source: 20th day reports
21
®
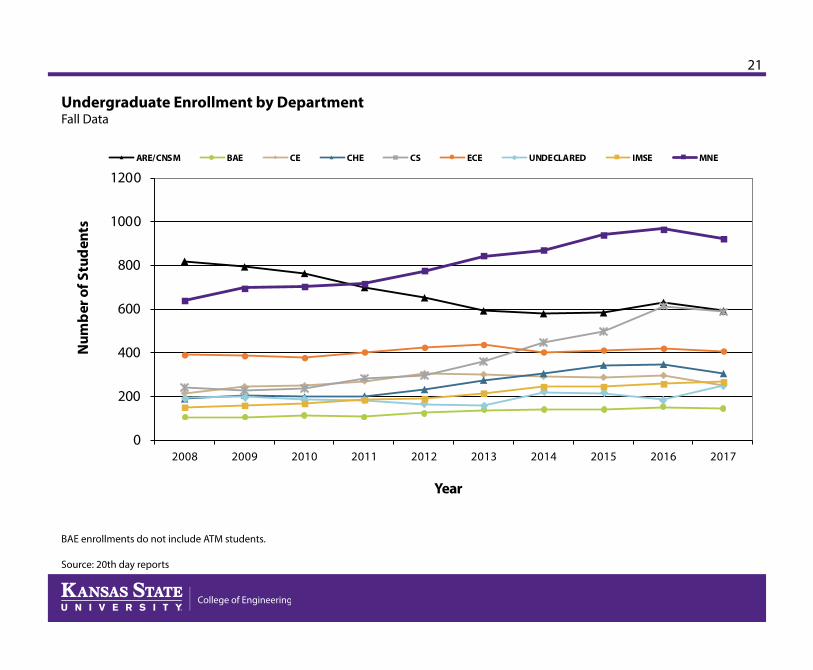
Undergraduate Enrollment by DepartmentFall Data
BAE enrollments do not include ATM students.
Source: 20th day reports
0
200
400
600
800
1000
1200
2008 2009 2010 2011 2012 2013 2014 2015 2016 2017
Num
ber
of S
tud
ents
Year
ARE/CNSM BAE CE CHE CS ECE UNDECLARED IMSE MNE
22
®
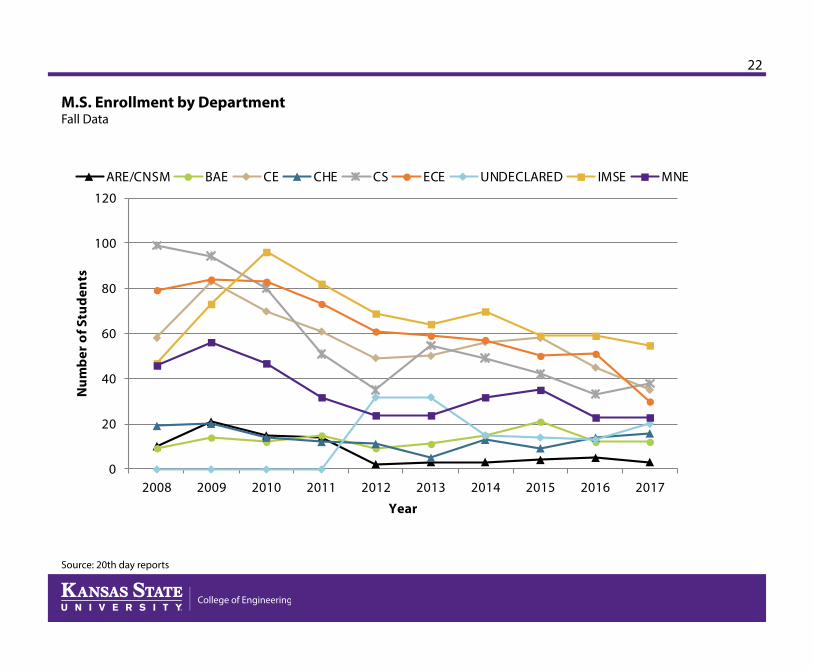
M.S. Enrollment by DepartmentFall Data
Source: 20th day reports
0
20
40
60
80
100
120
2008 2009 2010 2011 2012 2013 2014 2015 2016 2017
Num
ber o
f Stu
dent
s
Year
ARE/CNSM BAE CE CHE CS ECE UNDECLARED IMSE MNE
23
®
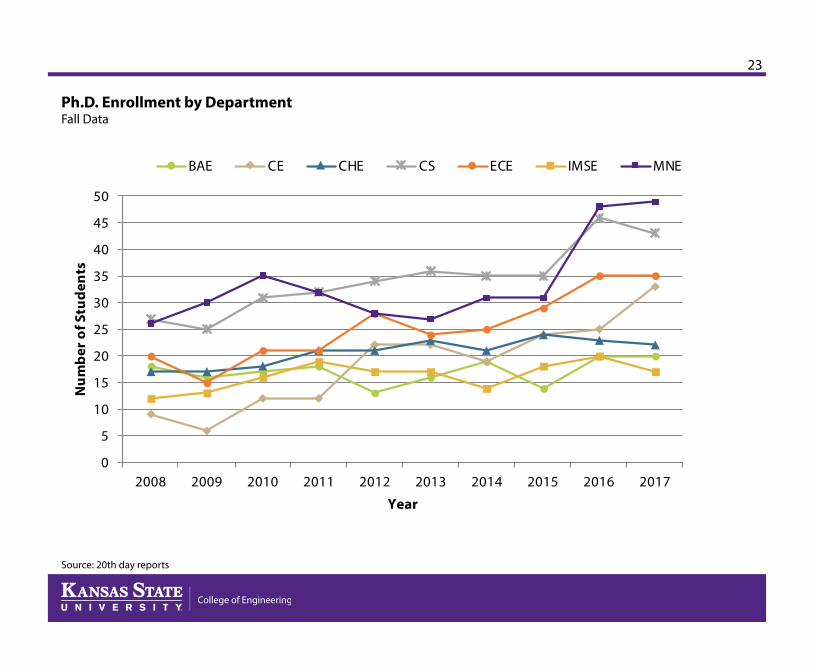
Ph.D. Enrollment by DepartmentFall Data
Source: 20th day reports
0
5
10
15
20
25
30
35
40
45
50
2008 2009 2010 2011 2012 2013 2014 2015 2016 2017
Num
ber o
f Stu
dent
s
Year
BAE CE CHE CS ECE IMSE MNE
24
®
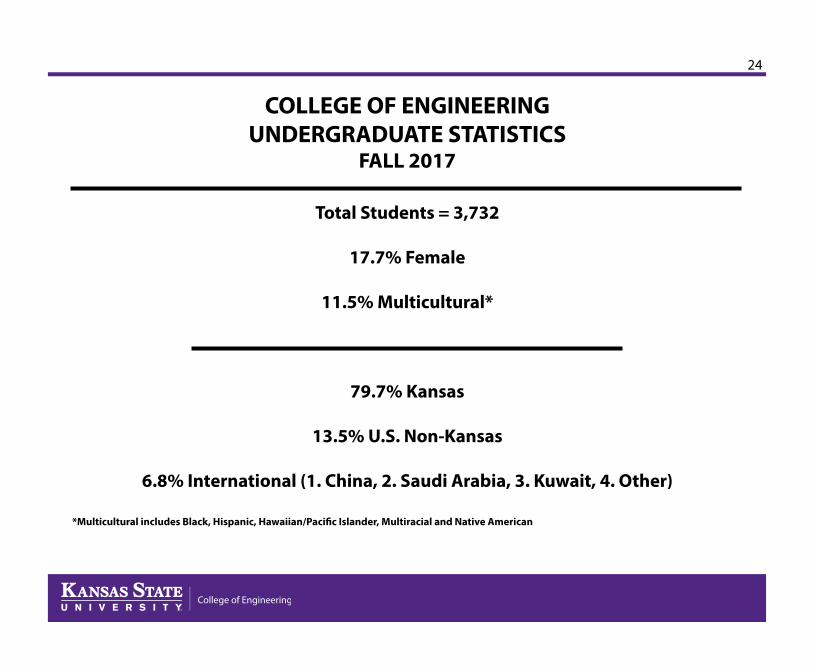
COLLEGE OF ENGINEERINGUNDERGRADUATE STATISTICS
FALL 2017
Total Students = 3,732
17.7% Female
11.5% Multicultural*
79.7% Kansas
13.5% U.S. Non-Kansas
6.8% International (1. China, 2. Saudi Arabia, 3. Kuwait, 4. Other)
*Multicultural includes Black, Hispanic, Hawaiian/Pacific Islander, Multiracial and Native American
25
®
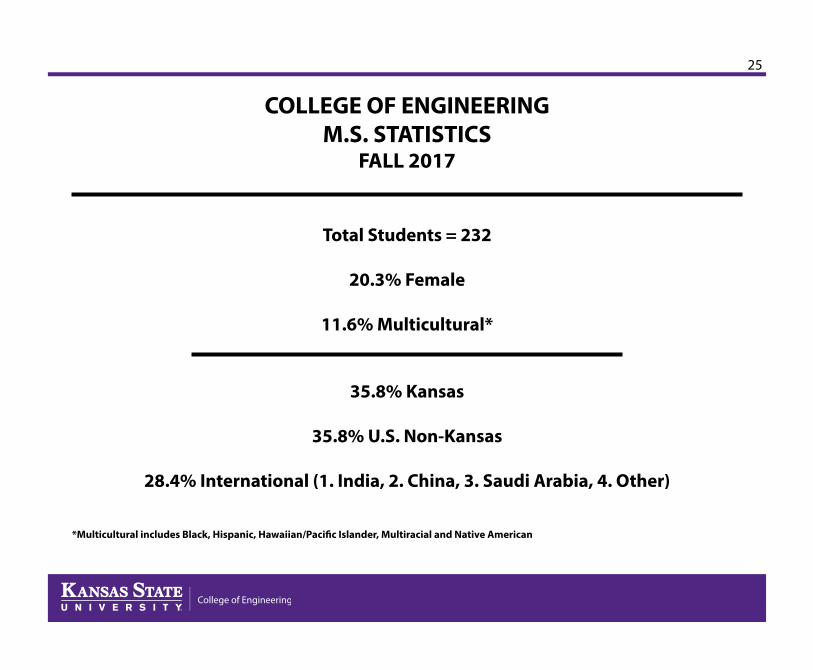
COLLEGE OF ENGINEERINGM.S. STATISTICS
FALL 2017
Total Students = 232
20.3% Female
11.6% Multicultural*
35.8% Kansas
35.8% U.S. Non-Kansas
28.4% International (1. India, 2. China, 3. Saudi Arabia, 4. Other)
*Multicultural includes Black, Hispanic, Hawaiian/Pacific Islander, Multiracial and Native American
26
®
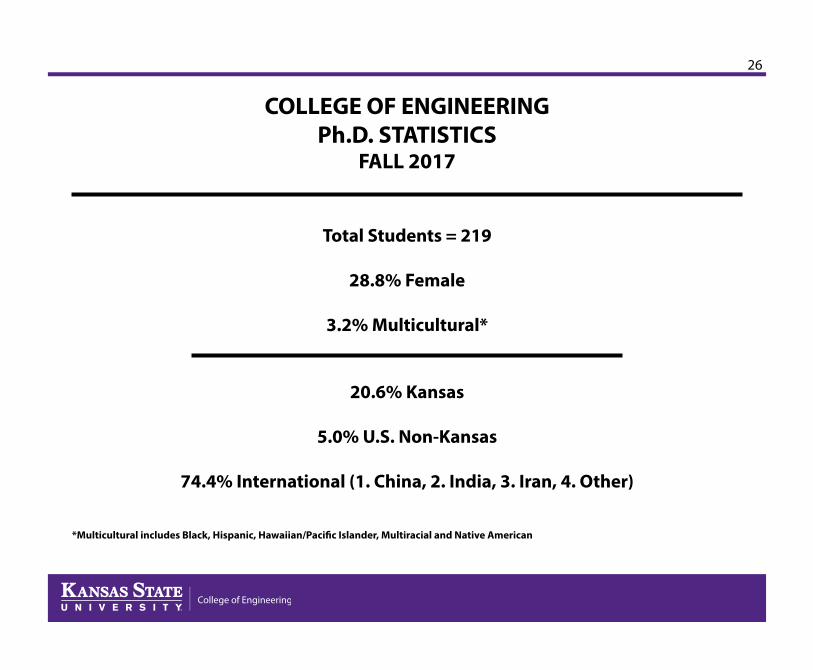
COLLEGE OF ENGINEERINGPh.D. STATISTICS
FALL 2017
Total Students = 219
28.8% Female
3.2% Multicultural*
20.6% Kansas
5.0% U.S. Non-Kansas
74.4% International (1. China, 2. India, 3. Iran, 4. Other)
*Multicultural includes Black, Hispanic, Hawaiian/Pacific Islander, Multiracial and Native American
27
®
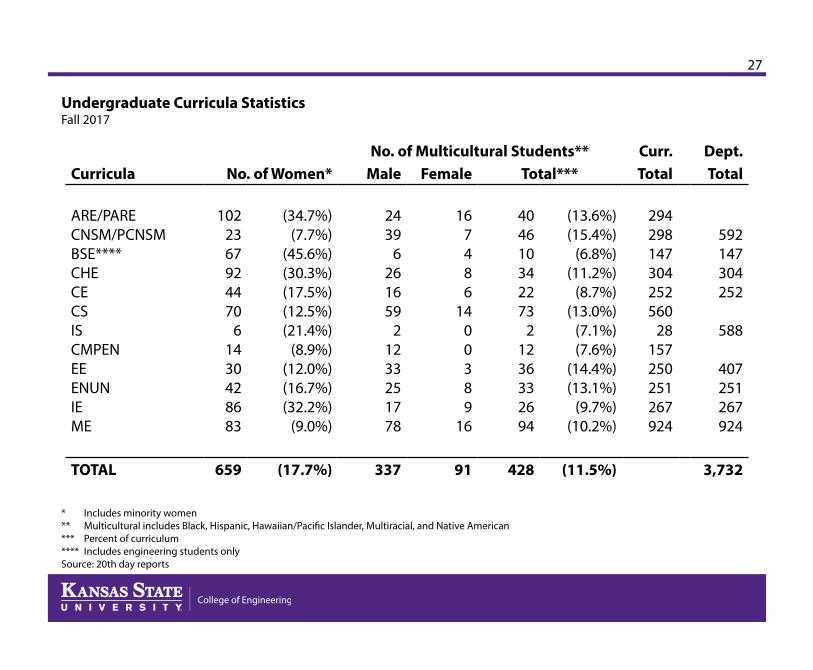
Undergraduate Curricula StatisticsFall 2017
No. of Multicultural Students** Curr. Dept.Curricula No. of Women* Male Female Total*** Total Total
ARE/PARECNSM/PCNSMBSE****CHECECSISCMPENEEENUNIEME
1022367924470
61430428683
(34.7%)(7.7%)
(45.6%)(30.3%) (17.5%) (12.5%) (21.4%)
(8.9%) (12.0%) (16.7%) (32.2%)
(9.0%)
2439
6261659
21233251778
167486
1400389
16
404610342273
21236332694
(13.6%) (15.4%)
(6.8%) (11.2%)
(8.7%) (13.0%)
(7.1%) (7.6%)
(14.4%) (13.1%)
(9.7%) (10.2%)
294298147304252560
28157250251267924
592147304252
588
407251267924
TOTAL 659 (17.7%) 337 91 428 (11.5%) 3,732
* Includes minority women** Multicultural includes Black, Hispanic, Hawaiian/Pacific Islander, Multiracial, and Native American*** Percent of curriculum**** Includes engineering students onlySource: 20th day reports
28
®
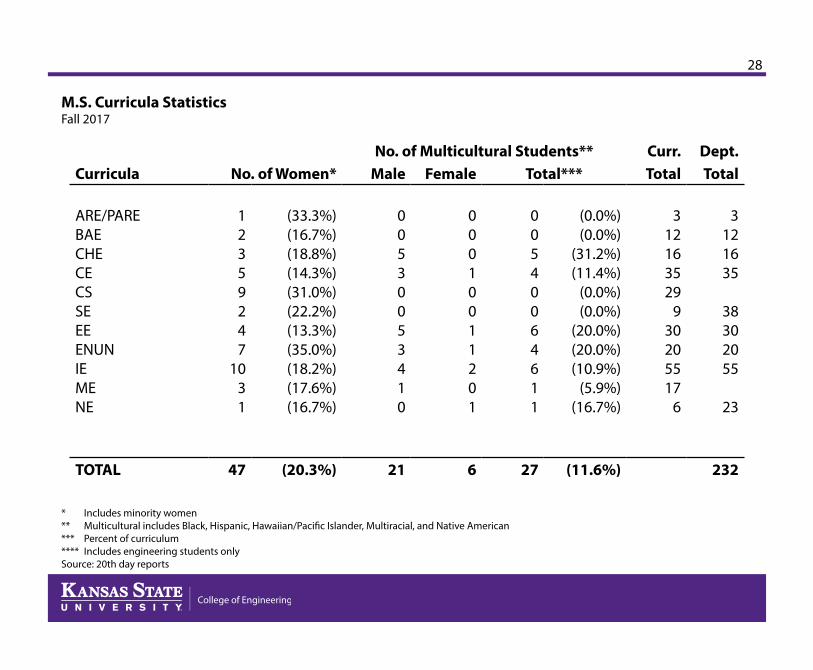
M.S. Curricula StatisticsFall 2017
No. of Multicultural Students** Curr. Dept.Curricula No. of Women* Male Female Total*** Total Total
ARE/PAREBAECHECECSSEEEENUNIEMENE
12359247
1031
(33.3%)(16.7%)(18.8%)(14.3%) (31.0%) (22.2%) (13.3%) (35.0%) (18.2%) (17.6%) (16.7%)
00530053410
0 0 0 1 0 0 1 1 2 0 1
0 0 5 4 0 0 6 4 6 1 1
(0.0%) (0.0%)
(31.2%) (11.4%)
(0.0%) (0.0%)
(20.0%) (20.0%) (10.9%)
(5.9%) (16.7%)
312163529
930205517
6
3 12 16 35
38 30 20 55
23
TOTAL 47 (20.3%) 21 6 27 (11.6%) 232
* Includes minority women** Multicultural includes Black, Hispanic, Hawaiian/Pacific Islander, Multiracial, and Native American*** Percent of curriculum**** Includes engineering students onlySource: 20th day reports

29
®
Ph.D. Curricula StatisticsFall 2017
No. of Multicultural Students** Curr. Dept.Curricula No. of Women* Male Female Total*** Total Total
BAECHECECSEEIEMENE
9 89
1011
673
(45.0%)(36.4%) (27.3%) (23.3%) (31.4%) (35.3%)(21.9%)
(7.6%)
1 0 0 2 0 0 0 3
10000000
2 0 0 2 0 0 0 3
(10.0%)
(0.0%) (0.0%) (4.7%) (0.0%) (0.0%) (0.0%)
(17.6%)
20 22334335173217
20 2233433517
49
TOTAL 63 (28.8%) 6 1 7 (3.2%) 219
* Includes minority women** Multicultural includes Black, Hispanic, Hawaiian/Pacific Islander, Multiracial, and Native American*** Percent of curriculumSource: 20th day reports

30
®
0
500
1000
1500
2000
2500
3000
3500
2008 2009 2010 2011 2012 2013 2014 2015 2016 2017
Num
ber
of S
tude
nts
Fall Semester
Men
Women
Source: 20th day reports
Undergraduate Enrollment Composition of Men and Women
31
®
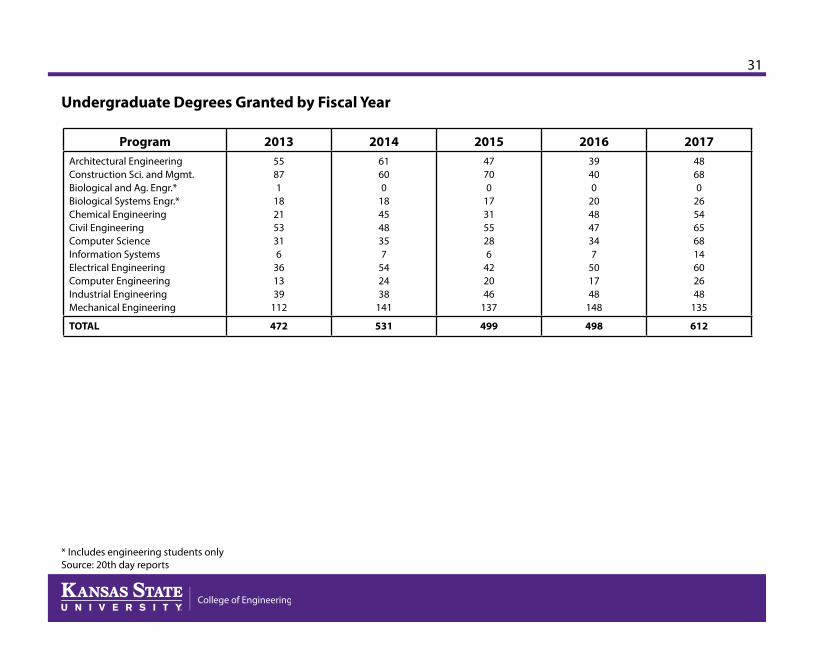
Undergraduate Degrees Granted by Fiscal Year
Program 2013 2014 2015 2016 2017 Architectural EngineeringConstruction Sci. and Mgmt.Biological and Ag. Engr.*Biological Systems Engr.*Chemical EngineeringCivil EngineeringComputer ScienceInformation SystemsElectrical EngineeringComputer EngineeringIndustrial EngineeringMechanical Engineering
55871
182153316
361339
112
61600
184548357
542438
141
47700
173155286
422046
137
39400
204847347
501748
148
48680
2654656814602648
135
TOTAL 472 531 499 498 612
* Includes engineering students onlySource: 20th day reports
32
®
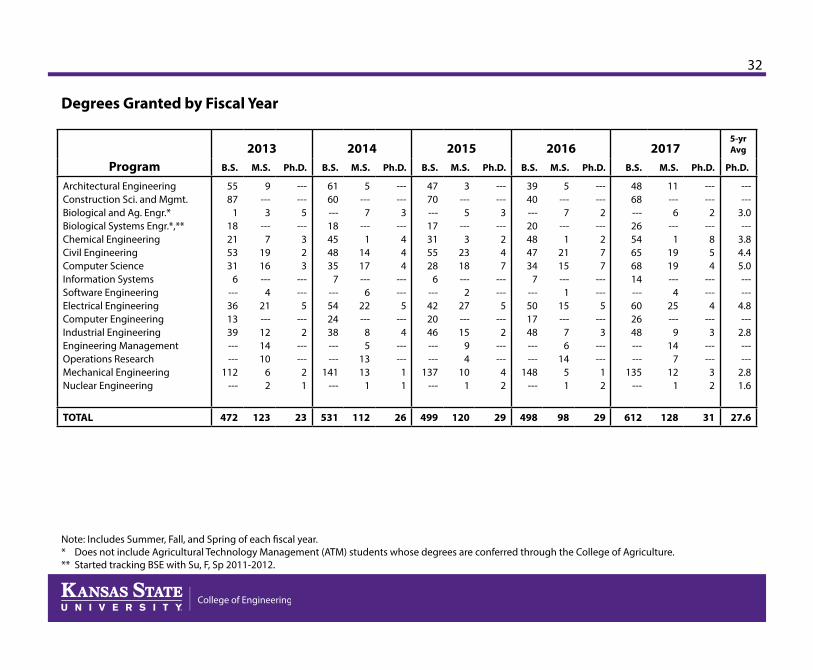
Degrees Granted by Fiscal Year
Program2013 2014 2015 2016 2017
5-yrAvg
B.S. M.S. Ph.D. B.S. M.S. Ph.D. B.S. M.S. Ph.D. B.S. M.S. Ph.D. B.S. M.S. Ph.D. Ph.D.
Architectural EngineeringConstruction Sci. and Mgmt.Biological and Ag. Engr.*Biological Systems Engr.*,**Chemical EngineeringCivil EngineeringComputer ScienceInformation SystemsSoftware EngineeringElectrical EngineeringComputer EngineeringIndustrial EngineeringEngineering ManagementOperations ResearchMechanical EngineeringNuclear Engineering
5587
118215331
6---361339------
112---
9---3
---7
1916---4
21---121410
62
------5
---323
------5
---2
------21
6160---18454835
7---542438------
141---
5---7
---1
1417---6
22---85
1313
1
------3
---444
------5
---4
------11
4770---17315528
6---422046------
137---
3---5
---3
2318---2
27---15
94
101
------3
---247
------5
---2
------42
39 40 --- 20 48 47 34
7 --- 50 17 48 --- ---
148 ---
5 --- 7
--- 1
21 15 --- 1
15 --- 7 6
14 5 1
--- --- 2
--- 2 7 7
--- --- 5
--- 3
--- --- 1 2
48 68 --- 26 54 65 68 14 --- 60 26 48 --- ---
135 ---
11 --- 6
--- 1
19 19 --- 4
25 --- 9
14 7
12 1
--- --- 2
--- 854
--- --- 4
--- 3
--- --- 3 2
------
3.0---
3.84.45.0------
4.8---
2.8------
2.81.6
TOTAL 472 123 23 531 112 26 499 120 29 498 98 29 612 128 31 27.6
Note: Includes Summer, Fall, and Spring of each fiscal year.* Does not include Agricultural Technology Management (ATM) students whose degrees are conferred through the College of Agriculture.** Started tracking BSE with Su, F, Sp 2011-2012.

33
®
College of Engineering Degrees Granted
0
100
200
300
400
500
600
700
2012 2013 2014 2015 2016 2017
Num
ber
of S
tud
ents
Fiscal Year
B.S.
M.S.
Ph.D.
34
®
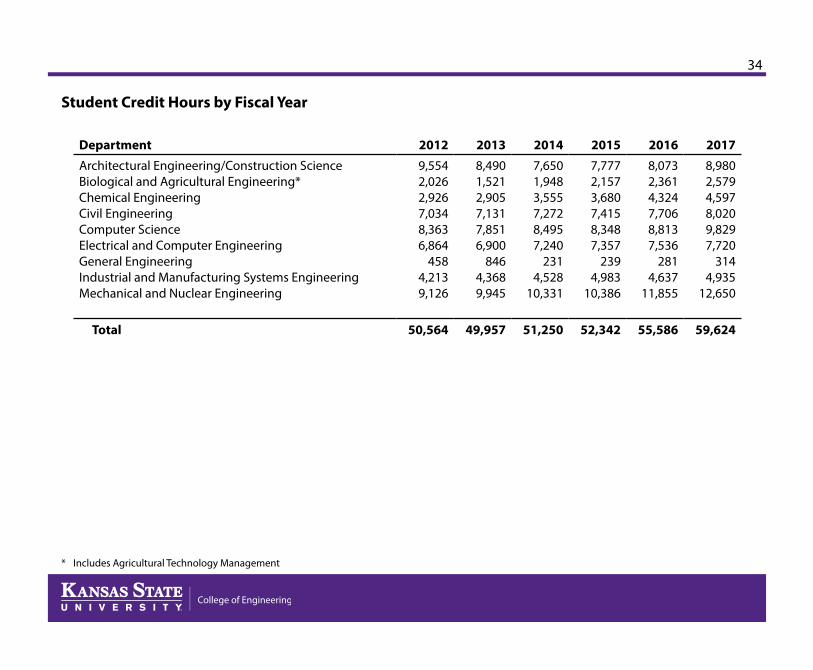
Student Credit Hours by Fiscal Year
Department 2012 2013 2014 2015 2016 2017
Architectural Engineering/Construction ScienceBiological and Agricultural Engineering*Chemical EngineeringCivil EngineeringComputer ScienceElectrical and Computer EngineeringGeneral EngineeringIndustrial and Manufacturing Systems EngineeringMechanical and Nuclear Engineering
9,5542,0262,9267,0348,3636,864
4584,2139,126
8,4901,5212,9057,1317,8516,900
8464,3689,945
7,6501,9483,5557,2728,4957,240
2314,528
10,331
7,7772,1573,6807,4158,3487,357
2394,983
10,386
8,073 2,361 4,324 7,706 8,813 7,536
281 4,637
11,855
8,9802,5794,5978,0209,8297,720
3144,935
12,650
Total 50,564 49,957 51,250 52,342 55,586 59,624
* Includes Agricultural Technology Management
35
®
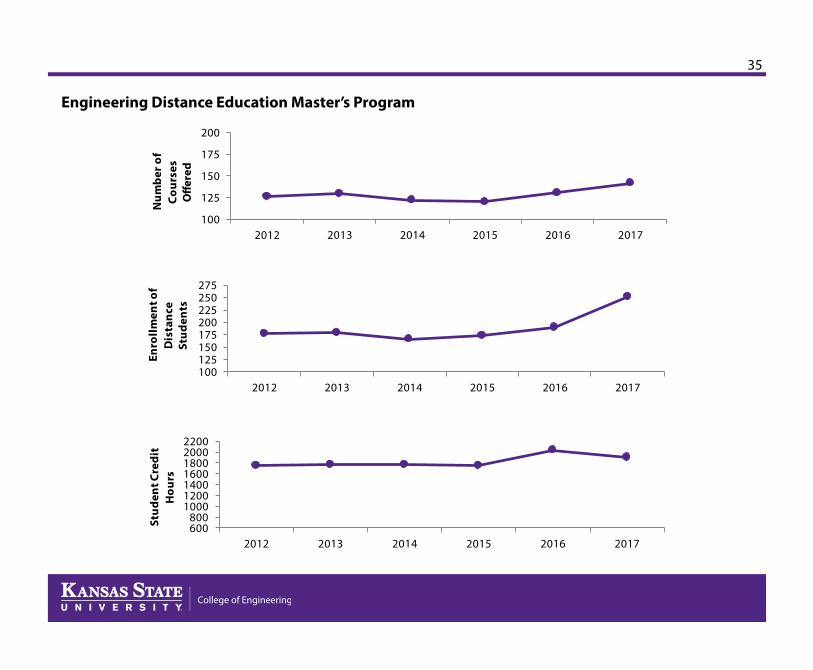
Engineering Distance Education Master’s Program
100
125
150
175
200
2012 2013 2014 2015 2016 2017
Num
ber o
f Co
urse
sO
ffere
d
100125150175200225250275
2012 2013 2014 2015 2016 2017
Enro
llmen
t of
Dis
tanc
e St
uden
ts
600800
1000120014001600180020002200
2012 2013 2014 2015 2016 2017
Stud
ent C
redi
t H
ours
36
®
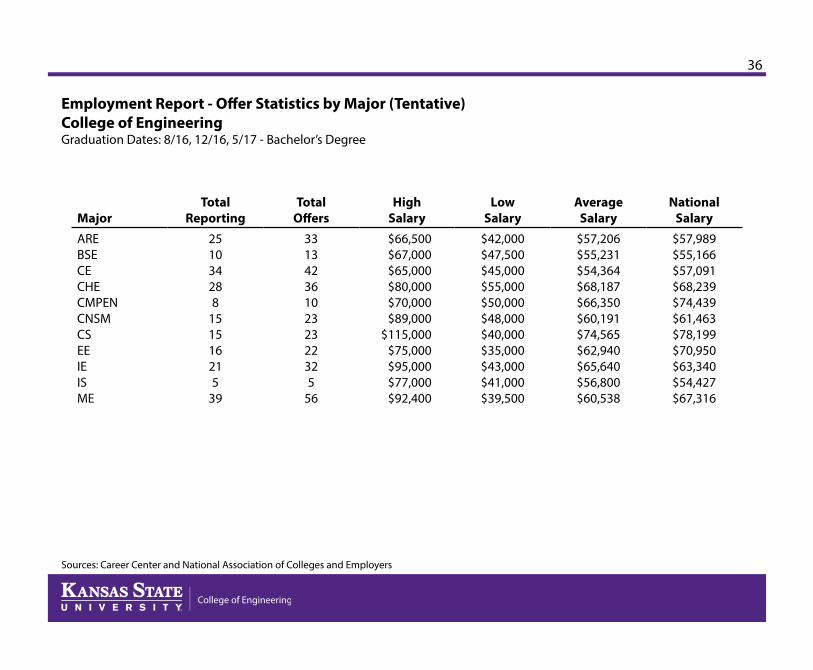
Employment Report - Offer Statistics by Major (Tentative)College of EngineeringGraduation Dates: 8/16, 12/16, 5/17 - Bachelor’s Degree
Sources: Career Center and National Association of Colleges and Employers
MajorTotal
ReportingTotal
OffersHigh
SalaryLow
SalaryAverage
SalaryNational
Salary
AREBSECECHECMPENCNSMCSEEIEISME
251034288
151516215
39
3313423610232322325
56
$66,500 $67,000 $65,000 $80,000 $70,000 $89,000
$115,000 $75,000 $95,000 $77,000 $92,400
$42,000 $47,500 $45,000 $55,000 $50,000 $48,000 $40,000 $35,000 $43,000 $41,000 $39,500
$57,206 $55,231 $54,364 $68,187 $66,350 $60,191 $74,565 $62,940 $65,640 $56,800 $60,538
$57,989 $55,166 $57,091 $68,239 $74,439 $61,463 $78,199 $70,950 $63,340 $54,427 $67,316
37
®
0
500
1000
1500
2000
2500
3000
3500
4000
4500
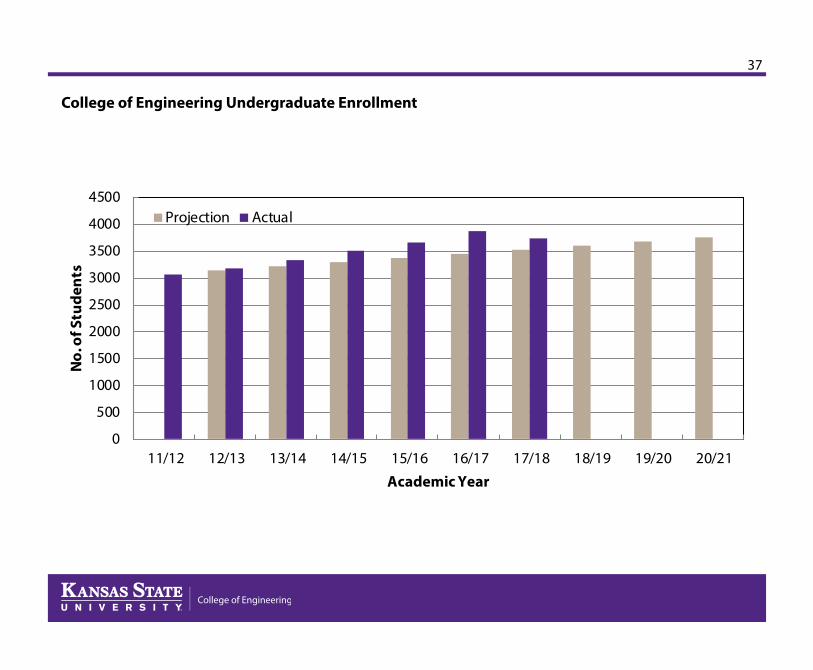
11/12 12/13 13/14 14/15 15/16 16/17 17/18 18/19 19/20 20/21
No.
of S
tude
nts
Academic Year
Projection Actual
College of Engineering Undergraduate Enrollment
38
®
0
100
200
300
400
500
600
700
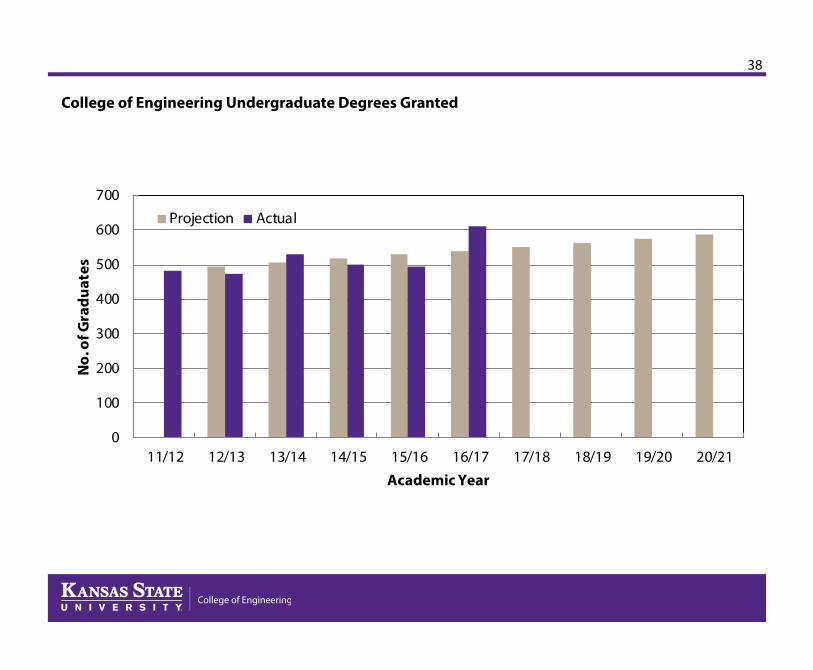
11/12 12/13 13/14 14/15 15/16 16/17 17/18 18/19 19/20 20/21
No.
of G
radu
ates
Academic Year
Projection Actual
College of Engineering Undergraduate Degrees Granted

Research
39
®
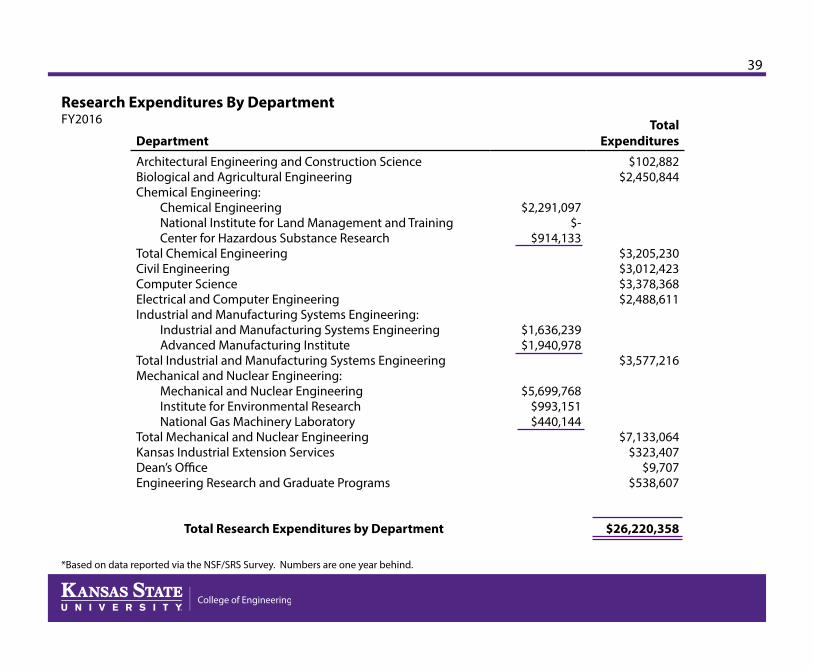
Research Expenditures By DepartmentFY2016
*Based on data reported via the NSF/SRS Survey. Numbers are one year behind.
DepartmentTotal
Expenditures
Architectural Engineering and Construction ScienceBiological and Agricultural EngineeringChemical Engineering:
Chemical EngineeringNational Institute for Land Management and TrainingCenter for Hazardous Substance Research
Total Chemical EngineeringCivil EngineeringComputer ScienceElectrical and Computer EngineeringIndustrial and Manufacturing Systems Engineering:
Industrial and Manufacturing Systems EngineeringAdvanced Manufacturing Institute
Total Industrial and Manufacturing Systems EngineeringMechanical and Nuclear Engineering:
Mechanical and Nuclear EngineeringInstitute for Environmental ResearchNational Gas Machinery Laboratory
Total Mechanical and Nuclear EngineeringKansas Industrial Extension ServicesDean’s OfficeEngineering Research and Graduate Programs
Total Research Expenditures by Department
$2,291,097$-
$914,133
$1,636,239$1,940,978
$5,699,768$993,151$440,144
$102,882$2,450,844
$3,205,230$3,012,423$3,378,368$2,488,611
$3,577,216
$7,133,064$323,407
$9,707$538,607
$26,220,358
40
®
0.0
5.0
10.0
15.0
20.0
25.0
30.0
2006 2007 2008 2009 2010 2011 2012 2013 2014 2015 2016
In M
illio
ns
Fiscal Year
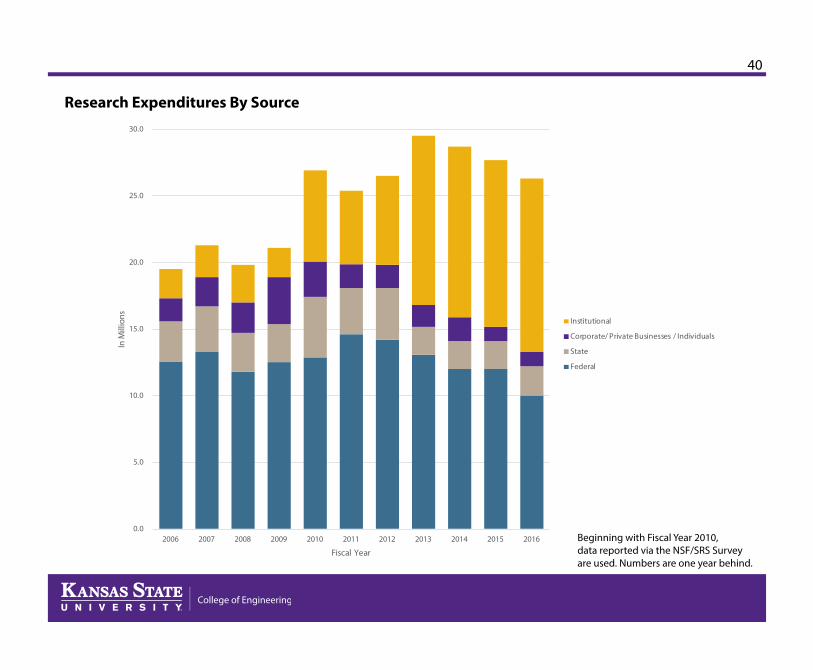
Institutional
Corporate/ Private Businesses / Individuals
State
Federal
Research Expenditures By Source
Beginning with Fiscal Year 2010, data reported via the NSF/SRS Survey are used. Numbers are one year behind.

Finances
41
®
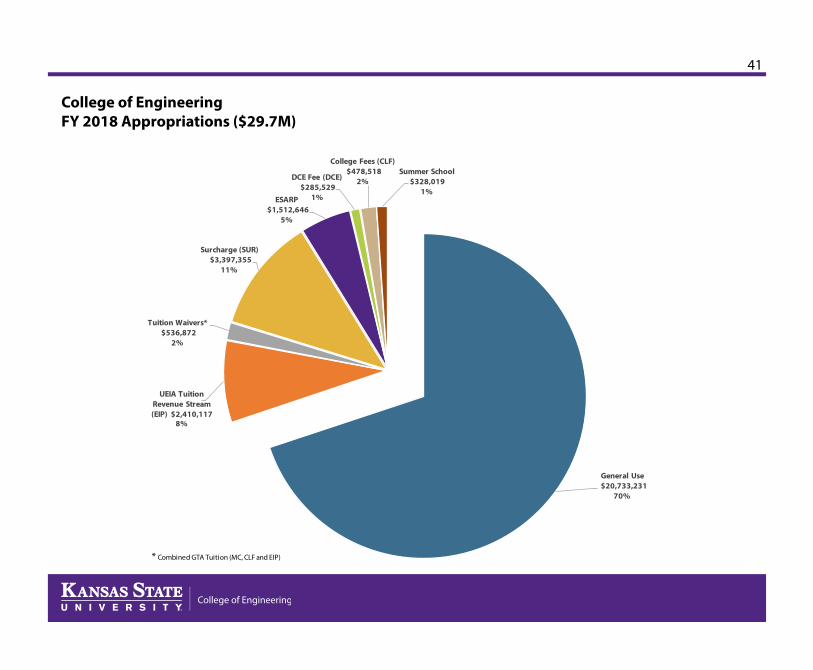
College of Engineering FY 2018 Appropriations ($29.7M)
General Use$20,733,231
70%
UEIA Tuition Revenue Stream (EIP) $2,410,117
8%
Tuition Waivers*$536,872
2%
Surcharge (SUR)$3,397,355
11%
ESARP$1,512,646
5%
DCE Fee (DCE)$285,529
1%
College Fees (CLF)$478,518
2%Summer School
$328,019 1%
* Combined GTA Tuition (MC, CLF and EIP)

42
®
Graduate Tuition$536,872
2% OOE$1,709,641
6%
Salaries$27,435,774
92%
College of EngineeringFY 2018 Percentage of Allocated Budget for Salaries and Operating ($29.7M)
43
®
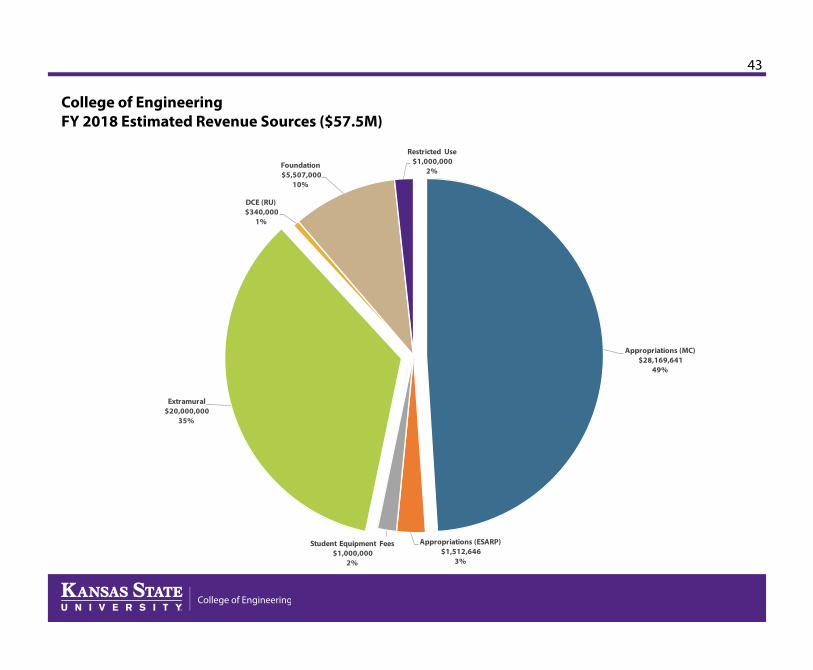
College of EngineeringFY 2018 Estimated Revenue Sources ($57.5M)
Appropriations (MC)$28,169,641
49%
Appropriations (ESARP)$1,512,646
3%
Student Equipment Fees$1,000,000
2%
Extramural$20,000,000
35%
DCE (RU)$340,000
1%
Foundation$5,507,000
10%
Restricted Use$1,000,000
2%

44
®
College of EngineeringFY 2018 Estimated Expenditures by Category ($57.5M)
Capital Improvements
$1,000,000 2%
Scholarships$2,750,000
5% Fundraising Personnel$707,000
1%
Chairs & Professorships$600,000
1%
Extramural$20,000,000
35%
Salaries$27,435,774
48%
OOE$2,500,000
4%
Graduate Tuition$536,872
1%
Student Equipment$1,000,000
2%
Restricted Use$1,000,000
2%
45
®
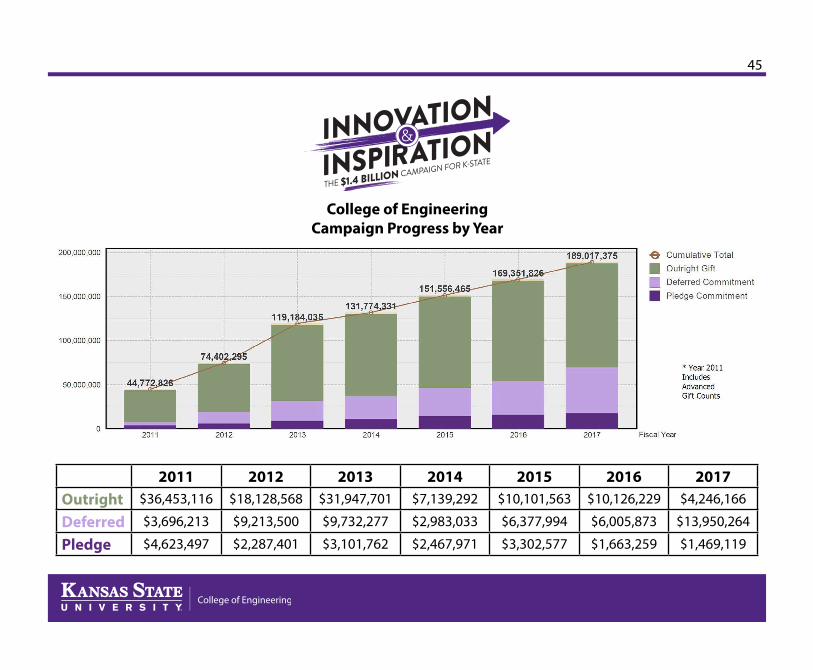
College of EngineeringCampaign Progress by Year
2011 2012 2013 2014 2015 2016 2017Outright $36,453,116 $18,128,568 $31,947,701 $7,139,292 $10,101,563 $10,126,229 $4,246,166
Deferred $3,696,213 $9,213,500 $9,732,277 $2,983,033 $6,377,994 $6,005,873 $13,950,264
Pledge $4,623,497 $2,287,401 $3,101,762 $2,467,971 $3,302,577 $1,663,259 $1,469,119
46
®
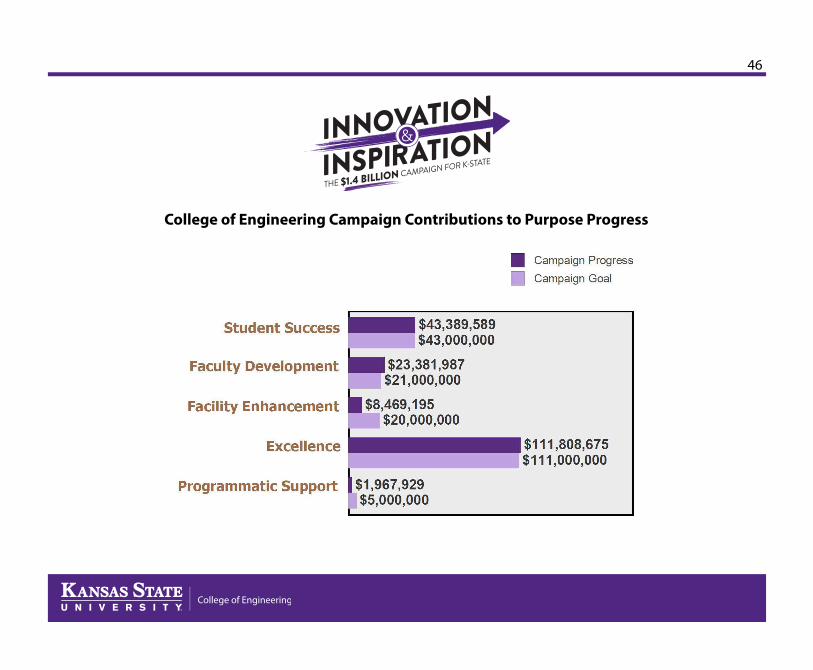
College of Engineering Campaign Contributions to Purpose Progress

47
®
Living Alumni
Totals:KansasU.S. (excluding KS)U.S. TerritoriesInternationalArmed ForcesGrand Total
9,53714,220
19961
2124,758
23 25
449
154
1419
99
37
6630
641196
524211
18
27
353
9537
585
2311
205
124
303
1494
142
74
564
231
161265
54
175
29 103 236
480
130
278
41710
218
206
14
1241142 9 - RI
58 - CT
210 - NJ
205 - MD11 - DC
28 - DE

Alumni

48
®
Living Alumni by Country
Country Total Country Total Country Total Country Total
AfghanistanArgentinaAustraliaAustriaBahamasBahrainBangladeshBelgiumBoliviaBosnia-HerzegovinaBotswanaBrazilBrunei DarussalamCanadaChinaColumbiaCosta RicaCote D’IvoireCroatiaCyprusCzech RepublicDenmark
42
102131361161
4980
925
11641
Ecuador EgyptEngland - see UK
EthiopiaFranceGermanyGhanaGreeceHaitiHondurasHong KongIcelandIndiaIndonesiaIran (Islamic Republic of )
IraqIrelandIsraelJapanJordanKenyaKorea, Republic of
217
41614
2312
101
1271224
622
1715
137
Kuwait LebanonLesothoLibyan Arab JamahiriyaMalaysiaMaliMexicoNepalNew ZealandNicaraguaNigeriaNorwayOmanPakistanPanamaParaguayPeruPhilippinesQatarRussian FederationSaudi ArabiaSingapore
35 613
3528113
2421
22582552
5313
SloveniaSouth AfricaSouth Korea - see Korea
SpainSri LankaSudanSwazilandSwedenSwitzerlandSyrian Arab RepublicTaiwanTanzania, United Republic of
ThailandTunisiaTurkeyUkraineUnited Arab EmiratesUnited Kingdom (UK)United States & TerritoriesVenezuelaVietnamYemen
17
7621162
664
221
121
1126
23,797916
Total Engineering 24,758
Source: Alumni Association
49
®
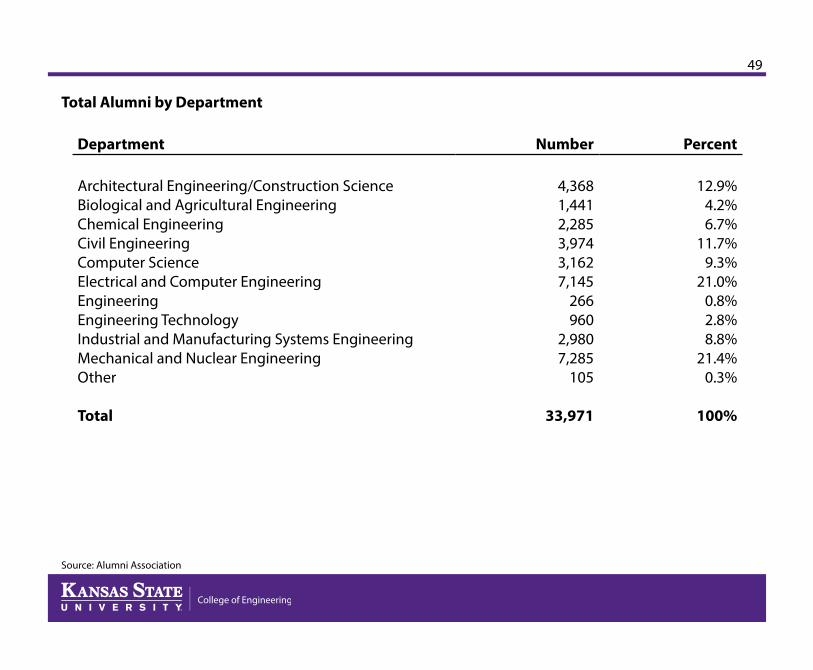
Total Alumni by Department
Department Number Percent
Architectural Engineering/Construction ScienceBiological and Agricultural EngineeringChemical EngineeringCivil EngineeringComputer ScienceElectrical and Computer EngineeringEngineeringEngineering TechnologyIndustrial and Manufacturing Systems EngineeringMechanical and Nuclear EngineeringOther
Total
4,3681,4412,2853,9743,1627,145
266960
2,9807,285
105
33,971
12.9%4.2%6.7%
11.7%9.3%
21.0%0.8%2.8%8.8%
21.4%0.3%
100%
Source: Alumni Association
Kansas State University prohibits discrimination on the basis of race, color, ethnicity, national origin, sex (including sexual harassment and sexual violence), sexual orientation, gender identity, religion, age, ancestry, disability, genetic information, military status, or veteran status, in the university’s programs and activities as required by applicable laws and regulations. The person designated with responsibility for coordination of compliance efforts and receipt of inquiries concerning the nondiscrimination policy is the university’s Title IX Coordinator: the Director of the Office of Institutional Equity, [email protected], 103 Edwards Hall, 1810 Kerr Drive, Kansas State University, Manhattan, Kansas 66506-4801. Telephone: 785-532-6220 | TTY or TRS: 711. The campus ADA Coordinator is the Director of Employee Relations and Engagement, who may be reached at [email protected] or 103 Edwards Hall, 1810 Kerr Drive, Kansas State University, Manhattan, Kansas 66506-4801, 785-532-6277 and TTY or TRS 711.Revised Aug. 29, 2017.