Embed Size (px)
Citation preview

Questions about college affordability
• Does the price of college keep some students from attending?
• What are the impacts of increasing levels of student debt?
• What do we know about different strategies for providing financial aid?
• Can we reach attainment goals without increasing enrollment?

Does the price of college keep some students from attending?
• Does increasing tuition result in a drop in
enrollment? • Does increasing financial aid result in an
increase in enrollment? • Do different groups respond differently to
changes in price? • Does it make a difference what type of grant
aid is used?

Trends in College Pricing 2014 For detailed data, visit: trends.collegeboard.org.
Inflation-Adjusted Published Tuition and Fees Relative to 1984-85, 1984-85 to 2014-15
(1984-85 = 1.0)
SOURCE: The College Board, Trends in College Pricing 2014, Figure 6

Trends in College Pricing 2014 For detailed data, visit: trends.collegeboard.org.
Average Tuition and Fees and Room and Board in 2014 Dollars, 1974-75 to 2014-15, Selected Years
SOURCE: The College Board, Trends in College Pricing 2014, Table 2A

Does increasing tuition result in a drop in enrollment?

Historical Studies
• Leslie and Brinkman, 1987: a $1,000 increase in tuition is associated with 3 percent drop in enrollment among 18-24 year olds (2014 dollars)
• Heller, 1997: a $1000 increase in tuition is associated with a 3.4 percent drop in enrollment among 18-24 year olds (2014 dollars)

Recent Research
• Hemelt, 2011: a $1,000 increase is associated with a decline in enrollment of 2.5%. – Larger impacts at public research universities – Smaller to no impact at open access, less selective
institutions

Does increasing grant aid result in an increase in enrollment?

Experimental/Quasi Experimental Evidence
• Dynarski, 2003: Elimination of Social Security Benefits for College Attendance
“In summary … estimates that do and do not account for unobservable differences across individuals reach similar conclusions: a $1,000 drop in schooling costs increases college attendance by 3 to 4 percent-age points”

Dynarski: Change in Social Security Benefits

Dynarski: Before and After Social Security Benefits for College Dropped

Kane, 2007: DC Tuition Assistance Grant
Do different groups respond differently to changes in price?

Kane, 1994: Impact of $1,000 increase in net price on enrollment by income

Does it matter if need-based aid is used or merit-based aid?
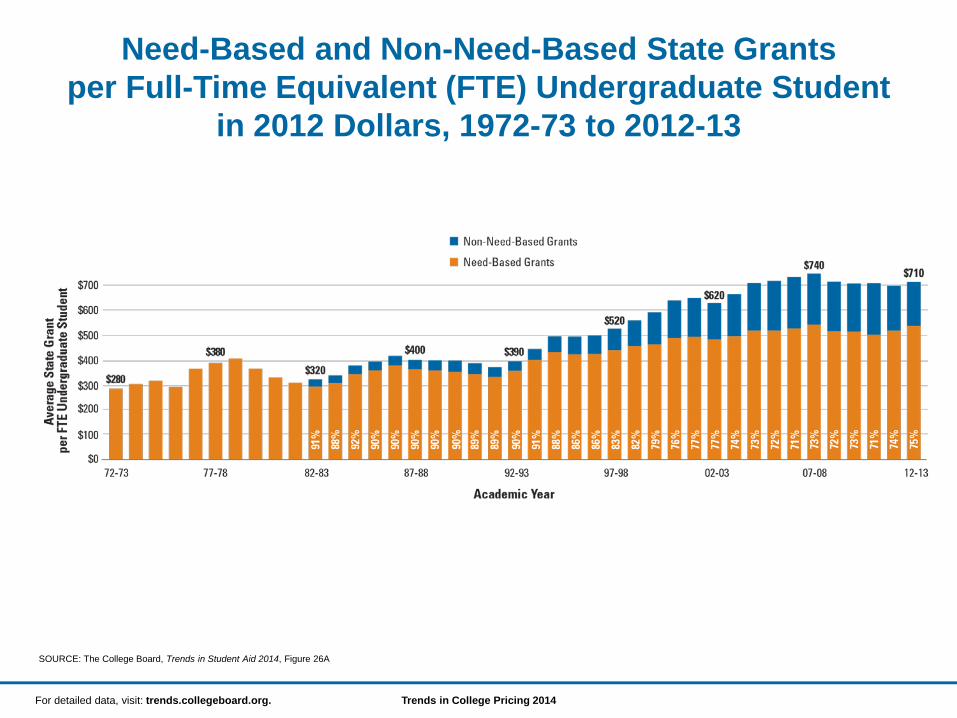
Trends in College Pricing 2014 For detailed data, visit: trends.collegeboard.org.
Need-Based and Non-Need-Based State Grants per Full-Time Equivalent (FTE) Undergraduate Student
in 2012 Dollars, 1972-73 to 2012-13
SOURCE: The College Board, Trends in Student Aid 2014, Figure 26A

State Grant Amount by Income
Note: Amounts are for full-time, dependent students attending public four-year Carnegie master’s institutions. Source: National Postsecondary Student Aid Survey, 2011
18

Castleman and Long, 2013: Florida Student Assistance Program

Kane, 2003: Cal Grant Program

Dynarski, 2000: HOPE Scholarship
“The results suggest that each $1,000 in aid ($1998) increased the college attendance rate in Georgia by 3.7 to 4.2 percentage points”

Dynarski, 2000: Impact of HOPE

Dynarski, 2000: Georgia HOPE
“In Georgia, higher-income youth increased their attendance relative to lower-income youth by 12.7 percentage points more than they did in the other Southeastern states” “Roughly, then, about 80 percent of HOPE funds flow to those who would have gone to college in the absence of the subsidy.”

What are the impacts of increasing levels of student debt?
• Does debt deter students from enrolling? • Does debt change major choice? • Does debt change career choices? • The nexus between prices, debt, working and
college attendance.

Trends in College Pricing 2014 For detailed data, visit: trends.collegeboard.org.
Total Outstanding Student Debt, Number of Borrowers with Outstanding Student Debt, and Average Balance,
Relative to 2004
SOURCE: The College Board, Trends in Student Aid 2014, Figure 18B

Does debt deter students from enrolling?
• Johnson 2013: “A tuition subsidy equal in
dollar terms to the loan limit increase is much more effective at increasing enrollment and degree completion. The tuition subsidy causes a large increase in enrollment at 4-year colleges and a small increase in enrollment at 2-year colleges.”

Does debt affect major choice?
• Rothstein and Rouse, 2011 “Debt appears to have small effects on the choice of major, at most inducing a small shift toward majors that might be seen as oriented toward employment and away from “consumption”-type majors, and zero or small negative effects on academic performance.”

Does debt change career choices?
Rothstein and Rouse, 2011 “Overall, it appears that college debt affects post-graduation employment decisions: students with more debt are less likely to accept jobs in low-paying industries and accept higher-paying jobs more generally.”

Bound, Lovenheim, Turner The nexus between prices, debt, working and college
attendance

The nexus between prices, debt, working and college attendance
DesJardins et al, 2010: “The significant effect of the GMS scholarship on students’ working hours while in college suggests that the scholarship may alleviate borrowing constraints faced by these low-income, high-ability minority students and thus reduces the need for working to finance their college expenses.”

The nexus between prices, debt, working and college attendance
Stinebrickner and Stinebrickner, 2003: “We find that an additional hour of work has a large and statistically negative impact on grades. More specifically, increasing the amount that a person works by 1 hour per week lowers the person’s semester grade point average by .162.”

Bound, Lovenheim, Turner, 2012: “Under plausible and conservative assumptions, higher student labor supply can explain a large proportion of the observed mean time to degree increase in our data.”
The nexus between prices, debt, working and college attendance
What do we know about different strategies for providing aid?
• What are the implications of a low tuition strategy? What are the implications of a high-tuition, high-aid strategy?
• What are the implications of allowing institutions to set tuition and financial aid policy?

Curs and Singell, 2010: High Tuition, High Aid vs. Low Tuition Low Aid
• High Tuition, high aid is expensive: for institutions to enroll the same number of students, costs expand rapidly
• Low tuition, low aid targets subsidies poorly: low income students can end up paying higher net prices. Overall, a less expensive financing structure from the perspective of the state.

Centralization and Tuition Levels
Nicholson-Crotty and Meier, 2003: “All other things being equal, states with coordinating boards have 40% lower total costs for higher education and their tuition costs per student are 52% lower (both appropriations and scholarships appear unrelated to the distinction between coordinating boards and governing boards). These are substantively large differences that indicate coordinating boards are associated with providing relatively inexpensive education.”

Trends in College Pricing 2014 For detailed data, visit: trends.collegeboard.org.
Institutional Grant Aid by Dependency Status and Family Income at Public Four-Year Institutions, 2011-12
SOURCE: The College Board, Trends in Student Aid 2014, Figure 29A

Institutional Grant Amount by Income
Note: Amounts are for full-time, dependent students attending public four-year Carnegie master’s institutions. Source: National Postsecondary Student Aid Survey, 2011
37

Doyle, 2010: Aid Receipt by SAT Scores

Can attainment goals be reached without increasing access?

Wide Variation in Goals State Target Population Year
Arkansas 4.73% annual at each inst. 25-64 2025
Colorado 66% 25-34 2025
Delaware 60% 25-64 2018
Georgia 60% 25-64 2025
Hawaii 55% 25-64 2025
Idaho 60% 25-34 2020
Illinois 60% 25-64 2025
Indiana 60% 25-64 2025
Kansas 60% 25-64 2020
Kentucky 37% 25-44 2015
Louisiana 42% 25-64 2025
Maryland 55% 25-64 2025
Massachusetts 60% 25-34 2020
State Target Population Year
Mississippi 55% 25-64 2025
Missouri 60% 25-64 2025
Montana 60% 25-64 2025
Nevada 60% 25-64 2020
Ohio 60% 25-64 2025
Oklahoma 67% 25-64 2023
Oregon 80% 25-64 2025
Tennessee 55% 25-64 2025
Utah 66% 25-64 2020
Vermont 60% 25-64 2020
Virginia 55% 25-64 2025
Washington 70% 25-45 2023
Wyoming 50% 25-64 2022

20
30
40
50
60
70
80
2005 2007 2009 2011 2013 2015 2017 2019 2021 2023 2025
Actual
Lumina Goal
Obama Goal
Target by 2020
Target by 2025
Goals Will be Reached in
2054
2037
60% Goal
Progress Toward the Goals

Trends in College Pricing 2014 For detailed data, visit: trends.collegeboard.org.
Percentage Change in Inflation-Adjusted Mean Family Income by Quintile,
1983–1993, 1993–2003, and 2003–2013
SOURCE: The College Board, Trends in College Pricing 2014, Figure 22A

References: Abraham, K. G., & Clark, M. A. (2006). Financial Aid and Students’ College Decisions: Evidence from the District of Columbia Tuition Assistance Grant Program. The Journal of Human Resources, 41(3), 578–610. Avery, C., & Turner, S. (2012). Student Loans: Do College Students Borrow Too Much—Or Not Enough? The Journal of Economic Perspectives, 26(1), 165–192. Baum,, S., Diane, C. E., & Jennifer, M. (2014). Trends in Student Aid 2014. College Board. Bruce, D. J., & Carruthers, C. K. (2014). Jackpot? The impact of lottery scholarships on enrollment in Tennessee. Journal of Urban Economics, 81, 30–44. doi:10.1016/j.jue.2014.01.006 Cadena, B. C., & Keys, B. J. (2012). Can Self-Control Explain Avoiding Free Money? Evidence from Interest-Free Student Loans. Review of Economics and Statistics, 95(4), 1117–1129. doi:10.1162/REST_a_00321 Castleman, B. L., & Long, B. T. (2013). Looking Beyond Enrollment: The Causal Effect of Need-Based Grants on College Access, Persistence, and Graduation (Working Paper No. 19306). National Bureau of Economic Research. Retrieved from http://www.nber.org/papers/w19306 Curs, B. R., & Jr., L. D. S. (2010). Aim High or Go Low? Pricing Strategies and Enrollment Effects When the Net Price Elasticity Varies with Need and Ability. The Journal of Higher Education, 81(4), 515–543. Deming, D., & Dynarski, S. (2009). Into College, Out of Poverty? Policies to Increase the Postsecondary Attainment of the Poor (Working Paper No. 15387). National Bureau of Economic Research. Retrieved from http://www.nber.org/papers/w15387 DesJardins, S. L., McCall, B. P., Ott, M., & Kim, J. (2010). A Quasi-Experimental Investigation of How the Gates Millennium Scholars Program Is Related to College Students’ Time Use and Activities. Educational Evaluation and Policy Analysis, 32(4), 456–475. doi:10.3102/0162373710380739 Doyle, W. R. (2010). Changes in institutional aid, 1992-2003: The evolving role of merit aid. Research in Higher Education, Forthcoming. Dynarski, S. (2000). Hope for Whom? Financial Aid for the Middle Class and Its Impact on College Attendance. National Tax Journal, 53(3), 602–602. Dynarski, S. (2002). The Behavioral and Distributional Implications of Aid for College. The American Economic Review, 92(2), 279–285. Dynarski, S. M. (2003). Does Aid Matter? Measuring the Effect of Student Aid on College Attendance and Completion. The American Economic Review, 93(1), 279–288. Dynarski, S., & Scott-Clayton, J. (2013). Financial Aid Policy: Lessons from Research. The Future of Children, 23(1), 67–91. Goodman, J. (2008). Who merits financial aid?: Massachusetts’ Adams Scholarship. Journal of Public Economics, 92(10–11), 2121–2131. doi:10.1016/j.jpubeco.2008.03.009 Heller, D. E. (1997). Student Price Response in Higher Education: An Update to Leslie and Brinkman. The Journal of Higher Education, 68(6), 624–659. doi:10.2307/2959966 Hemelt, S. W., & Marcotte, D. E. (2011). The Impact of Tuition Increases on Enrollment at Public Colleges and Universities. Educational Evaluation and Policy Analysis, 33(4), 435–457. Johnson, M. T. (2013). Borrowing Constraints, College Enrollment, and Delayed Entry. Journal of Labor Economics, 31(4), 669–725. doi:10.1086/669964 Kane, T. J. (1994). College Entry by Blacks since 1970: The Role of College Costs, Family Background, and the Returns to Education. Journal of Political Economy, 102(5), 878–911. Kane, T. J. (2003). A Quasi-Experimental Estimate of the Impact of Financial Aid on College-Going (Working Paper No. 9703). National Bureau of Economic Research. Retrieved from http://www.nber.org/papers/w9703 Kane, T. J. (2007). Evaluating the Impact of the D.C. Tuition Assistance Grant Program. The Journal of Human Resources, 42(3), 555–582. Leslie, L. L., & Brinkman, P. T. (1987). Student Price Response in Higher Education: The Student Demand Studies. The Journal of Higher Education, 58(2), 181–204. Linsenmeier, D. M., Rosen, H. S., & Rouse, C. E. (2006). Financial aid packages and college enrollment decisions: An econometric case study. Review of Economics and Statistics, 88(1), 126–145. Nicholson-Crotty, J., & Meier, K. J. (2003). Politics, Structure, and Public Policy: The Case of Higher Education. Educational Policy, 17(1), 80–97. Rothstein, J., & Rouse, C. E. (2011). Constrained after college: Student loans and early-career occupational choices. Journal of Public Economics, 95(1-2), 149–163. doi:10.1016/j.jpubeco.2010.09.015 Stinebrickner, R., & Stinebrickner, T. R. (2003). Working during School and Academic Performance. Journal of Labor Economics, 21(2), 473–491. doi:10.1086/jole.2003.21.issue-2 Waddell, G. R., & Singell, L. D. (2011). Do no-loan policies change the matriculation patterns of low-income students? Economics of Education Review, 30(2), 203–214. doi:10.1016/j.econedurev.2010.10.004