Embed Size (px)
Citation preview

Collecting Spatial Model Data Using theGET-MODEL-DATA
ArcView Application
The Get-Model-DataArcView application allows the user to quickly gather sample spatial data that will ultimately be used for spatial modeling. There are five basic steps required for the spatial model. These include:
INTRO: Buttons & Pull-Downs (pp 1-5)I Dependent Data Theme (pp 6-9)II Independent Data Themes (pp 10-24)III Make Data Model Spreadsheet (pp 25-27)IV Spatial Modeling in SPLUS (pp 28-33)V Trend Surface GRID (pp 34-36)
The custom features of the Get GRID Data application along with the native functionality of ArcView allow the user to create the Dependent Sample Data Point theme and create the IndependentData GRID themes required for spatial modeling. These GRID themes may includesimply downloading existing GRID datasuch as DEMs, to creating other GRID themes from existing GRID themes such as slope or landform index, to the creation of GRID themes containing feature density per unit area such as stream or road density.
The six Button functions of Get-Model-Data ArcView Application.
Get GRID Cell Value Into SpreadsheetGet Feature DensityMake Grid Cell PolygonsCreate Landform Index from DEMCreate Random Ids for Sample PointsCreate Points From Polygon Centroids
Get-Model-Data: Users Manual Page 1
Random Point Generator (Continued)GET-MODEL-DATA
ArcView Application
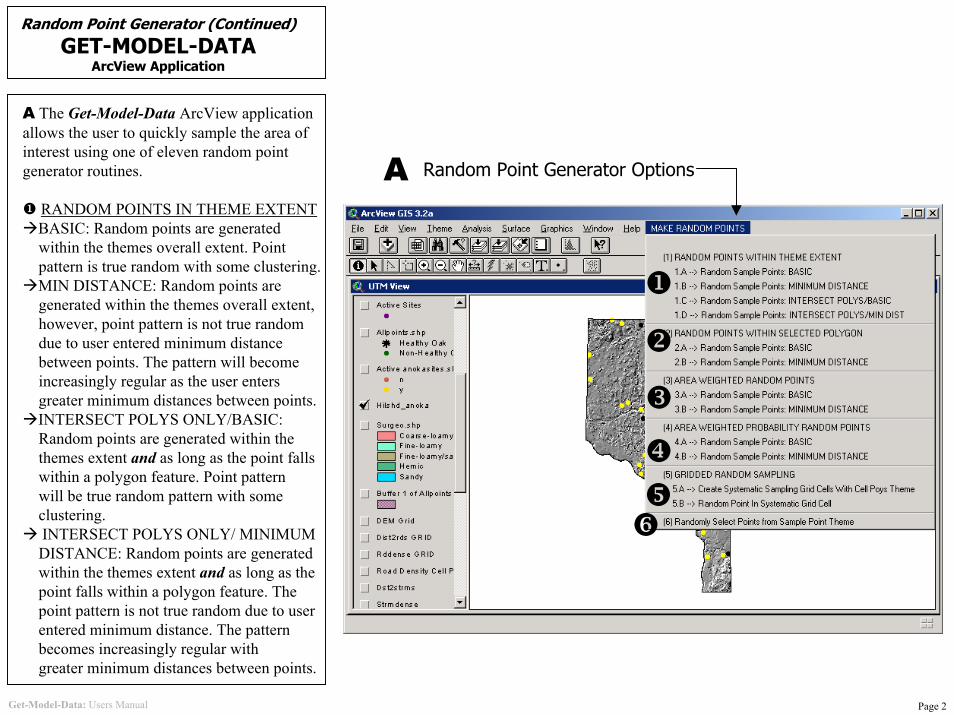
A The Get-Model-Data ArcView application allows the user to quickly sample the area of interest using one of eleven random point generator routines.
RANDOM POINTS IN THEME EXTENTBASIC: Random points are generated within the themes overall extent. Point pattern is true random with some clustering.MIN DISTANCE: Random points are generated within the themes overall extent, however, point pattern is not true random due to user entered minimum distance between points. The pattern will become increasingly regular as the user enters greater minimum distances between points.INTERSECT POLYS ONLY/BASIC: Random points are generated within the themes extent and as long as the point falls within a polygon feature. Point pattern will be true random pattern with some clustering.INTERSECT POLYS ONLY/ MINIMUMDISTANCE: Random points are generated within the themes extent and as long as the point falls within a polygon feature. Thepoint pattern is not true random due to userentered minimum distance. The pattern becomes increasingly regular with greater minimum distances between points.
A Random Point Generator Options
Get-Model-Data: Users Manual Page 2
Random Point Generator (Continued)GET-MODEL-DATA
ArcView Application
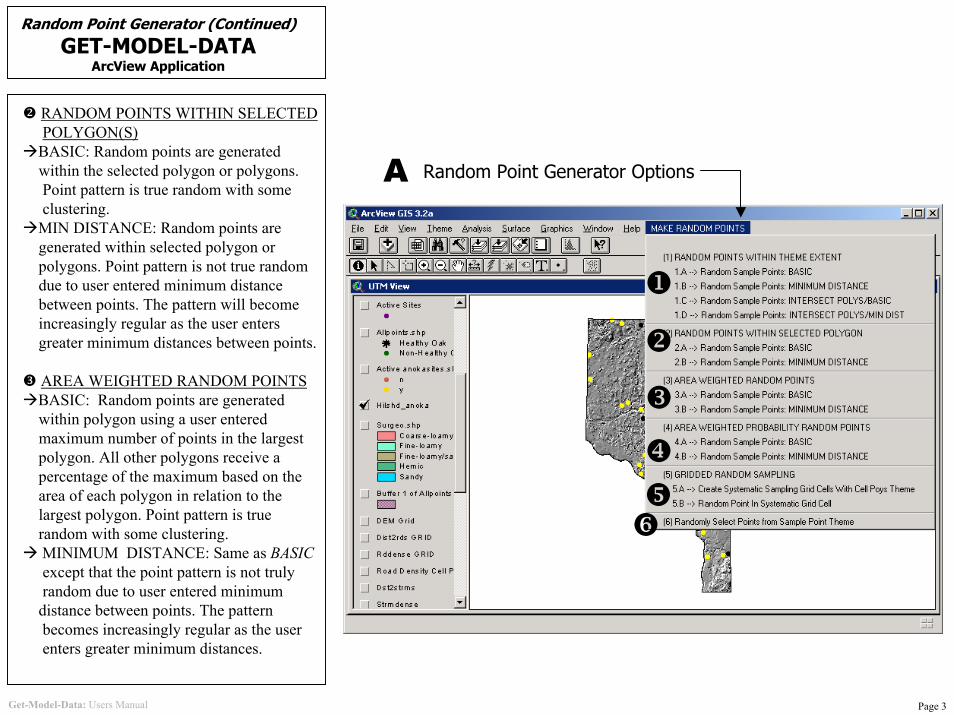
RANDOM POINTS WITHIN SELECTEDPOLYGON(S)
BASIC: Random points are generated within the selected polygon or polygons. Point pattern is true random with some clustering.
MIN DISTANCE: Random points are generated within selected polygon orpolygons. Point pattern is not true random due to user entered minimum distance between points. The pattern will become increasingly regular as the user enters greater minimum distances between points.
AREA WEIGHTED RANDOM POINTSBASIC: Random points are generated within polygon using a user enteredmaximum number of points in the largestpolygon. All other polygons receive apercentage of the maximum based on thearea of each polygon in relation to the largest polygon. Point pattern is true random with some clustering.MINIMUM DISTANCE: Same as BASICexcept that the point pattern is not truly random due to user entered minimum distance between points. The patternbecomes increasingly regular as the user enters greater minimum distances.
A Random Point Generator Options
Get-Model-Data: Users Manual Page 3
Random Point GeneratorGET-MODEL-DATA
ArcView Application
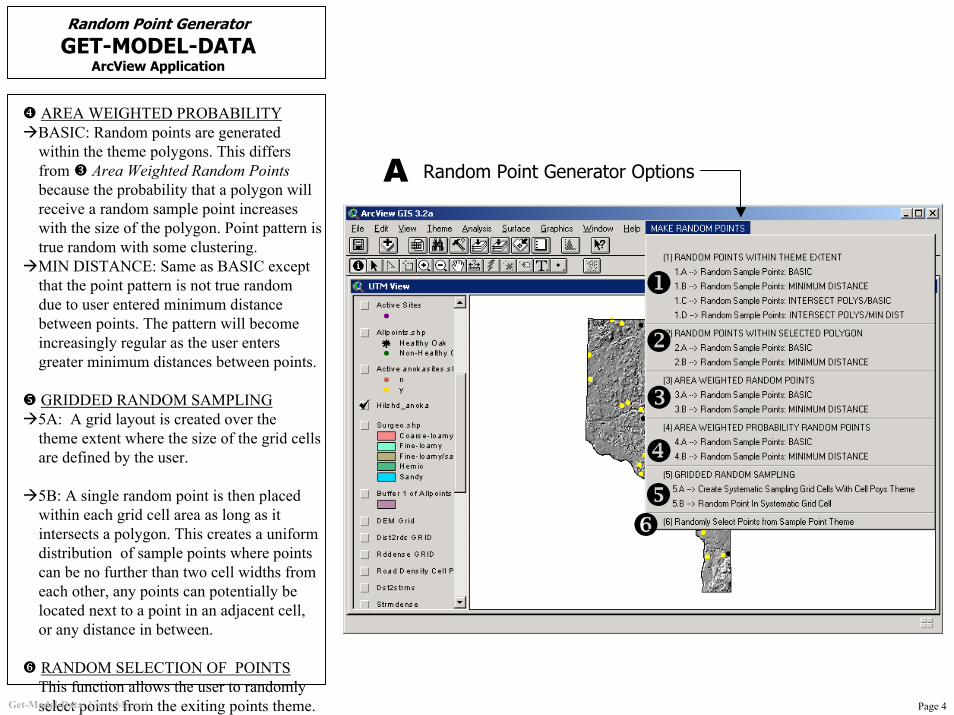
AREA WEIGHTED PROBABILITYBASIC: Random points are generated within the theme polygons. This differsfrom Area Weighted Random Pointsbecause the probability that a polygon willreceive a random sample point increaseswith the size of the polygon. Point pattern is true random with some clustering.MIN DISTANCE: Same as BASIC exceptthat the point pattern is not true random due to user entered minimum distance between points. The pattern will become increasingly regular as the user enters greater minimum distances between points.
GRIDDED RANDOM SAMPLING5A: A grid layout is created over the theme extent where the size of the grid cellsare defined by the user.
5B: A single random point is then placed within each grid cell area as long as it intersects a polygon. This creates a uniform distribution of sample points where points can be no further than two cell widths from each other, any points can potentially be located next to a point in an adjacent cell, or any distance in between.
RANDOM SELECTION OF POINTSThis function allows the user to randomly select points from the exiting points theme.Get-Model-Data: Users Manual
A Random Point Generator Options
Page 4
Random Point GeneratorGET-MODEL-DATA
ArcView Application
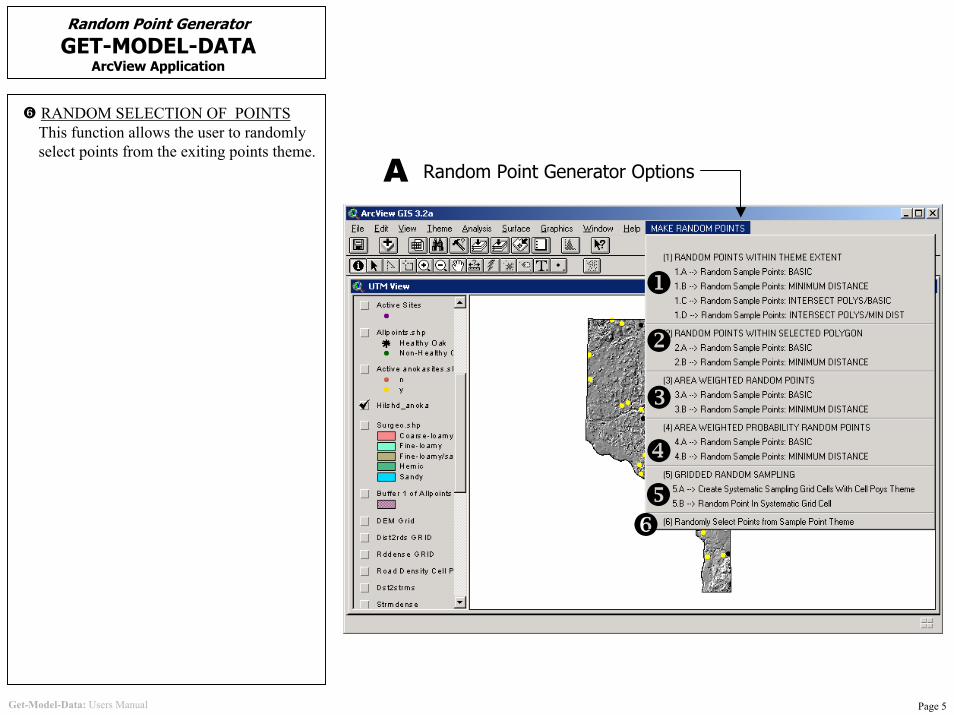
RANDOM SELECTION OF POINTSThis function allows the user to randomly select points from the exiting points theme.
A Random Point Generator Options
Get-Model-Data: Users Manual Page 5
(I)Loading ArcView GeoProcessing
Wizard
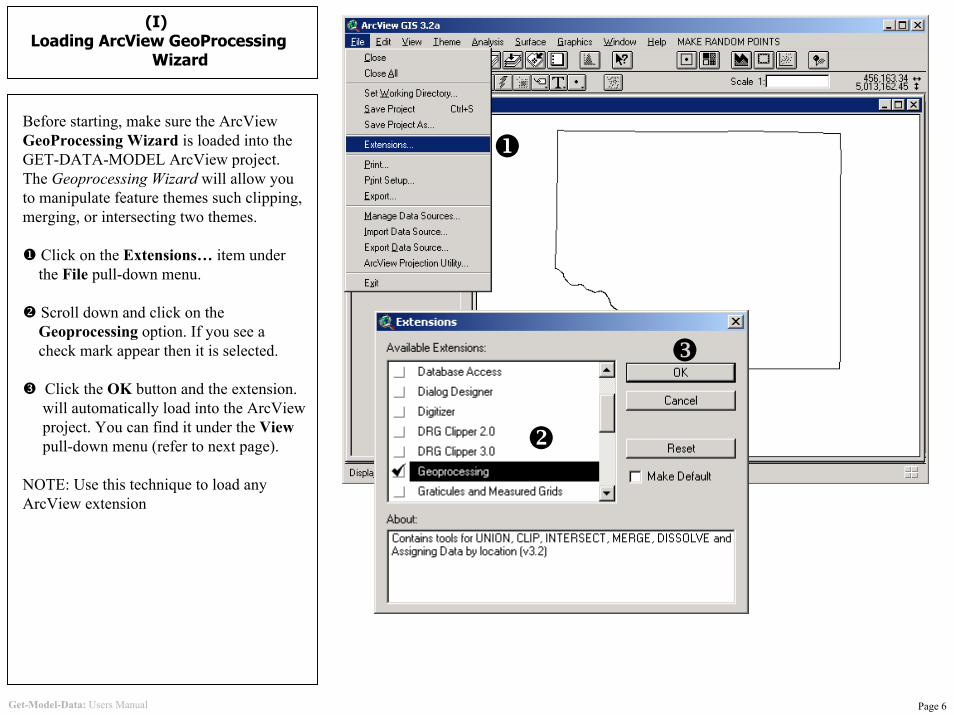
Before starting, make sure the ArcView GeoProcessing Wizard is loaded into the GET-DATA-MODEL ArcView project.The Geoprocessing Wizard will allow youto manipulate feature themes such clipping, merging, or intersecting two themes.
Click on the Extensions… item underthe File pull-down menu.
Scroll down and click on theGeoprocessing option. If you see acheck mark appear then it is selected.
Click the OK button and the extension.will automatically load into the ArcViewproject. You can find it under the Viewpull-down menu (refer to next page).
NOTE: Use this technique to load any ArcView extension
Get-Model-Data: Users Manual Page 6

(I)Create The Dependent Data Theme
The first step requires the creation of a PointTheme that are the sample points. In ourexample, the points were from disparate sources of both healthy oak and “non-healthy” oak. Some of the points were already in a point theme while other point(s)had to be generated using the custom function to make polygon centroid points.
The “healthy” and “non-healthy” pointthemes were then merged together to createa point theme that contains all sample points.Follow the the steps below to merge two ormore point themes:
Click on the GeoProcessing Wizarditem under the View pull-down menu.
Select the Merge themes togetheroption and click the Next>> button.
Select the themes to merge and name thenew merge file in the Output File: box. Click the Finish button to start the themes merge.
ArcView will add the new theme to the view.
Get-Model-Data: Users Manual Page 7
(I)Create The Dependent Data ThemeUsing the Create-Poly-Centroid function
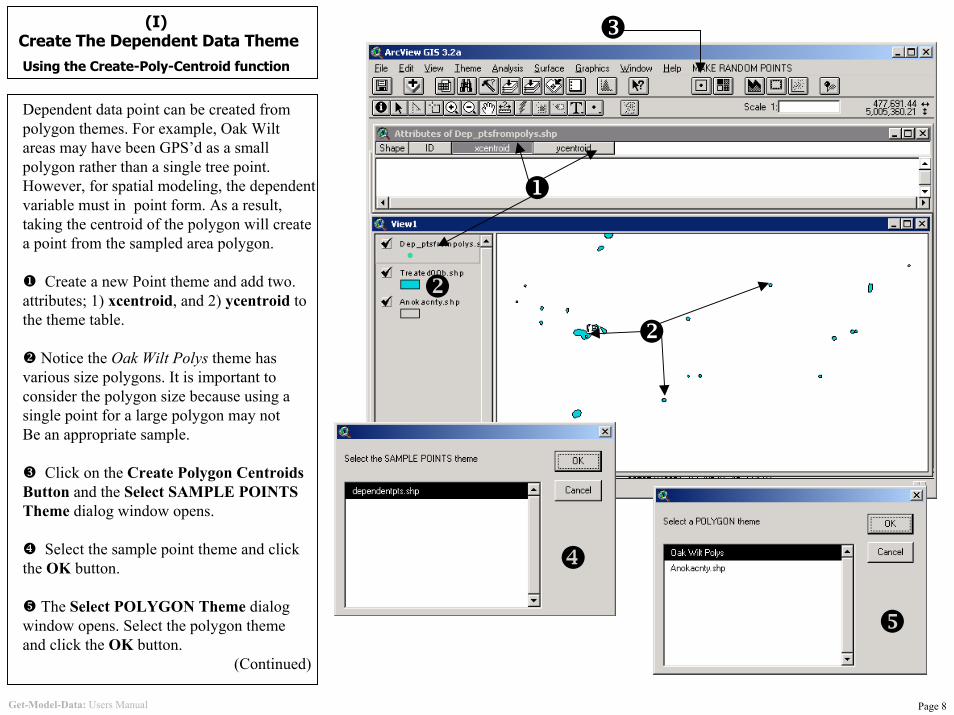
Dependent data point can be created from polygon themes. For example, Oak Wilt areas may have been GPS’d as a small polygon rather than a single tree point. However, for spatial modeling, the dependent variable must in point form. As a result, taking the centroid of the polygon will createa point from the sampled area polygon.
Create a new Point theme and add two.attributes; 1) xcentroid, and 2) ycentroid to the theme table.
Notice the Oak Wilt Polys theme hasvarious size polygons. It is important to consider the polygon size because using asingle point for a large polygon may not Be an appropriate sample.
Click on the Create Polygon CentroidsButton and the Select SAMPLE POINTSTheme dialog window opens.
Select the sample point theme and click the OK button.
The Select POLYGON Theme dialogwindow opens. Select the polygon themeand click the OK button.
(Continued)
Get-Model-Data: Users Manual Page 8
(I)Create The Dependent Data ThemeUsing the Create-Poly-Centroid function
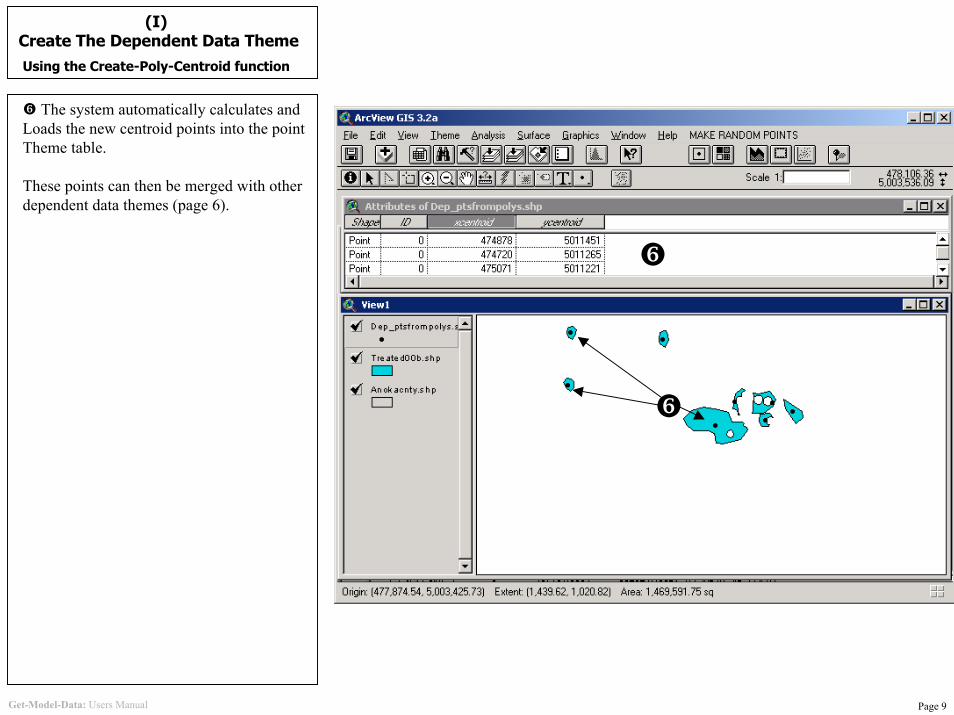
The system automatically calculates and Loads the new centroid points into the pointTheme table.
These points can then be merged with other dependent data themes (page 6).
Get-Model-Data: Users Manual Page 9
(II)Creating Independent Data Themes
Five Methods to Create GRIDS
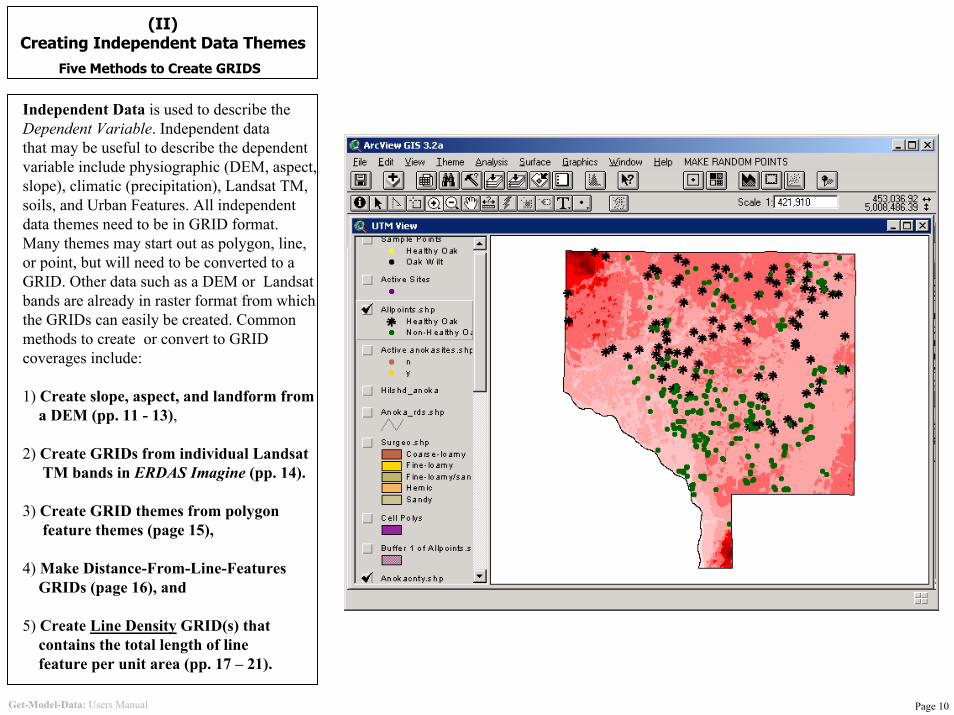
Independent Data is used to describe theDependent Variable. Independent datathat may be useful to describe the dependent variable include physiographic (DEM, aspect,slope), climatic (precipitation), Landsat TM,soils, and Urban Features. All independent data themes need to be in GRID format. Many themes may start out as polygon, line, or point, but will need to be converted to a GRID. Other data such as a DEM or Landsatbands are already in raster format from which the GRIDs can easily be created. Common methods to create or convert to GRID coverages include:
1) Create slope, aspect, and landform froma DEM (pp. 11 - 13),
2) Create GRIDs from individual LandsatTM bands in ERDAS Imagine (pp. 14).
3) Create GRID themes from polygonfeature themes (page 15),
4) Make Distance-From-Line-Features GRIDs (page 16), and
5) Create Line Density GRID(s) that contains the total length of linefeature per unit area (pp. 17 – 21).
Get-Model-Data: Users Manual Page 10

(II)GRID Surfaces Created from a DEM
Creating a SLOPE Grid
ArcView Spatial Analyst extension allows the user to quickly and easily create slopeand aspect GRID surfaces. Look for the Analysis, Surface, and Transform Gridmenu pull-downs. If you cannot see these menus, then the Spatial Analyst extension has not been turned on. Refer to page 2 to load an extension.
Make sure the DEM Grid theme theactive theme in the View’s Theme Table of Contents (TOC). Spatial Analyst willperform a slope analysis on any selected Grid theme.
Click on the Derive Slope item under theSurface menu pull-down.
Spatial Analyst will immediately begin to create the new slope surface. When finishedArcView automatically loads the new Gridin the TOC.
This new Grid is a temporary file and theuser should save the temporary Gridtheme to a permanent file. Select either theConvert to Grid or the Save Data Set itemunder the Theme menu pull-down and savethe new slope Grid to the desired locationwith the desired name.
NOTE - Find DEM data at: http://edcnts14.cr.usgs.gov/Website/seamless.htm
Get-Model-Data: Users Manual Page 11

Make sure the DEM Grid theme theactive theme in the View’s Theme Table of Contents (TOC). Spatial Analyst willperform a slope analysis on any selected Grid theme.
Click on the Derive Aspect item underthe Surface menu pull-down.
Spatial Analyst will immediately begin to create the new aspect surface. When finishedArcView automatically loads the new Gridin the TOC.
This new Grid is a temporary file and theuser should save the temporary Gridtheme to a permanent file. Select either theConvert to Grid or the Save Data Set itemunder the Theme menu pull-down and savethe new slope Grid to the desired locationwith the desired name.
(II)GRID Surfaces Created from a DEM
Creating a ASPECT Grid
Get-Model-Data: Users Manual Page 12
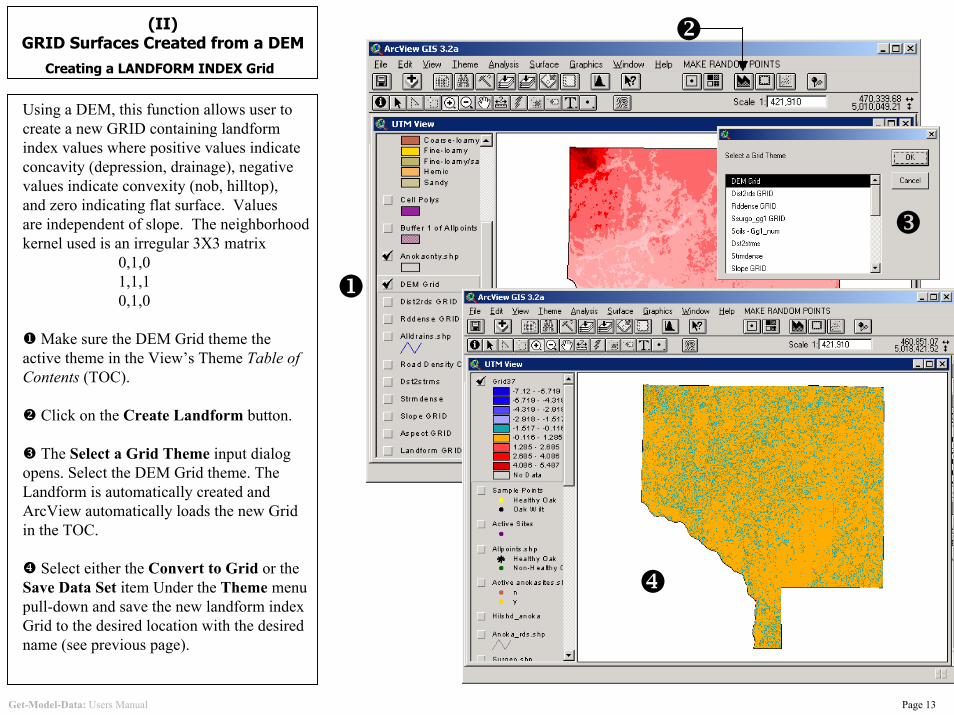
Using a DEM, this function allows user tocreate a new GRID containing landformindex values where positive values indicateconcavity (depression, drainage), negative values indicate convexity (nob, hilltop),and zero indicating flat surface. Valuesare independent of slope. The neighborhoodkernel used is an irregular 3X3 matrix
0,1,01,1,10,1,0
Make sure the DEM Grid theme theactive theme in the View’s Theme Table of Contents (TOC).
Click on the Create Landform button.
The Select a Grid Theme input dialog opens. Select the DEM Grid theme. The Landform is automatically created andArcView automatically loads the new Gridin the TOC.
Select either the Convert to Grid or the Save Data Set item Under the Theme menu pull-down and save the new landform index Grid to the desired location with the desiredname (see previous page).
(II)GRID Surfaces Created from a DEM
Creating a LANDFORM INDEX Grid
Get-Model-Data: Users Manual Page 13
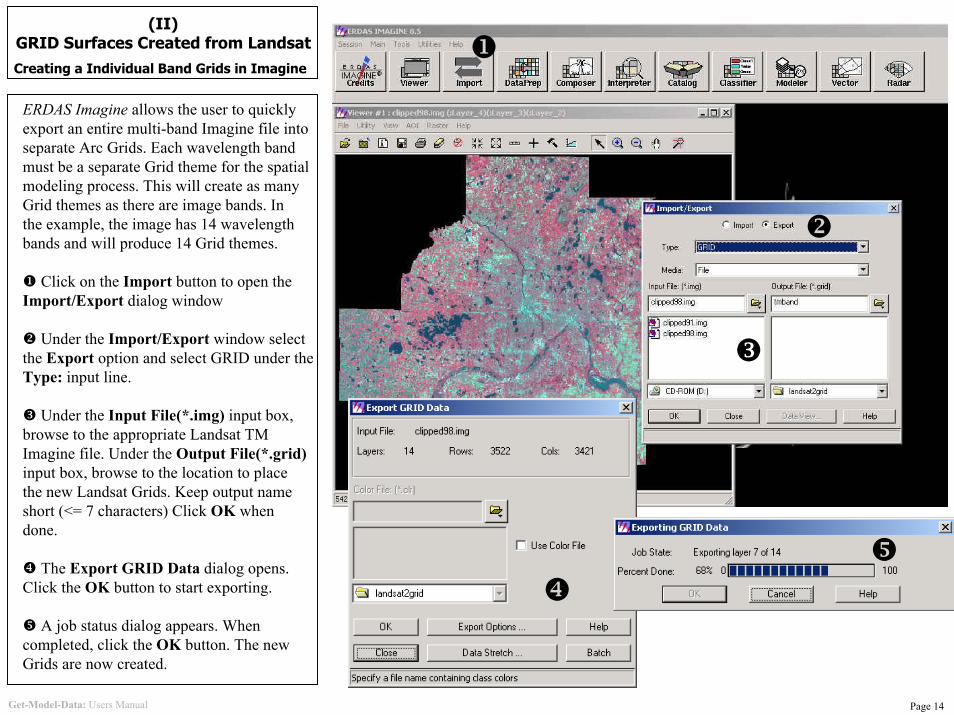
ERDAS Imagine allows the user to quicklyexport an entire multi-band Imagine file into separate Arc Grids. Each wavelength band must be a separate Grid theme for the spatialmodeling process. This will create as manyGrid themes as there are image bands. Inthe example, the image has 14 wavelength bands and will produce 14 Grid themes.
Click on the Import button to open the Import/Export dialog window
Under the Import/Export window select the Export option and select GRID under the Type: input line.
Under the Input File(*.img) input box, browse to the appropriate Landsat TM Imagine file. Under the Output File(*.grid)input box, browse to the location to place the new Landsat Grids. Keep output name short (<= 7 characters) Click OK when done.
The Export GRID Data dialog opens. Click the OK button to start exporting.
A job status dialog appears. When completed, click the OK button. The newGrids are now created.
(II)GRID Surfaces Created from LandsatCreating a Individual Band Grids in Imagine
Get-Model-Data: Users Manual Page 14
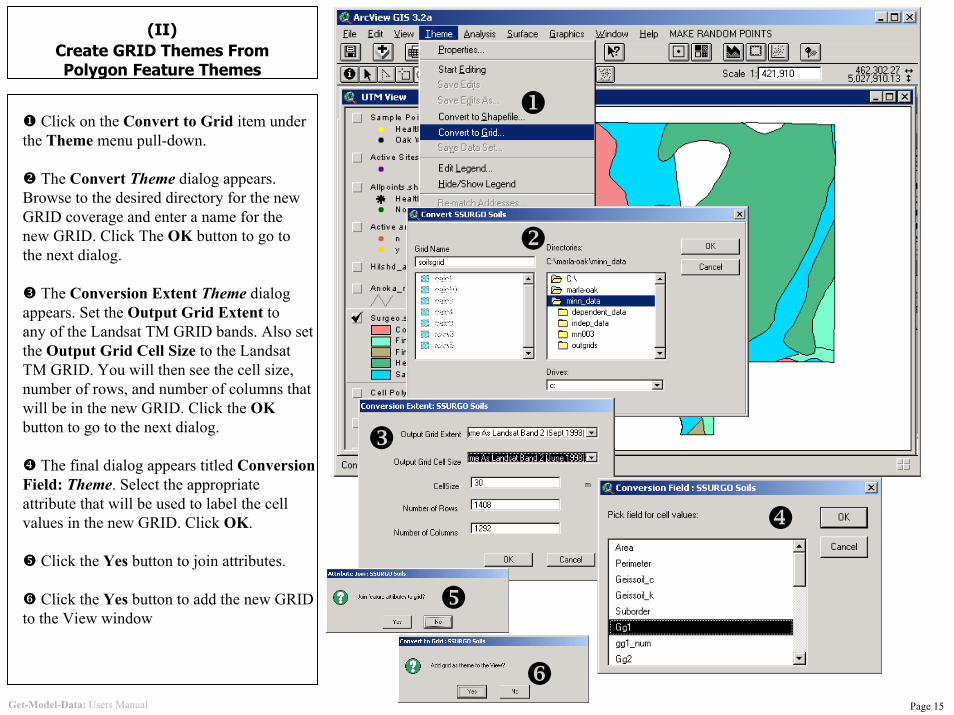
Click on the Convert to Grid item underthe Theme menu pull-down.
The Convert Theme dialog appears. Browse to the desired directory for the new GRID coverage and enter a name for the new GRID. Click The OK button to go to the next dialog.
The Conversion Extent Theme dialogappears. Set the Output Grid Extent to any of the Landsat TM GRID bands. Also setthe Output Grid Cell Size to the Landsat TM GRID. You will then see the cell size, number of rows, and number of columns thatwill be in the new GRID. Click the OKbutton to go to the next dialog.
The final dialog appears titled Conversion Field: Theme. Select the appropriate attribute that will be used to label the cell values in the new GRID. Click OK.
Click the Yes button to join attributes.
Click the Yes button to add the new GRIDto the View window
(II)Create GRID Themes From Polygon Feature Themes
Get-Model-Data: Users Manual Page 15
(II)
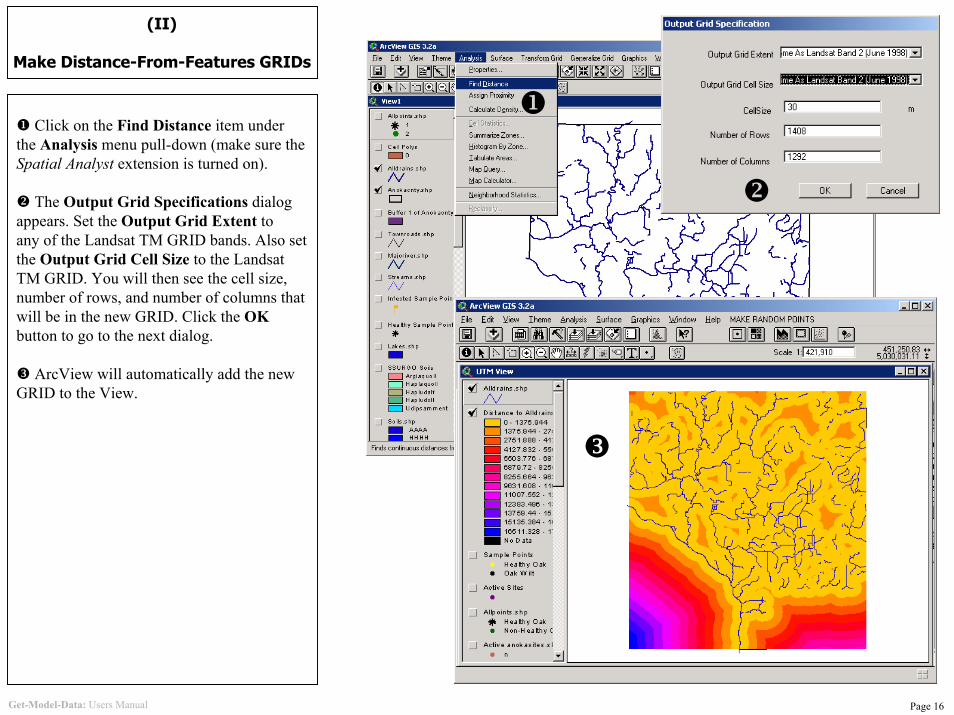
Make Distance-From-Features GRIDs
Click on the Find Distance item underthe Analysis menu pull-down (make sure theSpatial Analyst extension is turned on).
The Output Grid Specifications dialogappears. Set the Output Grid Extent to any of the Landsat TM GRID bands. Also setthe Output Grid Cell Size to the Landsat TM GRID. You will then see the cell size, number of rows, and number of columns thatwill be in the new GRID. Click the OKbutton to go to the next dialog.
ArcView will automatically add the new GRID to the View.
Get-Model-Data: Users Manual Page 16
(II)Create Line Feature Density GRID
Start Up Line Feature Density
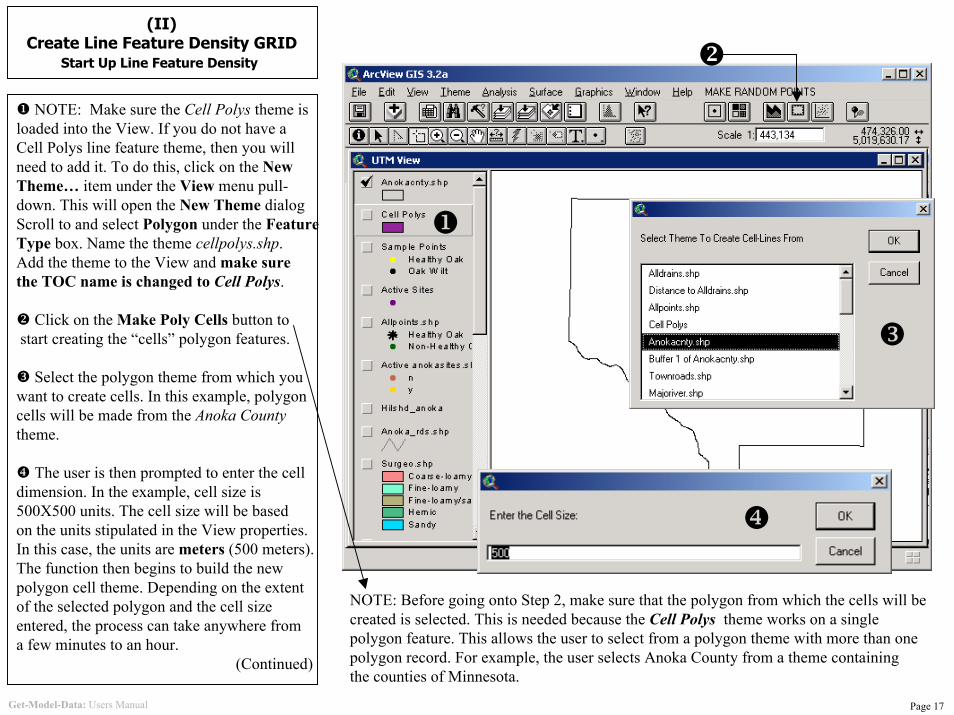
NOTE: Make sure the Cell Polys theme isloaded into the View. If you do not have aCell Polys line feature theme, then you willneed to add it. To do this, click on the NewTheme… item under the View menu pull-down. This will open the New Theme dialogScroll to and select Polygon under the FeatureType box. Name the theme cellpolys.shp.Add the theme to the View and make sure the TOC name is changed to Cell Polys.
Click on the Make Poly Cells button tostart creating the “cells” polygon features.
Select the polygon theme from which you want to create cells. In this example, polygoncells will be made from the Anoka Countytheme.
The user is then prompted to enter the cell dimension. In the example, cell size is500X500 units. The cell size will be based on the units stipulated in the View properties.In this case, the units are meters (500 meters).The function then begins to build the new polygon cell theme. Depending on the extentof the selected polygon and the cell size entered, the process can take anywhere from a few minutes to an hour.
(Continued)
NOTE: Before going onto Step 2, make sure that the polygon from which the cells will be created is selected. This is needed because the Cell Polys theme works on a singlepolygon feature. This allows the user to select from a polygon theme with more than one polygon record. For example, the user selects Anoka County from a theme containingthe counties of Minnesota.
Get-Model-Data: Users Manual Page 17
(II)Create Line Feature Density GRID
Cell Polygon Theme
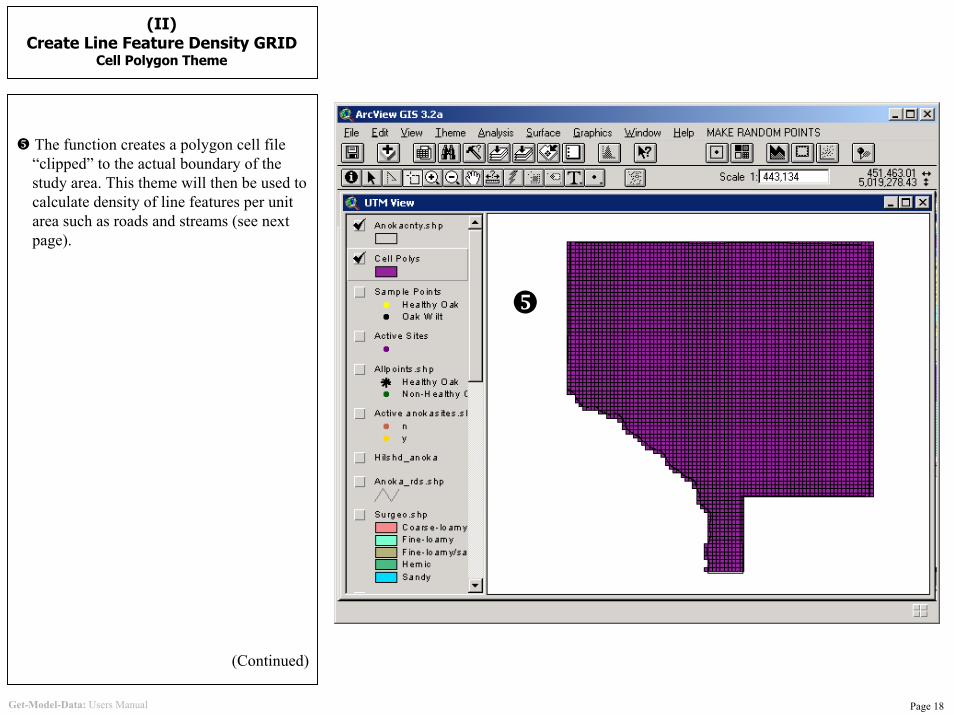
The function creates a polygon cell file “clipped” to the actual boundary of the study area. This theme will then be used to calculate density of line features per unitarea such as roads and streams (see nextpage).
(Continued)
Get-Model-Data: Users Manual Page 18

(II)Create Line Feature Density GRID
Calculate Line Density Per Cell
The next step is to calculate line density foreach cell polygon record.
Select the Get Feature Density button to open the Select LINE Theme selector dialog.
Select the desired line feature theme andclick the OK button to open the SelectCELL POLY Theme selector dialog.
Select the Cell Polys theme in the SelectCELL POLY Theme dialog and click theOK button to start calculating density. This may take a few minutes to an hour dependingon the number or Cell Polys records and the number of line features in the line theme.
(Continued)
Get-Model-Data: Users Manual Page 19

(II)Create Line Feature Density GRID
Convert Cell Polys Density Theme To GRID
Open the Legend Editor for the clipped.cell polys theme and set to Graduated Colorson the totlength attribute. Set to any color and click on the Apply button. This willdisplay the different density levels of eachcell polygon.
Next, select the Convert To Grid itemunder the Theme menu pull-down to openthe Convert dialog.
Browse to the appropriate directory location and enter a name for the new GRID.click the OK button.
(Continued)
Get-Model-Data: Users Manual Page 20
(II)Create Line Feature Density GRID
Convert Cell Polys Density Theme To GRID
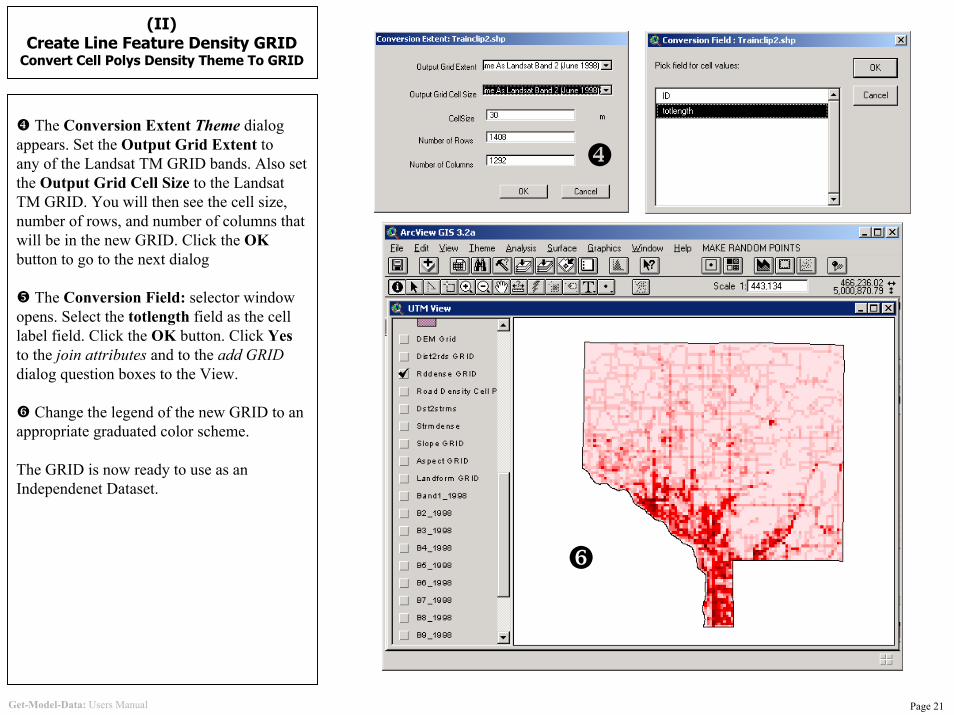
The Conversion Extent Theme dialogappears. Set the Output Grid Extent to any of the Landsat TM GRID bands. Also setthe Output Grid Cell Size to the Landsat TM GRID. You will then see the cell size, number of rows, and number of columns thatwill be in the new GRID. Click the OKbutton to go to the next dialog
The Conversion Field: selector windowopens. Select the totlength field as the celllabel field. Click the OK button. Click Yesto the join attributes and to the add GRIDdialog question boxes to the View.
Change the legend of the new GRID to anappropriate graduated color scheme.
The GRID is now ready to use as anIndependenet Dataset.
Get-Model-Data: Users Manual Page 21
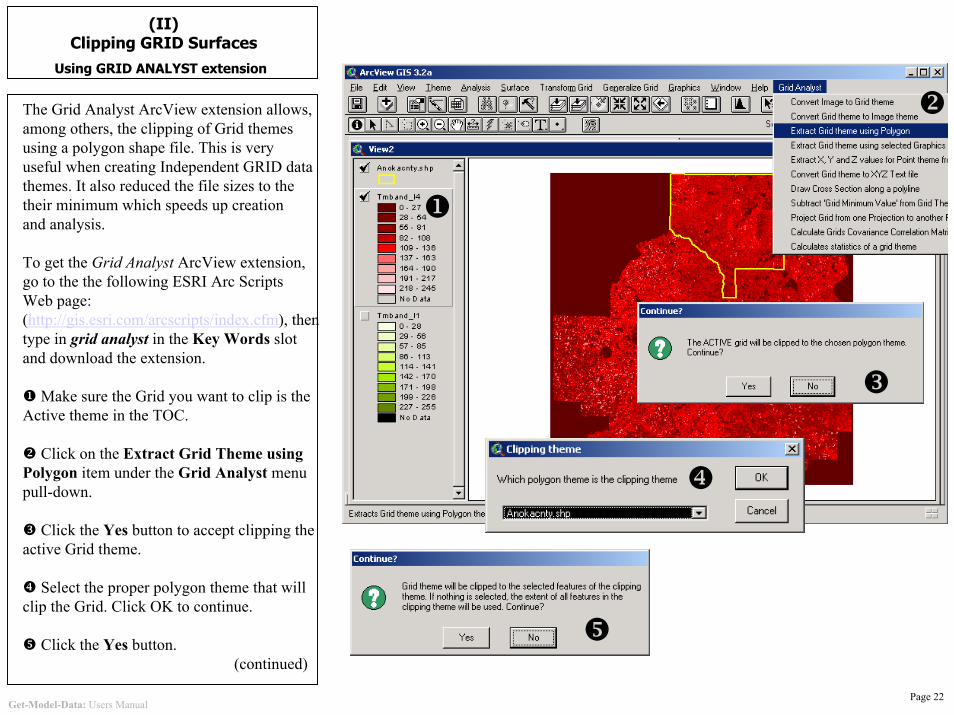
The Grid Analyst ArcView extension allows,among others, the clipping of Grid themesusing a polygon shape file. This is very useful when creating Independent GRID data themes. It also reduced the file sizes to thetheir minimum which speeds up creation and analysis.
To get the Grid Analyst ArcView extension, go to the the following ESRI Arc Scripts Web page:(http://gis.esri.com/arcscripts/index.cfm), thentype in grid analyst in the Key Words slotand download the extension.
Make sure the Grid you want to clip is theActive theme in the TOC.
Click on the Extract Grid Theme usingPolygon item under the Grid Analyst menupull-down.
Click the Yes button to accept clipping the active Grid theme.
Select the proper polygon theme that will clip the Grid. Click OK to continue.
Click the Yes button.(continued)
(II)Clipping GRID Surfaces
Using GRID ANALYST extension
Page 22Get-Model-Data: Users Manual
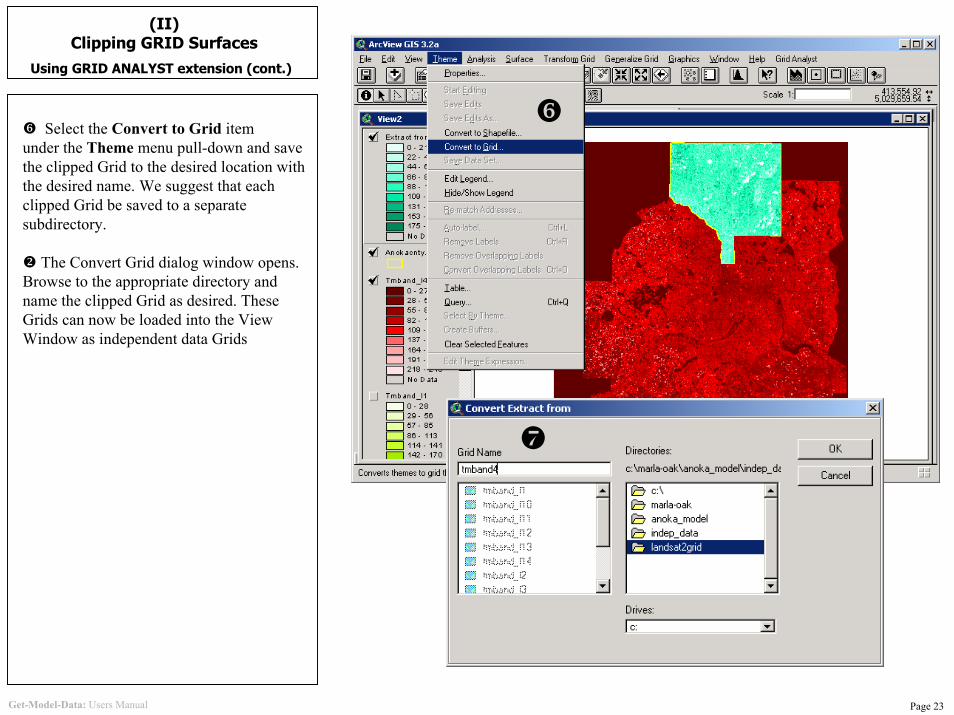
Select the Convert to Grid item under the Theme menu pull-down and save the clipped Grid to the desired location with the desired name. We suggest that each clipped Grid be saved to a separate subdirectory.
The Convert Grid dialog window opens. Browse to the appropriate directory and name the clipped Grid as desired. These Grids can now be loaded into the ViewWindow as independent data Grids
(II)Clipping GRID Surfaces
Using GRID ANALYST extension (cont.)
Get-Model-Data: Users Manual Page 23

(III)Create the Spatial Model Spreadsheet
Start Creating the Model Spreadsheet
The spatial model spreadsheet is initially created from the Dependent Variable theme.When the collection of independent data at each dependent sample point is completed,it is converted from a DBF to EXCEL.
An attribute must be created for each Independent Variable in the Dependent Variable themes table. For example, one independent variable data theme was DensityOf Roads Per Unit Area. As a result, an attribute named rddense was added to the Dependent Variable theme’s table.
Open the theme’s table and make it theactive document. To add an attribute to a theme’s table click on the Start Editing item under the Table menu pull-down. This will set the table to editable allowing the user to modify the table document.
Get-Model-Data: Users Manual Page 24
(III)Create the Spatial Model Spreadsheet
Add Independent Data Attributes
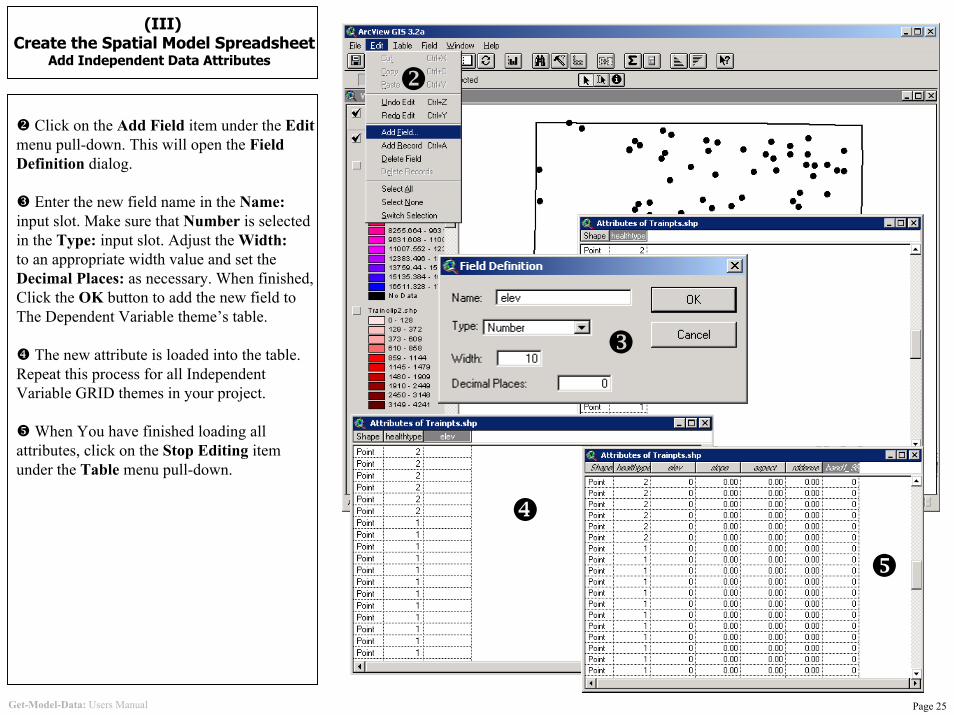
Click on the Add Field item under the Editmenu pull-down. This will open the FieldDefinition dialog.
Enter the new field name in the Name:input slot. Make sure that Number is selectedin the Type: input slot. Adjust the Width:to an appropriate width value and set the Decimal Places: as necessary. When finished,Click the OK button to add the new field to The Dependent Variable theme’s table.
The new attribute is loaded into the table.Repeat this process for all IndependentVariable GRID themes in your project.
When You have finished loading all attributes, click on the Stop Editing item under the Table menu pull-down.
Get-Model-Data: Users Manual Page 25
(III)Create the Spatial Model Spreadsheet
Populate Spreadsheet Attributes
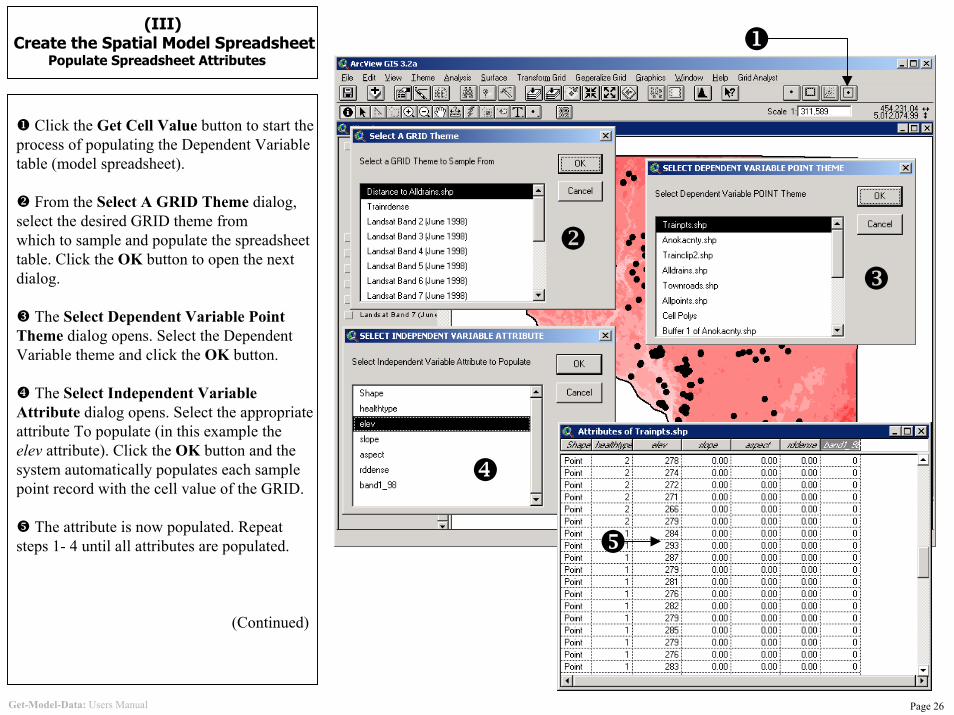
Click the Get Cell Value button to start the process of populating the Dependent Variable table (model spreadsheet).
From the Select A GRID Theme dialog, select the desired GRID theme fromwhich to sample and populate the spreadsheettable. Click the OK button to open the next dialog.
The Select Dependent Variable PointTheme dialog opens. Select the DependentVariable theme and click the OK button.
The Select Independent Variable Attribute dialog opens. Select the appropriate attribute To populate (in this example the elev attribute). Click the OK button and thesystem automatically populates each samplepoint record with the cell value of the GRID.
The attribute is now populated. Repeatsteps 1- 4 until all attributes are populated.
(Continued)
Get-Model-Data: Users Manual Page 26
(IV)Spatial Modeling in SPLUS
Starting Out
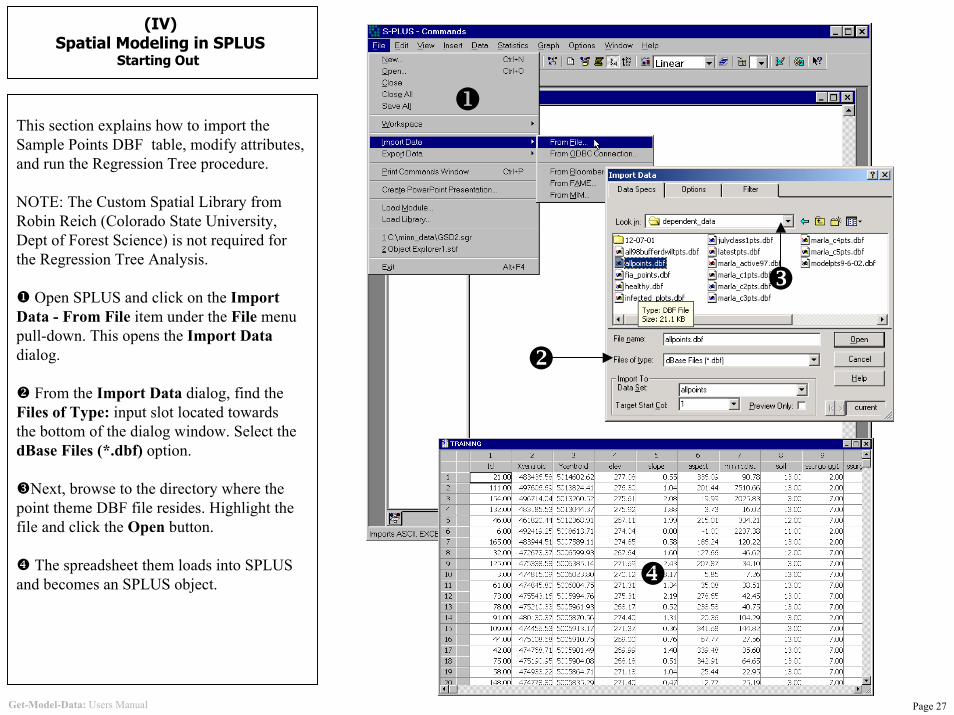
This section explains how to import the Sample Points DBF table, modify attributes, and run the Regression Tree procedure.
NOTE: The Custom Spatial Library from Robin Reich (Colorado State University, Dept of Forest Science) is not required for the Regression Tree Analysis.
Open SPLUS and click on the Import Data - From File item under the File menu pull-down. This opens the Import Datadialog.
From the Import Data dialog, find theFiles of Type: input slot located towardsthe bottom of the dialog window. Select the dBase Files (*.dbf) option.
Next, browse to the directory where the point theme DBF file resides. Highlight the file and click the Open button.
The spreadsheet them loads into SPLUSand becomes an SPLUS object.
Get-Model-Data: Users Manual Page 27
(IV)Spatial Modeling in SPLUS
Modifying The Spreadsheet in SPLUS
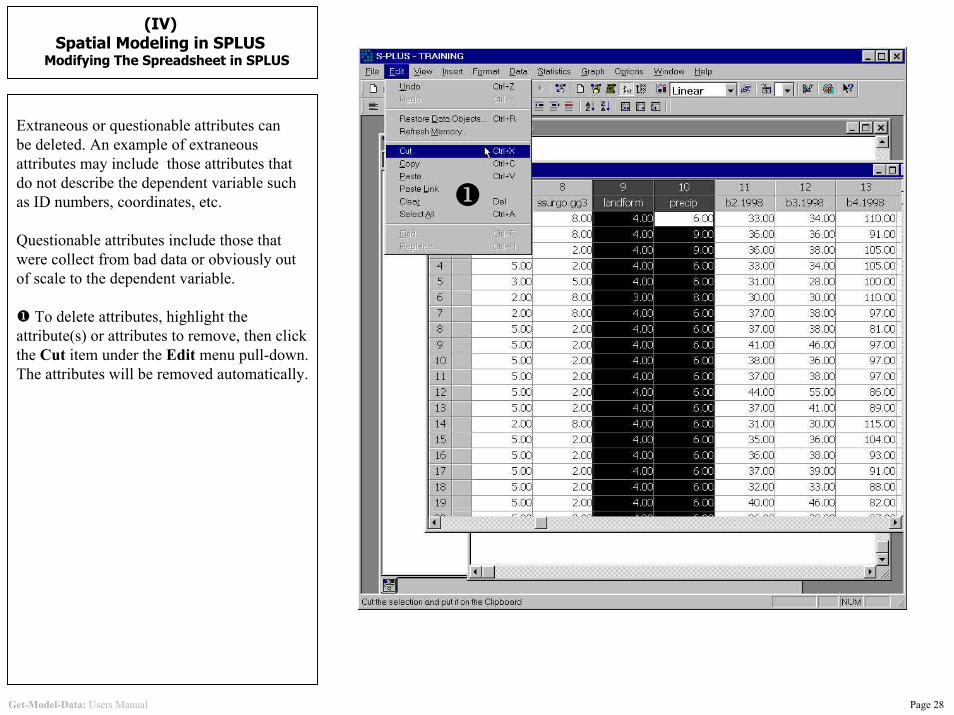
Extraneous or questionable attributes canbe deleted. An example of extraneous attributes may include those attributes thatdo not describe the dependent variable such as ID numbers, coordinates, etc.
Questionable attributes include those that were collect from bad data or obviously outof scale to the dependent variable.
To delete attributes, highlight the attribute(s) or attributes to remove, then click the Cut item under the Edit menu pull-down. The attributes will be removed automatically.
Get-Model-Data: Users Manual Page 28

(IV)Spatial Modeling in SPLUS
Changing Attribute Type
If any of the attributes contain discrete values(integer values that represent a class) thenthose attributes need to have their typechanged to Factor.
From the table, select the attribute to change then click on the Change Data Type item under the Data menu pull-down. This opens the Change Data Type dialog.
From the Change Data Type dialog, find the New Type: input slot located in the rightlower portion of the dialog window. Select the factor option and click the OK button. The field will automatically change to type factor.
Get-Model-Data: Users Manual Page 29

(IV)Spatial Modeling in SPLUS
Running the Classification TREE Analysis
The TREE command is a non-parametricbinary classification analysis. You could saythat it is a non-parametric supervisedclassification. The results of the TREE command are the independent variables thatare significant in describing the dependentvariable, the misclassification rate (samplebased), and the code needed to breakdownthe tree classification structure.
To start, type:>oakhlth<-tree(healthtype~.,data=TRAINING)
Next, type:>summary.tree(oakhlth)
Notice that the program shows the misclass-ification rate (0.05294 in this example). The sample based accuracy can be calculated bysubtracting the misclassification rate from1 and multiplying by 100. (1-.053 = .947*100= 94.7% accuracy)
To get Tree code, type:>oakhlth
Misclassification Error Rate
Get-Model-Data: Users Manual Page 30
(IV)Spatial Modeling in SPLUS
Running the Classification TREE Analysis
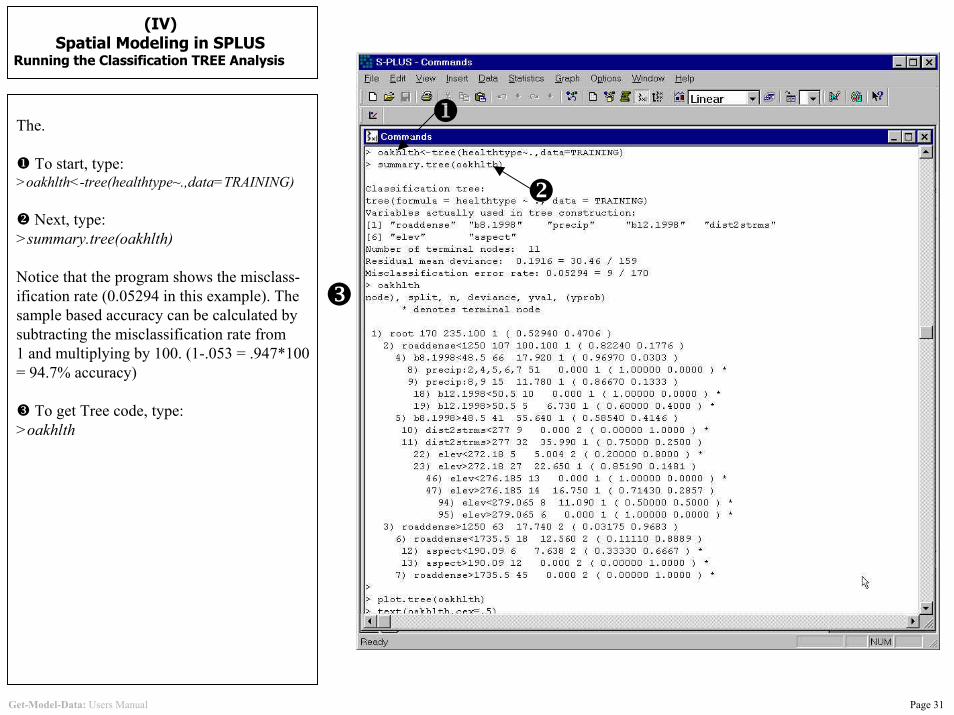
The.
To start, type:>oakhlth<-tree(healthtype~.,data=TRAINING)
Next, type:>summary.tree(oakhlth)
Notice that the program shows the misclass-ification rate (0.05294 in this example). The sample based accuracy can be calculated bysubtracting the misclassification rate from1 and multiplying by 100. (1-.053 = .947*100= 94.7% accuracy)
To get Tree code, type:>oakhlth
Get-Model-Data: Users Manual Page 31
(IV)Spatial Modeling in SPLUSPlotting the Classification TREE
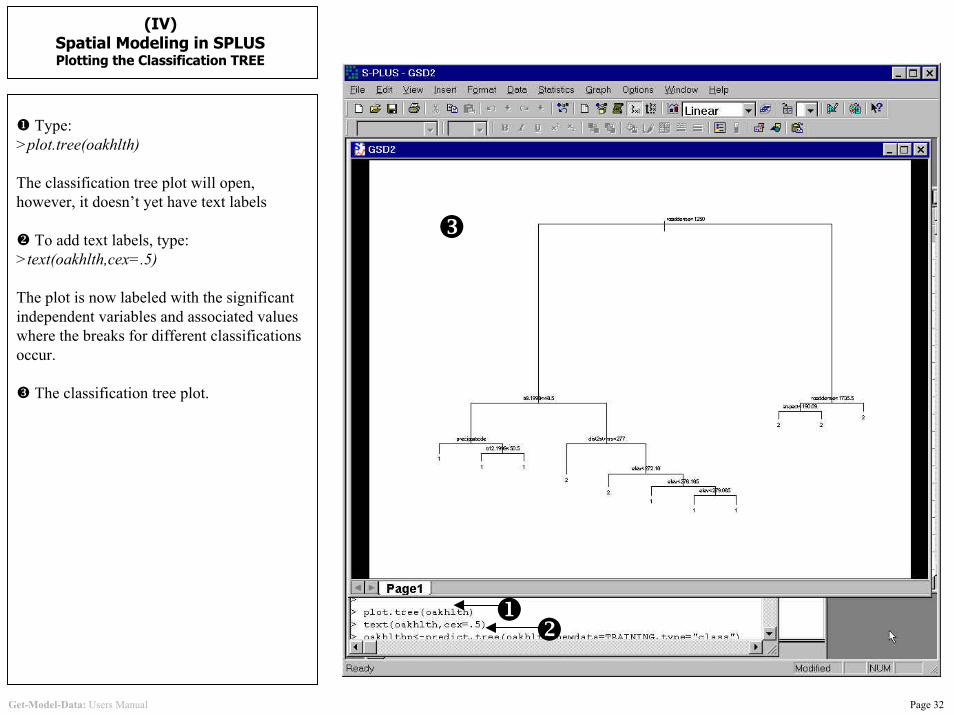
Type:>plot.tree(oakhlth)
The classification tree plot will open, however, it doesn’t yet have text labels
To add text labels, type:>text(oakhlth,cex=.5)
The plot is now labeled with the significantindependent variables and associated values where the breaks for different classificationsoccur.
The classification tree plot.
Get-Model-Data: Users Manual Page 32

(V)Creating the GRID Trend Surface
Creating the CON Statement G1
G2
G3
G4
Creating the CON statement will allow theGIS to create a new GRID Trend surface based on the structure of the ClassificationTree. The example to the right is fairly simple, consisting of only four break points(labeled G1-G4).
The ArcView Spatial Analyst CON structureconsists of the following structure:
(inGrid expression).Con(yesGrid, NoGrid)
The aGrid.Con ( yesGrid, noGrid ) request performs a conditional if/else evaluation ona cell-by-cell basis. aGrid can be any valid Boolean or relational expression involving multiple Grids and Numbers (after being converted to Grids with aNumb.AsGrid). Cells for which the expression is TRUE are given the value found in yesGrid. Cells for which the expression is FALSE are given the value found in noGrid. If aGrid is a single Grid, then cells which are non-zero are given the value found in yesGrid, while values of 0are given the value found in noGrid. The yesGrid or noGrid can be a single Grid, or any valid expression involving operators and requests that result in a Grid object.
relational expression CON True Val False Val
G1 = ([rddense] < 1250.asgrid).con(G2, 2.asgrid)
G2 = ([b8_1998] < 48.5.asgrid).con(1.asgrid, G3)
G3 = ([dst2strms] <277.asgrid).con(2.asgrid, G4)
G4 = ([elev] < 272.asgrid).con(2.asgrid, 1.asgrid)
Get-Model-Data: Users Manual Page 33
(V)Creating the GRID Trend Surface
Creating the CON Statement
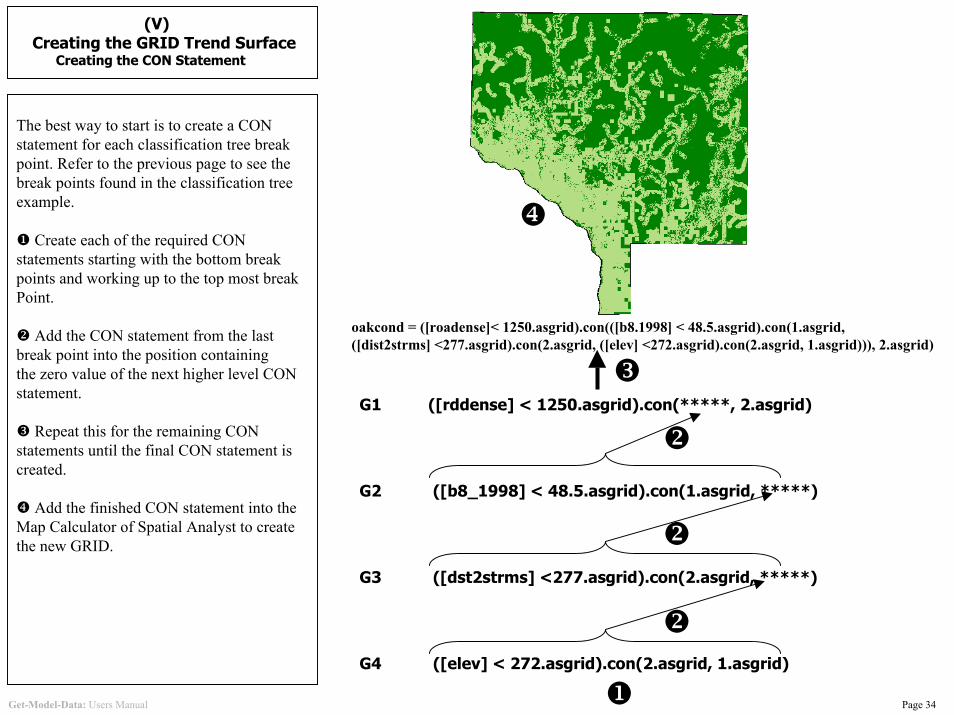
The best way to start is to create a CONstatement for each classification tree break point. Refer to the previous page to see the break points found in the classification tree example.
Create each of the required CONstatements starting with the bottom breakpoints and working up to the top most break Point.
Add the CON statement from the lastbreak point into the position containingthe zero value of the next higher level CONstatement.
Repeat this for the remaining CON statements until the final CON statement is created.
Add the finished CON statement into theMap Calculator of Spatial Analyst to create the new GRID.
Page 34
G1 ([rddense] < 1250.asgrid).con(*****, 2.asgrid)
G2 ([b8_1998] < 48.5.asgrid).con(1.asgrid, *****)
G3 ([dst2strms] <277.asgrid).con(2.asgrid, *****)
G4 ([elev] < 272.asgrid).con(2.asgrid, 1.asgrid)
oakcond = ([roadense]< 1250.asgrid).con(([b8.1998] < 48.5.asgrid).con(1.asgrid, ([dist2strms] <277.asgrid).con(2.asgrid, ([elev] <272.asgrid).con(2.asgrid, 1.asgrid))), 2.asgrid)
Get-Model-Data: Users Manual
(V)Creating the GRID Trend Surface
Creating the CON Statement
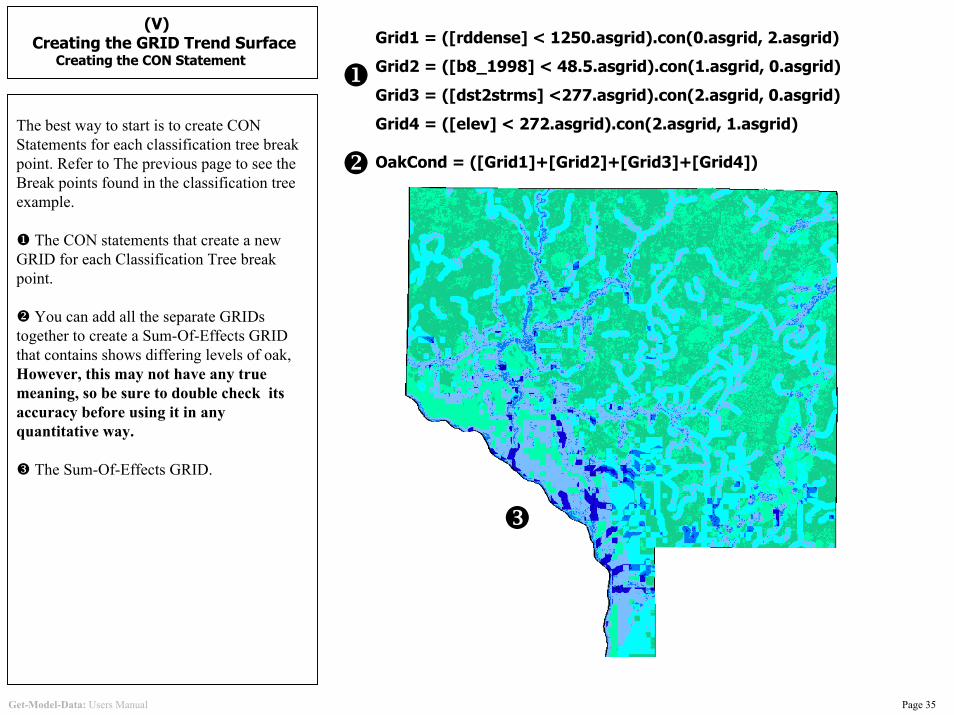
The best way to start is to create CONStatements for each classification tree break point. Refer to The previous page to see the Break points found in the classification tree example.
The CON statements that create a new GRID for each Classification Tree break point.
You can add all the separate GRIDs together to create a Sum-Of-Effects GRIDthat contains shows differing levels of oak,However, this may not have any true meaning, so be sure to double check itsaccuracy before using it in any quantitative way.
The Sum-Of-Effects GRID.
Grid1 = ([rddense] < 1250.asgrid).con(0.asgrid, 2.asgrid)
Grid2 = ([b8_1998] < 48.5.asgrid).con(1.asgrid, 0.asgrid)
Grid3 = ([dst2strms] <277.asgrid).con(2.asgrid, 0.asgrid)
Grid4 = ([elev] < 272.asgrid).con(2.asgrid, 1.asgrid)
OakCond = ([Grid1]+[Grid2]+[Grid3]+[Grid4])
Get-Model-Data: Users Manual Page 35

(V)Creating the GRID Trend Surface
10 Fold Cross Validation
Future Text
Get-Model-Data: Users Manual Page 36