Embed Size (px)
Citation preview


ARTICLESPUBLISHED ONLINE: 30MARCH 2014 | DOI: 10.1038/NPHYS2929
Collapse of superconductivity in a hybridtin–graphene Josephson junction arrayZheng Han1,2, Adrien Allain1,2, Hadi Arjmandi-Tash1,2, Konstantin Tikhonov3,4, Mikhail Feigel’man3,5,Benjamin Sacépé1,2 and Vincent Bouchiat1,2*For a Josephson junction array with hybrid superconductor/metal/superconductor junctions, a quantum phase transitionfrom a superconducting to a two-dimensional (2D) metallic ground state is predicted to occur on increasing the junctionnormal state resistance. Owing to its surface-exposed 2D electron gas and its gate-tunable charge carrier density, graphenecoupled to superconductors is the ideal platform to study such phase transitions between ground states. Here, we showthat decorating graphene with a sparse and regular array of superconducting discs enables the continuous gate-tuning ofthe quantum superconductor-to-metal transition of the Josephson junction array into a zero-temperature metallic state. Thesuppression of proximity-induced superconductivity is a direct consequence of the emergence of quantum fluctuations ofthe superconducting phase of the discs. Under perpendicular magnetic fields, the competition between quantum fluctuationsand disorder is responsible for the resilience of superconductivity at the lowest temperatures, supporting a glassy state thatpersists above the upper critical field.We provide the entire phase diagram of the disorder andmagnetic-field-tuned transitionto reveal the role of quantum phase fluctuations in 2D superconducting systems.
The nature of the ground state terminating 2D super-conductivity in the superconductor–(metal)–insulatorquantum phase transition has been a central issue in
condensed matter physics1, which still remains unresolved today2.In granular3,4 and in some amorphous superconducting thinfilms5–10, oxide interfaces11,12 and Josephson junction arrays13,14,an intervening metallic state is often observed experimentallyat the disorder-tuned or magnetic field-tuned quantum criticalpoint separating the superconducting from the (weak) insulatingstate. In contrast to usual non-interacting 2D electronic systems,in which electron localization yields an insulating ground state15,this metallic state is characterized by the presence of electron-pairing fluctuations that are indicated in experiments by a partialdrop of resistance—reminiscent of the nearby superconductingphase—preceding the nearly T -independent resistive state.
The possibility that a 2D system can undergo a zero-temperaturesuperconducting to metal transition is indeed rather intriguing16–22.The physics of this metallic state, sometimes termed as a Bosemetal18,21, in which charge carriers are supposedly condensedin Cooper pairs, is not clear. Considerable theoretical eortshave been focused on the role of quantum phase-fluctuationsof the superconducting order parameter in the regime wherethe superconducting phase stiness breaks down. In particular,models involving specific types of Josephson junction arraysin which superconducting discs are coupled together via a2D disordered metal through the proximity eect have beenconsidered16,17,20,22. Such proximity-coupled arrays encompass allthe physical ingredients: conventional superconducting electronpairing, embedded dissipation channels in the normal disorderedmetal, and quantum fluctuations of superconducting phases due toa weak Coulomb blockade on superconducting discs23.
The theoretical analysis of these models shows that a quantumphase transition from a superconducting state to a non-supercon-ducting state can be tuned by two dierent means: either
geometrically by increasing the distance between discs, or byincreasing the metal resistance. Both parameters directly aectthe superconducting proximity eect and result in a markedenhancement of quantum phase fluctuations. Although theproximity eect is expected to extend over infinite distance at zerotemperature, leading systematically to a superconducting groundstate, the main conclusion of recent theories16,17,20,22 is that quantumphase fluctuations lead to a collapse of superconductivity, that is,of the array phase stiness. This should arise at a given criticalvalue of the tuning parameter, leading to a zero-temperature 2Dmetallic state.
On the experimental side, it is hardly conceivable to access thisquantum breakdown of superconductivity by tuning continuouslythe resistance of ametallic thin film that carries the superconductingproximity eect. Varying the inter-disc distance on a large setof samples has thus remained the only reliable approach withthin films. A recent study of proximity arrays consisting of goldthin-films covered with an array of niobium nano-discs24 hasdemonstrated that the critical temperature of such proximity-coupled arrays decreases on increasing the inter-disc distance andextrapolates to zero for a finite inter-disc distance, suggestinga quantum phase transition to a non-superconducting, metallicground state.
In this work, we take a dierent route to tune the quantumphase transition in a controllable fashion. We use graphene25, apurely 2D crystal of carbon atoms, to serve as the diusive metal,which we decorate with a triangular array of tin discs (a type-I superconductor). The gate-tunable sheet resistance of graphene,which can approach the quantum of resistance (h/e2), enables usto continuously vary the strength of disorder, which aects theinter-disc proximity eect, and therefore tune the transition fromthe superconducting to the metallic state. Furthermore, the charge-carrier density of graphene is always several orders of magnitudebelow those of classical metals, preventing the weakening of the
1Univ. Grenoble Alpes, Institut Néel, F-38042 Grenoble, France, 2CNRS, Institut Néel, F-38042 Grenoble, France, 3L. D. Landau Institute for TheoreticalPhysics, Kosygin street 2, Moscow 119334, Russia, 4Department of Condensed Matter Physics, The Weizmann Institute of Science, 76100 Rehovot, Israel,5Moscow Institute of Physics and Technology, Moscow 141700, Russia. *e-mail: [email protected]
380 NATURE PHYSICS | VOL 10 | MAY 2014 | www.nature.com/naturephysics

NATURE PHYSICS DOI: 10.1038/NPHYS2929 ARTICLES
b
a
cc
Vg
V
I
b
2a
1 µm5 µm
Figure 1 | Proximity-coupled array of superconducting discs on graphene.a, Schematics of the device, involving a triangular array of superconductingtin discs decorating the bare graphene surface. The device is connected to acurrent source and measured using a four-probe measurement set-up.b, Optical micrograph of the sample. The black lines indicate the graphenesample plasma-etched Hall bar, which is connected to the gold electrodesseen on the edge of the image. The graphene surface is decorated with aregular array of tin discs of diameter 400 nm, separated by 1 µm betweencentres. c, Scanning electron micrograph of the dashed rectangular regionin b showing the triangular lattice of tin discs with diameter 2a andseparated by a distance b.
superconductivity on the discs by the inverse proximity eect26.As we describe below, these capabilities, along with quantitativecomparisons with theory, allow us to reveal both the collapse ofsuperconductivity by quantum phase fluctuations, and the ensuing2D metallic state. In addition, under perpendicular magneticfield a re-entrant superconducting state is observed at our lowesttemperatures, as expected from theory27–29.
Berezinskii–Kosterlitz–Thouless transitionOur proximity-induced array consists of a triangular lattice ofdisc-shaped superconducting islands, which are deposited onto agraphene Hall bar equipped with a backgate electrode (Fig. 1). Thesuperconducting discs are in the form of 50 nm thick tin films, withdiameter 2a= 400 nm. Discs are separated by a distance b= 1µmbetween their centres (Fig. 1). The electronmobility of the grapheneextracted from a fit of the field eect and fromHall measurements is680 cm2 V1 s1 at high gate voltages (Supplementary Fig. 1), whilethe mean free path l can be varied with the backgate in the range10–30 nm (Supplementary Fig. 2), corresponding to a diusioncoecient D=50–140 cm2 s1 (Supplementary Fig. 2). Our systemdiers considerably from previous experiments performed on tin–graphene hybrids4,30, for which tin clusters of random shapesdensely self-assembled on the graphene surface by dewetting.Those experiments were performed in the opposite regime of shortjunctions (coherence length b) and in one case4 in the limitof strongly disordered graphene (mean free path b), for which
a superconductor-to-insulator quantum phase transition has beenobserved on decreasing the graphene charge carrier density.
We begin the presentation of the data by describing thetwo-step transition31,32 that the sample undergoes towards thesuperconducting state. On cooling from the normal state, a gate-independent resistance drop occurs at a temperature of ~3.6 K(Fig. 2a, red and blue curves, also Supplementary Fig. 3), whichis consistent with a previous observation of the superconductingtransition temperature of tin nanoparticles30. We attribute thisfirst drop to the superconducting transition of the discs, whichlocally shunt the graphene area underneath. The relative resistancedrop 1R/RN at this transition amounts to 20% on the electronside and 10% on the hole side, in good agreement with a modelincluding a carrier dependent tin/graphene interface transparency(Supplementary Information). Such an electron/hole asymmetry isrelated to the pinning of the charge density of graphene below themetal33, which in the case of tin30 leads to a p/n junction on thehole side and a transparent p/p junction on the electron side. In therest of the paper, we will focus rather on the electronic propertiesof the system on the electron side, for which the relative drop ofresistance 1R/RN exceeds the filling factor of the tin deposition(Supplementary Fig. 3), indicating that the tin/graphene interfaceconductance greatly exceeds the quantum of conductance.
Further cooling enhances the proximity eect via the graphene,which eventually leads to the percolation of superconductivity andthe establishment of a 2D superconducting state (SupplementaryFig. 3a,b). As shown in Fig. 2a, at gate voltages between 0 and 30V,the resistance decreases when the temperature is lowered from 3Kto 0.06K. An opposite trend is seen for gate voltages close to thecharge neutrality point (namely, from 30V to 0V).
Below 1K and for gate voltages above 3V, the proximity-coupled array develops full superconductivity, with a zeroresistance state and a gate-dependent critical temperature. Thetransition is captured by a Berezinskii–Kosterlitz–Thouless (BKT)mechanism34,35, which describes the 2D superconducting transitionas a proliferation and unbinding, atT BKT
c , of vortex–antivortex pairs,that is, thermal phase fluctuations of the superconducting orderparameter. A colour-scaled map showing the device resistanceversus gate voltage and temperature is shown in Fig. 2b. Theexperimentally measured superconducting temperature Tc isindicated by the white contour. The higher positive gate voltageleads to higher Tc, whereas Tc vanishes in the region around thecharge neutrality point, between 30V and 3V.
For Josephson junction arrays, the value of T BKTc is directly
proportional to the Josephson energy EJ(b,T ) of a single junctionformed between two superconducting discs. For a triangular lattice,the relation reads29:
T BKTc '1.47EJ(b,T BKT
c ) (1)
where EJ(b, T ) depends on the metal conductance g , the inter-disc distance b and the diusion coecient D (Methods). Usingexperimentally extracted values ofD and of the graphene resistancemeasured at 4 K for all back-gate values, we calculated T BKT
c bysolving (1) self-consistently with respect to T for the entire back-gate range (Methods). In Fig. 2b, the resulting T BKT
c is shown by thedashed line. For high gate voltages (that is,Vg >10V) this theoreticalvalue of T BKT
c is in excellent agreement with the experimentalcritical temperatureTc without any fitting parameter, supporting thetheoretical model29.
The critical supercurrent at T =0 provides another computablephysical quantity in such arrays. As shown in Fig. 3a, the plot ofthe dierential resistance dV/dI versus bias current and Vg allowsus to obtain the full Vg dependence on Ic at T = 0.06K. In thezero-temperature limit, the critical current of an array of discs canbe inferred from the Josephson coupling energy of neighbouring
NATURE PHYSICS | VOL 10 | MAY 2014 | www.nature.com/naturephysics 381
ARTICLES NATURE PHYSICS DOI: 10.1038/NPHYS2929
5
4
3
2
1
0
dV
/dI (
h/4e
2 )
20 30100−10−20
60 mK3 K4 K
a
Vd
b
Gate voltage (V)
0.1
1.0
−30 −20 −10 0 10 20 30
S
10
60
1.0
0.1
Gate voltage (V)
Tem
pera
ture
(K)
(kΩ)
c
101
102
103
104
Res
istan
ce (Ω
)0.1 1.0 4.0
Temperature (K)
Vg−Vd (V)035791318233343
Figure 2 | Collapse of superconductivity in the proximity-coupled array. a, Gate voltage dependence of the four-probe resistance for three dierenttemperatures. The curve at T = 4 K gives the gate dependence of the device resistance above the superconducting transition of the tin discs. At T =3 K, theresistance drops throughout the full gate range owing to the superconducting transition of the tin discs. At the base temperature of 0.06 K, the arrayundergoes a transition from the superconducting to the resistive state for 29 V <Vg <3 V and the resistance exhibits a sharp peak at the chargeneutrality point, indicated by Vd, the so-called Dirac voltage. b, Colour-scaled map of resistance versus temperature and gate voltage ( Vg). Thesuperconducting phase (S) on the electron-doped side is shown as the blue area and the superconducting critical temperature Tc bordering the resistivestate is indicated by the white contour. The dashed line is calculated from equation (1) without a fitting parameter. The experimental Tc deviates aroundVg =5 V towards a sharp breakdown of the superconducting state at Vg =3 V. c, Line cuts from b of the temperature dependence of the array resistance.Whereas the resistance drops into a fully superconducting state for Vg Vd > 10V, a levelling-o to a gate-dependent finite value is observed for0<Vg Vd < 10V.
discs29, which is given by:
EJ (b,T =0)= 3
4gD
b2 ln2(b/a)=
2eI1 (2)
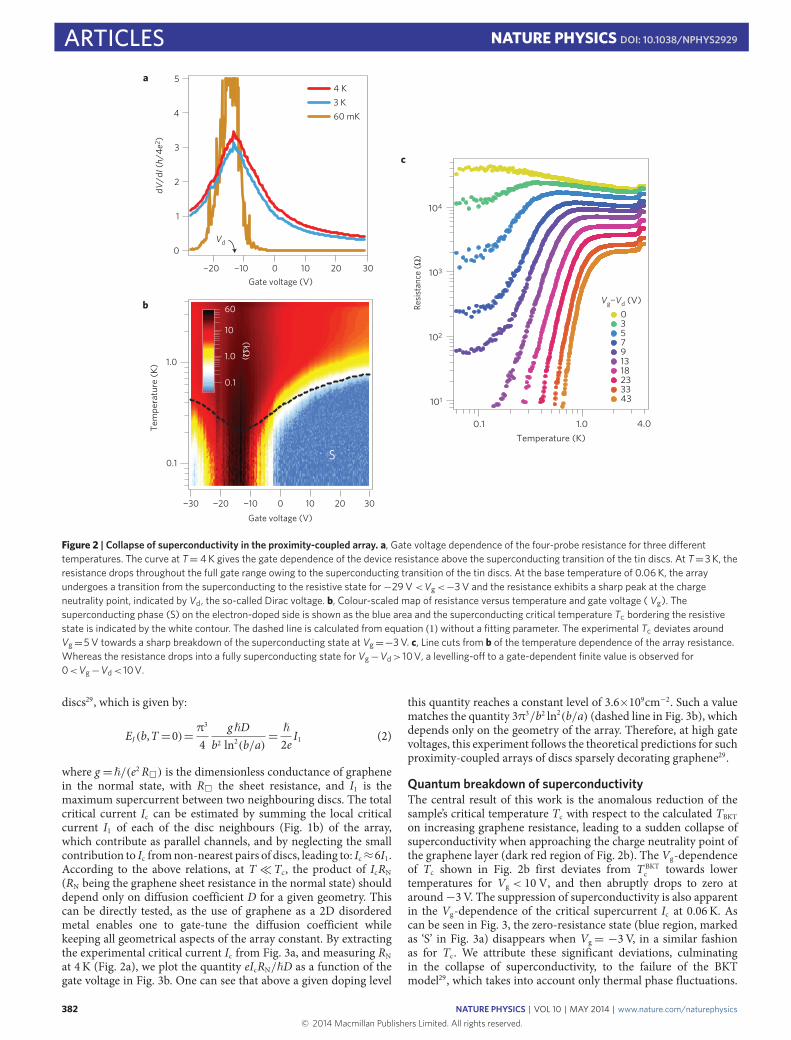
where g =/(e2R) is the dimensionless conductance of graphenein the normal state, with R the sheet resistance, and I1 is themaximum supercurrent between two neighbouring discs. The totalcritical current Ic can be estimated by summing the local criticalcurrent I1 of each of the disc neighbours (Fig. 1b) of the array,which contribute as parallel channels, and by neglecting the smallcontribution to Ic fromnon-nearest pairs of discs, leading to: Ic 6I1.According to the above relations, at T Tc, the product of IcRN(RN being the graphene sheet resistance in the normal state) shoulddepend only on diusion coecient D for a given geometry. Thiscan be directly tested, as the use of graphene as a 2D disorderedmetal enables one to gate-tune the diusion coecient whilekeeping all geometrical aspects of the array constant. By extractingthe experimental critical current Ic from Fig. 3a, and measuring RNat 4 K (Fig. 2a), we plot the quantity eIcRN/D as a function of thegate voltage in Fig. 3b. One can see that above a given doping level
this quantity reaches a constant level of 3.6×109cm2. Such a valuematches the quantity 33/b2 ln2(b/a) (dashed line in Fig. 3b), whichdepends only on the geometry of the array. Therefore, at high gatevoltages, this experiment follows the theoretical predictions for suchproximity-coupled arrays of discs sparsely decorating graphene29.
Quantum breakdown of superconductivityThe central result of this work is the anomalous reduction of thesample’s critical temperature Tc with respect to the calculated TBKTon increasing graphene resistance, leading to a sudden collapse ofsuperconductivity when approaching the charge neutrality point ofthe graphene layer (dark red region of Fig. 2b). The Vg-dependenceof Tc shown in Fig. 2b first deviates from T BKT
c towards lowertemperatures for Vg < 10 V, and then abruptly drops to zero ataround3V. The suppression of superconductivity is also apparentin the Vg-dependence of the critical supercurrent Ic at 0.06 K. Ascan be seen in Fig. 3, the zero-resistance state (blue region, markedas ‘S’ in Fig. 3a) disappears when Vg = 3V, in a similar fashionas for Tc. We attribute these significant deviations, culminatingin the collapse of superconductivity, to the failure of the BKTmodel29, which takes into account only thermal phase fluctuations.
382 NATURE PHYSICS | VOL 10 | MAY 2014 | www.nature.com/naturephysics

NATURE PHYSICS DOI: 10.1038/NPHYS2929 ARTICLESa 150
100
50
0
−50
−100
Bias
curre
nt (n
A)
b
10
60
1.0
0.1
Gate voltage (V)
eI cR
N /
ħD (×
109
cm−2
)
5
4
3
2
1
−30 20100−10−20
S
(kΩ)
30
c
30
20
10
0
500−50Bias current (nA)
Res
ista
nce
(kΩ
)
13 7 5 3 0
Vg−Vd (V)
4020100−10 30 Vg–Vd (V)
Figure 3 | Critical current in the proximity-coupled array at 0.06K. a, Colour-scaled map of the dierential resistance dV/dI measured at 0.06 K versusthe gate voltage (with respect to the Dirac voltage) and bias current. The border between the zero-resistance state (blue area) and the resistive state (redarea) indicates the critical current Ic. b, The quantity eIc RN/D calculated from the data of (a) and from Supplementary Fig. 2, plotted as a function of thegate voltage. The red dotted line corresponds to the theoretical value calculated using equation (2) c, Line cuts of a: current-biased dierential resistancemeasured at 0.06 K for a set of gate voltages ranging from 13 V to 0 V.
Therefore our results are a direct consequence of the breakdownof the superconducting phase stiness due to the emergence ofquantum phase fluctuations16,17,29.
The quantum origin of phase fluctuations in such proximity-coupled arrays stems from the particle number–phase uncertaintyrelation, which states that when the number of particles inan isolated superconducting disc is fixed, the phase of thesuperconducting order parameter will undergo strong non-thermalfluctuations. In tunnelling Josephson junction arrays, such quantumphase fluctuations are expected to occur when the disc chargingenergy overcomes the Josephson coupling energy13, a situation thatleads to charge quantization and the Coulomb blockade of thetunnelling into the discs.
Proximity-coupled arrays behave dierently because theirsuperconducting discs are coupled well to a metal layer withouta tunnel barrier. When the normal-state resistance of the arrayapproaches a few k, which is achievable with graphene, theAndreev conductance—that is, the conductance for electronpairs—can be such that a weak charge quantization23 of charge2e prohibits the charge transfer into the discs. As the transfer ofquasiparticles is also hindered at T Tc by the superconductinggap, the total charge of the discs tends to become fixed and thuspromotes quantum fluctuations of the phase of the superconductingorder parameter, as considered in refs 16,17, where this eect wasanalysed taking into account dissipation in normal regions betweensuperconducting discs. Note that dissipation was identified asa critical parameter in the analysis of the superconducting to
metal transition in MoGe thin films6. As a result, theory predictsthat the presence of quantum phase fluctuations leads to aneective decoupling of superconducting phases between discs, andeventually to the collapse of the array phase stiness for a givencritical resistance of the 2D metal16,17. In our system, the wide rangeof tunability of graphene sheet resistance is the key ingredientallowing access to this regime of weak charge quantization and theensuing superconducting-metal transition.
We next investigate the nature of the state terminatingsuperconductivity near the charge neutrality point (that is, forVg Vd < 10 V). We systematically measured the temperaturedependence of the resistance (R–T curves). In the non-superconducting regime (Fig. 2c), they exhibit a resistance dropbelow 0.5 K reminiscent of the superconducting transition observedfor higher gate voltages, which indicates that superconductingfluctuations have developed in the graphene. However, insteadof falling into a zero-resistance superconducting state, the R–Tcurves level o at finite, gate-dependent values that reach up to28 k at the charge neutrality point. Importantly, we can excludethe possibility of electron heating as the origin of this metallic tailat low temperature because, under a magnetic field of 30mT, thelevelling-o disappears (Supplementary Fig. 4).
To obtain further insights into this critical regime in Fig. 3cwe show a set of curves for the dierential resistance versus biascurrent extracted from the data of Fig. 3a for a few values of Vg.In the superconducting state, zero resistance is observed up to thecritical current, as discussed before. However, for Vg <3V, where
NATURE PHYSICS | VOL 10 | MAY 2014 | www.nature.com/naturephysics 383

ARTICLES NATURE PHYSICS DOI: 10.1038/NPHYS2929
the R–T curves saturate at finite values on cooling, the dierentialresistance around zero current bias transform into a zero-biasdips that persist even close to the charge neutrality point at theDirac voltage Vd =13V. These dips give a clear indication thatsuperconducting fluctuations exist for all gate voltages. Therefore,we are led to conclude that the ground state of our array,which exhibits finite resistance at the zero-temperature limit,is related to superconductivity. Moreover, the fact that the R–T curves conspicuously extrapolate to a constant resistance atzero temperature suggests that a 2D quantum metallic stateis approached. We believe that the nature of this collapseof superconductivity and the resulting quantum metallic statearise from the enhancement of quantum phase fluctuations onincreasing graphene resistance, eventually leading to the eectivedecoupling of the discs’ superconducting phases. For criticaltemperatures below the typical Thouless energy of a single junction,ETh =D/b2, the impact of quantum fluctuations on Tc is expected17
to be pronounced, with an exponential suppression in the formTc ETh exp(c/(g gc)), where gc is the critical conductance ofgraphene and c is a constant, which qualitatively explains theobserved collapse of superconductivity.
Furthermore, the variation with gate voltage of the finiteresistance saturating at the zero-temperature limit in the metallicstate (Vg < 3V) may be partially attributed to superconductingfluctuations of Aslamazov–Larkin36 andMaki–Thompson37,38 types,which would include the phase fluctuations, leading to a positivecorrection to the conductance. A non-perturbative theory of thesefluctuations is required to quantitatively explain the very strongcontribution of superconducting fluctuations to conductivity nearthe critical Vg =3V.
Superconducting glassy stateAnother route to induce a quantum phase transition to thenormal state in our superconducting array consists in applyinga perpendicular magnetic field, H . The destruction of the arraysuperconductivity by the magnetic field—we consider here amagnetic field smaller than the critical field of tin discs—resultsfrom the interplay between three dierent eects. First, themagnetic field imposes phase frustration between the discs. Thisfrustration, which is given by f =HS0/0 (S0 =
p3b2/2 is the area of
the array elementary cell in the triangular lattice and 0 =h/2e theflux quantum), impedes reaching a set of phase dierences betweendiscs, which simultaneously minimizes the Josephson energy ofall junctions. Second, the magnitude of each individual Josephsoncoupling Eij
J between two neighbouring discs i and j decreases withincreasing magnetic field in a way such that the average hEij
J i dropsexponentially beyond the magnetic length LH =p
0/H , owing torandom magnetic field-induced phase shifts, whereas the typicalmodulus of Eij
J is suppressed by a factor of only ~1/g (ref. 39).Thereby both these eects converge to suppress
superconductivity in the array. The second eect, however,leads to the enhancement of quantum phase fluctuations bymitigation of the proximity eect17, whereas frustration may yieldnon-monotonic behaviour of the resistance with increasing H , asobserved in tunnelling Josephson junction arrays13,14.
The third eect to consider here comes from the phasecoherent nature of the disordered graphene electron gas. As aresult of the multiple interference of electron wavefunctions, thegraphene conductance undergoesmesoscopic fluctuations that lead,in the normal state, to universal conductance fluctuations. In ourproximity-coupled array, such mesoscopic fluctuations are presenttogether with superconducting fluctuations, resulting in resistancefluctuations on varying electron density, as apparent in the gateevolution of the resistance measured at 0.06K shown in Fig. 2a. In asimilar fashion, small variations of the magnetic field can randomlymodulate the Andreev conductance of each Josephson junction
5
4
3
2
1
0
H (m
T)
0.80.60.40.2
1.0
3.0
0.1
0.01
6(kΩ
)
Temperature (K)1.0
S
Figure 4 | Re-entrant superconductivity under a magnetic field.Colour-scaled map of the magnetoresistance (H) plotted as a function oftemperature and magnetic field measured in the superconducting phase(Vg =30 V). The upper critical field of the array is indicated by the whitecontour bordering the superconducting and resistive state. The solid line isa fit of the upper critical field by the BCS theory for dirty superconductors.A clear deviation occurs below 0.2 K, where a re-entrant pocket ofsuperconductivity persists up to 3.3 mT and is followed at higher field bynot-fully superconducting pockets, non-periodic in the magnetic field.
by dephasing the electron interference pattern27,39,40, and thereforeplay an important role in the setting of global phase coherence,especially when the mean critical current is strongly suppressed bythe magnetic field.
The conjunction of these three eects has led to theoreticalpredictions that, at very low temperature, superconductivity maypersist above the upper critical field, Hc2, in the form of anupturn28,29 of the T -dependence of Hc2, or a possible re-entrantsuperconducting phase27. The resulting state is expected to be asuperconducting phase glass owing to the phase frustration betweendiscs and to mesoscopic fluctuations that arbitrarily aect eachJosephson coupling.
To address these fundamental aspects, we systematicallymeasured the temperature evolution of the magneto-resistanceof the sample in the superconducting phase far from the chargeneutrality point (Vg =30V). Figure 4 presents the whole set of datain the form of a plot showing the colour-coded magneto-resistanceas a function of T and H . The dark blue area indicates vanishinglysmall resistance—that is, the superconducting state—and the othercolours indicate the resistive normal state. Interestingly, we observethat the superconducting phase extends over a wide and continuousrange of magnetic field, which resembles the mixed phase of bulksuperconductors. The temperature evolution of Hc2 from 0.8Kdown to 0.2 K indeed follows closely the theoretical behaviour oftype-II superconductor26, which we have traced as a black line inFig. 4. At this gate voltage, the zero-temperature extrapolation ofthis theoretical fit gives 2.2mT, which is close to full frustrationf = 1 reached at the field value Hc0 =0/S0 = 2.3mT, that is, oneflux quantum per unit cell.
However, inspecting Fig. 4 for T below 0.2 K, we observe thatthe experimental Hc2(T ) curve deviates upwards and shows aresilient superconducting pocket persisting up to 3.3mT. Aperiodicreplicas of dierent sizes, although of finite resistivity, are evenvisible at higher magnetic field. Importantly, in this re-entrantsuperconducting phase, the supercurrent is strongly suppressed
384 NATURE PHYSICS | VOL 10 | MAY 2014 | www.nature.com/naturephysics

NATURE PHYSICS DOI: 10.1038/NPHYS2929 ARTICLES
−15
1.0
0
0
0.0
2
4
T (K)
0.5
15
H (mT)
V g(V)
S
Disorder
Temperature
Mag
netic
fie
ld4.0
3.5
3.0
2.5
2.0
1.5
log(dV/dI)
Figure 5 | Phase diagram of the superconductor-to-metal transition.A 3D-phase diagram showing the superconducting state reconstructedfrom three colour-scaled maps of the array resistance in (Vg,H,T) space.The resistance in (Vg, H) space is measured at 0.06 K. As the gate voltageVg has a direct action on the eective disorder of the graphene mediatingsuperconductivity, this axis has been relabelled accordingly. Notice there-entrance of superconductivity above the first critical field, which can beseen in both the (Vg, H) and (H, T) planes.
in comparison with the main superconducting region at thesame temperature (Supplementary Fig. 5). These observationsagree with the theoretically expected dependence and supportthe existence of a superconducting phase glass state27–29. Suchan experimental demonstration of re-entrant superconductivity inan inhomogeneous 2D superconducting system provides anotherfundamental aspect of proximity-coupled Josephson arrays.
Phase diagram of the quantum superconductor-to-metaltransitionsThe use of graphene here has provided a unique opportunity toexplore in a single device the phase diagram in phase-space variablesT , H and Vg, where Vg is equivalent to disorder, which drive thethermal and the quantum phase transitions to the normal state.Owing to the continuous tuning of disorder through the gate-tunable graphene electron density, we can therefore construct theentire phase diagram of the proximity-coupled Josephson junctionarray. The result shown in Fig. 5 provides a complete picture ofthe experimental temperature, disorder and magnetic field-drivensuperconductor-to-metal transitions addressed in this work.
The similarities to the original phase diagram based on the dirty-boson model41 are striking and show that our proximity-coupledarray behaves in many respects as disordered superconductingthin films. However, the new physical ingredient here relies onthe inhomogeneous nature of superconductivity, which presentsbuilt-in superconducting discs subject to phase fluctuations. Suchinhomogeneities also emerge close to the quantum critical point inamorphous thin films42 in the form of self-induced fluctuations ofthe superconducting state induced by disorder43.
To conclude, our work demonstrates that, by increasing thenormal metal resistance in a proximity-coupled array, strongenhancement of quantum phase fluctuations terminates thesuperconducting state, leading to a metallic state, which markedlysuppresses the critical temperature Tc. The use of graphene as a2D electron gas platform has enabled us to continuously map theentire disorder and magnetic field-driven superconductor-to-metal
transition. This plot evinces the appearance of a re-entrantsuperconductivity in the presence of a magnetic field abovethe critical field, in agreement with the predicted phase glassstate. This system reveals the pronounced impact of quantumfluctuations induced by weak charge quantization in 2Dsuperconducting systems.
MethodsWe used CVD-grown monolayer graphene sheets transferred onto 285 nmoxidized silicon wafer as a 2D diusive metal. As shown in Fig. 1, the sample waspatterned by standard e-beam lithography into a Hall bar geometry (centralsquare area 6 µm2) and contacted with normal leads (Ti/Au bilayers, 5 nm/50 nmthick). The entire graphene surface was then decorated in a second lithographystep by an array of 50-nm-thick Sn discs.
Samples were anchored to the mixing chamber of a 3He–4He dilutionrefrigerator placed inside a shielded cryostat and connected to highly filteredlines. Lossy coaxial lines, capacitive filters and -filters were installed betweenthe measurement apparatus and the mixing chamber stage of the refrigerator tostrongly attenuate electronic noise above 10 kHz. A low-frequency lock-inmeasurement set-up based on the current bias method (2–5 nA input current)was used to measure the dierential resistance while the voltage across thesample was measured with low-noise preamplifiers.
To fit TBKT in the measured data in Fig. 2b, we substituted in equation (1) theJosephson couplings EJ found on the left side of equation (5) in ref. 29, which isthe Josephson energy derived from the collective Josephson coupling in a 2Darray using the Matsubara-space Usadel equation, with the result:
EJ(b,T )=4gTX
!n>0
n
/[2 ln(p
D/2!n/a)]o2
P(p
!n/2ETh) (3)
The above equation (3), together with equation (1), can be reduced to:
6g1X
0
2
ln2(D/2a2!n)P(
p
!n/2ETh)=1 (4)
where ETh =(D/b2) is the Thouless energy of a pair of discs separated bydistance b, a is the diameter of the superconducting discs and !n =T (2n+1) isthe nth Matsubara frequency at temperature T . The functionP(z)=z
R 10 K0(z cosh t)K1(z cosh t)dt , with Kn(x) the MacDonald–Bessel
function. Equation (4) contains only one variable, which is the criticaltemperature T at the BKT transition, as the parameters of g and D can beobtained from measured data. By summing equation (4) (high orders of n do notaect the sum significantly because the function P decays rapidly with increasingn), one gets the dashed line as the unique solution of equation (4) from theexperimentally extracted g and D.
Received 05 October 2013; accepted 25 February 2014;published online 30 March 2014
References1. Goldman, A. M. & Marcovi¢, N. Superconductor–insulator transitions in the
two-dimensional limit. Phys. Today 51, 39–44 (November 1998).2. Dobrosavljevic, V., Trivedi, N. & Valles Jr, J. M. Conductor–Insulator Quantum
Phase Transitions (Oxford Univ. Press, 2012).3. Jaeger, H. M., Haviland, D. B., Orr, B. G. & Goldman, A. M. Onset of
superconductivity in ultrathin granular metal films. Phys. Rev. B 40,182–196 (1989).
4. Allain, A., Han, Z. & Bouchiat, V. Electrical control of thesuperconducting-to-insulating transition in graphene-metal hybrids.Nature Mater. 11, 590–594 (2012).
5. Ephron, D., Yazdani, A., Kapitulnik, A. & Beasley, M. R. Observation ofquantum dissipation in the vortex state of a highly disordered superconductingthin film. Phys. Rev. Lett. 76, 1529–1532 (1996).
6. Mason, N. & Kapitulnik, A. Dissipation eects on thesuperconductor–insulator transition in 2D superconductors. Phys. Rev. Lett. 82,5341–5344 (1999).
7. Mason, N. & Kapitulnik, A. Superconductor–insulator transition in acapacitively coupled dissipative environment. Phys. Rev. B 65,220505(R) (2002).
8. Qin, Y., Vicente, C. L. & Yoon, J. Magnetically induced metallic phase insuperconducting tantalum films. Phys. Rev. B 73, 100505(R) (2006).
9. Aubin, H. et al.Magnetic-field-induced quantum superconductor–insulatortransition in Nb0.15Si0.85. Phys. Rev. B 73, 094521 (2006).
10. Lin, Y-H., Nelson, J. & Goldman, A. M. Suppression of theBerezinskii–Kosterlitz–Thouless transition in 2D superconductors bymacroscopic quantum tunneling. Phys. Rev. Lett. 109, 017002 (2012).
NATURE PHYSICS | VOL 10 | MAY 2014 | www.nature.com/naturephysics 385

ARTICLES NATURE PHYSICS DOI: 10.1038/NPHYS2929
11. Caviglia, A. D. et al. Electric field control of the LaAlO3/SrTiO3 interfaceground state. Nature 456, 624–627 (2008).
12. Biscaras, J. et al.Multiple quantum criticality in a two-dimensionalsuperconductor. Nature Mater. 12, 542–548 (2013).
13. Van der Zant, H. S. J., Fritschy, F. C., Elion, W. J., Geerligs, L. J. & Mooij, J. E.Field-induced superconductor-to-insulator transitions in Josephson-junctionarrays. Phys. Rev. Lett. 69, 2971–2974 (1992).
14. Van der Zant, H. S. J., Elion, W. J., Geerligs, L. J. & Mooij, J. E. Quantum phasetransitions in two dimensions: Experiments in Josephson-junction arrays.Phys. Rev. B 54, 10081–10093 (1996).
15. Abrahams, E., Anderson, P. W., Licciardello, D. C. & Ramakrishnan, T. V.Scaling theory of localization: absence of quantum diusion in twodimensions. Phys. Rev. Lett. 42, 673–676 (1979).
16. Feigel’man, M. V. & Larkin, A. I. Quantum superconductor-metal transition ina 2D proximity coupled array. Chem. Phys. 235, 107–114 (1998).
17. Feigel’man, M. V., Larkin, A. I. & Skvortsov, M. A. Quantum superconductor–metal transition in a proximity array. Phys. Rev. Lett. 86, 1869–1872 (2001).
18. Das, D. & Doniach, S. Existence of a Bose metal at T =0. Phys. Rev. B 60,1261–1275 (1999).
19. Kapitulnik, A., Mason, N., Kivelson, S.A. & Chakravarty, S. Eects ofdissipation on quantum phase transitions. Phys. Rev. B 63, 125322 (2001).
20. Spivak, B., Zyuzin, A. & Hruska, M. Quantum superconductor–metaltransition. Phys. Rev. B 64, 132502 (2001).
21. Phillips, P. & Dalidovitch, D. The elusive Bose metal. Science 302,243–247 (2003).
22. Spivak, B., Oreto, P. & Kivelson, S. A. Theory of quantum metal tosuperconductor transitions in highly conducting systems. Phys. Rev. B 77,214523 (2008).
23. Feigelman, M. V., Kamenev, A., Larkin, A. I. & Skvortsov, M. A. Weak chargequantization on a superconducting island. Phys. Rev. B 66, 054502 (2002).
24. Eley, S., Gopalakrishnan, S., Goldbart, P. M. & Mason, N. Approachingzero-temperature metallic states in mesoscopic superconductor–normal–superconductor arrays. Nature Phys. 8, 59–62 (2012).
25. Geim, A. K. & Novoselov, K. S. The rise of graphene. Nature Mater. 6,183–191 (2007).
26. De Gennes, P. G. Superconductivity of Metals and Alloys(Addison-Wesley, 1989).
27. Spivak, B. & Zhou, F. Mesoscopic eects in disordered superconductors nearHc2. Phys. Rev. Lett. 74, 2800–2003 (1995).
28. Galitski, V. M. & Larkin, A. I. Disorder and quantum fluctuations insuperconducting films in strong magnetic fields. Phys. Rev. Lett. 87,087001 (2001).
29. Feigel’man, M. V., Skvortsov, M. A. & Tikhonov, K. S. Proximity-inducedsuperconductivity in graphene. Pis’ma v ZhETF 88, 780–784 (2008); JETP Lett.88, 747–751 (2008).
30. Kessler, B. M., Girit, C. Ö, Zettl, A. & Bouchiat, V. Tunable superconductingphase transition in metal-decorated graphene sheets. Phys. Rev. Lett. 104,047001 (2010).
31. Resnick, D. J., Garland, J. C., Boyd, J. T., Shoemaker, S. & Newrock, R. S.Kosterlitz–Thouless transition in proximity-coupled superconducting arrays.Phys. Rev. Lett. 47, 1542–1545 (1981).
32. Abraham, D. W., Lobb, C. J., Tinkham, M. & Klapwijk, T. M. Resistivetransition in two-dimensional arrays of superconducting weak links.Phys. Rev. B 26, 5268–5271 (1982).
33. Huard, B., Stander, N., Sulpizio, J. A. & Goldhaber-Gordon, D. Evidence of therole of contacts on the observed electron–hole asymmetry in grapheme.Phys. Rev. B 78, 121402(R) (2008).
34. Berezinskii, V. L. Violation of long range order in one-dimensional andtwo-dimensional systems with a continuous symmetry group: I Classicalsystems. Zh. Eksp. Teor. Fiz. 59, 907–920 (1970); Sov. Phys. JETP 32,493–500 (1971).
35. Kosterlitz, J. M. & Thouless, D. Ordering, metastability and phase transitions intwo-dimensional systems. J. Phys. C 6, 1181–1203 (1973).
36. Aslamazov, L. G. & Larkin, A. I. Eect of fluctuations on the properties of asuperconductor above the critical temperature. Fiz. Tv. Tela 10, 1104–1111(1968); Sov. Phys. Solid State 10, 875–880 (1968).
37. Maki, K. Critical fluctuation of the order parameter in a superconductor.Progr. Theor. Phys. 40, 193–200 (1968).
38. Thompson, R. S. Microwave, flux flow, and fluctuation resistance of dirtyType-II superconductors. Phys. Rev. B 1, 327–333 (1970).
39. Al’tshuler, B. L. & Spivak, B. Z. Mesoscopic fluctuations in asuperconductor-normal metal-superconductor junction. Zh. Eksp. Teor. Fiz. 92,609–615 (1987); Sov. Phys. JETP 65, 343–347 (1987).
40. Den Hartog, S. G. et al. Sample-specific conductance fluctuations modulatedby the superconducting phase. Phys. Rev. Lett. 76, 4592–4595 (1996).
41. Fisher, M. P. A. Quantum phase transitions in disordered two-dimensionalsuperconductors. Phys. Rev. Lett. 65, 923–926 (1990).
42. Finkel’shtein, A.M. Superconducting transition temperature in amorphousfilms. Pisma ZhETF 45, 37–40 (1987); JETP Lett. 45, 46–49 (1987).
43. Skvortsov, M. A. & Feigel’man, M. V. Superconductivity in disordered thinfilms: giant mesoscopic fluctuations. Phys. Rev. Lett. 95, 057002 (2005).
AcknowledgementsSamples were fabricated at the NANOFAB facility of the Néel Institute, the technical teamof which has been of critical help for this work. We thank D. Shahar for valuablediscussions and comments on the manuscript. We thank N. Bendiab, H. Bouchiat,C. Chapelier, J. Coraux, C. O. Girit, B. M. Kessler, L. Marty, A. Reserbat-Plantey andA. Zettl for stimulating discussions. This work is financially supported by ANR-BLANCprojects SuperGraph, TRICO and Cleangraph, and DEFI Nano ERC Advanced GrantMolNanoSpin. Z.H. and H.A-T. acknowledge PhD grant support from the Cible programof Région Rhone-Alpes and from Nanosciences Foundation Grenoble respectively. Theresearch of M.F. is partially supported by RFBR grant no 13-02-00963.
Author contributionsZ.H., A.A., M.F., B.S. and V.B. conceived and designed the experiments. Z.H., H.A-T. andV.B. performed the experiments. Z.H., B.S., K.T., A.A. and M.F. contributed to thematerials/analysis tools. Z.H., B.S., M.F., K.T. and V.B. analysed the data and wrotethe paper.
Additional informationSupplementary information is available in the online version of the paper. Reprints andpermissions information is available online at www.nature.com/reprints.Correspondence and requests for materials should be addressed to V.B.
Competing financial interestsThe authors declare no competing financial interests.
386 NATURE PHYSICS | VOL 10 | MAY 2014 | www.nature.com/naturephysics


![Real Arnold complexity versus real topological entropy for ...perso.neel.cnrs.fr/jean-christian.angles-dauriac/54-realarnold.pdf · The Arnold complexity [5], which corresponds (at](https://img.dokumen.tips/doc/110x75/5e6af0aabd322b687125c935/real-arnold-complexity-versus-real-topological-entropy-for-personeelcnrsfrjean-.jpg)