Embed Size (px)
Citation preview

BSR | CCWG 2015 Collaborative Progress Report 0
Collaborative Progress
Clean Cargo Working Group (CCWG)
2016 Progress Report
FEBRUARY 2017

BSR | CCWG 2016 Collaborative Progress Report 1
About This Report
This report presents Clean Cargo Working Group’s (CCWG) activities and developments over its 13-year history, with a focus on achievements from the past year since our most recent CCWG Progress Report. The information contained in this report is limited to the activities of the current group membership, and the data presented is limited to the carrier membership reporting in the given year stated. This report is written with a range of readers in mind, including shipping customers, transportation providers, freight forwarders, industry associations, regulatory bodies, NGOs, academics, and the general public. This report was drafted by BSR, the secretariat and facilitator of the Clean Cargo Working Group. Please direct all comments to [email protected].
Contents
About Clean Cargo Working Group 2
2015-2016 Performance Highlights 6
2015 Annual Trade Lane CO2 Emissions Factors 7
CCWG Climate Statement and Call to Action 8
2015-2016 Progress Against Objectives and 2017 Commitments 9
Lloyds Register Verification Statement 10
Join Us 12

BSR | CCWG 2016 Collaborative Progress Report 2
About Clean Cargo Working Group (CCWG)
CCWG is a leadership initiative involving major brands, cargo carriers, and freight
forwarders dedicated to reducing the environmental impacts of global goods
transportation and promoting responsible shipping.
The Value of Green Freight Collaboration Freight transport fuels the global economy and drives economic development in many regions. It also
contributes to social and environmental impacts—including 7 percent of global greenhouse gas
emissions1—that no single company or government can address alone. Collaboration is needed to scale
sustainable and economical solutions across the logistics value chain. CCWG is one of the longest-
running green freight collaborations, representing 85 percent of ocean container shipping volume.
Our Vision CCWG members share a vision of a container shipping industry that is a responsible part of sustainable
supply chains, supporting clean oceans, healthy port communities, and global climate goals.
We pursue this vision through four main work streams, which make up CCWG’s Mission:
1 According to an estimate by the International Transport Forum and OECD, available here.
Measuring, reporting, and
evaluating environmental
performance data in marine
container transport
Sharing best practices
Supporting responsible
corporate engagement with
stakeholders on public
policy
Catalyzing and partnering
on projects that drive
sustainability performance
improvement

BSR | CCWG 2016 Collaborative Progress Report 3
Where We Come From
CCWG has met several major milestones over its 13-year history:
How We Work
The work of CCWG builds sustainable global supply chains and enables the ocean container freight
industry to credibly measure and report on its environmental performance. As more global companies that
ship goods around the world consider how to reduce the environmental impact of their transport and
logistics networks, the availability of credible data and easy-to-use tools are increasingly important.
CCWG members know that measuring and reporting is only the beginning. Business partners need to
engage in meaningful dialogue about how the environmental performance of moving cargo can be
improved over time. That is why CCWG provides a network where:
» Peer group companies can share best practices for integrating environmental criteria into business
decision-making processes and supplier-selection procedures.
» Shipping customers can directly engage with their transportation providers to build appropriate
environmental expectations into supplier relationships.
» Shipping customers use CCWG as a one-stop shop to understand and influence developments in
methodology across the transport supply chain, enabling them to use resources more effectively.
» Members work together to refine the methodology and improve their performance management
tools collaboratively.
Furthermore, CCWG continues to play an important role engaging with experts and influencers about
methodology, reporting, and verification (MRV) developments at regional and global levels as the
European Union and other MRV systems come into place in the maritime industry.

BSR | CCWG 2016 Collaborative Progress Report 4
CCWG Membership Benefits
As a member you have access to the following:
MEASUREMENT AND REPORTING TOOLS » CCWG Environmental Performance Survey (EPS): The EPS covers a series of qualitative
questions on carriers’ environmental focus areas.
» CCWG Intermodal Carbon Calculator: This CO2 emissions calculation tool covers the whole
transportation supply chain. Updated versions are issued annually, and training is available.
» CCWG Scorecard: The Scorecard is a tool that enables container shipping customers to
benchmark carriers’ performance on a broad range of environmental impacts (e.g., CO2, SOx, and
NOx; chemical use; and wastes) of the carriers’ operated fleets, including charter vessels. The
scorecard is updated every year with the latest performance data for each CCWG carrier.
» CCWG Verification Protocol: Carriers independently verify CO2 and SOx performance data based
on a standardized framework. Audits are conducted to a limited level of assurance.
STANDARDIZED, INDUSTRY-APPROVED METHODOLOGIES The CCWG CO2 methodology is tailor-made for container shipping. Based on actual fuel consumed,
actual distance traveled, and the maximum capacity of the vessel, the CCWG CO2 methodology provides
emissions data in grams of CO2 per container per kilometer. In 2015, Clean Cargo Working Group
released a report detailing the CO2 Emission Accounting Methodology that has been used by the group to
standardize emissions reporting with a majority of the industry for years.
ACCESS TO BEST-PRACTICE SHARING Through in-person meetings, webinars, case studies, and other means of interaction, CCWG promotes
the sharing of best practices between shipping customers, freight forwarders, and ocean transport
providers. In 2013 CCWG published a report entitled “How CCWG Shippers Use, Integrate, and Benefit
from Ocean Transport Emissions Data,” and in 2015 CCWG published a guide entitled “How to Calculate
and Manage CO2 Emissions from Ocean Transport.” Members have exclusive access to best-practice
case studies, webinars, and in-person meetings. All are based on leading practices from our members.
The group regularly reports on other outputs for the general public to raise awareness and encourage
more companies to consider how to reduce the environmental impact of their transport and logistics
networks.
ENGAGEMENT WITH OTHER GREEN FREIGHT INITIATIVES As one of the longest-running initiatives with the widest industry representation, CCWG is the ocean
shipping standard used by other initiatives such as the U.S. EPA’s SmartWay Program and the Global
Logistics Emissions Council (GLEC) Framework for Logistics Emissions Methodologies. We provide
guidance to and engagement with many other global green freight initiatives on behalf of our members,
and constantly work to ensure harmonization and progress among them.
.

BSR | CCWG 2016 Collaborative Progress Report 5
2015–2016 Performance Highlights CCWG’s data collection process for 2015 show2:
2 Chart orientation: Green indicates performance improvement on a trade lane, red indicates decline in performance from previous year reported. Square is an intercontinental trade lane, circle is an intracontinental trade lane. Top number is an emissions factor, bottom number is a percent change. Full list of trade lanes and emission factors on following page.
CCWG gathers environmental data for approximately
3,300 container vessels
24 of 25 trade lanes show CO2 annual emissions improvements
CCWG carriers represent about
85% of global ocean container capacity*
11 of 23 CCWG carriers verified CO2 and SOx data in 2015
16.6 million
TEU (twenty-foot equivalent unit) container capacity carried
34.9%
CO2 emissions decrease on average since 2009
BSR | CCWG 2016 Collaborative Progress Report 6
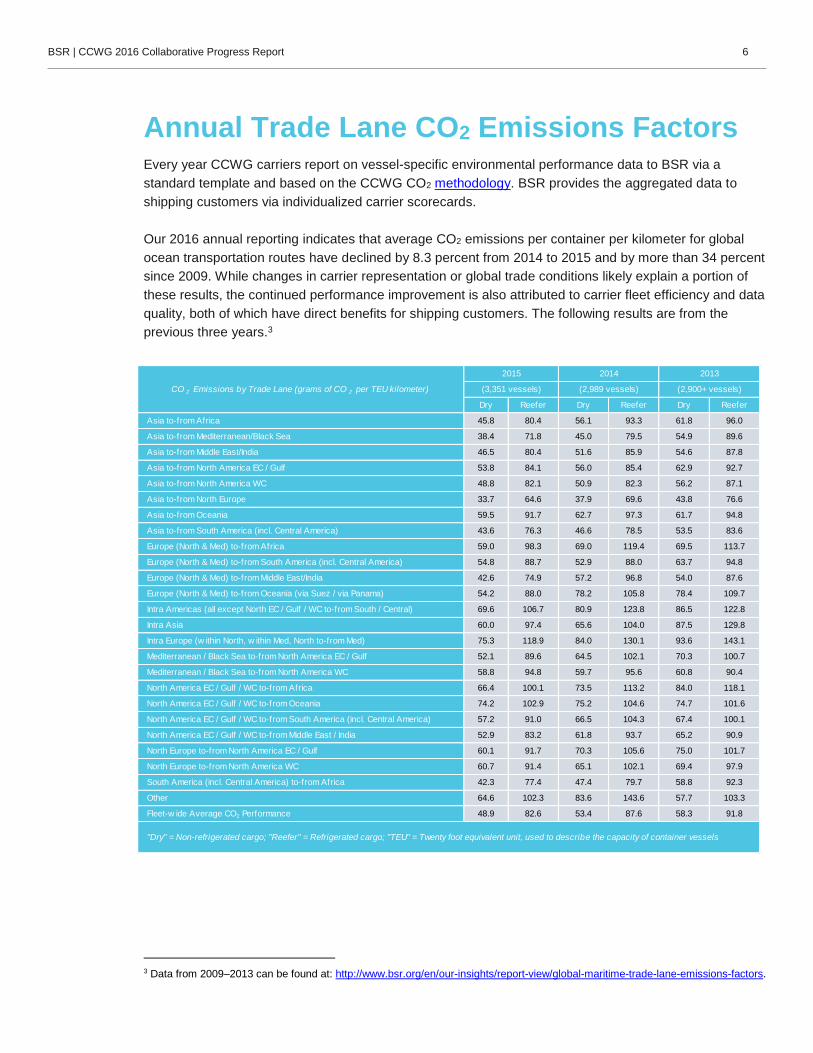
Annual Trade Lane CO2 Emissions Factors Every year CCWG carriers report on vessel-specific environmental performance data to BSR via a
standard template and based on the CCWG CO2 methodology. BSR provides the aggregated data to
shipping customers via individualized carrier scorecards.
Our 2016 annual reporting indicates that average CO2 emissions per container per kilometer for global
ocean transportation routes have declined by 8.3 percent from 2014 to 2015 and by more than 34 percent
since 2009. While changes in carrier representation or global trade conditions likely explain a portion of
these results, the continued performance improvement is also attributed to carrier fleet efficiency and data
quality, both of which have direct benefits for shipping customers. The following results are from the
previous three years.3
3 Data from 2009–2013 can be found at: http://www.bsr.org/en/our-insights/report-view/global-maritime-trade-lane-emissions-factors.
Dry Reefer Dry Reefer Dry Reefer
Asia to-from Africa 45.8 80.4 56.1 93.3 61.8 96.0
Asia to-from Mediterranean/Black Sea 38.4 71.8 45.0 79.5 54.9 89.6
Asia to-from Middle East/India 46.5 80.4 51.6 85.9 54.6 87.8
Asia to-from North America EC / Gulf 53.8 84.1 56.0 85.4 62.9 92.7
Asia to-from North America WC 48.8 82.1 50.9 82.3 56.2 87.1
Asia to-from North Europe 33.7 64.6 37.9 69.6 43.8 76.6
Asia to-from Oceania 59.5 91.7 62.7 97.3 61.7 94.8
Asia to-from South America (incl. Central America) 43.6 76.3 46.6 78.5 53.5 83.6
Europe (North & Med) to-from Africa 59.0 98.3 69.0 119.4 69.5 113.7
Europe (North & Med) to-from South America (incl. Central America) 54.8 88.7 52.9 88.0 63.7 94.8
Europe (North & Med) to-from Middle East/India 42.6 74.9 57.2 96.8 54.0 87.6
Europe (North & Med) to-from Oceania (via Suez / via Panama) 54.2 88.0 78.2 105.8 78.4 109.7
Intra Americas (all except North EC / Gulf / WC to-from South / Central) 69.6 106.7 80.9 123.8 86.5 122.8
Intra Asia 60.0 97.4 65.6 104.0 87.5 129.8
Intra Europe (w ithin North, w ithin Med, North to-from Med) 75.3 118.9 84.0 130.1 93.6 143.1
Mediterranean / Black Sea to-from North America EC / Gulf 52.1 89.6 64.5 102.1 70.3 100.7
Mediterranean / Black Sea to-from North America WC 58.8 94.8 59.7 95.6 60.8 90.4
North America EC / Gulf / WC to-from Africa 66.4 100.1 73.5 113.2 84.0 118.1
North America EC / Gulf / WC to-from Oceania 74.2 102.9 75.2 104.6 74.7 101.6
North America EC / Gulf / WC to-from South America (incl. Central America) 57.2 91.0 66.5 104.3 67.4 100.1
North America EC / Gulf / WC to-from Middle East / India 52.9 83.2 61.8 93.7 65.2 90.9
North Europe to-from North America EC / Gulf 60.1 91.7 70.3 105.6 75.0 101.7
North Europe to-from North America WC 60.7 91.4 65.1 102.1 69.4 97.9
South America (incl. Central America) to-from Africa 42.3 77.4 47.4 79.7 58.8 92.3
Other 64.6 102.3 83.6 143.6 57.7 103.3
Fleet-w ide Average CO2 Performance 48.9 82.6 53.4 87.6 58.3 91.8
"Dry" = Non-refrigerated cargo; "Reefer" = Refrigerated cargo; "TEU" = Twenty foot equivalent unit, used to describe the capacity of container vessels
CO 2 Emissions by Trade Lane (grams of CO 2 per TEU kilometer)
2015 2014 2013
(3,351 vessels) (2,989 vessels) (2,900+ vessels)

BSR | CCWG 2016 Collaborative Progress Report 7
CCWG Climate Statement and Call to Action In December 2015, governments representing 196 countries and 98.7 percent of greenhouse gas
emissions agreed to limit global temperature increase to “well below 2˚C” above preindustrial
temperatures in an agreement that went into force November 4, 2016.4 The agreement sets out a global
emissions trajectory to achieve this goal.5 Governments have already submitted national climate plans as
their first step along this path, but some key sectors, such as shipping, have not yet defined their role in
reaching the global climate goal.
Members of CCWG agreed on a Climate Statement and a Call to Action for the container shipping sector
and its value chain at a member meeting in October 2016. Today, CCWG represents 85 percent of global
ocean container shipping volume and over a dozen important shipping customers. The statement
declares the intention of the container shipping industry to play its part in limiting global temperature rise
to well below 2˚C, acknowledges its part as a low-carbon freight solution and partner in emissions
reductions, and calls on other global freight transport stakeholders to pursue ambitious emissions
reductions.
Climate change is one of the most pressing challenges of our time.
Members of the Clean Cargo Working Group support the global climate
goal, which affirms the importance of keeping a global temperature
increase well below 2°C. Meeting this target will involve deep global
greenhouse gas emissions reductions.
Ocean shipping is one of the lowest-emission forms of global freight
movement, and members of CCWG have already reduced emissions per
TEU-km by around 30 percent from 2011-2015. However, we recognize
that further industry-wide action is required to maintain progress in the
transition to low-carbon global logistics supply chains.
We are committed to doing our part, and we cannot do it alone. We need
increased ambition, collaboration, and action by carriers, shippers,
forwarders, energy and technology providers, and policymakers to enable
low-carbon solutions.
4 A total of 196 countries signed the Paris Agreement, including 188 countries that submitted national plans covering 98.7 percent of global emissions.
5 Paris Agreement, Article 4.1.
BSR | CCWG 2016 Collaborative Progress Report 8
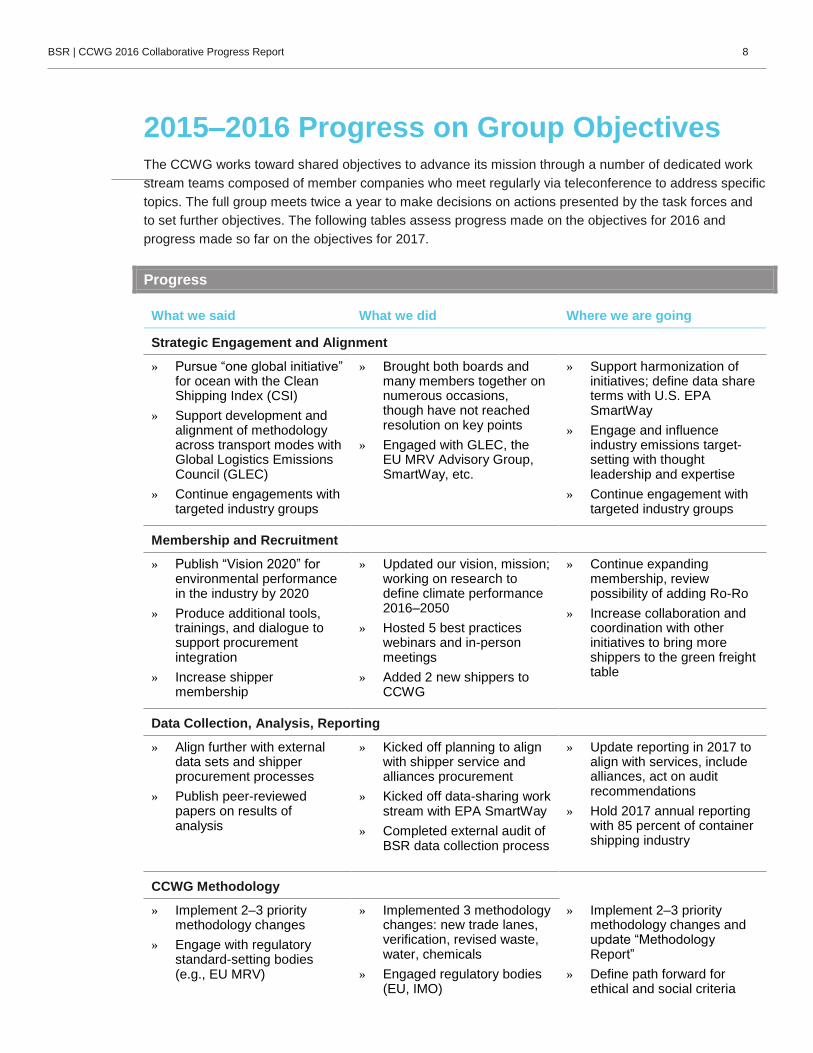
2015–2016 Progress on Group Objectives The CCWG works toward shared objectives to advance its mission through a number of dedicated work
stream teams composed of member companies who meet regularly via teleconference to address specific
topics. The full group meets twice a year to make decisions on actions presented by the task forces and
to set further objectives. The following tables assess progress made on the objectives for 2016 and
progress made so far on the objectives for 2017.
Progress
What we said What we did Where we are going
Strategic Engagement and Alignment
» Pursue “one global initiative” for ocean with the Clean Shipping Index (CSI)
» Support development and alignment of methodology across transport modes with Global Logistics Emissions Council (GLEC)
» Continue engagements with targeted industry groups
» Brought both boards and many members together on numerous occasions, though have not reached resolution on key points
» Engaged with GLEC, the EU MRV Advisory Group, SmartWay, etc.
» Support harmonization of initiatives; define data share terms with U.S. EPA SmartWay
» Engage and influence industry emissions target-setting with thought leadership and expertise
» Continue engagement with targeted industry groups
Membership and Recruitment
» Publish “Vision 2020” for environmental performance in the industry by 2020
» Produce additional tools, trainings, and dialogue to support procurement integration
» Increase shipper membership
» Updated our vision, mission; working on research to define climate performance 2016–2050
» Hosted 5 best practices webinars and in-person meetings
» Added 2 new shippers to CCWG
» Continue expanding membership, review possibility of adding Ro-Ro
» Increase collaboration and coordination with other initiatives to bring more shippers to the green freight table
Data Collection, Analysis, Reporting
» Align further with external data sets and shipper procurement processes
» Publish peer-reviewed papers on results of analysis
» Kicked off planning to align with shipper service and alliances procurement
» Kicked off data-sharing work stream with EPA SmartWay
» Completed external audit of BSR data collection process
» Update reporting in 2017 to align with services, include alliances, act on audit recommendations
» Hold 2017 annual reporting with 85 percent of container shipping industry
CCWG Methodology
» Implement 2–3 priority methodology changes
» Engage with regulatory standard-setting bodies (e.g., EU MRV)
» Implemented 3 methodology changes: new trade lanes, verification, revised waste, water, chemicals
» Engaged regulatory bodies (EU, IMO)
» Implement 2–3 priority methodology changes and update “Methodology Report”
» Define path forward for ethical and social criteria

.
Page 1 of 3
LRQA Independent Assurance Statement Relating to BSR’s processes for Clean Cargo Working Group data collection and analysis This Assurance Statement has been prepared for BSR in accordance with our contract but is intended for the readers of this Report.
Terms of engagement Lloyd’s Register Quality Assurance (LRQA) was commissioned by BSR to provide independent assurance on its processes for Clean Cargo Working Group (CCWG) data collection and analysis “the processes” to a limited level of assurance and a materiality of the professional judgement of the Verifier using LRQA’s verification procedure. LRQA’s verification procedure is based on current best practice, is in accordance with ISAE 3000 and uses the principles of AA1000AS (2008) - inclusivity, materiality, responsiveness and reliability of performance data.
Our assurance engagement covered BSR’s processes and specifically the following activities:
CCWG carrier data entry;
CCWG carrier data revision and gap analysis; and
CCWG data aggregation and anonymization.
Our assurance engagement excluded the data and information of BSR’s suppliers, contractors and any third-parties.
LRQA’s responsibility is only to BSR. LRQA disclaims any liability or responsibility to others as explained in the end footnote. BSR’s responsibility is for collecting, aggregating, analysing and presenting all the CCWG data and information and for maintaining effective internal controls over the systems from which the resultant data is derived. Ultimately, the CCWG data has been approved by, and remains the responsibility of BSR.
LRQA’s Opinion Based on LRQA’s approach, except for the effect of the matters described in the Basis for Qualified Opinion, nothing has come to our attention that would cause us to believe that BSR has not, in all material respects:
Disclosed accurate and reliable performance data and information as no material errors or omissions were detected; and
Covered all the issues that are important to the stakeholders and readers of this report.
The opinion expressed is formed on the basis of a limited level of assurance and at the materiality of the professional judgement of the verifier.
Note: The extent of evidence-gathering for a limited assurance engagement is less than for a reasonable assurance engagement. Limited assurance engagements focus on aggregated data rather than physically checking source data at sites. Consequently, the level of assurance obtained in a limited assurance engagement is substantially lower than the assurance that would have been obtained had a reasonable assurance engagement been performed.
Basis for Qualified Opinion BSR have:
Not applied individual emission factors for different fuels consumed as is inferred in their methodology document. The emission factor for Heavy Fuel Oil has been applied to the consumption of Marine Gas Oil/Marine Diesel Oil. This results in an under-reporting of emissions for all carriers and does not accurately represent those with differing fuel consumption ratios;
Not followed the defined scoring methodology for Sulphur Oxides (SOx). Points are assigned in comparison to a CCWG average emissions factor for each trade lane, as opposed to the defined methodology whereby points are assigned in comparison to a CCWG average SOx emissions factor;

.
Page 2 of 3
Applied equivalent scores to Energy Management System certification as Environmental Management System (EMS) certification; and
Not retained records to demonstrate the assumptions used for TEU per reefer plug, average reefer plug power consumption, and average reefer plug utilisation, within the carbon calculation.
The above items are not considered to present a material misstatement.
Recommendations BSR should:
Consider the application of fuel specific emission factors in future years calculations, and document their decided methodology consistently;
Ensure that the scoring methodology is amended to accurately reflect the methodology applied;
Document which standards are deemed acceptable to obtain full scores for the EMS category;
Fully document and control quality assurance procedures that cover the CCWG data collation and analysis specific activities to ensure consistency, accuracy and quality control of the processes going-forward. In particular, including reference documents for all formulae and entry restrictions within the Turnkey platform; and
Fully cite all calculations and assumptions used in documented methodologies. Where these are no longer available, recalculations should be conducted in order to demonstrate that they remain accurate and current.
LRQA’s approach LRQA’s assurance engagements are carried out in accordance with our verification procedure. The following tasks though were undertaken as part of the evidence gathering process for this assurance engagement:
Interviewing company representatives key to the processes for data collection and analysis;
Checking that source data is appropriate and correctly transposed into the Turnkey platform;
Checking that calculation flows are appropriate and calculations consistent and logical; and
Confirming that outputs are a correct representation of the results calculated.
LRQA’s standards, competence and independence LRQA implements and maintains a comprehensive management system that meets accreditation requirements for ISO 14065 Greenhouse gases – Requirements for greenhouse gas validation and verification bodies for use in accreditation or other forms of recognition and ISO/IEC 17021 Conformity assessment – Requirements for bodies providing audit and certification of management systems that are at least as demanding as the requirements of the International Standard on Quality Control 1 and comply with the Code of Ethics for Professional Accountants issued by the International Ethics Standards Board for Accountants.
LRQA ensures the selection of appropriately qualified individuals based on their qualifications, training and experience. The outcome of all verification and certification assessments is then internally reviewed by senior management to ensure that the approach applied is rigorous and transparent.
Signed Dated: 5th October 2016
Madlen King, LRQA Lead Verifier On behalf of Lloyd’s Register Quality Assurance Limited 1 Trinity Park, Bickenhill Lane, Birmingham, B37 7ES, UK LRQA reference: LRQ00000879

BSR | CCWG 2016 Collaborative Progress Report 11
Join Us! CCWG MEMBERSHIP 2016
For more information On behalf of the Clean Cargo Working Group, we hope this report has expanded your understanding of
CCWG and our goals and objectives.
CCWG membership is open to any carrier, freight forwarder, or shipping customer in the maritime
shipping supply chain that is committed to the CCWG membership principles. CCWG encourages all
companies that operate or purchase ocean transportation services to adopt and use the CCWG
Scorecard as the most accurate measure of ocean container carrier environmental performance.
If you are interested in joining our work and benefiting from our ready-made tools and data, we encourage
you to contact BSR, the CCWG secretariat: [email protected].
For more information about us, please visit the CCWG website at
http://www.bsr.org/en/collaboration/groups/clean-cargo-working-group.

BSR | CCWG 2016 Collaborative Progress Report 12
www.bsr.org
About BSR
BSR is a global nonprofit organization that works with its network of more than
250 member companies and other partners to build a just and sustainable world.
From its offices in Asia, Europe, and North America, BSR develops sustainable
business strategies and solutions through consulting, research, and cross-sector
collaboration. Visit www.bsr.org for more information about BSR’s 25 years of
leadership in sustainability.


![Presentation core value_2_(final)[show2]](https://img.dokumen.tips/doc/110x75/54862f96b4af9f8c628b4b00/presentation-core-value2finalshow2.jpg)