Embed Size (px)
DESCRIPTION
Collaborative Assessment
Citation preview

Quantitative Data Key Observations Key Questions
Collaborative Assessment on Current Health Services Gaps and Barriers to Care
Purpose Participants Population Info
Please click on area of care to see collected data, observations, or questions.
Hospitalization & Emergency Services
Hospitalization & Emergency Services
Hospitalization & Emergency Services
Maternity & Newborn Care Maternity & Newborn Care Maternity & Newborn Care
Mental Health & Substance Use Disorder Services
Oral Health
Prescription Drugs
Primary and Preventative Care
Specialty Care
Vision
Mental Health & Substance Use Disorder Services
Mental Health & Substance Use Disorder Services
Oral Health Oral Health
Prescription Drugs Prescription Drugs
Primary and Preventative Care
Primary and Preventative Care
Specialty Care Specialty Care
Vision Vision

Overall Population Quantitative Assessment
Columbus
a. 2011 population estimate = 797,434
b. 12.6% language other than English spoken at home, pct age 5+
c. 61,000 children live in poverty, and 29,000 children are in extreme poverty.
d. 19,000 children speak a language other than English at home.
Franklin County
a. 2011 population estimate = 1,178,799
b. 11.1% language other than English spoken at home, pct age 5+
c. Single adults require an annual income of $17,652 ($8.36/hour) to be self-sufficient,
while a family with two adults and two children require $49,818 (11.79/hour).
d. 18.9% of adults, and 4.5% of children are uninsured.
e. 18% average monthly Medicaid enrollment among residents.
f. $6,933 mean cost of coverage per Medicaid enrollee per year during 2009.
g. 208 expected relative cost of the fee-for-service population compared to the average
cost of all enrollees statewide (set to 100)
h. 52.4% of total Medicaid costs were incurred by the top 5% of enrollees during 2009. i. Average life expectancy for males in 2009 was 74.4, and females was 79.3.
These were 4.2, and 3.7 years behind the top counties in the state, respectively. In 2000 males were expected to live 73.4 years, and females 78.2.
j. 85,000 adults have been diagnosed with diabetes. k. There are roughly 97,680 adults and 37,857 children in Franklin County
who are living with asthma. l. 21% of population is enrolled in Medicaid.
m. 16.9% of population received food stamps.
n. 13.1% of the population are dependent on income supports.
o. 88.6% residents have H.S. or higher education, and 36.1% have Bachelor’s or higher.
p. 10% of adults aged 20 and above have diagnosed diabetes
q. 38% of children are enrolled in Medicaid.
r. 13% of the adult population lacks basic literacy skills.
s. 19% of population is below federal poverty level
t. Median household income = $51,246
u. 256,054 unique individuals enrolled in Medicaid (all plans) during 2009
v. 84.3% of Medicaid enrollees had one or more paid claims in FY2009
w. 54:1 ratio of Medicaid enrollees to Medicaid accepting physicians
x. 52 adults (age 19-64) with asthma diagnoses on Medicaid, per 1,000.
y. 55 children (age 0-18) with asthma diagnoses on Medicaid, per 1,000.
z. The vulnerable population will increase by 11% by 2018, and is growing at a rate
faster than the general population.
aa. 3,955 children in foster care.
bb. 91 adults (age 19-64) with diabetes diagnoses on Medicaid, per 1,000
cc. 3.5 children (age 0-18) with diabetes diagnoses on Medicaid, per 1,000.
dd. 3.9% of Medicaid enrollees received community waiver services during 2009.
ee. 47,500 individuals aged 16+ were unemployed during September.
ff. 78,390 adults (age 25+) have not graduated from high school.
gg. 101,639 renter households who were cost burdened, paying 30% or more of their
income for housing costs.
hh. 790,000 persons who had food requests at Franklin County pantries supplied by Mid-
Ohio Foodbank.
ii. 14,963 residents (age 5-64) had a hearing difficulty.
jj. 52,261 single-parent headed households with children.
kk. 1 out of every 5 residents qualifies as poor.
Columbus
a-b US Census Bureau
c-d 2011 Annie E. Casey Foundation
Franklin County
a-b US Census Bureau
c. 2008 Ohio Association of Community Action Agencies
d. 2008 Ohio Family Health Survey
e-h 2010 Health Policy Institute of Ohio
i. 2012 Institute for Health Metrics and Evaluation
j. 2009 Community Research Partners
k. 2012 Ohio Department of Health
l-n 2008 Department of Job and Family Services
o-p 2010 Robert Wood Johnson Foundation
q-y 2011 Health Policy Institute of Ohio
z. 2008 Community Research Partners
aa. 2010 Annie E. Casey Foundation
bb-dd 2010 Health Policy Institute of Ohio
ee-ff 2011 Community Research Partners
gg-kk 2011 Community Research Partners
1 of 3

Overall Population Quantitative Assessment
Hospital Referral Region
a. 82.7% of adults (18-64) are insured.
b. 85.2% of adults reported no cost-related problem seeing a doctor when they needed
to within the past year.
Ohio
a. Nearly 1.3 million non-elderly Ohioans in 2010 reported having unmet health needs
due to cost, an increase of 4.5% since 2000.
b. Thirty percent of non-elderly Ohioans (ages 0-64) with incomes below 200% of the
federal poverty level are uninsured, compared to 16% of all non-elderly Ohioans.
c. 33.3% of children are overweight or obese.
d. 65.7% of adults are overweight or obese.
e. 12% of Ohio adults (age 21-64) reported having a disability.
f. $7,076 health care expenditures per capita.
g. 455,669 patients were seen by FQHC’s in 2010.
h. 66.2% of children reported having a medical home.
i. 4.9% (23,900) of 2011 patients were best served in a language other than English.
j. There are an average of 160 asthma related deaths per year.
k. 13.6% of adults have been diagnosed with asthma.
l. Those making under $15,000 per year are more than twice as likely to have asthma
as those earning over $50,000.
m. 16% (1,550,500) Ohioans are uninsured.
n. Total annual Medicaid spending across all Ohio agencies is $15,392,264,438.
o. 17% (1,947,951) enrolled in Medicaid in an average month.
p. ACA-funded high-risk pools have provided coverage to 2,819 Ohioans, as of June 30,
2012.
q. 51% of Ohioans are covered by employer-sponsored insurance.
r. 84% of insured adult Ohioans had a usual source of care, compared to only 51% of
uninsured Ohioans.
s. In the past five years, diabetes increased from 7.7 percent to 10.1 percent of adults.
There are now 889,000 adults with diabetes in Ohio.
t. 5,760 physicians and healthcare professionals have committed to using EHRs in their
practices, clinics and hospitals. That is the highest total of any state in the nation.
u. 94% of adults report that the last time they needed a check-up or routine medical care
they did not have difficulty getting an appointment with their doctor or clinic. Most adults
(74%) reported that it took less than a week to get a routine medical appointment with
their doctor or clinic.
v. Health care spending totaled $89 billion in 2008 and could reach $200 billion by 2018
w. In the past year, the percentage of children in poverty increased from 18.7 percent to
22.9 percent of persons under age 18.
x. In the past five years, the rate of uninsured population increased from 11.0 percent to
13.7 percent.
y. In the past ten years, obesity increased from 21.5 percent to 29.7 percent of adults,
with more than 2.6 million adults in the state who are now obese.
z. Obesity is more prevalent among non-Hispanic blacks at 40.8 percent than non-
Hispanic whites at 28.7 percent and Hispanics at 32.5 percent.
aa. 15.3 percent of non-Hispanic blacks have diabetes compared to 12.6 percent of
Hispanics and 9.4 percent of non-Hispanic whites.
bb. to 12.6 percent of Hispanics and 9.4 percent of non-Hispanic whites.
cc. More than 1.6 million adults (19%) reported that they had to change their life
significantly in the last 12 months to pay medical bills.
dd. 58% of uninsured adults have some medical debt, compared with 38% of insured
adults.
ee. The rate of unpaid debt greater than $2,000 was more than three times higher for
Ohioans reporting fair or poor health status (33%) as it was for those reporting
excellent or very good health (10%).
ff. The large majority of Ohio adults (76%) were able to get an urgent care appointment
with their doctors the same day (38%) or within one (26%) or two days (12%).
Hospital Referral Region
a-b 2012 Commonwealth Fund Local Scorecard
Ohio
a. 2010 Robert Wood Johnson Foundation
b-h 2012 Kaiser Family Foundation
i. 2011 Health Resources and Services Administration
j-I 2012 Ohio Department of Health
m-q 2011 Health Policy Institute of Ohio
r. 2012 Ohio Department of Health
s. 2011 United Health Foundation
t. 2011 Ohio Health Information Partnership
u. 2012 Health Foundation of Greater Cincinnati
v. 2010 Ohio Chamber of Commerce
w-ff 2011 United Health Foundation
2 of 3

Overall Population
Quantitative Assessment
Ohio
a. It is estimated that between 2005-2010, 4,496 deaths resulted from lack of health coverage. 907 of those were in 2010 alone.
b. Uninsured adults (17%) reported having trouble getting an urgent appointment with their doctor or clinic at more than double the rate that insured Ohio adults (7%)
reported having trouble getting an urgent appointment.
c. From 2006-2007 to 2010-2011, Ohioans saw a 8% drop in employer-sponsored (ESI) coverage, while the number of uninsured increased 30% and the number
enrolled in Medicaid increased 19%.
d. In 2010, the unemployment rate was 9.6%, while the uninsured rate was 12.9%.
e. Although nearly 8 in 10 Medicaid enrollees is a child or parent, their care accounts for less than a third of all Medicaid expenditures.
f. 67.5% of Medicaid expenditures were for ABD enrollees, who represent 20.1% of all enrollees.
g. 34.6% of school-aged children are overweight/obese
h. It is estimated that 268,671 adults have undiagnosed diabetes.
i. Diabetes costs the state $5.9 billion annually.
j. 3,561 deaths were directly attributed to diabetes during 2008. Diabetes was most likely responsible for more deaths, but was not listed as underlying cause on death
certificate.
a. 2012 Institute of Medicine b. 2012 Health Foundation of Greater Cincinnati c-f 2011 Health Policy Institute of Ohio g. 2010 Ohio Department of Health h-j 2010 Ohio Department of Health
3 of 3
Jfjslfj;jd
Back to Dashboard
;l k

Quantitative Assessment
Franklin County
a. 68 preventable hospital stays per 1,000 Medicare enrollees.
b. 63.5% of Medicaid enrolled adults visited the ER one or more times during 2009.
c. 69.2% of Medicaid enrolled seniors visited the ER one or more times during 2009.
d. 43.3% of Medicaid enrolled children visited the ER one or more times during 2009.
e. 11.5% of Medicaid enrollees had an inpatient hospital visit during 2009
f. 59.5% of Medicaid enrollees had an outpatient hospital visit during 2009.
g. 689 trauma deaths every year and about 3,737 trauma- related hospital admissions.
Hospital Referral Region
a. 223 potentially avoidable emergency department visits among Medicare
beneficiaries, per 1,000 beneficiaries
b. 19.6% of Medicare beneficiaries are readmitted within 30 days of discharge.
c. In 2010, 6,034 patients were admitted to hospitals as a result of a fall.
d. In 2010, 3,458 patients were admitted to hospitals as a result of a motor vehicle
crash.
e. 6,460 hospital admissions among Medicare beneficiaries for ambulatory care-
sensitive conditions, per 100,000 beneficiaries.
f. 96.3% of patients hospitalized for heart failure received recommended care.
g. 95.5% of patients hospitalized for pneumonia received recommended care.
h. 97% of surgical patients received appropriate care to prevent complications.
i. 83.8% of hospitalized patients were given information about what to do during their
recovery at home.
j. 19.93% of pneumonia patients are readmitted within 30 days.
k. 44.4% of admissions utilize a basic EMR, and 7.82% utilize a comprehensive EMR.
l. 19.57% of heart attack patients are readmitted within 30 days.
m. 15.8% risk-adjusted 30-day mortality among Medicare patients hospitalized for heart
attack.
n. 11.5% risk-adjusted 30-day mortality among Medicare patients hospitalized for heart
failure.
o. 11.9% risk-adjusted 30-day mortality among Medicare patients hospitalized for
pneumonia.
p. 18.2% of long-stay nursing home residents are hospitalized within a six-month period.
q. 20.6% of first-time nursing home residents are readmitted within 30 days of hospital
discharge to the nursing home.
r. 33.5% of home health care patients had a hospital admission.
s. 24.36% of heart failure patients are readmitted within 30 days.
t. 70.63% of patients reported their pain was always well controlled.
u. 75.13% of inpatients’ reported being highly satisfied with their hospital.
Ohio
a. There were 554 visits per 1,000 people to hospital emergency departments in 2010.
That was up from 449 visits per 1,000 people in 2002, and was the sixth highest rate in
the nation — 34 percent higher than the U.S. average.
b. More than 97% of poisoning hospitalizations involved drugs or medications.
c. $2,881 health care expenditures per capita for hospital care.
d. Emergency room visits per 1,000 residents by hospital ownership type; state/local
government 47, non-profit 478, for-profit 29.
e. Hospital adjusted expenses per inpatient day are $2,138.
f. 131 hospital admissions per 1,000 residents.
g. Obese children are 2.1 times more likely to have had two or more hospitalizations in
the past year, and 1.8 times more likely to have two or more ER visits.
Franklin County
a. 2012 Robert Wood Johnson Foundation
b-f 2010 Health Policy Institute of Ohio
g. 2011 Central Ohio Trauma System
Hospital Referral Region
a-b 2012 Commonwealth Fund Local Scorecard
c-d 2011 Central Ohio Trauma System
e-h 2012 Commonwealth Fund Local Scorecard
i-l 2011 Agency for Healthcare Research and Quality
Hospital Referral Region
m-s 2012 Commonwealth Fund Local Scorecard
t-u 2011 Agency for Healthcare Research and Quality
Ohio
a. 2010 American Hospital Association
b. 2010 Ohio Department of Health
c. 2010 Kaiser Family Foundation
d-f 2010 Kaiser Family Foundation
g. 2010 Ohio Department of Health
;l k
Hospitalization & Emergency Services
Back to Dashboard

Hospitalization & Emergency Services
Questions
• Do ED’s send MH clients to Netcare?
• What is this “observation unit from ED? (no coverage for it)
• HCAP future?
• Some hospitals no doing testing at night?
• Cost of preventable stays?
• How many ER visits/stays are attributed to dental issues?
• What would need to happen to have something other than hospitals be the access point for Medicaid enrollees?
• What % of non-Medicaid (private insurance) patients visited the ER?
• What are # of ED visits that are truly acute emergency?
• How do Medicaid rates relate to non-Medicaid populations?
• g. did their pts have pneumonia vaccine before hospital stay?
• What are good % age for this data?
• To what extent are hospitalists providers involved in care coordination post discharge?
• Is information considerate of language/literacy/culture?
• Is there any data to represent any health disparities (gender, racial, etc.)?
• How many ED patients seen with physical PX and also have behavioral health issues only treated for physical PX and then return
because mental condition prevents them from being complaint to care orders?
• Interested to know comparable % of private/commercial access and TX w/ ER.
• Why do patients choose to go to the ER when primary care is available?
• b. 63% med adults in ER—why? Preventable?
Back to Dashboard
;l k

Hospitalization & Emergency Services
Observations
• Costly co-pays in ED affecting going to Netcare not taking MH pts from
EMS (sends them to ED’s 1st)
• No emergency dental in ED’s
• We need more primary care providers to care for patients in offices rather
than in ED—right place for right care. “Transition of care” inadequate.
• Discharge process is totally inadequate relative to handoff of care
instructions, pt. understanding, provider orders read and communicated,
etc.
• No special service available at night.
• Too many early discharge.
• Not enough parental education about general childhood illness and care.
• Over 22% of Medicare beneficiaries have avoidable trips to the ER.
Extremely inefficient and very costly
• Heart care #’s look pretty good.
• Educating uninsured low income(???)/uninsured on preventive/wellness
care nutrition.
• My personal feeling is we do not have big barriers or gaps in
hospitalization in C/FC.
• All patients are given discharge instructions in English.
• Disparities in care not seen as quality issue by some hospital quality
departments.
• Interesting stat: hospital re-admissions can be reduced by 90% if patient
has a follow-up visit with their primary care provider within one week of
hospital discharge.
• For Medicaid enrollee, there is “no” established referral pattern (dr) at
discharge from ER.
• Interpaling(???) services not involved in planning discharges.
• Hospital physicians and discharge staff need to ask patients going home
with prescriptions how they will pay for/obtain these medicines. If they can’t
afford discharge meds and those meds will lower risk for re-admission
getting and taking those meds will be needed.
• Patients go to ER’s because they are more accessible than their primary
care doctor.
• Better pre-discharge plans to prevent re-admits. Better preventative SVS to
lower hosp. admissions.
• In 2010, 4 out of 10 reasons self pay visit ER was for dental care. ER only
gives antibiotic and pain meds. Don’t tx issue.
• Better coordination between ER and PCPs/EMRs help.
• Hospital ED’s complain that they are not used correctly, but when given the
chance to D to model like in (Minnesota or Wisconsin) they refused
opportunity because they need ED $$.
• Patients use ER as primary care. Poor discharge construction(sp) so return
to the hospital.
• Immigrants don’t understand health care system and use ER unnecessarily.
• Mt. Carmel has patient navigators for immigrants to health coordinate care
(also used for uninsured, too)
• Very poor discharge planning that adds to repeat ED visits.
• Beneficiaries should be educated so they know how to access preventative
care and avoid ER/Hospital.
• Common EHR so hospital systems don’t duplicate some tests.
• Need care coordination at discharge referral are reasonable and attainable.
• Next steps 100% must be reached.
Back to Dashboard
;l k

Maternity and newborn care
Quantitative Assessment
Columbus
a. 1,460 births to woman under the age of 20 in 2009.
b. 3,085 births to foreign-born mothers in 2009.
c. 3,066 births to mothers with less than 12 years of education in 2009.
d. 917 births to woman receiving late or no prenatal care in 2009.
e. 289 births to teen mothers who already had children in 2009.
f. 1,868 preterm births during 2009.
g. 50% of births in 2009 were to unmarried woman.
Franklin County
a. 17,851 births during 2010.
b. 143,810 woman are in need of public contraception.
c. 7,696 Medicaid claims for inpatient admissions for delivery resulting in a live birth
in 2009
d. 43.16% of pregnant women continuously eligible (11 of 12 months with any
Medicaid eligibility) who received more than 81% of expected prenatal visits and
received a postpartum visit.
e. 5% of Medicaid claimed live births during 2009 resulted in a neonatal intensive
care visit.
f. 349 mothers had not prenatal care in 2009
g. 9.4% (1,679) of babies born had a low birth weight in 2010.
h. 3,448 abortions were reported in 2010. 37% (1,266) were woman aged 20-24
years old.
i. 2,460 teen pregnancies (age 10-19) during 2010
j. 123 infant deaths during 2010.
k. 69.7% of pregnant women received prenatal care during the first trimester in
2010.
l. 13% of children two years old or younger are considered overweight/obese.
m. 7.0 infant mortality, per 1,000 live births.
n. 47 teen births per 1,000 female population, ages 15-19
o. 9.3% of live births with low birth weight (< 2500 grams)
p. 31.5% of births were paid by Medicaid
Hospital Referral Region
a. 8% of live births with a low birth weight.
Ohio
a. 12.5 births per 1,000
b. 70.6% of pregnant women receiving prenatal care during the first trimester.
c. 0.12% of births are less than 37 weeks gestational age.
d. 17,824 (3.5%) preterm births during 2009
e. 31.1% of births by Cesarean Delivery during 2009
f. 39.5% of children born in 2009 were breastfed at 6 months, and 25.6% were still
breastfed at 12 months.
Columbus
a-g 2010 Annie E. Casey Foundation
Franklin County
a-b 2010 Ohio Department of Health
c-e 2010 Health Policy Institute of Ohio
f. 2010 Center for Disease Control
g-l 2010 Ohio Department of Health
m. 2008 Kaiser Family Foundation
n-o 2012 Robert Wood Johnson Foundation
p. 2008 Ohio Department of Job and Family Services
Hospital Referral Region
a. 2012 Commonwealth Fund Local Scorecard
Ohio
a-c 2011 United Health Fund
d-f 2009 Kaiser Family Foundation
1 of 2

Quantitative Assessment
Ohio
a. Teens 18 to 19 years of age had the highest birth rate among all teen age groups with 59.4 births per 1,000 females.
b. The birth rate among African-American teens was 57% higher than the birth rate of white teenagers.
c. 7.7 infant deaths (before age 1) per 1,000 live births.
d. 13.6% of children were exclusively breastfed at 3 months, and 11.6% were exclusively breastfed at 6 months.
e. Gestational diabetes affected between 5-10% of all pregnancies in 2006-08.
f. Approximately 50% of woman with GDM are overweight or obese, and more than 20% are physically inactive.
g. Approximately 1.9% of woman reported having diabetes only during pregnancy.
h. 7.6% of woman enrolled in Medicaid were diagnosed with GDM.
i. Half of all women were overweight or obese when they became pregnant.
j. Between 4-6% of woman had hypertension during pregnancy.
k. Woman aged 25-34 years had the highest prevalence of a history of only GDM, as did woman with no insurance.
l. The SIDS rate has decreased nearly 50% in the past decade, from 1.3 deaths per 1,000 births in ‘94 to 0.7 in ‘07.
Ohio
a-b 2010 Ohio Department of Health
c. 2012 Commonwealth Fund State Scorecard
d. 2011 Ohio Department of Health
e-k 2011 Ohio Department of Health
l. 2008 Ohio Department of Health
;l k
Maternity and newborn care
Back to Dashboard 2 of 2

Maternity and newborn care
Key Questions
• Not much preconception counseling?
• Is there an “access to prenatal care” or a poor distribution of desired providers?
• What is % of LBW for African Americans, other groups?
• Impact of HCAP changes?
• How does this maternity/newborn care data relate to our high infant mortality rate—and the huge disparity?
• Cost of unneeded pregnancy testing?
• What must be done to increase prenatal care of Medicaid enrollees?
• How do adoption services fit into maternity/newborn care?
• Cultural awareness missing in patient and family education and interactions with providers?
• Prenatal care is important need better connection of data for prenatal care to births and benchmarking that identifies this connection better. How
to provide prenatal care?
• 57% not receiving/accessing prenatal care? Appears quite poor %. D.
Back to Dashboard
;l k

Maternity and newborn care
Key Observations
• Expand access to non-food items from WIC; diapers, vitamins, soap.
• Need to encourage spacing (birth control)
• I just learned that our hospitals do not require (or assure) newborns to go home in a car seat. Really—this is key to having a safe healthy newborn.
• Better nutritional/dietary with ???? for babies.
• Franklin County for 2011 data has increase infant mortality.
• Bleeding his(sp)—carrying women requiring pap smears or other unintrusive tx.
• Lack of community awareness of problem and Ohio’s ranking compared to other states and the US ranking compared to the rest of the world.
• Only 2 physicians certified to treat (pregnant woman) on opiates.
• More effective (read palatable) public information needed on contraceptive need.
• Pre-natal care is key to much of these issues.
• Lack of admission beds for pregnant women on drugs.
• We need more access for high risk OB for publically insured and uninsured women and need it fast! Timing is everything.
• Pediatric population management thru quantitative health record data is key in these areas. Will allow physicians to identify—and reach out to at risk
population.
• Prevention, prevention, prevention. a-q
• More education in Jr. and High school on health education. Lifelong health.
• State of Ohio 46% of babies born are born to Medicaid.
• Need for education re: prenatal care increases likelihood of better birth outcome.
• Need higher focus on social determinants of health—economic ability to access, birth control, nutrition, and baby supplies.
• Large disparities in newborn mortality rate between white and black mothers.
• Importance of nutrition in prenatal care and for childhood obesity.
• Gap # of eligible pregnant women who should have Medicaid.
• Low birth weights are significantly higher for African-American women.
• Help prevention of NAS. Continue efforts to lower childhood obesity. Reinstate BDI (sp) screening.
• We need presumptive eligibility—increases prenatal access.
• Get mom healthy before pregnant.
• 43% pregnant women elig continuously for Medicaid when they should be having pre-natal. Huge problem contributes to bad outcomes.
• 9 months is a good amount of time to educate and prepare young and first time mothers. Prenatal care and 100% contraception, social services.
Back to Dashboard
;l k

Quantitative Assessment
Columbus
a. Columbus ranks 116 of 190 cities for emotional health
Franklin County
a. 1,772:1 ratio of population to mental health providers
b. 4.2 average number of mentally unhealthy days reported in past 30 days (age-
adjusted).
c. 8.5% of Medicaid enrollees received community mental health services during
2009.
d. 4.8 children (0-18) enrolled in Medicaid who received services from the Ohio
Department of Alcohol and Drug Addiction Services, per 1,000.
e. 1.4% of Medicaid enrollees received Ohio Department of Alcohol and Drug
Addiction Services during 2009.
f. 66.2% of children (2-17) with emotional, developmental, or behavioral problems
received mental health care.
g. Approximately 11% (28,000) of individuals with frequent mental distress reported
needing mental health care but not receiving it. Of those, approximately 70%
(19,600) reported expense and lack of coverage as reasons for not receiving
needed mental health care.
h. 9.8% of children lack mental health coverage.
i. An estimated 11,000 high school girls and 7,000 boys who reported in 2007
feeling sad or hopeless for two or more weeks in a row, which interfered with
usual activities.
Hospital Referral Region
a. 30.2% of adults (18-64) report fair/poor health, 14 or more bad mental health days,
or activity limitations.
Ohio
a. One of the top nine states for non-medical use of painkillers among 18- to 25-year-
olds.
b. $856,400,000 mental health services expenditures during 2009
c. 40% of adults reported that a friend or family member had behaved in a way that
made them think that person had a serious problem with depression.
d. 18,291 patients sought mental health services, and 1,837 sought substance abuse
services in Ohio during 2011
e. Approximately 600,000 Ohioans, age 18+, report 14 or more mentally unhealthy
days in the past 30 days.
f. Only 38% of those who knew where to get help would suggest contacting a mental
health professional. 46% would recommend getting in touch with other healthcare
providers, such as a primary care doctor, and 15% would turn to social services,
clergy or another source.
g. 76% (310,000) of Ohioans suffering from serious psychological distress are
unemployed and living in poverty. Approximately 40% (124,000)of these persons
are between the ages of 35 and 54.
h. Approximately 70% of persons with serious psychological distress have a high
school diploma or less.
i. $1.6 billion in mental health services were cut between 2009 and 2011, with $25
million cut in Ohio. Ohio officials say that when 2008 figures are included, the Ohio
cuts total $90 million.
j. 4.8 children (0-18) in FC enrolled in Medicaid who received services from the Ohio
Department of Alcohol and Drug Addiction Services, per 1,000.
Columbus
a. 2011 Gallup-Healthways Index Survey
Franklin County
a-b 2012 Robert Wood Johnson Foundation
c-e 2010 Health Policy Institute of Ohio
f. 2007 Kaiser Family Foundation
g. 2008 Ohio Family Health Survey
h. 2008 Annie E. Casey Foundation
i. 2011 Community Research Partners
Hospital Referral Region
a. 2012 Commonwealth Fund Local Scorecard
Ohio
a. 2011 Substance Abuse and Mental Health Services Administration
b. 2010 Kaiser Family Foundation
c. 2012 Health Foundation of Greater Cincinnati
d. 2011 Health Resources and Services Administration
e. 2009 Health Policy Institute of Ohio
f. 2012 Health Foundation of Greater Cincinnati
g-h 2008 Ohio Family Health Survey
i. 2011 National Alliance on Mental Illness
j. 2009 Health Policy Institute of Ohio
Mental health and Substance Use Disorder Services
1 of 2

Mental health and Substance Use Disorder Services
Quantitative Assessment
Ohio
a. Nearly 30% (130,000) of persons with serious psychological distress are uninsured, while another 48% (225,000 individuals) report having government-sponsored health
coverage.
b. Approximately 61% (283,000) of persons with serious psychological distress live below 150% of the Federal Poverty Level.
c. 13.9% of children, aged 2-17 years, have one or more emotional, behavioral, or developmental conditions. 75.2% of those children have health insurance which adequately
meets their needs. 47.9% of those children received mental health treatment or counseling in the past year.
d. It is estimated that 45,657 children suffer from depression, 839,275 children suffer from autism, 156,319 from ADD/ADHD, 66,855 have behavioral or conduct problems
(oppositional defiant disorder, conduct disorder, etc.), and 79,307 have anxiety problems.
e. It is estimated that 85,481 children have developmental delays.
f. 5.8% of veterans who sought metal health services were homeless compared to 3.7% among civilians.
g. Average payment per use of service for Medicaid enrollees under 21 in 2008 was $3,863, and for adults the average payment was $7,511.
h. 10.4% of children lack mental health coverage.
Ohio
a-b 2008 Ohio Family Health Survey
c. 2007 The Child and Adolescent Health Measurement Initiative
c-e 2011 The Child and Adolescent Health Measurement Initiative
f. 2011 Ohio Department of Mental Health
g. 2008 American Academy of Pediatrics
h. 2008 Annie E. Casey Foundation
;l k 2 of 2
Back to Dashboard

Mental health and Substance Use Disorder Services
Key Questions
• MH provider pop. Adequate? Other barriers? • How do c and f foot? • PCP screening for mental health? • What does 116 mean? Is top good or bad? • Chronic disease mgmt—cause for depression? • When will we come to the understanding that mental health is a physiologic or chemical issue not just a case of patients “acting
out”? If this happens will we be able to prioritize access to care and treatment the way we treat other health issues like cancer, heart disease, diabetes, etc.
• How do you navigate the mental health system here? What system? • What is the link to crime, jail, or others? Cost is far greater than lack of access to service. • How does the new SE FQHC clinic work?
Back to Dashboard
;l k

Mental health and Substance Use Disorder Services Key Observations
• Serious psychological distress is reported slightly more by females than males.
• The majority of persons reporting serious psychological distress are white.
• Ohio has shifted state general fund mental health dollars to Medicaid recipients, leaving many non-Medicaid recipients with serious mental illness without services.
• Children who grow up in poverty are more likely to have a mental disorder or emotional disturbance and are more likely to have contact with the juvenile justice system.
• Ohio’s public mental health system does not contain many Hispanic consumers.
• Very surprised at 66.2% received care—this is very different than what is really happen.
• Need to increase public awareness of connection between substance abuse and mental health. Especially for young people.
• Stigma against seeking care—higher insurance costs if one claims depression—armed services don’t accept applicants being treated for beh. Health.
• 1772:1 pop. To mental health providers…astounding.
• Untreated vision problem contribute to depression and substance abuse.
• According to the Us Govt. Substance abuse costs exceed diabetes costs nationally yet there is huge disparity in amount of attention and focus.
• Care coordination ED/PC/referrals. Mental health can be underlying cause of physical symptoms. Need to treat both appropriately.
• 50% of patients with physical health problems also have mental health problems (uninsured).
• Need more resources for retired.
• Substance abuse services are in extreme shortage. As we work to reduce narcotic prescriptions we are encountering barriers because we have no place to send pts. For detox
treatment.
• Current ratio of providers reflects a lack of community access.
• Community lack of psychiatric support for DD population (primary Medicaid eligible).
• Wait list too long for mental health when no insurance.
• PCMH to include mental health and substance use services.
• Net care won’t accept patients from EMS (EMT’s can asses medical need).
• Captive by stigma.
• Co-location of mental health and physical health is great; but mental health in those sites have long wait lists. • Mental health and substance abuse affects many individuals but it is not discussed as frequently as the other disease states. • Limited mental health services MER • Family unit dissolving for support. • Calls from mothers for adult children that need meds for mental health issues. • Problem funding services for the uninsured. • Mental health affects ability to handle chronic disease. Need for MH proponents to serve Medicaid. • Integrate mental health with primary care. Not just co-exist in some building, integrate practices. • Medicaid managed care plans don’t offer some services to special needs kids. • Start to provide more mental health services in primary care—partner between mental health and primary care providers/agencies. • Few resources for adolescents in this area. • Insurance coverage do not pay for mental health or have limits. • Net care and other CMH clinics are overwhelmed. • Desperate need for cross-health field care facilities, check-up from head to toes. • Disconnect on how to get mentally distressed people to care.
;l k
Back to Dashboard

Quantitative Assessment
Franklin County
a. 1,279:1 ratio of population to dentists.
b. 728 primary care dentists.
c. 12.4% of children (<18) have never visited a dentist.
d. 4.7% of children, 16.9% of adults (18-64), and 8% of seniors could not receive
needed dental care.
e. In 2010, 183 schools were eligible for sealant programs, and 107 were
participating in the program.
f. 53.8% of 3rd grade students have one or more sealants, and 31.1% have
untreated tooth decay.
g. 14 safety net dental clinics.
h. 214 of 728 dentists treated Medicaid patients, 135 of them treating 50+ Medicaid
patients.
i. 31.3% of Medicaid enrolled adults received dental services during 2009.
j. 32.9% of Medicaid enrolled children received dental services during 2009.
k. 34.7% of adults are without dental coverage
l. 12.4% of children have never visited a dentist.
Hospital Referral Region
a. 69.5% of adults visited a dentist, dental hygienist, or dental clinic within the past
year.
b. 13.8% of adults ages 18-64 have lost six or more teeth because of tooth decay,
infection, or gum disease.
Ohio
a. 15% of adults had forgone dental care during 2010.
b. 71.3% of adults reported having their teeth cleaned during 2010.
c. $291 dental care expenditures per capita.
d. 19.8% of Ohioans age 65+ have had all of their natural teeth extracted.
e. 27.4% of children (ages 1-17) had one or more oral health problems.
f. About 45% of all adults have had one or more permanent teeth removed due to
tooth decay or gum disease.
g. In 2009, only 29% of Medicaid-eligible adults (19-64 years of age) and 22% of
seniors went to the dentist.
h. On average, three Ohioans are diagnosed with oral and pharyngeal cancer and one
person dies from the disease every day.
i. More than 3.9 million adults (45%) have no dental insurance, almost 3x more than
the number of adults without medical insurance.
j. Almost 340,000 children have never been to the dentist.
k. There are currently 68 dental health professional shortage areas in the state.
l. 43% of adults, and 15% of children lack dental insurance.
m. Average payment per Medicaid enrollee under 21 for dental services was $203 in
2008, for adults the price was $236.
n. More than 980,000 seniors (60%) have no dental insurance. Most Medicare does
not cover routine dental care.
o. Nearly 37% of Ohio’s poorest seniors (65 years of age and older with incomes less
than $15,000 per year) have had all their teeth removed.
Franklin County
a-g 2011 Ohio Department of Health
h-I 2010 Health Policy Institute of Ohio
j. 2008 Ohio Family Health Survey
k-l 2008 Annie E. Casey Foundation
Hospital Referral Region
a-b 2012 The Commonwealth Fund Local Scorecard
Ohio
a. 2010 Ohio Family Health Survey
b-e 2010 Kaiser Family Foundation
f-k 2011 Ohio Department of Health
l. 2010 Health Policy Institute of Ohio
m. 2008 American Academy of Pediatrics
n-o 2011 Ohio Department of Health
;l k
Oral Health
Back to Dashboard

Oral Health
Key Questions
• With pop. Of dentists to overall pop. Being what it is, does that suggest a need to expand scope of care for oral health providers? • 728 primary care dentists seems very low—what is the issue here? • What is the future cost of children not visiting dentist? • So… where’s the bar? So 12.4% of children haven’t visited a dentist. 88% have. Are we trying to get to 100%? • How do we get hygienists for primary care and the referral to dentists for follow-up tasks as needed? • What is it about dentists that keeps dentists from working with vulnerable populations? • Dental conversion to medical home? • Dental therapists can help? • What is Medicaid benefit for dental coverage? • Shortage of dentists? • ?14 safety net dental clinics in Franklin Co.-->not on Ellen’s list, where are they? • News to me Ellen. Get me the info [email protected] • Schools not participating? Why? E.
Back to Dashboard
;l k

Oral Health Key Observations
• Children from low-income families have more cavities and toothaches and are less likely to have dental insurance than children from middle- or upper-income families.
• Children covered by Medicaid or those without dental insurance are significantly less likely to have visited the dentist in the past year than children in families with private dental
insurance.
• For Ohioans with low incomes and no dental insurance, the current systems for getting dental care are woefully inadequate.
• Proven community-based measures to prevent tooth decay, such as community water fluoridation and school-based sealant programs, are vital to ensuring better oral health
for Ohioans and are especially important for our most vulnerable residents.
• Data on health disparities in oral health needed.
• Dentists don’t take Medicaid for adults.
• Limited Medicaid coverage for kids.
• Medicaid reimbursements for sealant in primary care office—more dentists needed.
• More DDS need to accept Medicaid (incentives).
• Uninsured adults have very poor access to dental care especially if they cannot afford sliding fee clinics.
• Under-utilized dental facilities particularly in safety net.
• Need more safety net dentists—more charity!
• Gap in dental care/access for ??? population and children with exceptional needs. Dentist don’t take Medicaid.
• Need better quantifying of primary care dental needs—cleaning, teach oral health, screening, and dental education.
• Need new model of dental care—patients able to secure wellness/preventative care from independent practicing hygienist.
• Well-child visits—sealants.
• Impacts cancer patients and their prognosis.
• Caries is 100% preventable.
• Some cancer treatments can’t be started until oral health issues are resolved.
• We can’t meet the volume of those needing dental care with just free clinics.
• Dental options is extremely hard to get into.
• Oral health impacts people’s employability.
• Medicaid does not pay well enough for dentists to allow.
• All FQHCs are addressing dental care. It’s required!
• The dental financial and payment model does not work for the vulnerable.
• Impacts obesity and diabetes management.
• Young men in 20’s with excetic(sp) lung infec. From poor oral care hospitalized.
• No hip replacement, knee replacement, heart surg, etc. with poor dental health.
• No dentures, crowns, root canals for uninsured.
• Because of dental issues, uninsured have to choose option of pulling teeth instead of saving—cost.
• Dr. Deskins @ Columbus Public health said we need at least 5 more sliding fee scale dental clinics to address dental care.
• Not enough dentists treating—how about dental therapists, at least in FQHCs
• Lack of oral care affect nutritional health especially in the underserved economically at risk.
• Lack of coverage even with dental insurance. Dentist is haybent(???) note of suicide.
• Only 1 free clinic in 13 county region that provides restorative and preventative services.
• Top 5 diagnoses in Franklin County EDs are dental related. Back to Dashboard
;l k

Quantitative Assessment
Franklin County
a. 61.6% of Medicaid enrollees had a prescription drug claim during 2009
b. 19.9% needed prescription, could not secure due to cost in the past year
c. 7.3% of children lack prescription drug coverage
d. 15 per 100,000 deaths from prescription drug overdose annually.
Hospital Referral Region
a. 27.2% of elderly Medicare beneficiaries received at least one drug that should be
avoided in the elderly
Ohio
a. 17% of adults did not receive needed prescriptions during 2010.
b. 22.8% of all adults have no prescription drug coverage, and those individuals are
1.5 times more likely to have foregone purchasing a needed prescription within the
past year.
c. $894 prescription drug expenditures per capita.
d. 170,153,713 retail prescription drugs filled during 2011.
e. 14.4% of Medicaid enrollees under 21 had a prescription drug claim in 2008 at an
average cost of $947 per payment.
f. 6.9% of children lack prescription drug coverage.
g. Obese children are 1.4 times more likely to use chronic medication
h. Unintentional drug overdoses caused 1,544 deaths in 2010.
i. 16% of 2008 unintentional poisoning decedents had a history of doctor shopping
(filled prescriptions from at least 5 different prescribers per year).
j. From 1999 to 2009, the death rate due to unintentional drug poisonings increased
335%. This increase has been driven largely by prescription drug overdoses.
k. Opioids were involved in at least 37% of all drug poisoning deaths in 2008.
l. Prescription opioids were involved in more unintentional overdoses (40%) than
heroin and cocaine combined (33%) in 2008.
m. In 2007, 26.5% of high school students reported using a prescription drug without a
doctor’s prescription one or more times.
n. Average prescription fill rates for opioid medications, such as hydrocodone and
carisoprodol, were 5 to 25 times higher among 2008 unintentional poisoning
decedents than among all Ohioans.
Franklin County
a. 2010 Health Policy Institute of Ohio
b-c 2008 Ohio Family Health Survey
d. 2011 Ohio Department of Health
Hospital Referral Region
a. 2012 The Commonwealth Fund Local Scorecard
Ohio
a-b 2010 Ohio Family Health Survey
c-d 2011 Kaiser Family Foundation
e. 2008 American Academy of Pediatrics
f. 2008 Annie E. Casey Foundation
Ohio
g. 2010 Ohio Department of Health
h-m 2011 Ohio Department of Health
n. 2010 Ohio Department of Health
;l k
Prescription drugs
Back to Dashboard

Prescription drugs Key Questions
• Almost 1/3 of elderly with error in drug? How many hospitalized? Who made visit? How to focus on avoiding these mistakes? • 61% had 1 script? How many had multiple-coordinated? Needed? Anyone checking to assess effective? • Why not use same pharmacy for a patient? No hopping • Elderly care stat is problematic—what’s driving this trend? • What % of 61.6% is controlled meds? A.
Back to Dashboard
;l k

Prescription drugs Key Observations
• Unintentional drug overdose continues to be the leading cause of injury-related death in Ohio, ahead of motor vehicle crashes, suicide, and falls.
• Death rates from unintentional drug/medication-related poisoning are highest for Ohioans ages 45-54.
• The opioids most associated with overdose are methadone, oxycodone, hydrocodone, and fentanyl.
• White males have the highest death rates from unintentional opioid poisoning; however, females represent the fastest growing group at risk.
• Transportation to CA treatment is a barrier.
• Prescription medication was one of the top 3 barriers experienced by clients served by the United Way agencies in 2011 (approx. 23,000 clients served in 2011).
• Need places for adults to receive recommended vaccines.
• Additional support for mental health RX’s.
• Expand use of prescript asst. programs. One story—Senior on limited income prescribed med costing $6,000/year out of pocket. Primary care office assisted in
connecting with PAP and total cost covered due to financial need and delivered to door every 3 months.
• Medicare part D is threatened by deficit for limiting access.
• Oral chemo parity.
• Care coordination is needed in the medical home.
• Doctors have significantly changed their practice (to generics) because of costs!
• Older adults sell pills to increase income.
• Get providers to use the list of low cost generics when appropriate like PCC does.
• Coordinating of drug interaction is poor.
• Charitable pharmacy meds(sp) insufficient—woman if sustainable.
• There are no PAP programs valuable(sp) for non-US citizens even though they have legal residency.
• People need to understand that nothing is completely free.
• Have uninsured patients with HEP C that are difficult to secure medication and tx.
• Even with $4 RX program, access to RX is still an issue for uninsured because of being on mult. Drugs or need for brand name.
• Pt. are finding other meds to abuse besides controlled substances (neurontin)
• Low income/uninsured = no access.
• Thankful for charitable pharmacy, but needs more days etc. to service more people.
• PAP asst. programs are difficult to navigate for patients and physicians offices.
• Try treating chronic Hep B and C for the uninsured.
• People leaving prison with only 3-7 days of meds. “Break parole to get insulin.”
• Mental health meds expensive.
• Prescriptions for PRN meds are written assuming the pt. will take the max dose everyday. This is a huge waste of meds and money. But, insurance drives much of
this.
• Diversion of controlled meds can result in a very comfortable lining.
• Physicians writing for medication that patients cannot afford. Lower income cannot afford medications and do not know how to access.
1 of 2

Prescription drugs
Key Observations
• To save money patients split tabs or take every other day.
• Disposal of RX drugs is an environmental concern.
• Pharmacy errors—reduce errors due to medicine contradiction.
• Need for Pharm D to be part of team—PCMH.
• Get the old prescription drugs out of the medicine cabinets.
• Address primary care needs—on site providers representatives to refer—make appts. @ charitable pharm.
• Assist patients with applying for eligible programs i.e. SSI/SSDI/VA @ charitable pharm and other clinics.
• Not a huge access concern within DD population.
• The mis-medication of the elderly is frustrating.
• Seems like we’ve done a good job of enrolling kids in SCHIP.
Back to Dashboard 2 of 2
;l k

Quantitative Assessment
Franklin County
a. There are 1,205 PCPs.
b. 83.5% of adults have a usual source of care.
c. 64.8% of Medicaid enrollees visited a physician during 2009.
d. 4.9% of Medicaid enrollees received advanced practice nursing services during
2009.
e. 64% of female Medicare enrollees that receive mammography screening.
f. 83% of diabetic Medicare enrollees that receive HbA1c screening .
g. 13% of adults, who needed care, could not see a doctor in the past 12 months
because of cost.
h. 636:1 ratio of population to primary care physicians.
i. 3.9% of Medicaid enrollees visited an FQHC during 2009.
j. 2.4% of Medicaid enrollees visited a clinic during 2009.
k. 1.4% of Medicaid enrollees received ambulatory surgical center services during
2009.
l. The estimated number of vulnerable people who potentially have a need for
medical home services is 71,054.
m. The estimated annual cost of providing medical home services to the vulnerable
population amounts to 1.0% of Franklin County’s estimated healthcare
expenditures
n. 87.4% of children (19-35 months) were immunized with 4:3:1 series.
o. Estimated that 50.7% had a colonoscopy/sigmoidoscopy in the past five years.
p. 589 physicians practice family medicine/general practice, 465 general internal
medicine, 268 general pediatrics, and 206 Ob/Gyn.
Hospital Referral Region
a. 39.9% of adult diabetics received recommended preventive care.
b. 18.4% of Medicare patients with dementia, hip/pelvic fracture, or chronic renal
failure received prescription in an ambulatory care setting that is contraindicated for
that condition.
c. 43.8% of adults (50+) received recommended screening and preventative care.
Ohio
a. 87.7% (29,722) of Ohio’s active, non-federal doctors are classified as providing
patient care. 41% (12,158) of those MDs and DOs practice primary care.
b. There are 106 total active, non-federal primary care physicians per 100,000
residents in the state.
c. 77.4% of adults had their blood cholesterol checked within the last five years.
d. In 2010, uninsured children had an 11.7 times higher rate of not having a usual
source of care than insured children. Uninsured children had an almost 3 times
higher rate of not having an usual source of coverage than uninsured adults.
e. 76% of children age 19-36 months are fully immunized.
f. In 2010, uninsured working-age adults had a 4 times higher rate of not having a
usual source of care than those with coverage.
g. 81.7% of woman 18+ reported having a pap smear in the last three years.
h. 26.2% of two-year-olds are not fully immunized.
i. There are nearly 2,000 active physicians assistants in the state.
Franklin County
a. 2012 Columbus Medical Association
b. 2012 The Commonwealth Fund Local Scorecard
c-d 2010 Health Policy Institute of Ohio
e-h 2012 Robert Wood Johnson Foundation
i-k 2010 Health Policy Institute of Ohio
l-m 2008 Community Research Partners
n. 2005 Community Research Partners
o. 2008 Ohio Department of Health
p. 2010 Ohio Department of Health
Hospital Referral Region
a-c 2012 Commonwealth Fund Local Scorecard
Ohio
a-b 2010 Ohio Department of Health
c. 2011 United Health Foundation
d. 2010 Ohio Family Health Survey
e. 2010 Health Policy Institute of Ohio
f. 2010 Ohio Family Health Survey
g. 2010 Kaiser Family Foundation
h. 2012 Children’s Defense Fund
i. 2010 Ohio Department of Health
;l k
Primary and preventative Care
Back to Dashboard

Primary and preventative Care
Key Questions
• 40% of diabetics get care? 60% don’t? Lots of work to do here. • Define clinic data is inconsistent with “c”. j. • How many primary care physicians take Medicaid? • After screening—was medical nutrition therapy provided to their care plan; medical homes, Medicare, Medicaid. Reimbursement
available—was it accessed? • 64.8% of Medicaid patients seeing a doc, a PCMH, or are they hopping? • Are Medicaid enrollees only setting surgical services in hospitals? • How do RX companies affect the cost of health care and how and what doctors provide?
Back to Dashboard
;l k

Primary and preventative Care
Key Observations
a. Deal with patients holistically. Overall health, vision, dental, and prescription services needed.
b. Care coordination is difficult to manage.
c. Benefits are not utilized because they aren’t understood.
d. Most MD visits are not preventive in nature.
e. People use ERs for 1 degree care.
f. Many services are not provided in the primary care setting, but in the ER.
g. Community health workers are a benefit when available to the community.
h. People need chronic DZ education.
i. General downstream concern re: primary care human capital based on economics/reimbursement in this area.
j. Huge lack of chronic disease care delivered (diabetes)—chronic disease 75% of health costs!
k. Financial model does not support primary care. YES!
l. 83.5% seems very high for people who have a usual source of care.
m. Huge problem with hypertension (lots of people with DX)
n. Preventative care is much cheaper than medical symptom treatment.
o. Better information and marketing of free preventive services in the community.
p. Need more nurse practitioners and long health advocates.
q. Not enough quality assessment. Doctors herding clients through without providing proper screenings.
r. Lack of understanding about preventive wellness care.
s. How to overcome fear; lack of resources, symptoms.
t. Single men without children are not eligible for services.
u. There are not enough primary care doctors to take care of patients. 350 est. needed CI
v. Uninsured patients have limited to no access to preventative screenings.
w. People (not just uninsured) don’t understand the importance of have a first degree doc.
x. Basic health screenings in nontraditional settings; pantries, daycare, church, schools.
y. Assure there is a continuum or care.
z. Chronic disease coordinated services.
aa. People can’t take time off for preventative screenings.
bb. Not able to navigate the healthcare system so they give up too many numbers to call.
cc. First degree care is not glamorous prof.--> not appealing to med student grads.
dd. Primary care needs better reimbursement.
ee. Physicians were be in crisis need if Obamacare occurs. Estimated need of 30,000 more. (? If)
ff. Will need more primary care docs or NPs when ACA is in full effect.
1 of 2

Primary and preventative Care
Key Observations
a. We have to start to address obesity in this community.
b. Single men with kids want health care too.
c. Need evening and weekend care for those who cannot take off work for healthcare.
d. Need more patient advocates in primary care offices.
e. The primary care financial/payment model does not support primary care.
f. Seems like we are paying attention to mammograms and diabetes in Medicare population.
g. If screenings occur—outside of medical setting—there is a huge gap in where to send people for follow-up/primary care. Sickest go to ER all others go home sick….
h. Financial model does not support prevention.
i. The issues associated with primary care will not change until the money flow changes.
j. Regarding 83% of diabetic Medicare enrollees receive HbA1c screening—would be interesting to see stat on whether this pop. Managed their diabetes better based on
screening.
k. Community based services need to be considered as part of coordinated care. l. Need for greater utilization of Registered Dietitian services/medical nutrition therapy in the management of chronic disease.
2 of 2 Back to
Dashboard

Quantitative Assessment
Franklin County
a. 3.9% of Medicaid enrollees received home health services during 2009.
b. 1.7% of Medicaid enrollees received habilitative MRDD services during 2009.
c. 5,804 Medicaid enrollees in nursing homes at any time during 2009
d. 8.8 durable medical equipment claims for wheelchairs, per 1,000 enrollees.
e. 1,817 deaths caused by heart disease, 1,831 by cancer, 542 by chronic lower
respiratory disorder, 451 by stroke, 267 by Alzheimer's during 2010.
f. 6,001 new cases of HIV have been diagnosed since 2006. 5,105 of those cases
were male, and 896 female.
g. $172,043,544 Medicaid spending on nursing/residential care facilities.
h. 52 nursing homes, and 40 residential care facilities in the county.
i. The cost of diabetes was $894.4 million in 2007 and is approaching $1 billion, due
to treatments and side effects such as kidney failure, heart disease and stroke,
blindness, and amputation of the lower extremities.
j. An average of 4558 invasive cancer cases and 1919 deaths occur each year.
k. 3.9% of Medicaid enrollees received home health services during 2009.
l. 1.7% of Medicaid enrollees received habilitative MRDD services during 2009.
m. 5,804 Medicaid enrollees in nursing homes at any time during 2009
n. 8.8 durable medical equipment claims for wheelchairs, per 1,000 enrollees.
o. 1,817 deaths caused by heart disease, 1,831 by cancer, 542 by chronic lower
respiratory disorder, 451 by stroke, 267 by Alzheimer's during 2010.
p. 6,001 new cases of HIV have been diagnosed since 2006. 5,105 of those cases
were male, and 896 female.
q. $172,043,544 Medicaid spending on nursing/residential care facilities.
r. 52 nursing homes, and 40 residential care facilities in the county.
s. The cost of diabetes was $894.4 million in 2007 and is approaching $1 billion, due
to treatments and side effects such as kidney failure, heart disease and stroke,
blindness, and amputation of the lower extremities.
t. An average of 4558 invasive cancer cases and 1919 deaths occur each year.
Hospital Referral Region
a. 55% of Medicare dependents with a cancer diagnosis were without any hospice or
enrolled in hospice during the last three days of life.
Ohio
a. 17.8% (483,467) of children have special health care needs.
b. 7.2% of children with a special health care need were without insurance at some
point during the year.
c. 31.6% children with special health care needs had inadequate insurance.
d. 5.2% of children with special health care needs were without a regular doctor.
46.4% had a medical home.
e. 30.7% of children with special health care needs had conditions that affected their
daily activities usually, always, or a great deal.
f. It is estimated that 156,086 children have asthma.
g. Obese children are 1.4 times more likely to have special health care needs.
Franklin County
a-d 2010 Health Policy Institute of Ohio
e-f 2010 Ohio Department of Health
g. 2007 Ohio Department of Job and Family Services
h. 2008 Ohio Department of Job and Family Services
i. 2011 Community Research Partners
j. 2008 Ohio Department of Health k-n 2010 Health Policy Institute of Ohio o-p 2010 Ohio Department of Health
q. 2007 Ohio Department of Job and Family Services r. 2008 Ohio Department of Job and Family Services s. 2011 Community Research Partners
t. 2008 Ohio Department of Health
Hospital Referral Region
a. 2012 Commonwealth Fund Local Scorecard
Ohio
a-e 2011 The Child and Adolescent Health Measurement Initiative
f. 2011 The Child and Adolescent Health Measurement Initiative
g. 2010 Ohio Department of Health
;l k
Specialty Care
Back to Dashboard
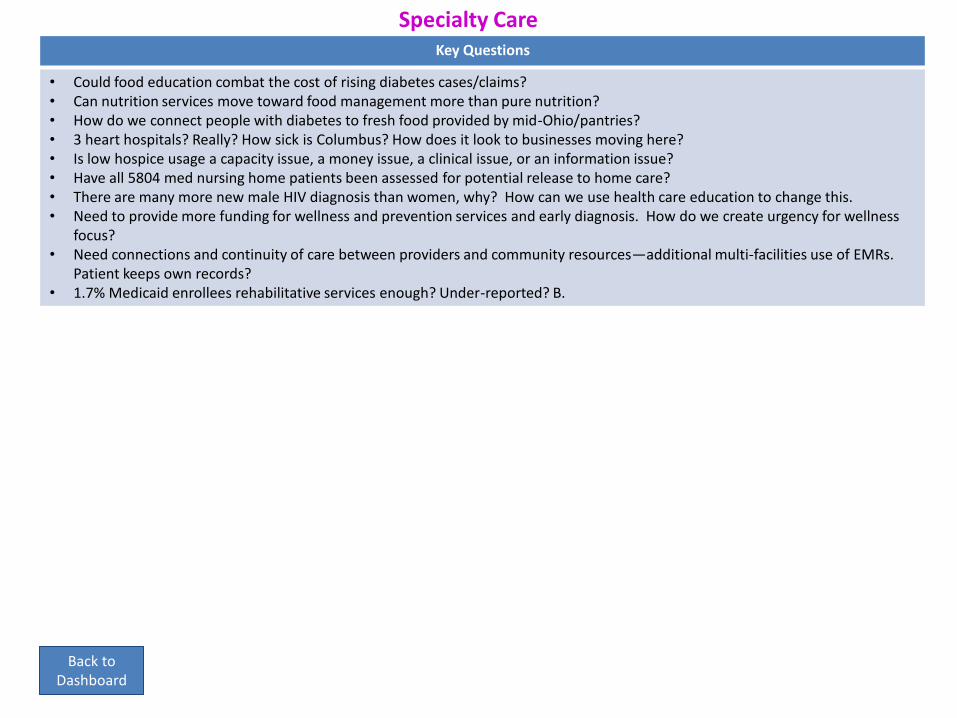
Specialty Care Key Questions
• Could food education combat the cost of rising diabetes cases/claims? • Can nutrition services move toward food management more than pure nutrition? • How do we connect people with diabetes to fresh food provided by mid-Ohio/pantries? • 3 heart hospitals? Really? How sick is Columbus? How does it look to businesses moving here? • Is low hospice usage a capacity issue, a money issue, a clinical issue, or an information issue? • Have all 5804 med nursing home patients been assessed for potential release to home care? • There are many more new male HIV diagnosis than women, why? How can we use health care education to change this. • Need to provide more funding for wellness and prevention services and early diagnosis. How do we create urgency for wellness
focus? • Need connections and continuity of care between providers and community resources—additional multi-facilities use of EMRs.
Patient keeps own records? • 1.7% Medicaid enrollees rehabilitative services enough? Under-reported? B.
Back to Dashboard
;l k

Specialty Care Key Observations
• Medicaid spending on nursing homes seems disproportionate to # served.
• 45% of Medicare dependents receive hospice care—seems like good penetration.
• Home health services utilization seems low.
• Need more up to date data on HIV.
• Need baseline preventive care to catch the chronic disease issues before problems arise.
• Have to get a hold on diabetes.
• Cost of diabetes “low hanging fruit” can improve this stat drastically thru use of EHR data. Proactively reach out to this population.
• Need for specialty health care was among the top 3 barriers experienced by clients served by United Way agencies in 2011 (n=23,000).
• Need for care coordination Hosp-hospice-PC-Home care.
• Need for more attention too pre-diabetes obesity. Medical nutrition therapy—diabetes, kidney Dis, cancer, CVD—HPT
• There is a developing access issue associated with Hepatitis C—this requires a coordination that is not always accessible to this population.
• Hepatitis C is just an example of the growing complexity of illness and treatment.
• Preventive care and community based resources can be used more effectively to address diabetes management/prevention.
• There seems to be an opportunity to better coordinate and perhaps even integrate HIV care with other aspects of health care.
• Specialty doctor shortages in community: rheumatology.
• Access and funding for DME is also key limitation: wrist braces, knee braces, walkers, canes, blood pressure monitors, nebulicas. These items could extend available
medicines through Karon’s Law provisions.
• 1 doctor in 40 counties that takes Medicaid (Dermatology)
• Access to specialty care for uninsured is non-existent unless you go to free clinic!
• People playing system so they don’t use Medicaid, but instead use free clinic because at least they get care.
• End of life issues need to be openly and honestly addressed with patients.
• Lack of providers to treat Hep B and C, Rheumatologists, urologists, GYN.
• Riverside breast health program is great.
• Very few specialists accept Medicaid ie Dermatology
• Grateful for PCC to provide specialty care for uninsured.
• Lack of cancer services=higher invasive cancer rates.
• Hospitalists being integrated into SNFs is a good thing.
1 of 2
Specialty Care
Key Observations
• Trending towards reduction and reconfiguration from nursing care/ICF(sp) facilities still a substantial cost, but movement towards community based service delivery and
health homes.
• If commercial insurers mimic the % listed for Medicaid/Medicare.
• Use of home health and rehab seems low.
• First study this phenomenon using RDs respondent driven sampling.
• Need connections and continuity of care between providers and community resources—additional multi-facilities use of EMRs. Patient keeps own records?
• Need increase use of community health workers to assist patients with transitions from facilities to home and to stay connected to resources.
• Appt. availability office hours.
• Discussion around focus on preventative care for diabetes, HIV, etc. vs. carative(sp) models
• Public health nurses assist children with spec. needs link with specialty care—needs more resources in this area.
• Noninsured cannot access specialty care. Also cannot ??? insured if no co-pay available. Hospice care one charging for services.
• Specialty care doctors are being used as a regular source of care (expensive, no continuity, no preventative screenings).
• $814 million—no need—save and spend on prevent. i.
Back to Dashboard 2 of 2
;l k

Vision Quantitative Assessment Qualitative Assessment
Franklin County
a. 12.8% of Medicaid enrollees received eyeglasses or ophthalmology services
during 2009.
b. 37.7% of adults are without vision coverage.
c. Current cost of vision problems per resident (age 40+) $424.
d. 30% of adults have forgone a needed vision service (i.e. eyeglasses) because of a
lack of insurance or cost.
e. 231,325 residents are currently affected by vision problems.
f. $184, 905,963 is the total economic impact of vision problems.
g. 12,202 residents have visual impairments.
h. 21.7% of children, 39.9% of adults (18-64), 50.7% of seniors report having no
vision insurance.
i. 13,651 residents (age 5-64) had a vision difficulty.
Ohio
a. 22.4% of children lack vision coverage.
b. 18.9% of children, 27.6% of adults, and 45.3% of seniors reported having health
insurance but no vision coverage.
c. Close to half of adults under 250% of the poverty level lack vision coverage.
d. Of those adults without vision insurance, 55.8% had received an eye exam within
the past 2 years, compared to 71.1% of adults with vision insurance.
e. 38.2% of children with Asian descent were without vision insurance, making them
the least likely to have coverage. Nearly 10% of African-American children were
without vision insurance, making them the most likely to have coverage.
f. 170, 319 people over 40 are visually impaired and/or blind.
g. 991, 628 individuals over 40 years old have cataracts, and 105, 889 suffer from
glaucoma.
h. A higher percentage of Hispanic adults reported no vision insurance (54.1%), with
Whites reporting 41.1%, Blacks 37.5% and Asians 34.6%.
i. 50% of adults reporting an annual income between 101% to 200% of the FPL
reported having no vision insurance — compared to 33.5% of those more than
300% of poverty level.
j. 72.2% of children without vision insurance had an exam in the past 2 years,
compared to 81.4% of children with vision coverage.
k. 36.9% of diabetics and 36.3% of borderline diabetics had not had an eye exam in
the past year.
l. Over the past 12 months, 3% of children did not receive overall health care (which
included eye care) that they needed. No vision care accounted for 38.3% of the care
not received.
m. Almost 50% of those without vision insurance rated their eyesight no better than fair,
compared with 38.6% of those with vision insurance.
n. More than 25% of children whose household reported income above 151% of the
Federal Poverty Level (an annual income of $25,700 for a family of three in 2007)
were without vision insurance compared to 11.7% of those less than 63% of poverty
level.
o. There were 797,393 students who received vision screening in the 2008-2009
school year; 97,945 were rescreened; and 76,123 were referred for follow-up.
p. 94.5% of schools reported conducting vision screenings during 2008-2009. 99%
reported vision screening in 06-07.
q. A total of 92.8% of respondents said stereopsis screening is administered during
vision screening for preschool and/or kindergarten students, 5.5% said it wasn’t
used and 1.8% said they did not know.
Franklin County
a. 2010 Health Policy Institute of Ohio
b-d 2008 Ohio Family Health Survey
e-h 2008 Prevent Blindness Ohio
i. 2011 Community Research Partners
Ohio
a. 2008 Annie E. Casey Foundation
b. 2009 Health Policy Institute of Ohio
c-d 2008 Ohio Family Health Survey
e. 2008 Ohio Family Health Survey
f-g 2012 Prevent Blindness America
h-n 2008 Ohio Family Health Survey
o-q 2009 Ohio Department of Health
Back to Dashboard
;l k

Vision
Key Questions
• How is total economic impact calculated? Can we use this to gain more public support for vision assistance programs. • Is there vision services advocacy in the state? • Need for clarification of data—do Medicaid patients have any coverage. • Are there vision clinics for vulnerable? • 13,651 residents had a vision difficulty—how is vision difficulty defined? • What about 3rd grade reading commitment. Do all k-3rd kids get accurately screened and get appropriate treatment/services? • What kind of coverage (insurance)do the 62% have? • What role can schools play? Do schools even consistently screen for vision issues? If so, what happens after screening results
suggest need for further care? • What coordination could occur to provide longitudinal vision monitoring for patients with diabetes? How/where can this
monitoring take place? • What % in commercial population for a.? • What is undiagnosed #? G. • What is the cost to providers? • 13,651 residents have a vision difficulty that is addressed? % addressed? • Are there underlying chronic problems related to vision? • How do e. and i. questions foot? % problems addressed?
Back to Dashboard
;l k

Vision
Key Observations
a. Eyeglass penetration is very low.
b. Surprise by how many people have vision coverage.
c. Clearly ongoing area of need/focus for residents—especially for folks with DD conditions in Franklin Co.
d. Lack of providers that take Medicaid <50% est.
e. Vision care needs connection to med. Home—Deal with patients holistically.
f. Only ~50% of Medicaid kids see a doc in any one year. So unlikely all kids being screened by qualified providers.
g. Remember you get “one pair and no spare”
h. Feels like this is a big gap area?!
i. Free clinics can provide exams but not glasses. Use Prevent Blindness Ohio to get glasses.
j. OSU eye clinic is great. Need more champions like Dr. Mauger.
k. Work force issue.
l. Vision is placed on the back burner for most.
m. Need to publicize glasses thru JOIN (Prevent Blindness Ohio)
n. Need to publicize vision service at FQHC’s.
o. There are resources for uninsured: OSU, Physicians Free Clinic, FQHC’s, Faith Mission Mobile Unit.
p. OSU optometry students special fund (name?)
q. OSU optometry student screening when set up.
r. Sliding scales too high for uninsured or underinsured.
s. Easier for kids due to school then for adults.
t. Education re: eye care prevention not given.
u. There is a problem but “quant. Assess” doesn’t describe issue at all.
v. Need for a comprehensive assessment of eye care access in Central Ohio.
w. The data needs a frame of reference to give the reader a better sense of magnitude. Ex numerator/denominator or total population.
x. Need some motivation to get vision specialists to donate time to the underinsured.
y. Vision screening part of PC assessment. z. Required screening for youth to catch issues early.
Back to Dashboard

INVENTORY current local/regional measures on access
to care
CO-CREATE a collaborative assessment on:
a) local health service gaps
b) local barriers to care
VALUE TO PARTICIPANTS
- utilize assessment in strategic planning and funding opportunities
- build relationships with health and
social sector leaders
Collaborative Assessment on Current Health Services Gaps and Barriers to Care
Step 1: compile key measures from
available sources
Coordinated by:
Step 2: design and host working
session(s) with local health & social sector
leaders
Step 3: create and share collaborative
assessment that emerges from step 2
potential for periodic refresh based on value to participants
Version 1.1
Return to Dashboard

Back to Dashboard
;l k
First Last Organization First Last Organization
Phil Cass CMA Jan Neefe Mount Carmel Health System
David Ciccone United Way of Central Ohio Jeff Pattison
Franklin County Board of Developmental
Disabilities
Kathryn Clark Physicians CareConnection Cathy Phillips Columbus Cancer Clinic
Kathy Cowen Columbus Public Health Beth Pierson Franklin County Public Health
Bridget Decrane Mid-Ohio Foodbank Ellen Rapkin Columbus Public Health
Wanda Dillard
The Ohio State University Wexner Medical
Center Sue Real ADAMH of Franklin County
Andi Doane Vineyard Health Clinics Robert Strohl Central Ohio Primary Care Physicians
Debbie Donahey OhioHealth Dana Vallangeon Lower Lights Christian Health Center
Sean Gleeson Nationwide Children's Hospital Dee Dee Wade CNHC
Kathleen Gough American Cancer Society Mary Jo Welker The Ohio State University
Amy Headings Mid-Ohio Foodbank Becky Wilkins OSU Rardin FP
Leigh Anne Hehr American Cancer Society Sherry Williams Prevent Blindness Ohio
Sabra Howell Debbie Wright Franklin County Public Health
Isi Ikharebha Physicians CareConnection Allan Zaenger Charitable Pharmacy of Central Ohio
Judy Kress The Breathing Association Katherine Kuck Self
Celeste Lauer American Cancer Society Henry Miller UHCAN Ohio
Teresa Long Columbus Public Health Jacquelyn Hilton Mount Carmel
Iliana Martinez OCECD Danni Hansen Ohio Association of Foodbanks
Pat McKnight Ohio Academy of Nutrition and Dietetics Olabisi Eddy UHCAN Ohio
Mary Mutegi Physicians CareConnection Reed Fraley CNHC, Inc.