Embed Size (px)
Citation preview
Applying Ajzen’s Theory of Planned Behaviour: Changing Physical
Activity Health Behaviour with Activity-Tracking Technology
Colin O’Shea
Submitted in partial fulfilment of the requirements of the BA Hons in
Psychology at Dublin Business School, School of Arts, Dublin
Supervisor: Dr. Patricia Frazer
Programme Leader: Dr. Rosie Reid
March 2016
Department of Psychology
Dublin Business School
1
Contents
Acknowledgements…………………………………………………….2
Abstract………………………………………………………………...3
Introduction……………………………………………………………4
Methodology…………………………………………………………..13
i. Participants……………………………………………...13
ii. Design……………………………………………………13
iii. Method…………………………………………………..14
iv. Apparatus……………………………………………….16
v. Procedure………………………………………………..16
Results………………………………………………………………...18
Discussion……………………………………………………………..25
References…………………………………………………………….32
Appendix……………………………………………………………...39

2
Acknowledgements
A huge thanks and expression of gratitude to my supervisor Dr. Patricia Frazer for her
guidance and professional expertise, as well as her generosity of time and patience.
A special thank you to my fiancé Rachel for her tower of strength, outstanding
support, unending patience and delicious home-cooked comfort food.
I would like to thank my great friend Peter Halpin whose encouragement, support and
motivational talks have carried me on this journey and through its challenges.
Lastly, I would like to thank my greatest supporter of all. A lady who gifted me with
the courage to face any challenge and instilled a “go do it” attitude into my psyche.
To my late loving mother Margaret (Peggy), forever missed, never forgotten.
3
Abstract
The objectives were to i) determine whether a mobile connected activity-tracking
device could change physical activity (PA) health behaviour, ii) test whether the
theory of planned behaviour could predict participation in physical activity, measured
by mobile technology, iii) determine if PA engagement was correlated with mobile
communication usage and vehicle journey time. Participants consisted of 41 males
and 28 females (N=69), each completing standard TPB measures at baseline.
Intervention included a health warning/advice sheet and activity-tracking wearable
device. ANOVA results found a significant interaction effect of 37% when wearing
device versus not. Findings did not the support the TPB as a predictor of PA
engagement in a technology intervention context. Multiple regression results found no
relationship between PA participation and mobile communication usage or vehicle
journey time. A basis for developing interventions to include mobile connected
devices for improved behavioural health is discussed.
Keywords: health, physical activity, mobile devices, theory of planned behaviour.

4
“Regular physical activity reduces your risk of high blood pressure, heart attack and
stroke, as well as many other diseases. Over 20% of coronary heart disease and 10%
of stroke is due to physical inactivity” (Irish Heart Foundation, 2015, p2-3).
In an age where technology and mobile phone usage dominate the daily lives
of many and whilst the rates of mortality related to health are staggering, there is a
globally recognised urgency to encourage fundamental lifestyle health changes and a
rationale for the adoption of advanced technological methods in supporting change.
The prevalence of overweight and obesity in children and adults in developing
countries has been described as a global epidemic with rates estimated to have
doubled between 1980 and 2013 (Ng et al. 2014). Furthermore, this health issue has
been identified as one of the leading worldwide causes of death and found to increase
risks of diabetes, cancers and cardiovascular diseases. According to the World Health
Organisation, more than 2.8 million people die in the world per year as a result of
being overweight and obese (WHO, 2015b). Currently, Ireland is ranked second
highest in Europe for obesity rates (The Food Safety Authority of Ireland, 2012), but
worryingly, Ireland is on course to become the most obese country in Europe by 2030
(WHO, 2015c). A forecast report in 2015 by the World Health Organisation (as cited
by SafeFood, 2015) predicted that 91% of men in Ireland are likely to be overweight
by 2030, including 27% of these likely to be obese. For women, 83% are predicted to
be overweight with 57% obese. In 2014, there were more than 1.9 billion adults
overweight (39% of world population), with 600 million of these obese (13% of
world population) and 42 million children under the age of 5 were either overweight
or obese in 2013 (WHO, 2015b). Clearly, the potential consequences of not acting in
some shape or form could be viewed as catastrophic. In 2013, each member state of

5
the World Health Organisation agreed to action a global plan with the aim of
preventing and controlling non-communicable diseases, including a specific goal to
reduce insufficient levels of physical activity by 10% by 2025 (Who, 2015a, p5).
Importantly, a study by Ekelund et al. (2015), consisting of over three hundred
thousand European men and women, found significant supportive evidence to
conclude that a lack of physical activity and being highly sedentary leads to the
highest risks of death. In addition, a study by Biswas et al. (2015) found evidence to
suggest that physical activity alone may not be effective enough to avoid health risks.
If for example, an individual’s daily sedentary hours greatly outweigh their time spent
physically active, then the individual is still highly susceptible to the most common
fatal diseases of today such as heart disease, diabetes and cancer. Furthermore, the
study found that the average person spends half their day sedentary i.e. sitting at a
TV, sitting at a desk and driving. The study highlighted the importance of both a
reduction in daily sedentary hours as well as daily regular exercise.
Other recognised underlining factors linked to physical inactivity and obesity
are heavy mobile phone usage (Lepp et al. 2013) and a heavy reliance on the use of
sedentary modes of travel such as cars and buses (Kozo et al. 2012; National Heart,
Lung and Blood Institute, 2016; Harvard T.H. Chan, 2016, para 10-13). According to
a report by Worldometers (2015), the number of cars on roads globally, surpassed the
1 billion mark in 2010 and continues to increase. In Ireland, a national survey carried
out by the Central Statistics Office into modes of travel among Irish people in 2014
found that 74.4% of journeys were by car as either passenger or driver, a further 9.2%
6
of journeys were made by bus, rail, or other (CSO, 2014). Of the sample audience,
only 14.8% were found to make a journey by walking and 1.6% by bicycle.
In attempts to tackle the problem of obesity, overweight and sedentariness,
health practitioners and governments all around the world are now actively
encouraging people to become more physically active. Health warning messaging (or
“shock advertising”) and health advice is frequently promoted online, in print media
and medical centres. However, the effectiveness of this messaging is uncertain
(Manchanda, Dahl & Frankenberger, 2002; Urwin & Venter, 2014). In relation to
physical activity advice, the Irish Heart Foundation recommends that an individual
engage in 30 minutes of physical activity 5 days a week (Irish Heart Foundation,
2015). Similar recommendations are made by health organisations throughout the
world. Both the Irish Heart Foundation and the UK’s National Health Service
promote a 10,000 steps challenge encouraging people to get more active by setting
themselves a target of 10,000 daily steps. 10,000 steps is recognised globally as the
daily step target goal and the concept is believed to have originated in Japan (BBC,
2015). It is estimated, that on average, a person walks between 3,000-4,000 steps per
day (NHS, 2015). Interestingly, a study by Lordon and Pakrashi (2015) analysed all
types of physical activities including housework, manual work, sports/exercise and
identified ‘brisk or fast pace walking’ as being better than any other form of physical
activity as a deterrent against overweight and obesity.
In tandem with global health warnings, there has been a surge in health and
fitness mobile applications and wearable activity-tracking ‘smart devices’ (wireless
connected electronic devices) flooding the global markets. These wearable activity-
7
tracking devices are now readily available and marketed by brands such as Jawbone,
Fitbit, Garmin, Microsoft and Sony, all ranging competing variants. Statistics reveal
that there were 15 million global health and fitness tracker users in 2013, with that
expected to rise to near 100 million by 2018 (Statista, 2015, para.2). Activity-tracking
smart devices allow users to receive and analyse information about their daily life
behaviour with the aim of helping to guide decisions for healthier lifestyles.
Information tracked may include a user’s daily steps, time spent walking, running,
cycling, sleeping and transport travelling time. Some also monitor a user’s heart rate
and levels of mobile communication usage (i.e. texting, calling and social media).
Other forms of tracking simply use mobile applications and are not paired with a
wearable smart device to track physical activity. There are an abundance of available
mobile applications such as Runtastic, MapMyFitness, Strava and Fitnet. The one
necessity to operate these health and fitness applications and wearables is a
smartphone mobile device. In a quarterly report by Ireland’s Commission for
Communications Regulatory, official data revealed that 73.7% of mobile
subscriptions in Ireland are Smartphone users (Comreg, 2015). Like Ireland, the
world has seen smartphone adoption skyrocket and this leads experts to believe there
is vast scope of opportunity for eHealth to become a prominent and important force in
the healthcare market. According to Morris and Aguilera (2012, p. 622), it is
envisaged that forces such as “advances in mobile technology, constrained clinical
care and consumer demand are beginning to change the face of psychological
assessment and interventions”. The integration of smartphone technology in
behavioural healthcare brings a vast amount of possibilities and the benefits such as
GPS tracking of patients suffering with dementia, audio and visual recording of

8
therapy sessions, etc., are outlined in further detail by the team at Telehealth &
Technology in Washington (Luxton, McCann, Bush, Mishkind & Reger, 2011).
Theory of Planned Behaviour (TPB)
Strong links have been identified between illness and behaviour with reports
suggesting that 50% of the mortality, from 10 leading causes of death, is directly
related to behaviour (Ogden, 2007, p15). Based upon the popular theory of planned
behaviour (Ajzen, 1991), an individual’s behavourial intentions are shaped by a
combination of attitudes towards behaviour, subjective norms and perceived
behavioural control. As such, the likelihood of an individual’s participation in
physical activity may be determined by analysing these behavioural dimensions. The
predictive validity of the theory of planned behaviour has been supported in many
studies through a wide spectrum of experimental applications including the prediction
of behaviours related to drug usage (Ito et al., 2015), gambling (Martin et al. 2010),
and sexual behaviours (Bryan, 2002). However, it is in the domain of physical activity
that the model has been extensively applied. Galea and Bray (2006) applied the theory
to predicting the walking and exercise intentions of individual’s with intermittent
claudication – a condition whereby a cramping pain in the leg is brought on by
exercise. Supportive evidence was found for the theory with attitudes, subjective
norms and perceived behavioural control explaining 67% of the variance in
participant’s intentions. However, in this case, perceived behavioural control was
found to be the only significant determinant of exercise behaviour. Similarly, a study
by Armitage (2005) found replicated findings when using the TPB theory model to
predict the maintenance of physical activity. In this case, the three independent
variables (attitudes, subjective norms, perceived behavioural control) accounted for
9
49% variance in behavioural intentions. Again however, perceived behavioural
control was the only significant predictor of actual physical activity behaviour. In an
interesting study by Farrell et al. (2016), the model was applied to test the influence
that romantic relationship partners have on health behaviour determinants. Perceived
behavioural control was once again highlighted as a key component in prediction of
physical activity behaviour. The study’s findings suggest that in order to change
health-related behaviour, the influence of a partner’s attitudes and intentions to the
targeted behaviour should be considered.
This study seeks to investigate whether modern day health and fitness activity-
tracking technology can help contribute a solution to the modern day overweight,
obesity and highly sedentary problem engulfing millions of people globally. It aims to
determine whether using a mobile connected activity-tracking device can significantly
influence the amount of daily steps a person takes, and whether a person’s
behavioural intentions would be more motivated when using one.
In conducting the research, a market approved activity-tracking device from
Sony Corporation’s Mobile Communications division called the Sony SmartBand
SWR10 was recruited. Partnered with the device, Sony’s Lifelog application stores
recorded data received from the Smartband. Data received is communicated from the
Smartband to the Lifelog application via a Bluetooth connection. Suitable for 24/7
wear, the Smartband is built with comfortable lightweight material and is fully
waterproof, allowing each hour of the participant’s day to be tracked. Statistical
information gathered includes measures of time walking, running, sleeping, as well as
other aspects of a person’s life including recorded data of the time spent in transport
10
(i.e. car, bus) and the amount of accumulated time spent communicating via text,
calls, social media and internet (Sonymobile, 2015).
Upon examination of previous studies in this area, there appears to be a
scarcity of research into the physical activity behavioural influence of fitness/activity
trackers, specifically applying the theory of planned behaviour. In an age where
technology and mobile phones are heavily integrated in our daily lives, the means to
statistically measure our actions have never been as insightful. Technologies are
readily used in pro-sports to determine the levels of output (i.e. running, jumping,
shooting) a sports person makes in for example a football game. These advances in
technology allow exploration into the validity of theories that have been historically
reliant upon participant self-reporting and manual data logging. Although the theory
of planned behaviour has been applied to many physical activity studies, there has
been a heavy reliance on participants to self-report by relaying honest and accurate
information about their physical activity time achieved during the experiment. In the
case of this experiment, a key advantage is that the activity-tracking data records
cannot be manipulated, avoiding for any misleading information or error in memory
by the participant.
The TPB questionnaire incorporated in the case of this study was adopted
from Armitage (2005). The measures analyse the person’s favourable or unfavourable
attitudes toward physical activity, the person’s perceived social pressure to engage or
not to engage in physical activity, and the person’s perceived ease or difficulty of
engaging in physical activity. Azjen (1991, p188) explains “As a general rule, the
more favourable the attitude and subjective norm with respect to a behaviour, and the
11
greater the perceived behavioural control, the stronger should be an individual’s
intention to perform the behaviour under consideration”.
Whilst previous studies have investigated the behavioural affects of mobile
fitness applications only (Bolin, 2013; Brunstein, Brunstein & Mansar, 2012: Direito
et al., 2014) and found supportive evidence to encourage the adoption of mobile
applications in tackling obesity and inactivity, this unique study examines empirically
whether a wearable device, delivering highly accurate real-time information about a
participant’s day, and acting as somewhat of a constant motivational reminder tool,
can encourage higher levels of physical activity engagement. Furthermore, this study
seeks to investigate the validity of Ajzen’s Theory of Planned Behaviour with
technically recorded statistical data and identify whether the theoretical construct is a
viable predictor of a person’s engagement in physical activity behaviour under the
influence of technology. In addition, this study investigates whether physical activity
engagement is significantly affected by mobile communication usage and vehicle
journey time. Inclusively, this study aims to build upon previous research, which has
explored means of changing health behaviours (Rutter & Quine, 2002) and essentially
‘plug a gap’ in the literature relevant to today’s technologically advanced society.
Hypotheses
Based on the literature review, the proposed hypotheses are:
H1 - There will be a significant difference in the total number of steps taken by adults
when wearing an activity-tracking smart device.

12
H2 - There will be a significantly positive correlation between the theory of planned
behaviour variables and the number of steps taken by adults wearing an activity-
tracking smart device.
H3 – There will be a significantly positive relationship between mobile
communication usage, vehicle journey time and physical activity engagement.
13
Methodology
Participants:
Sixty-nine healthy participants were recruited from mainly the Republic of
Ireland and also the United Kingdom. The sample consisted of 41 men and 28 women
between the ages of 18 and 64 years of age. All participants had ownership or access
to a smart mobile device, running the Google Android operating system, for the two-
week duration of the experiment. Participants were sourced using college notice
boards, social media channels along with recruitment of friends, family and
colleagues. Furthermore, snowball sampling was used to augment recruitment. As an
incentive to participate, the Smartband activity-tracking device was offered as a gift.
Signature consent was required from each participant before commencing.
Design:
The study was quantitative in nature, using a randomised mixed groups
experimental design. Participants were assigned to either one of two groups receiving
the Smartband tracker intervention at different time periods. The within groups
independent variable was ‘time’ (Week 1 or Week 2) and the between groups
independent variable was ‘group’ (Group A= Smartband for first week, no Smartband
for second week – Lifelog application only), (Group B = Smartband for second week,
no Smartband for first week – Lifelog app. only). The dependent variable was ‘steps’.
The study also had correlational design aspects. Multiple regressions were
used to test casual relationships between variables. In the second hypothesis, the
predictor variables were subsection scores on the TPB measures; attitudes, subjective
norms, perceived behavioural control and behavioural intentions. The criterion
14
variable was ‘steps’. In testing the third hypothesis, the predictor variables were
‘transport hours’ and ‘communication hours’. The criterion was ‘steps’.
Materials:
i) Each participant received either a printed and digital copy of a produced
health warning/advice sheet (one-page A4 size), listing key points and statistics
related to the health risks of obesity, physical inactivity and being sedentary (Irish
Heart Foundation, 2015; WHO, 2015; Ng et al. 2014; Ekelund et al. 2015).
ii) The questionnaire contained two main sections. The first section sought to
establish the participant’s physical activity level at baseline by using the Godin
Leisure-Time Exercise Questionnaire (Godin, 1997). Participants were asked “During
a typical 7-Day period (a week), in your leisure time, how often do you engage in any
regular activity long enough to work up a sweat (heart beats rapidly)?” which had
then three options to choose from “often”, “Sometimes”, “Never/Rarely”. The second
section of questionnaire used an identical replication of the physical activity designed
TPB Questionnaire used by Armitage (2005) measuring the following variables at
baseline on 7-point scales: attitudes, subjective norm, perceived behavioural control
and behavioural intention. Guidelines in Theory of Planned Behaviour construction
by Ajzen (2006) were noted. In measuring attitude, participants were asked to rate the
following stem on a scale of 1 to 7: “For me, participating in regular physical activity
would be . . . ” which was then anchored by the adjective choices of dull–interesting,
unpleasant–pleasant, boring–stimulating, unhealthy–healthy, bad–good, and useless–
useful. The mean of the six responses was used as a measure of attitude. In measuring
Subjective norm, the following were rated on a scale of 1 to 7 and the mean of the
15
total used: “People close to me think I should participate in regular physical
activity… disagree/agree”; “People who are important to me would . . . disapprove of
my participating in regular physical activity/approve of my participating in regular
physical activity”; and “People close to me think I . . . should not participate in
regular physical activity/should participate in regular physical activity”. The mean of
the three responses was used as a measure of subjective norm. To measure perceived
behavioural control, the following were rated on a scale of 1 to 7 and the mean
average of the total used: “To what extent do you see yourself as being capable of
participating in regular physical activity? incapable–capable”; “How confident are
you that you will be able to participate in regular physical activity? not very
confident–very confident”; “I believe I have the ability to participate in regular
physical activity… definitely do not–definitely do”; and “How much personal control
do you feel you have over participating in regular physical activity?... no control–
complete control”. To measure Behavioral intention, the following were rated on a
scale of 1 to 7 and the mean average of the total used: “How often do you intend to
take part in regular physical activity? never–frequently,” and “I want to exercise
regularly… definitely do not–definitely do”. According to Armitage (2005),
Cronbach’s alpha indicated good internal reliability on each of the scale
measurements. Scoring: In each category of questions, the mean of the items are taken
and used as a measure.
iii) Each participant was also provided with a second information sheet – “The
10,000 steps challenge” taken from the UK’s National Health Service website -
detailing the recommended daily step count of 10,000 steps along with further
16
information explaining the benefits of walking, the calories burned from 10,000 steps,
the best way to start and recommendations on how to go about achieving this.
Apparatus:
i) A unit of the Sony SmartBand SWR10 with activity-tracking technology
was provided to each participant. The Smartband device is essentially a rubber
wristband with a removable core tech component, which is paired via Bluetooth with
the participant’s Android mobile device. Waterproof and comfortable in design, the
SmartBand allowed participants the option of wearing for 24/7, recording accurate
daily activity levels of the participants. Also included with the device, was a
Smartband charger and an easy-to-use step guide.
ii) The Sony Mobile Lifelog application (includes GPS tracking technology)
was downloaded onto the participant’s smartphone mobile device. Working as
standalone or in unison with the Smartband when paired, this mobile application
automatically measured, uploaded and recorded the required experimental data.
Physical activity stats were automatically measured, recorded and uploaded
throughout the two-week period. Activity categories tracked include: walking,
running, and cycling. Two more categories of information were collected and stored:
The participant’s travel time made by vehicle (i.e. car, bus) and the participant’s time
spent communicating by mobile (i.e. texting, calling, emailing, social media).
Procedure:
Prior to commencement, an information sheet outlined the purpose of the
experiment to the participant and the right to withdraw at any time. Furthermore,
ethical approval was sought and approved by both the DBS ethics committee and
17
Sony Mobile Communications for use of Smartband SWR10 product. The experiment
began with the first intervention; participants were presented with the health
warning/advice sheet and asked to read through it. Time was allowed for open
discussion or questions posed to experimenter. Upon completion of the required
questionnaire and TPB measures, a short tutorial and set-up was given on the Sony
SmartBand SWR10 and Lifelog application. Lastly, each participant was provided
with the details on how to achieve an easy-to-follow goal of 10,000 steps a day.
Participants were not bound to any goal or target but simply presented with the
relative information to encourage a more active lifestyle. In order to retrieve the
necessary data, participants followed instructions by taking mobile phone screen-
shots of the require elements and forwarded by email or WhatsApp messaging service
after the two week completion period. The Smartband served as a dual purpose.
Firstly, to record and store accurate activity data, even when the user had left their
phone away from them, for example at a work desk when going for a coffee or at
home on a kitchen table and not in their pocket. Secondly, the Smartband acted as a
discreet motivational tool in that it was always on and insight acting as a visual
reminder.
Instructions for week without Smartband device:
Participants were instructed to maintain their mobile phones on them at all times in
order for the Lifelog application to collect the relevant data precisely.
All participants were debriefed at end of experiment and given the opportunity to ask
questions and also communicate whether any issues or constraints occurred during the
experiment period. Relevant feedback was noted.
18
Results
Descriptive Statistics
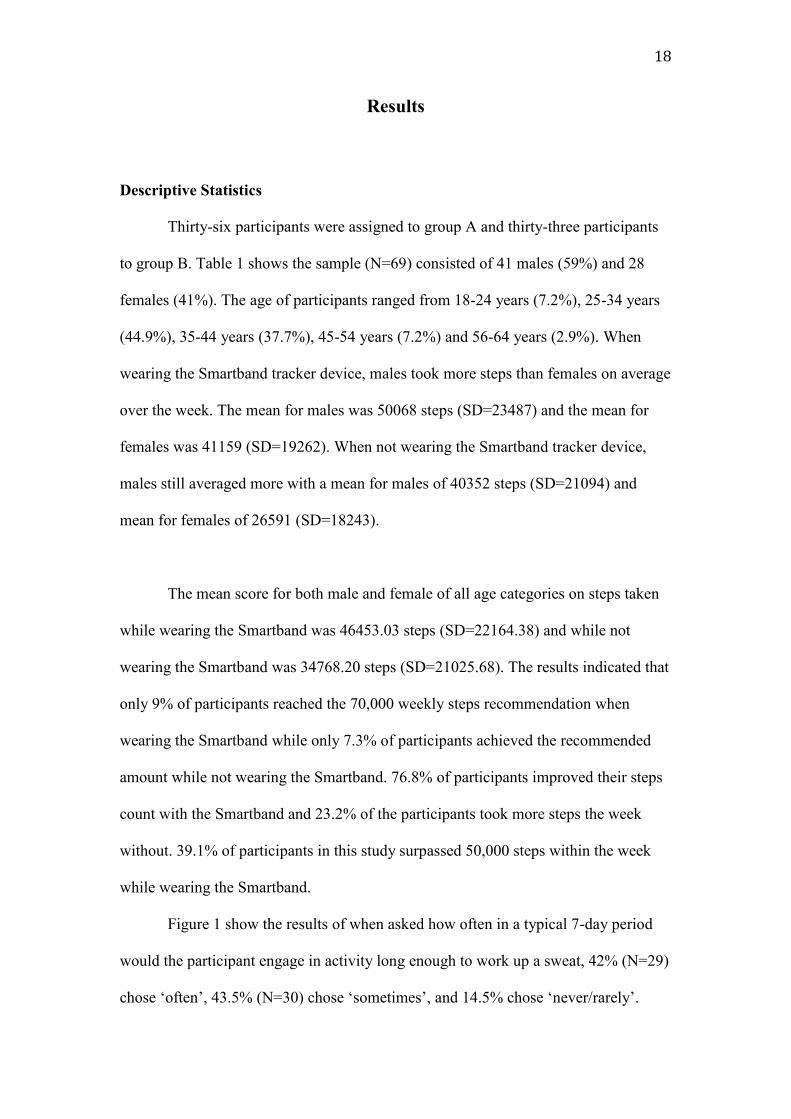
Thirty-six participants were assigned to group A and thirty-three participants
to group B. Table 1 shows the sample (N=69) consisted of 41 males (59%) and 28
females (41%). The age of participants ranged from 18-24 years (7.2%), 25-34 years
(44.9%), 35-44 years (37.7%), 45-54 years (7.2%) and 56-64 years (2.9%). When
wearing the Smartband tracker device, males took more steps than females on average
over the week. The mean for males was 50068 steps (SD=23487) and the mean for
females was 41159 (SD=19262). When not wearing the Smartband tracker device,
males still averaged more with a mean for males of 40352 steps (SD=21094) and
mean for females of 26591 (SD=18243).
The mean score for both male and female of all age categories on steps taken
while wearing the Smartband was 46453.03 steps (SD=22164.38) and while not
wearing the Smartband was 34768.20 steps (SD=21025.68). The results indicated that
only 9% of participants reached the 70,000 weekly steps recommendation when
wearing the Smartband while only 7.3% of participants achieved the recommended
amount while not wearing the Smartband. 76.8% of participants improved their steps
count with the Smartband and 23.2% of the participants took more steps the week
without. 39.1% of participants in this study surpassed 50,000 steps within the week
while wearing the Smartband.
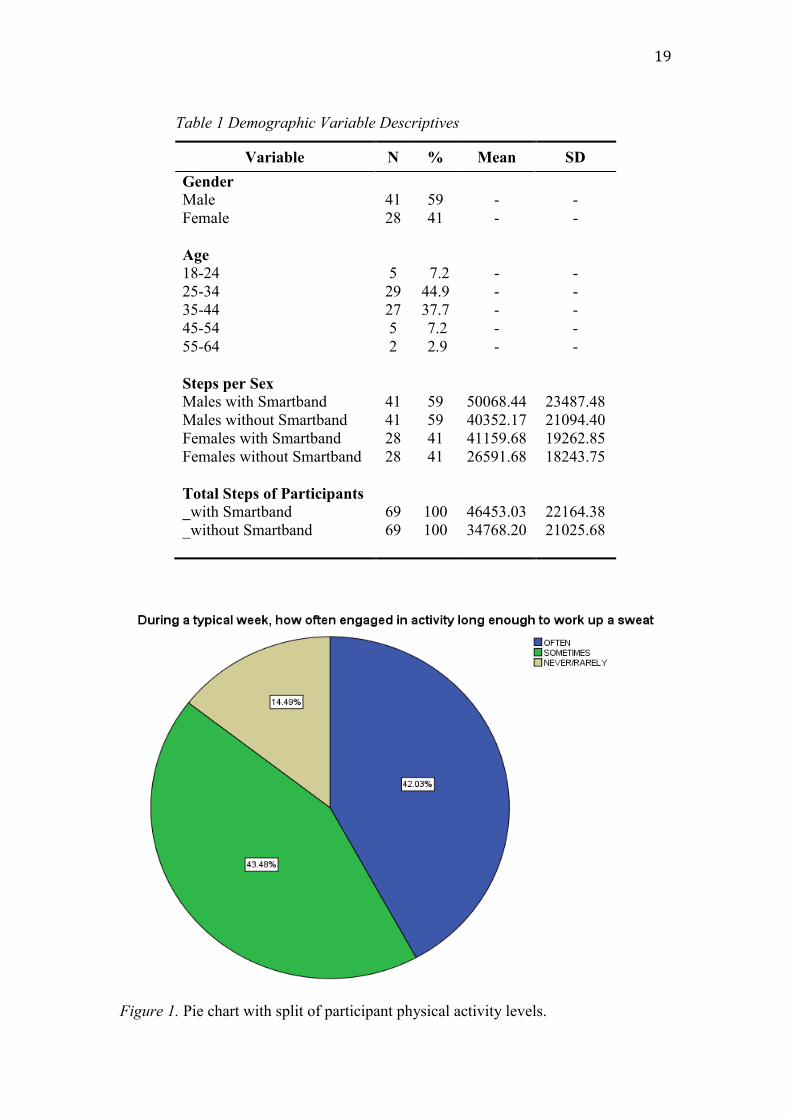
Figure 1 show the results of when asked how often in a typical 7-day period
would the participant engage in activity long enough to work up a sweat, 42% (N=29)
chose ‘often’, 43.5% (N=30) chose ‘sometimes’, and 14.5% chose ‘never/rarely’.
19
Table 1 Demographic Variable Descriptives
Variable N % Mean SD
Gender
Male
Female
Age
18-24
25-34
35-44
45-54
55-64
Steps per Sex
Males with Smartband
Males without Smartband
Females with Smartband
Females without Smartband
Total Steps of Participants
_with Smartband
_without Smartband
41
28
5
29
27
5
2
41
41
28
28
69
69
59
41
7.2
44.9
37.7
7.2
2.9
59
59
41
41
100
100
-
-
-
-
-
-
-
50068.44
40352.17
41159.68
26591.68
46453.03
34768.20
-
-
-
-
-
-
-
23487.48
21094.40
19262.85
18243.75
22164.38
21025.68
Figure 1. Pie chart with split of participant physical activity levels.

20
Inferential Statistics
H1: Screening of data was carried out to ensure all variables met the criteria
for assumptions of a two-way mixed analysis of variance. Table 2 shows the summary
of results from the analysis that found there to be a significant interaction effect
between the time wearing the Smartband activity-tracking device and the time not
wearing the Smartband (F (1, 67) = 39.82, p < .001) with an effect size of 37%. In
relation to main effects, there was no significant difference of steps if allocated to
Group A versus steps if allocated to Group B (F (1, 67) = .61, p = .439), indicating
that the health guide sheet as an intervention had not a significant impact. There was
also no significant difference in steps between groups (F (1, 67) = .48, p = .491) with
an effect size of .7%.
Table 2 Analysis of Variance Summary
Variables Groups Means SD df F Sig. Eta2
Time (Wk1) A 47375.67 23737.03 1, 67 .61 .439 .009
B 32250.24 22919.15
Time (Wk2) A 37076.33 19161.86 1, 67 .48 .491 .007
B 45446.46 20631.12
Time * Group A, B 1, 67 39.82 .000** .373
** p < .001.
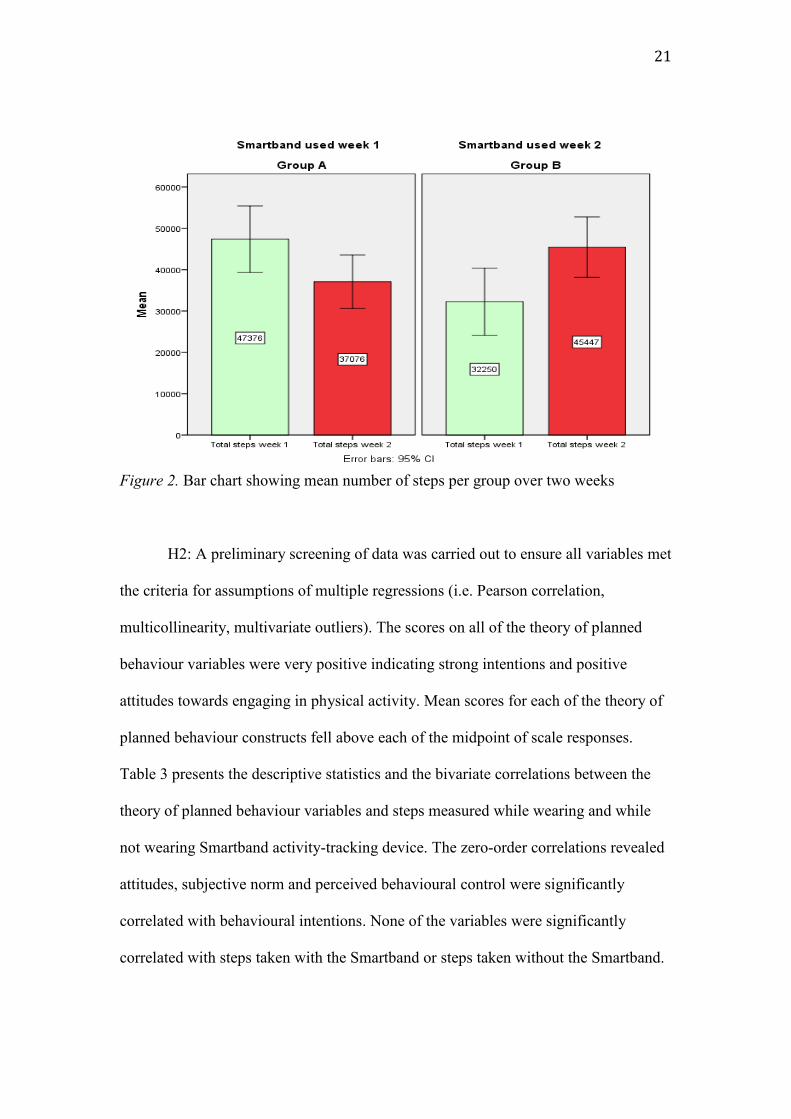
Figure 2 is a bar chart representing the mean scores for the number of steps
taken by participants over the two-week period in their designated groups. During
week1, participants of Group A (N=36) who wore the Smartband, had a mean score
of 47375.67 steps (SD=23737.03) and Group B (N=33) who didn’t wear the
Smartband, had a mean score of 32250.24 steps (SD=22919.15). During week2, when
Smartband usage was reversed, participants of Group A averaged 37076.33 steps
(SD=19161.86) while Group B averaged 45446.46 (SD=20631.12).
21
Figure 2. Bar chart showing mean number of steps per group over two weeks
H2: A preliminary screening of data was carried out to ensure all variables met
the criteria for assumptions of multiple regressions (i.e. Pearson correlation,
multicollinearity, multivariate outliers). The scores on all of the theory of planned
behaviour variables were very positive indicating strong intentions and positive
attitudes towards engaging in physical activity. Mean scores for each of the theory of
planned behaviour constructs fell above each of the midpoint of scale responses.
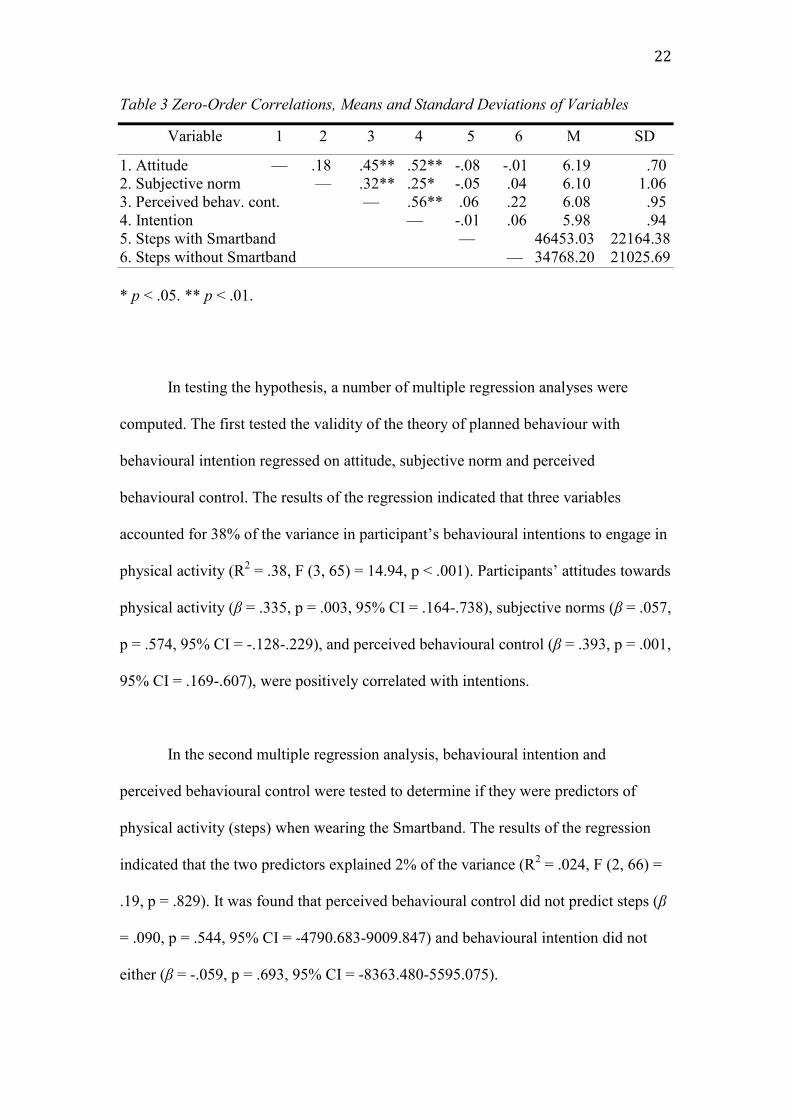
Table 3 presents the descriptive statistics and the bivariate correlations between the
theory of planned behaviour variables and steps measured while wearing and while
not wearing Smartband activity-tracking device. The zero-order correlations revealed
attitudes, subjective norm and perceived behavioural control were significantly
correlated with behavioural intentions. None of the variables were significantly
correlated with steps taken with the Smartband or steps taken without the Smartband.
22
Table 3 Zero-Order Correlations, Means and Standard Deviations of Variables
Variable 1 2 3 4 5 6 M SD
1. Attitude — .18 .45** .52** -.08 -.01 6.19 .70
2. Subjective norm — .32** .25* -.05 .04 6.10 1.06
3. Perceived behav. cont. — .56** .06 .22 6.08 .95
4. Intention — -.01 .06 5.98 .94
5. Steps with Smartband — 46453.03 22164.38
6. Steps without Smartband — 34768.20 21025.69
* p < .05. ** p < .01.
In testing the hypothesis, a number of multiple regression analyses were
computed. The first tested the validity of the theory of planned behaviour with
behavioural intention regressed on attitude, subjective norm and perceived
behavioural control. The results of the regression indicated that three variables
accounted for 38% of the variance in participant’s behavioural intentions to engage in
physical activity (R2 = .38, F (3, 65) = 14.94, p < .001). Participants’ attitudes towards
physical activity (β = .335, p = .003, 95% CI = .164-.738), subjective norms (β = .057,
p = .574, 95% CI = -.128-.229), and perceived behavioural control (β = .393, p = .001,
95% CI = .169-.607), were positively correlated with intentions.
In the second multiple regression analysis, behavioural intention and
perceived behavioural control were tested to determine if they were predictors of
physical activity (steps) when wearing the Smartband. The results of the regression
indicated that the two predictors explained 2% of the variance (R2 = .024, F (2, 66) =
.19, p = .829). It was found that perceived behavioural control did not predict steps (β
= .090, p = .544, 95% CI = -4790.683-9009.847) and behavioural intention did not
either (β = -.059, p = .693, 95% CI = -8363.480-5595.075).

23
In the third multiple regression analysis, behavioural intention and perceived
behavioural control were tested to determine if they were predictors of physical
activity (steps) when not wearing the Smartband. The results of the regression
indicated that the two predictors explained 3% of the variance (R2
= .03, F (2, 66) =
1.87, p = .163). It was found that perceived behavioural control did not predict steps
(β = .268, p = .068, 95% CI = -448.660-12324.269) and behavioural intention did not
either (β = -.087, p = .551, 95% CI = -8398.867-4520.0321). Table 4 shows a
summary of each of the multiple regression results.
Table 4 Multiple Regression Analysis Predicting Intention and Physical Activity Steps
Criterion and Predictor R2adj F df β
Predicting Intention .38 14.94** 3, 65
Attitude .34**
Subjective norm .06
Perceived behavioural control .39**
- - - - - - - - - - - - - - - - - - - - - - - - - - - - - - - - - - - - - - - - - - - - - - - - - - - - - - - - -
Predicting Steps with Smartband .02 .19 2, 66
Intention -.06
Perceived behavioural control .09
- - - - - - - - - - - - - - - - - - - - - - - - - - - - - - - - - - - - - - - - - - - - - - - - - - - - - - - - -
Predicting Steps without Smartband .03 1.87 2, 66
Intention -.09
Perceived behavioural control .27
** p < .01.
H3 the hypothesis was tested using multiple regressions to analyse any
significant relationship between total time spent travelling by vehicle transport, total
time spent communicating by mobile and the total number of steps taken. Neither
transport (β = -.014, p = .915) nor communication (β = .053, p = .684) were
significant predictors of engagement in physical activity (steps taken) for participants
of week 1. Both variables explained 3% of the variance (R2 = .030, F (2, 60) = .09, p
24
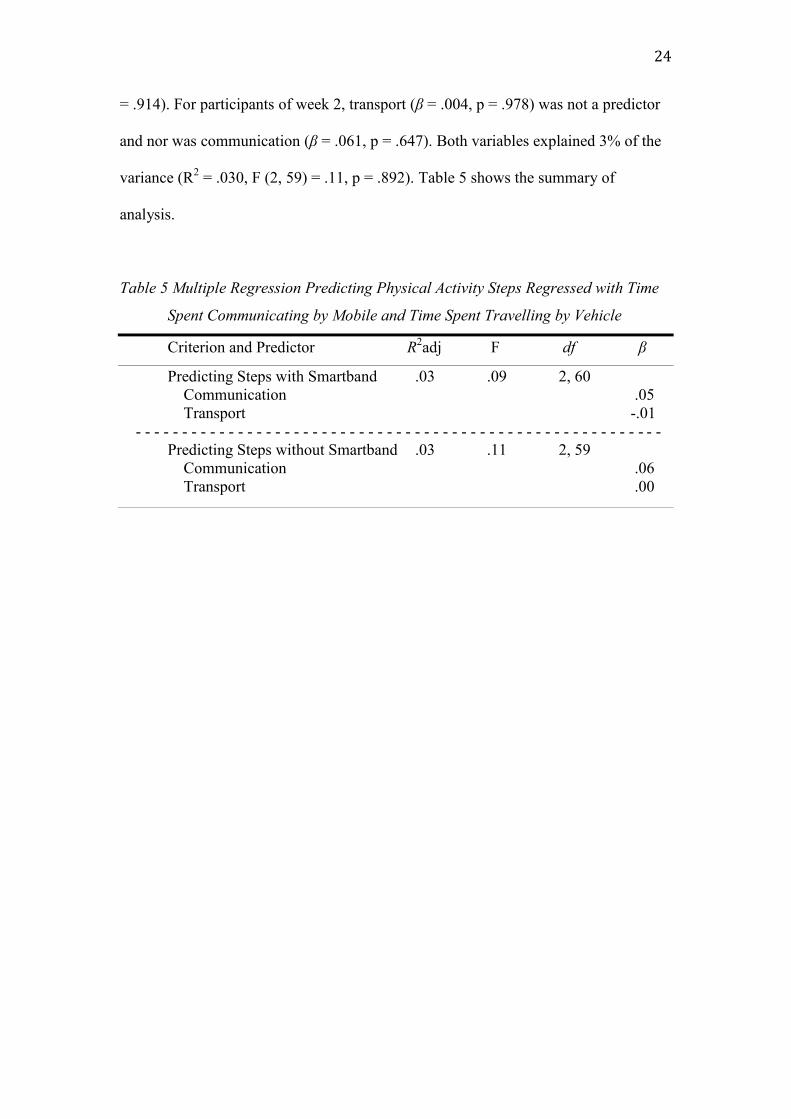
= .914). For participants of week 2, transport (β = .004, p = .978) was not a predictor
and nor was communication (β = .061, p = .647). Both variables explained 3% of the
variance (R2 = .030, F (2, 59) = .11, p = .892). Table 5 shows the summary of
analysis.
Table 5 Multiple Regression Predicting Physical Activity Steps Regressed with Time
Spent Communicating by Mobile and Time Spent Travelling by Vehicle
Criterion and Predictor R2adj F df β
Predicting Steps with Smartband .03 .09 2, 60
Communication .05
Transport -.01
- - - - - - - - - - - - - - - - - - - - - - - - - - - - - - - - - - - - - - - - - - - - - - - - - - - - - - - - -
Predicting Steps without Smartband .03 .11 2, 59
Communication .06
Transport .00
25
Discussion
The present study had a number of objectives. The first was to determine
whether mobile connected activity-tracking smart devices could positively change
physical activity health behaviour. The second objective of the present study was to
investigate the predictive utility of the Theory of Planned Behaviour (TPB) across a
wide age range sample of adults who participated by wearing an activity-tracking
technological intervention. The third objective was to explore any relationship
between the amount of time spent travelling by vehicle (i.e. car or bus) and the
amount of time spent communicating by mobile (i.e. texting, calling, emailing, social
media) on a person’s levels of physical activity (measured in steps) engagement.
The results of both Smartband weeks and non-Smartband weeks show that
males were significantly more active that females. These findings were consistent
with findings from previous physical activity research (Azevedo 2007; Davis et al.
2009; Bardus 2012). According to the National Health Service (2015), a person takes
on average 3,000-4,000 steps per day. The findings of this study held some support
for this with average daily steps count of participants without the Smartband being
4966 steps. However, with an average of 6636 steps per day taken when wearing the
Smartband, this indicates a strong increase (approx. 25%). Interestingly, many health
organisations also advocate a 5-day a week physical activity target and although while
wearing the Smartband, less than ten percent of participants reached the 70,000
weekly steps marker recommended by health organisations (Irish Heart Foundation,
2015; NHS, 2015), of interest is that 39.1% of participants in this study surpassed
50,000 steps within the week while wearing the Smartband. This is encouraging as it
26
suggests that the integration of smartphone technology in changing physical activity
behaviour has positive immediate effects and supports related discussions outlined by
Luxton et al. (2011).
The preceding analysis supported the first hypothesis with results indicating a
strong uplift in the number of steps taken while wearing the Smartband activity-
tracking device. In addition, the findings suggest that receiving health
warnings/advice messages are not a significantly influential factor in changing
physical activity health behaviour. Importantly, these findings support the inclusion of
self-monitoring technology as an effective tool in positively changing physical
activity health behaviour. Furthermore, findings suggest that worldwide health
organisations such as World Health Organisation, Irish Health Organisation and the
UK’s National Health Service may need to review and adapt their approach
somewhat, insofar as physical activity health warnings and advice alone, are perhaps
not as greatly affective as other potential alternatives or additions. Recommendations
for stronger health warning messages through practical visual examples are advised.
One commonly used method is the use of advertisement called “shock advertising”
where messaging and imagery are used to disturb the target audience. Research by
Manchanda, Dahl and Frankenberger (2002) found support for its use, however, the
effectiveness of shock advertising in the modern era has been questioned, with
suggestions that an alternative method is required in order to capture the attention of
audiences (Urwin & Venter, 2014).
In testing the second hypothesis, findings indicated that the Theory of Planned
Behaviour was not a strong predictor of physical activity engagement whether
27
wearing or not wearing the activity-tracking Smartband. Although, the TPB model
has had substantial support for predicting physical activity behaviour (Galea & Bray,
2006; Armitage, 2005), there was no supportive evidence found in this present study
and the null cannot be rejected. The findings raise questions to the validity of TPB’s
model in terms of its application in a modern day setting where technology and the
development of smart connected devices that allow real-time precise activity-tracking
capabilities have become very relevant. The evidence indicates an unpredictably of
the level of physical activity a person may engage in and be spurred on if wearing an
activity tracking-device.
In testing the third hypothesis, findings indicate that neither the time a person
spends travelling by means of transport such as car or bus, nor the time a person
spends communicating by mobile device, have any significant determination on the
level of physical activity that person engages in. These findings counter those found
by Lepp et al. (2013) linking physical inactivity with heavy mobile phone usage. The
findings also counter suggestions and claims made linking the usage of sedentary
modes of travel to causes of obesity and inactivity (Kozo et al. 2012; National Heart,
Lung and Blood Institute, 2016; Harvard T.H. Chan, 2016, para 10-13). As such, the
null cannot be rejected.
Upon completion of experiment, feedback was gathered from the participant’s
available to comment, which included the majority of sample. Some important
observations were noted. Firstly, a very high number of the participants explained that
they felt propelled to engage in more physical activity more so when wearing the
Smartband and that this was purely due to the Smartband being constantly strapped to
28
their wrist, acting as somewhat of a constant all-day reminder. This is interesting, as
bearing in mind, the Lifelog mobile application remained operational also during the
week-off (no Smartband) period, still collecting data and allowing participants to
easily check their daily activity recorded levels. Secondly, participant’s explained that
the real-time data that was collected and observational through the Lifelog application
presented them with never seen before insights about their actions and these new
“learnings” impacted their decisions more. For example: individuals were able to
observe and compare calculations of their time spent physically active versus long
hours travelling by car or public transport. These insights influenced decisions, for
example, parking the car in a space further from the door or climbing the stairs
instead of taking the elevator. Thirdly, some participants revealed a positive knock on
affect on friends, family and work colleagues. For example, a participant sharing the
same office environment as work colleagues, with similar daily hours spent stationed
at a computer desk, explained how a behavioural change to physical activity had
spread to the colleagues who had recognised similar patterns. Lastly, participants
admitted that when paired with experimental partners, they felt a natural competitive
driver. These last two points provide support for the findings by Farrell et al. (2016)
suggesting relationship partners are influential to changing health-related behaviour in
one another.
Limitations and suggestions for future research
In this study, the theory of planned behaviour components did not prove to be
valid predictors of the physical activity a person might engage in whilst wearing a
tracking device that allows the user to self-monitor their recorded activity statistics in
real-time. However, a number of suggestions are made in order to investigate further
29
the validity of the theory in a technology lead contextual setting. Inclusively, the
experiment strengths, limitations and suggestions for future research are discussed.
Future research that gives closer examination to the theory of planned
behaviour variables and their predictive measures within a setting open to influences
by advanced technology is required. Although the theory of planned behaviour model
has been applied profusely to social behaviours, the validity of the theory of planned
behaviour measures appears to have never been tested in the context whereby an
individual’s behaviour is influenced and monitored by a mobile connected tracking
device.
One key advantage had in this experiment is that the activity-tracking data
records cannot be manipulated, avoiding for any misleading information or error in
memory by the participant. However, a limitation is identified in the time spent not
wearing the Smartband and relying solely on the Lifelog application to record
accurate activity. Although participants were instructed to carry their mobile device
with them as much as possible, some participants later admitted this wasn’t always
feasible. As such, the data captured from the participant’s time without the Smartband
may not be completely accurate.
Another limitation to the study was the short timeframe afforded to conduct
the experiment. Although the experiment ran for a two-week period, the recruitment
of participants and data collection occupied a number of months. Furthermore, there
were a number of participants who had experienced set-up issues in the initial stages,
which delayed the process. Retrieving data capture from participants was at times

30
laborious. However, for the most part, participants were very efficient with delivery
of data. A suggestion for future research would be to explore the development of
habits and behavioural changes over a longitudinal experimental design. This would
allow observation of genuine changes and the stability of behavioural characteristics.
Additionally, both an increase in the experiment sample size as well as segmenting
the sample to target individuals identified as physically underactive are suggested.
Although the sample in this study was representative of the population, greater
external validity would be achieved with a larger one. Due to material costs and
availability, there was a further limitation to recruiting a larger sample. To offset costs
and manage available device inventory effectively, relationship partners were
recruited. In this instance, both participants would begin experiment in opposing
weeks and rotate Smartband between week 1 and week 2. In summary, future research
in this area of should aim to obtain larger funding support, greater freedom of time
and a target a sample population identified as physically underactive.
Another suggestion for future research is to include a relationship partner
element. According to Farrell et al. (2016), relationship partners play an influential
role in the health related behaviour of one another. Feedback received from
participants in this study would suggest this is an avenue worth pursuing.
It was observed that some participants felt inclined to achieve a certain
number of daily steps in order to impress, avoid embarrassment or not “let down” the
experimenter. Future research needs to address this issue by reducing the familiarity
between experimenter and participants. A longitudinal design experiment may help
reduce this and allow patterns to be identified.
31
Conclusion
In conclusion, this unique study differs from many previous studies analysing
health behaviour in that it involved the use of relevant modern day technology in the
investigation. The findings support the endorsement and use of self-monitoring
activity-tracking devices in the domain of health. However, the sustainability of
targeted health behaviour is yet to be explored and a number of shortcomings still
exist in the research with future research options plentiful. Furthermore, it would be
valuable to closely examine the theory of planned variables in relation to a
technologically influenced context.
32
References
Ajzen, I. (1991). "The theory of planned behavior". Organizational Behavior and
Human Decision Processes 50 (2): 179–211. doi:10.1016/0749-
5978(91)90020-T.
Ajzen, I. (2006). Designing a TPB questionnaire. Retrieved 8th April, 2015, from
http://people.umass.edu/aizen
Armitage, C. J. (2005). Can the Theory of Planned Behavior Predict the Maintenance
of Physical Activity? Health Psychology, 24(3), 235-245. doi:10.1037/0278-
6133.24.3.235
Azevedo, M.R., Araújo, C.L., Reichert, F.F., Siqueira, F.V.Marcelo, da Silva, C., &
Hallal, P.C. (2007). International Journal of Public Health, 52(1): 8–15. doi:
10.1007/s00038-006-5062-1. Retrieved March 12, 2016 from:
http://www.ncbi.nlm.nih.gov/pmc/articles/PMC2778720/
Bardos, M. (2012). Theory of Planned Behaviour, Participation and Physical Activity
Communication in the Workplace. Retrieved March 12, 2016 from:
https://doc.rero.ch/record/29176/files/2012COM001.pdf
BBC (2015). Do you really need to take 10,000 steps a day to keep fit? Retrieved
December 8, 2015, from: http://www.bbc.com/news/magazine-33154510
Belloc NB, Breslow L. (1972). Relationship of physical health status and health
practices. Prev Med. 1972 Aug;1(3):409–421.
Biswas, A., Oh, P.I., Faulkner, G.E., Bajaj, R.R., Silver, M.A., Mitchell, M.S. &
Alter, D.A. (2015). Sedentary time and its association with risk for disease
Incidence, mortality, and hospitalization in adults: a systematic review and
meta-analysis. Annals of Internal Medicine, 162(2), 123-32. doi: 10.7326/
33
M14-1651. Retrieved December 12, 2015, from http://annals.org/article.aspx?
articleid=2091327
Bolin, R. C. (2013). Mobile Health Technology and Health Behaviour. A Look into
the Workplace Setting. Theses and Dissertations--Community and Leadership
Development. Paper 5. http://uknowledge.uky.edu/cld_etds/5
Brunstein, A., Brunstein, J., & Mansar, S.L (2012). Integrating Health Theories in
Health and Fitness Applications for Sustained Behavior Change: Current State
of the Art. Creative Education, 3(1-5). doi:10.4236/ce.2012.38b001
Bryan, A., Fisher, J.D., & Fisher, W.A. (2002). Tests of the mediational role of
preparatory safer sexual behavior in the context of the theory of planned
behavior. Health Psychology, 21(1), 71-80. doi:10.1037/0278-6133.21.1.71
Comreg (2015). Irish Communications Market. Quarterly Key Data Report, Q2 2015.
Retrieved from: http://www.comreg.ie
Central Statistics Office (2014). National Travel Survey 2014. Average journey
profile by mode of travel. Retrieved from: http://www.cso.ie/en/
releasesandpublications/ep/p-nts/nationaltravelsurvey2014/keyfindings/
Davis, M.G., Shill, J.E., Thompson, J.L. & Fox, K.R. (2009). Objectively Measured
Patterns Of Physical Activity: The Older People And Active Living (opal)
Project: 2524. Medicine & Science in Sports & Exercise 41(1): 374-375
doi: 10.1249/01.MSS.0000355689.52541.f7
Dishman, R. K. (1982). Compliance/adherence in health-related exercise. Health
Psychology, 1(3), 237-267. doi:10.1037/0278-6133.1.3.237
Direito, A., Dale, L.P, Shields, E., Dobson, R., Whittaker, R., & Maddison, R.,
(2014). Do physical activity and dietary smartphone applications incorporate
34
evidence-based behaviour change techniques? BioMed Central Public Health,
14(646). doi: 10.1186/1471-2458-14-646.
Ekelund, U., Ward H.A., Norat T., Luan J., May A.M., Weiderpass E.,… Riboli, E.
(2015). Physical activity and all-cause mortality across levels of overall and
abdominal adiposity in European men and women: the European Prospective
Investigation into Cancer and Nutrition Study (EPIC). The American Journal
of Clinical Nutrition, 2015; 101(3): 613-621. doi: 10.3945/ajcn.114.100065.
Fasi.ie (2012). Consumer Doc Post Consultation FINAL. Retrieved from:
https://www.fsai.ie
Faulkner, G. E. J., & Taylor, A. H. (2005). Exercise, health and mental health:
Emerging relationships. London: Routledge.
Galea, M. N. & Bray, S. R. (2006). Predicting walking intentions and exercise in
individuals with intermittent claudication: An application of the theory of
planned behavior. Rehabilitation Psychology, 51(4), 299-305.
doi:10.1037/0090-5550.51.4.299
Godin, G., & Shephard, R. J. (1997). Godin Leisure-Time Exercise Questionnaire.
Medicine and Science in Sports and Exercise. Retrieved from
http://www.godin.fsi.ulaval.ca/EN_Index.html
Harvard T.H. Chan School of Public Health (2016). Obesity Causes: Physical
Activity. Retrieved March 14, 2016 from:
http://www.hsph.harvard.edu/obesity-prevention-source/obesity-
causes/physical-activity-and-obesity/
Howland, M., Farrell, A. K., Simpson, J. A., Rothman, A. J., Burns, R. J., Fillo, J., &
Wlaschin, J. (2016). Relational Effects on Physical Activity: A Dyadic
35
Approach to the Theory of Planned Behavior. Health Psychology,
doi:10.1037/hea0000334
Irish Heart Foundation (2015). Site location: Heart Health Information and
Resources: Be Active. Retrieved November 10, 2015, from:
http://www.irishheart.ie/media/pub/informationleaflets/new_donation_beactiv
e.pdf
Ito, T. A., Henry, E. A., Cordova, K. A., & Bryan, A. D. (2015). Testing an expanded
theory of planned behavior model to explain marijuana use among emerging
adults in a promarijuana community. Psychology Of Addictive Behaviors,
29(3), 576-589. doi:10.1037/adb0000098
Kozo, J., Sallis, J. F., Conway, T. L., Kerr, J., Cain, K., Saelens, B. E., & ... Owen, N.
(2012). Sedentary behaviors of adults in relation to neighborhood walkability
and income. Health Psychology, 31(6), 704-713. doi:10.1037/a0027874
Lepp, A., Barkley, J.E., Sanders, G.J., Rebold, M., & Gates, P. (2013). The
relationship between cell phone use, physical and sedentary activity, and
cardiorespiratory fitness in a sample of U.S. college students. International
Journal of Behavioral Nutrition and Physical Activity, 10(79).
doi: 10.1186/1479-5868-10-79
Lordan, G. & Pakrashi, D. (2015). Do All Activities “Weigh” Equally? How Different
Physical Activities Differ as Predictors of Weight. Risk Analysis, 35(11),
2069-2086. doi: 10.1111/risa.12417. Retrieved December 11, 2015, from
http://www.gracelordan.co.uk/wp-content/uploads/2015/11/RiskAnalysis
GLDP.pdf
36
Luxton, D. D., McCann, R. A., Bush, N. E., Mishkind, M. C., & Reger, G. M. (2011).
mHealth for mental health: Integrating smartphone technology in behavioral
healthcare. Professional Psychology: Research And Practice, 42(6), 505-512.
doi:10.1037/a0024485
Manchanda, R.V., Dahl, D.W. & Frankenberger, K.D. (2002) ,"Shocking Ads! Do
They Work?” Advances in Consumer Research, 29 (230-231). Retrieved from:
http://acrwebsite.org/volumes/8624/volumes/v29/NA-29
Marcus, B. H., Forsyth, L. H., Stone, E. J., Dubbert, P. M., McKenzie, T. L., Dunn,
A. L., & Blair, S. N. (2000). Physical activity behavior change: Issues in
adoption and maintenance. Health Psychology, 19(1, Suppl), 32-41.
doi:10.1037/0278-6133.19.Suppl1.32
Martin, R. J., Usdan, S., Nelson, S., Umstattd, M. R., LaPlante, D., Perko, M., &
Shaffer, H. (2010). Using the theory of planned behavior to predict gambling
behavior. Psychology Of Addictive Behaviors, 24(1), 89-97.
doi:10.1037/a0018452
Morris, M. E., & Aguilera, A. (2012). Mobile, social, and wearable computing and
the evolution of psychological practice. Professional Psychology: Research
And Practice, 43(6), 622-626. doi:10.1037/a0029041
National Health Service (2015). The 10,000 Step Challenge. Retrieved December 8,
2015, from http://www.bbc.com/news/magazine-33154510
National Heart, Lung and Blood Institute (2016). Health Topics: What Causes
Overweight and Obesity. Retrieved March 14, 2016 from:
http://www.nhlbi.nih.gov/health/health-topics/topics/obe/causes
37
Ogden, J. (2007). Health Psychology: A Textbook (4th
ed.). [Dawsonera version].
Retrieved October 10, 2015, from https://www.dawsonera.com/readonline/
9780335230105/startPage/48
Prochaska, J. J., & Sallis, J. F. (2004). A Randomized Controlled Trial of Single
Versus Multiple Health Behavior Change: Promoting Physical Activity and
Nutrition Among Adolescents. Health Psychology, 23(3), 314-318.
doi:10.1037/0278-6133.23.3.314
Ng, M., Fleming, T., Robinson, M., Blake, T., Graetz, N., Margono, C., . . . Gakidou,
E. (2014). Global, regional, and national prevalence of overweight and
obesity in children and adults during 1980-2013: a systematic analysis for the
Global Burden of Disease Study 2013. The Lancet 384(9945), p776-781.
Retrieved May 6, 2014 from http://www.thelancet.com/pdfs/journals/lancet/
PIIS0140-6736(14)60460-8.pdf
Rutter, D.R., & Quine, L. (2002). Changing health behaviour: Intervention and
research with social cognition models. Buckingham: Open University Press.
Safe Food (2015). Proportion of overweight and obese males and females to increase
in most European countries by 2030. Retrieved November 9, 2015, from:
http://www.safefood.eu/Professional/Nutrition/Nutrition-News/May-
2015/Proportion-of-overweight-and-obese-males-and-femal.aspx
Sonymobile (2015). Smartband SWR10. Retrieved December 7, 2015, from:
http://www.sonymobile.com/ie/products/smartwear/smartband-swr10/#tabs
Statista (2015). Health and fitness tracker global unit sales forecast 2014-2015, by
region. Retrieved December 19, 2015, from: http://www.statista.com/statistics/
413265/health-and-fitness-tracker-worldwide-unit-sales-region/

38
University Health Network (UHN). (2015, January 19). Sitting for long periods
increases risk of disease and early death, regardless of exercise. ScienceDaily.
Retrieved December 8, 2015, from
www.sciencedaily.com/releases/2015/01/150119171701.htm
Urwin, B., & Venter, M., (2014). Shock Advertising: Not So Shocking Anymore. An
Investigation among Generation Y. Mediterranean Journal of Social Sciences,
5(21). doi:10.5901/mjss.2014.v5n21p203
World Health Organisation (2015a). Global Action Plan: for the prevention and
control of noncommunicable diseases 2013-2020, p.5. Retrieved December
19, 2015, from: http://apps.who.int/iris/bitstream/10665/94384/1/
9789241506236_eng.pdf?ua=1
World Health Organisation (2015b). Factsheets: Obesity and Overweight. Retrieved
November 11, 2015 from: http://www.who.int/mediacentre/factsheets/
fs311/en/
World Health Organisation (2015c). Global Health Observatory data: Obesity.
Retrieved December 12, 2015, from: http://www.who.int/gho/ncd/risk_factors/
obesity_text/en/
Worldometers (2015). How many cars are there in the world currently. Retrieved
December, 15, 2015, from http://www.worldometers.info/cars/
39
Appendices
Theory of Planned Behaviour measures (Armitage, 2005):
Participant Instructions
Please answer each of the following questions by circling the answer that best
describes your opinion.
Some of the questions may appear to be similar, but they do address somewhat
different issues. Please read each question carefully.
In making your ratings, please remember the following points:
* Be sure to answer all items – do not omit any.
* Never circle more than one number on a single scale.
1. For me, participating in regular physical activity would be:
dull: 1 : 2 : 3 : 4 : 5 : 6 : 7 :interesting
2. For me, participating in regular physical activity would be:
unpleasant: 1 : 2 : 3 : 4 : 5 : 6 : 7 :pleasant
3. For me, participating in regular physical activity would be:
boring: 1 : 2 : 3 : 4 : 5 : 6 : 7 :stimulating
4. For me, participating in regular physical activity would be:
unhealthy: 1 : 2 : 3 : 4 : 5 : 6 : 7 :healthy
5. For me, participating in regular physical activity would be:
bad: 1 : 2 : 3 : 4 : 5 : 6 : 7 :good
6. For me, participating in regular physical activity would be:
useless: 1 : 2 : 3 : 4 : 5 : 6 : 7 :useful
7. People close to me think I should participate in regular physical activity.
disagree: 1 : 2 : 3 : 4 : 5 : 6 : 7 :agree
8. People who are important to me would . . . disapprove of my participating in
regular physical activity: 1 : 2 : 3 : 4 : 5 : 6 : 7 :approve of my participating in
regular physical activity”
9. People close to me think I . . . . . . . . . . . . . . . . . . . . should not participate in
regular physical activity: 1 : 2 : 3 : 4 : 5 : 6 : 7 :should participate in regular physical
activity.”

40
10. To what extent do you see yourself as being capable of participating in regular
physical activity? incapable: 1 : 2 : 3 : 4 : 5 : 6 : 7 :capable
11. How confident are you that you will be able to participate in regular physical
activity? not very confident: 1 : 2 : 3 : 4 : 5 : 6 : 7 :very confident
12. I believe I have the ability to participate in regular physical activity.
definitely do not : 1 : 2 : 3 : 4 : 5 : 6 : 7 :definitely do
13. How much personal control do you feel you have over participating in regular
physical activity? no control : 1 : 2 : 3 : 4 : 5 : 6 : 7 :complete control.
14. How often do you intend to take part in regular physical activity?
never: 1 : 2 : 3 : 4 : 5 : 6 : 7 :frequently
15. I want to exercise regularly. definitely do not: 1 : 2 : 3 : 4 : 5 : 6 : 7 :definitely do
Leisure-Time Exercise Questionnaire Godin, G., & Shephard, R. J. (1997).
INSTRUCTIONS
Please answer the following question as honestly as possible.
Participant Question:
1. During a typical 7-Day period (a week), in your leisure time, how often do you engage in
any regular activity long enough to work up a sweat (heart beats rapidly)?
OFTEN SOMETIMES NEVER/RARELY
1. � 2. � 3. �
Please circle you relative age group: 18-24 years old 25-34 years old 35-44 years old 45-54 years old 55-64 years old 65 or older years old

41
Research Topic: Health Behaviour with Activity Tracking Technology
You are invited to participate in a research study that will form the basis for an
undergraduate thesis. Please read the following information before deciding whether
or not to participate.
What are the objectives of the study? The full nature of this study requires
participants to be naive to the exact research question, as information about the
research may influence your behaviour and responses. For this reason we can only
inform you that we are conducting research on the physical activity behavioural
intentions of adults. A complete debriefing will be offered after participation, where
any questions will be answered.
Why have I been asked to participate? I would like to collect information from
different people. The research requires participants to take part that meet the
following criteria. Each participant should:
be 18 years of age or more
be of considerable good health (free from illness or injury)
Have ownership or access to an Android mobile device for duration of the
experiment
What does participation involve?
Firstly, participants are asked to complete a short set of questions related to their
levels of physical activity and health behaviour.
Participants are asked to allow the Sony Mobile Lifelog GPS tracking application
downloaded on their mobile phone device to allow accurate records of the
participant’s daily physical activity levels.
Participants are asked to wear an activity-tracking device for the duration of 1 full
week.
Finally, the researcher will meet with the participant after the completed 2 weeks to
collect equipment, collect the statistical data from the Lifelog application and collect
participant feedback. Photographic screen-shots of the data may be taken and
temporarily saved. This will help speed the process.
Right to withdraw Participants have the right to withdraw from the research at any
time for whatever reason. Participants can also request at any time to have their
response data removed from record.
Confidentiality All individual information collected, as part of the study will be used
solely for presentation purposes. Should this study be published, only pooled results
will be documented. At no point will any participant be identifiable. All data will be
stored safely and destroyed within a reasonable time frame.
Contact Details
If you have any further questions about the research you can contact:
Researcher Colin O’Shea: [email protected]
Supervisor Dr. Patricia Frazer: xxx or [email protected]

42
Researcher: Colin O’Shea
Supervisor: Dr. Patricia Frazer
Consent Form
A Study related to health behaviour and Activity Tracking Technology
I have read and understood the attached Information Leaflet regarding this study. I
have had the opportunity to ask questions and discuss the study with the researcher
and I have received satisfactory answers to all my questions.
I understand that I am free to withdraw from the study at any time without giving a
reason and without this affecting my training.
I agree to take part in the study.
Participant’s Signature: ______________________________ Date: _________
Participant’s Name in print: _________________________
13-14 Aungier Street,
Dublin 2, Ieland.
Telephone: (01) 417 7500
Facsimile: (01) 417 7543
Email: [email protected]
Website: www.dbs.ie
43
Participant Instructions
1) Please read through the included forms.
2) Sign consent form, take a picture and return via email or post forms back
3) Complete questionnaire, take a picture return via email or post forms back
Email: [email protected]
Address: XXX Dublin
Smatband Set-up instructions
Your android mobile must have android software 4.4 or later – to check, go to:
settings, scroll to “about phone” and then scroll to “android version”.
Charge your smartband for 30 minutes – this will give you approximately 5
days battery. You can use your mobile charger or the included data cable by
plugging into a laptop.
Go to Google Play Store – download the following two apps:
- App1) Sony Lifelog – please enter app, login with Google+, then select
“allow”, then log into Lifelog with your age, weight, height, etc. I don’t need
any of this data. It is just to help the Smartband measure your activity better.
- App2) Sony Smartband SWR10 – this app will not appear on your apps box so
don’t worry if you don’t see it. Just make sure it downloads correctly. There
will be an automatic firmware update to update the software to the latest.
- Turn Bluetooth and NFC on, on your mobile. Put the smartband into pairing
mode and pair with your mobile. Wait until it connects. You may need to try a
couple of times.
The best way to connect is through NFC (you may not have used this before
but it’s on your phones). Once you turn NFC on touch, the white core part of
the smartband at the back of your phone. You may need to move it around the
back of your phone until you find where the NFC magnet is. It’s usually at the
TOP - BACK part of your phone. If you connect via NFC, it will bring you to
your Google Play store to download the Smartband SWR10 app AND also
upgrade the firmware available for the smartband.

44
- You can check whether the smartband is connected to your mobile by
scrolling down from the top of your mobile screen. It should say whether
smartband is connected and how much battery you have remaining. It will also
say if Lifelog is running.
If you go through to settings on the Smartband SWR app, you can choose some cool
notifications like “smart wake-up, out-of-range alert, etc”.
Note the following:
Please ensure your Bluetooth & NFC are on for the 2 weeks. Your Google
GPS should also be on (unless you’ve turned it off already, it will be set to
on).
Please ensure the following sections are in your Lifelog applicaton: 1) Steps,
2) Transport (picture of a bus), 3) Communication (symbol of two people). If
any of these are missing, please select “edit” and add them.
Please wear the Smartband for 1 complete week. Please retain mobile phone
on you 1 complete week without wearing it. Ensure that Lifelog app is
installed and logged in for the complete 2 weeks.
The data required after two weeks is the following: total week steps count, total week
communication hours (two people symbol), total week transport. If you could mail
or whatsapp me screen shots, that would be perfect.
If you start the experiment midweek, for example on a Tuesday or Wednesday, you
will need to send me 3 screen shots of each section (steps, communications,
transport). This will cover the complete two weeks. 1 week with the smartband. 1
week without. I can help with this later so don’t worry.
Any questions or queries please mail me or message me on xxx

45
Each participant received print-out of following webpage re. 10,000 steps:
http://www.nhs.uk/Livewell/loseweight/Pages/10000stepschallenge.aspx

![University of Edinburgh Welcome Week 2016 Principal’s ... · Principal’s Welcome Ceremony [Bagpipe music 00:00:11 – 00:03:00] Tim O’Shea: Good afternoon, I’m Tim O’Shea,](https://img.dokumen.tips/doc/110x75/607f9a20b8163a003f2daff9/university-of-edinburgh-welcome-week-2016-principalas-principalas-welcome.jpg)

![*Xiaohu Sang1a , Xiaojun Zhou1b, Xiaoguang Liu1c[4] Huang Jiangxing, Research for Double-enveloping Cycloid Internal Gear Pump, Machine Tool & Hydraulics. 4 (2010) 1. [5] Colin O’Shea,](https://img.dokumen.tips/doc/110x75/60e3a7b1b7191e2853439c88/xiaohu-sang1a-xiaojun-zhou1b-xiaoguang-liu1c-4-huang-jiangxing-research-for.jpg)