Embed Size (px)
Citation preview

Cold Regions Science and Technology 123 (2016) 155–163
Contents lists available at ScienceDirect
Cold Regions Science and Technology
j ourna l homepage: www.e lsev ie r .com/ locate /co ld reg ions
Effect of water during freeze–thaw cycles on the performance anddurability of lime-treated gypseous soil
Abdulrahman Aldaood a,b, Marwen Bouasker a, Muzahim Al-Mukhtar a,⁎a Université d'Orléans, CRMD-CNRS & PRISME-UPRES n°4229, 8 Rue Léonard de Vinci, 45072 Orléans, Franceb Civil Engineering Department, College of Engineering, Mosul University, Al-Majmooah Street, Mosul, Iraq
⁎ Corresponding author.E-mail address: [email protected]
http://dx.doi.org/10.1016/j.coldregions.2015.12.0080165-232X/© 2016 Elsevier B.V. All rights reserved.
a b s t r a c t
a r t i c l e i n f oArticle history:Received 12 February 2014Received in revised form 11 December 2015Accepted 14 December 2015Available online 6 January 2016
Research on the freeze–thaw durability of soils in general and on the variation in moisture conditions in partic-ular is vital for both economic and stability reasons. The present study is an attempt to further understand theprocess of freeze–thaw deterioration under two different test procedures (an open system with water uptakeduring thawing and a closed systemwith only initialwater content), bymeasuring the strength, gas permeability,mineralogical, and microstructural properties of lime-treated gypseous soil. The study involved fine-grained soilwith different gypsum contents (0%, 5%, 15%, and 25%) of soil dry weight. The soil samples were treated with 3%lime and cured for 28 days at 20 °C, then subjected to 12 freeze–thaw cycles in both open and closed systems,following theASTM test procedure. A detailed parametric study (laboratory study)was conducted in order to un-derstand the behavior of these soils. Results show that the tested characteristics of the soil samples dependedconsiderably on the water available during the freeze–thaw procedure and on the gypsum content. Unconfinedcompressive strength decreased and gas permeability increased with increasing gypsum content and number offreeze–thaw cycles. The water content of the soil samples is a key parameter of the stability of earth structuresunder freeze–thaw conditions.
© 2016 Elsevier B.V. All rights reserved.
Keywords:Water contentFreeze–thaw cyclesGypseous soilLime stabilizationGas permeabilityUnconfined compressive strength
1. Introduction
In cold regions, soils are exposed to at least one freeze–thaw (F–T)cycle every year (Kalkan, 2009). At shallow depths, the number of F–Tcycles can be more than one due to fluctuations in the air temperature(Hohmann-Porebska, 2002). In fact, the effect of F–T cycles dependson the number of cycles, the cycle duration (length of the freeze andthaw periods), the cooling rate, and the thaw temperature (Dempseyand Thompson, 1972; Khoury and Brooks, 2010; Khoury and Zaman,2007). Cyclic F–T deterioration is known to be the major source of soildeterioration in most cold regions. Damage can take various forms,the most common being cracking and spalling on different scales(Aldaood et al., 2014b; Aubert and Gasc-Barbier, 2012; Yarbasi et al.,2007). In addition, the strength and durability of soils are reduced byF–T cycles (Aldaood et al., 2013, 2014b; Bin-Shafique et al., 2011; Jafariand Esna-ashari, 2012; Kamei et al., 2012; Wang et al., 2007). Mechan-ical and physical properties of the soil, such as porosity, moisture con-tent, capillary rise, and type of soil, play an important role in thedegree of damage from F–T cycles (Kamei et al., 2012).
Gypseous soils, which are found in many parts of the world, are acollapsible soil, which causes extensive damage to constructions uponwetting (Karakouzian et al., 1996; Mansour et al., 2008). They are
(M. Al-Mukhtar).
classified as problematic soils due to their complex and unpredictablebehavior. Severe climatic conditions such as F–T cycles have the poten-tial to change the engineering properties of gypseous soil (Aldaoodet al., 2013, 2014b). In the geotechnical engineering field, this causesmajor problems as the properties of the soil materials on constructionsites are non-durable and unstable and therefore do not meet the spec-ification requirements. Hence, soil improvement is an important ele-ment in studying the geotechnical properties of gypseous soil underenvironmental conditions. Lime stabilization is a chemical processwhereby unstable gypseous soil is transformed to a stable one(Aldaood et al., 2014a; Al-Zubaydi, 2011), making it suitable for con-struction. The immediate effect of lime stabilization is cation exchange.This process is primarily responsible for modifying engineering proper-ties, such as workability, and reduces plasticity (Al-Mukhtar et al.,2010a; Bell, 1996; Little, 1995; Mathew and Rao, 1997). Further, to theimmediately affect flocculation caused by cation exchange, lime stabili-zation also has a long-term effect, called the pozzolanic reaction. Thisreaction produces stable calciumsilicate hydrates (CSH), calciumalumi-nate hydrates (CAH), and calcium alumino-silicate hydrates (CASH) asthe calcium reacts with the aluminates and silicates solubilized fromclay particles. Pozzolanic reactions are time-dependent and thus soilstrength develops gradually over a long time (Al-Mukhtar et al.,2010a; Little, 1995).
In lime-stabilized soil, the water content is one of the main compo-nents responsible for its increase in strength and at the same time one
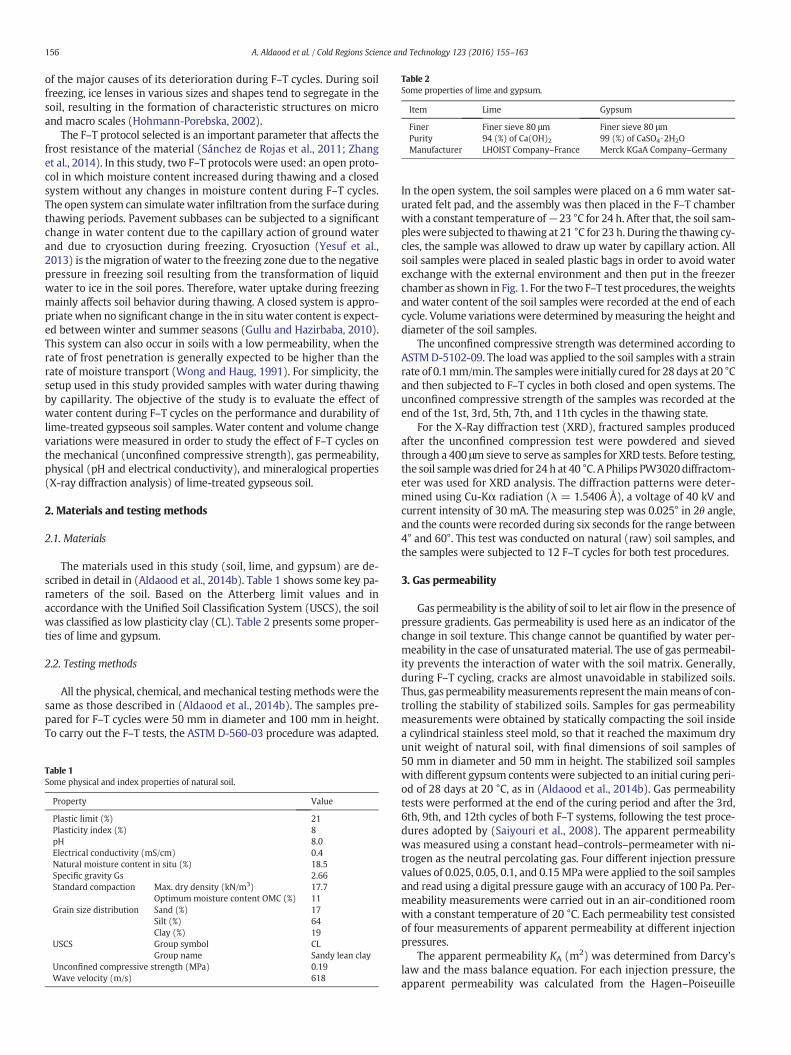
Table 2Some properties of lime and gypsum.
Item Lime Gypsum
Finer Finer sieve 80 μm Finer sieve 80 μmPurity 94 (%) of Ca(OH)2 99 (%) of CaSO4 ⋅2H2OManufacturer LHOIST Company–France Merck KGaA Company–Germany
156 A. Aldaood et al. / Cold Regions Science and Technology 123 (2016) 155–163
of the major causes of its deterioration during F–T cycles. During soilfreezing, ice lenses in various sizes and shapes tend to segregate in thesoil, resulting in the formation of characteristic structures on microand macro scales (Hohmann-Porebska, 2002).
The F–T protocol selected is an important parameter that affects thefrost resistance of the material (Sánchez de Rojas et al., 2011; Zhanget al., 2014). In this study, two F–T protocols were used: an open proto-col in which moisture content increased during thawing and a closedsystem without any changes in moisture content during F–T cycles.The open system can simulatewater infiltration from the surface duringthawing periods. Pavement subbases can be subjected to a significantchange in water content due to the capillary action of ground waterand due to cryosuction during freezing. Cryosuction (Yesuf et al.,2013) is themigration of water to the freezing zone due to the negativepressure in freezing soil resulting from the transformation of liquidwater to ice in the soil pores. Therefore, water uptake during freezingmainly affects soil behavior during thawing. A closed system is appro-priate when no significant change in the in situ water content is expect-ed between winter and summer seasons (Gullu and Hazirbaba, 2010).This system can also occur in soils with a low permeability, when therate of frost penetration is generally expected to be higher than therate of moisture transport (Wong and Haug, 1991). For simplicity, thesetup used in this study provided samples with water during thawingby capillarity. The objective of the study is to evaluate the effect ofwater content during F–T cycles on the performance and durability oflime-treated gypseous soil samples. Water content and volume changevariations were measured in order to study the effect of F–T cycles onthe mechanical (unconfined compressive strength), gas permeability,physical (pH and electrical conductivity), and mineralogical properties(X-ray diffraction analysis) of lime-treated gypseous soil.
2. Materials and testing methods
2.1. Materials
The materials used in this study (soil, lime, and gypsum) are de-scribed in detail in (Aldaood et al., 2014b). Table 1 shows some key pa-rameters of the soil. Based on the Atterberg limit values and inaccordance with the Unified Soil Classification System (USCS), the soilwas classified as low plasticity clay (CL). Table 2 presents some proper-ties of lime and gypsum.
2.2. Testing methods
All the physical, chemical, andmechanical testingmethodswere thesame as those described in (Aldaood et al., 2014b). The samples pre-pared for F–T cycles were 50 mm in diameter and 100 mm in height.To carry out the F–T tests, the ASTM D-560-03 procedure was adapted.
Table 1Some physical and index properties of natural soil.
Property Value
Plastic limit (%) 21Plasticity index (%) 8pH 8.0Electrical conductivity (mS/cm) 0.4Natural moisture content in situ (%) 18.5Specific gravity Gs 2.66Standard compaction Max. dry density (kN/m3) 17.7
Optimum moisture content OMC (%) 11Grain size distribution Sand (%) 17
Silt (%) 64Clay (%) 19
USCS Group symbol CLGroup name Sandy lean clay
Unconfined compressive strength (MPa) 0.19Wave velocity (m/s) 618
In the open system, the soil samples were placed on a 6 mmwater sat-urated felt pad, and the assembly was then placed in the F–T chamberwith a constant temperature of−23 °C for 24 h. After that, the soil sam-pleswere subjected to thawing at 21 °C for 23 h. During the thawing cy-cles, the sample was allowed to draw up water by capillary action. Allsoil samples were placed in sealed plastic bags in order to avoid waterexchange with the external environment and then put in the freezerchamber as shown in Fig. 1. For the two F–T test procedures, theweightsand water content of the soil samples were recorded at the end of eachcycle. Volume variationswere determined bymeasuring the height anddiameter of the soil samples.
The unconfined compressive strength was determined according toASTMD-5102-09. The loadwas applied to the soil samples with a strainrate of 0.1mm/min. The sampleswere initially cured for 28 days at 20 °Cand then subjected to F–T cycles in both closed and open systems. Theunconfined compressive strength of the samples was recorded at theend of the 1st, 3rd, 5th, 7th, and 11th cycles in the thawing state.
For the X-Ray diffraction test (XRD), fractured samples producedafter the unconfined compression test were powdered and sievedthrough a 400 μmsieve to serve as samples for XRD tests. Before testing,the soil samplewasdried for 24 h at 40 °C. A Philips PW3020diffractom-eter was used for XRD analysis. The diffraction patterns were deter-mined using Cu-Kα radiation (λ = 1.5406 Å), a voltage of 40 kV andcurrent intensity of 30 mA. The measuring step was 0.025° in 2θ angle,and the counts were recorded during six seconds for the range between4° and 60°. This test was conducted on natural (raw) soil samples, andthe samples were subjected to 12 F–T cycles for both test procedures.
3. Gas permeability
Gas permeability is the ability of soil to let air flow in the presence ofpressure gradients. Gas permeability is used here as an indicator of thechange in soil texture. This change cannot be quantified by water per-meability in the case of unsaturated material. The use of gas permeabil-ity prevents the interaction of water with the soil matrix. Generally,during F–T cycling, cracks are almost unavoidable in stabilized soils.Thus, gas permeabilitymeasurements represent themainmeans of con-trolling the stability of stabilized soils. Samples for gas permeabilitymeasurements were obtained by statically compacting the soil insidea cylindrical stainless steel mold, so that it reached the maximum dryunit weight of natural soil, with final dimensions of soil samples of50 mm in diameter and 50 mm in height. The stabilized soil sampleswith different gypsum contents were subjected to an initial curing peri-od of 28 days at 20 °C, as in (Aldaood et al., 2014b). Gas permeabilitytests were performed at the end of the curing period and after the 3rd,6th, 9th, and 12th cycles of both F–T systems, following the test proce-dures adopted by (Saiyouri et al., 2008). The apparent permeabilitywas measured using a constant head–controls–permeameter with ni-trogen as the neutral percolating gas. Four different injection pressurevalues of 0.025, 0.05, 0.1, and 0.15MPawere applied to the soil samplesand read using a digital pressure gauge with an accuracy of 100 Pa. Per-meability measurements were carried out in an air-conditioned roomwith a constant temperature of 20 °C. Each permeability test consistedof four measurements of apparent permeability at different injectionpressures.
The apparent permeability KA (m2) was determined from Darcy'slaw and the mass balance equation. For each injection pressure, theapparent permeability was calculated from the Hagen–Poiseuille

Fig. 1. Soil samples subjected to (A) open system and (B) closed system of freeze–thaw test.
10,4
10,8
11,2
11,6
12
12,4
0 3 6 9 12
pH
(%
)
No. of Cycle
0%G Closed
5%G Closed
15%G Closed
25%G Closed
0%G Open
5%G Open
25%G Open
15%G Open
0
2
4
6
0 3 6 9 12
)mc/
Sm(
ytivitcu
dn
oClacirtcel
E
No. of Cycle
0%G Closed
5%G Closed
15%G Closed
25%G Closed
0%G Open
5%G Open
15%G Open
25%G Open
Fig. 2. pH (A) and electrical conductivity values (B) with freeze–thaw cycles.
157A. Aldaood et al. / Cold Regions Science and Technology 123 (2016) 155–163
relationship for the laminar flowof a compressible viscous fluid througha porous body using Eq. (1):
KA ¼ QA
2μLPatm
P2i −P2
atm
� � ð1Þ
where Q is the volumetric flow (m3/s), A is the cross-sectional area ofthe sample (m2), μ is the viscosity (1.76 × 10⁻⁵ Pa ⋅s for nitrogen gasat 20 °C), L is the thickness of the sample (m), Patm is the atmosphericpressure (Pa), and Pi is the injection pressure (Pa).
The application of Darcy's equation to the case of compressible gasesshows that the flow rate is not proportional to the differential pressurebetween the top and bottom of the sample but rather to (Pi2 − P2atm)(Bouazza and Vangpaisal, 2003). Darcy's law, which governs the flowof liquids in porousmedia, is based on viscousflow inwhich the velocityis zero along the pore walls. Non-zero velocities of the pore wall resultin a larger flow than that predicted by Darcy's law. This additionalflow is termed slip flow or drift flow. Many methods exist to estimatenon-viscous flow. The relationship proposed by Klinkenberg (1941)can be used to calculate the intrinsic permeability KV (m2), relative tothe viscous flow only, as in Eq. (2):
KA ¼ KV 1þ bPm
� �ð2Þ
where b is the Klinkenberg coefficient (Pa) and Pm is the mean gaspressure.
Pm ¼ Pi þ Patm
2ð3Þ
Todetermine the intrinsic permeability value (Kv), the apparent per-meability KA at different injection pressure values was plotted againstthe inverse of the mean pressure values (1/Pm). Then the intrinsic per-meability is the limiting value of permeability when the mean pressuretends toward infinity.
4. Results and discussion
4.1. pH and electrical conductivity
The variation in pH and electrical conductivity (EC) of the soil sam-ples in both F–T procedures is given in Fig. 2. The pH and EC values gen-erally decreased with an increasing number of F–T cycles. There was asignificant difference between the soil samples tested in the open andclosed systems: those tested in the open system showed a greater re-duction in pH and EC values than those tested in the closed system. A
further reduction was observed in the gypseous soil samples comparedwith samples without gypsum.
The reduction in pH and EC values was attributed, in general, to thedecrease in calcium (Ca2+) and hydroxyl (OH−) ions due to the pozzo-lanic reaction. The difference between these systems could be attributedto lime leaching and gypsum dissolution due to water absorption fromcapillary rise in open procedures. As the number of F–T cycles increases,the contact between water and sample components (i.e., soil, lime, andgypsum) also increases, which may cause lime leaching and gypsumdissolution.
4.2. Unconfined compressive strength (UCS)
Fig. 3 illustrates the effect of F–T cycles on the UCS of the soil sam-ples, which were tested in the thawed state. The UCS decreased as the

0
0,5
1
1,5
0 3 6 9 12
UC
S (
MP
a)
No. of Cycle
0%G Closed
5%G Closed
15%G Closed
25%G Closed
0%G Open
5%G Open
15%G Open
25%G Open
Fig. 3. Unconfined compressive strength variation with freeze–thaw cycles.
0
5
10
15
20
0 3 6 9 12
Vo
lum
e C
han
ge
(%)
No. of Cycle
0%G Open
5%G Open
15%G Open
25%G Open
0%G Closed
5%G Closed
15%G Closed
25%G Closed
A
158 A. Aldaood et al. / Cold Regions Science and Technology 123 (2016) 155–163
number of F–T cycles increased. Themaximum reduction in strength oc-curred after the first cycle. The UCS of soil samples tested in the closedsystem reached ≥500 kPa,while theUCS of those tested in the open sys-tem reached values of 100 kPa. The difference in strengths between thetwo systems increased with the number of F–T cycles, especially forsamples with a higher gypsum content. In the open system, the pres-ence of gypsum decreased the F–T durability compared with sampleswithout gypsum. The highest UCS value was obtained for the soil sam-ple tested in the closed system, with gypsum addition of 5%. This per-centage of lime addition has been identified as optimal for thestabilization of this type of gypseous soil (Aldaood et al., 2014a). This re-duction in the UCS can be attributed to the increased water content inthe open system, the increased volume, and the formation of ettringite.Lastly, it is well known (Al-Mukhtar et al., 2010b) that the increasein strength of stabilized soil samples usually depends on the curingconditions (curing times and temperature).Moreover, the freezing tem-perature (−23 °C) had a more significant effect than the thawing tem-perature (21 °C) on the deceleration of the pozzolanic reactions(Aldaood et al., 2013). The small increase in the UCS values of soil sam-ples cured for 52 days (28 days of initial curing and 24 days of F–T cy-cles), namely, 0.9, 1.7, 1.1, and 1.0 MPa for 0, 5, 15, and 25% gypsumcontent, respectively, indicates that the pozzolanic action did not devel-op during curing because of freezing.
4.3. Water content and volume changes during F–T cycles
The final water content of the soil samples during F–T cycles, shownin Fig. 4, can be compared to the initial water content of the samples(i.e., 28 days of curing at 20 °C). A rough calculation of thewater contentat saturation (wsat) of the tested samples using standard compaction,i.e.,maximum dry density of 17.7 kN/m3 and optimummoisture contentof 11%, gives a wsat of about 20%. Fig. 4 shows that the water content of
0
10
20
30
40
0 3 6 9 12
w/c
(%
)
No. of Cycle
0%G Open
5%G Open
15%G Open
25%G Open
0%G Closed
5%G Closed
15%G Closed
25%G Closed
Fig. 4.Water content with freeze–thaw cycles.
all the gypseous samples reached or exceeded these values at the end ofthe first cycle. Therefore, the soil samples can be considered practicallysaturated in the open system during F–T cycles. During these cycles, thewater content of the soil samples tested in the open system increased by2.5, 3.7, 4.3, and 4.9 times the water content of samples in the initialstate, for 0%, 5%, 15%, and 25% gypsum content, respectively, while thechange in water content of the soil samples tested in the closed systemwas insignificant. When the soil samples were subjected to a low tem-perature (−23 °C), the water within the voids froze. When frozen, thevolume of water increased, causing the volume of the soil samples to in-crease, as illustrated in Fig. 5. The volume change of soil samples in-creased with gypsum content. This is due to the role of gypsum ininducing sufficientwater into the soil samples to causemore volumetricexpansion (especially for those tested in the open system). Gypsumcrystallization also leads to an expansion of the total soil volume, asmentioned in Section 4.1. The volume of frozen samples was largerthan that of thawed ones due to the presence of ice lenses. This volumechange was more significant in the open system due to the largeamount of water available in the pore space of soil samples tested inthe open system (Fig. 4). This causes the formation of visible and invis-ible crack propagation inside the soil samples (Fig. 6). These cracks leadto a loss of strength and a decrease in the sample volume (especially forthe samples tested in the open system) due to the crumbling of someportions of cracked samples. Moreover, when the free water in the soilfreezes and the sample volume increases, the samples have a lowerbulk density than before freezing. Thus, the UCS of soil samples de-creases with the F–T cycle.
Moreover, F–T deterioration may combine with other detrimentalmechanisms, such as ettringite formation. At the initial curing of28 days at 20 °C and during F–T cycles, ettringite formed, as illustrated
0
5
10
15
20
25
0 3 6 9 12
Vo
lum
e C
han
ge
(%)
No. of Cycle
0%G Open
5%G Open
15%G Open
25%G Open
0%G Closed
5%G Closed
15%G Closed
25%G Closed
B
Fig. 5. Volume changes (A) in thawed state and (B) in freezing state.

Crack Propagation
0% G25% G 15% G 5% G
Fig. 6. Crack propagation during open freeze–thaw cycles (Aldaood et al., 2014b).
159A. Aldaood et al. / Cold Regions Science and Technology 123 (2016) 155–163
in Fig. 7. Ettringite is a hydrousmineral that exhibits expansive behaviorupon wetting. In addition, ettringite dehydration is a possible contribu-tor to the increased volume of the gypseous soil samples observed
5%G
15%G
25%G
Fig. 7.Microstructural changes and ettringite formation during the end o
(Figs. 5 and6). The contribution of thewater content in affecting the du-rability of the soil samples tested during F–T cycles is attributed to sev-eral phenomena:
1. Expansion pressure: when thewater in the capillary pores of the soilsamples expands upon freezing, the pore walls seek to resist this ex-pansion. If the required volume is larger than the space available, theexcess water is driven off by the expansion pressure. The pressuremay be relieved if water is allowed to escape through this systemto non-saturated (air) voids. Themagnitude of this pressure dependson the permeability of the soil and the degree of saturation. If the de-gree of saturation is high and the soil structure unable to resist thepressure, cracking will occur (Fig. 6). In repeated F–T cycles, watercan migrate into newly developed cracks during the thawing period,enlarging existing cracks. Thus, the strength of soil samples in theopen system with higher water content is weaker than that of sam-ples in the closed one with constant water content.
2. Osmotic pressure: during freezing,when ice starts to form in the cap-illary pores of soil samples, it can be assumed that gypsum will con-centrate in the non-frozenwater close to the porewalls. This increasein gypsum concentration may cause an osmotic pressure, i.e., a po-tential attempt to re-establish the equilibriumwith the surroundings
5%G
15%G
25%G
f open system (left) and closed system (right) of freeze–thaw cycles.

20
25
30
35
0 10 20 30
Po
rosi
ty (
%)
Gypsum Content (%)
Open
Closed
Fig. 9. Porosity versus gypsum content.
160 A. Aldaood et al. / Cold Regions Science and Technology 123 (2016) 155–163
by migrating water from the non-frozen parts towards the ice-containing pores.
3. Crystallization pressure: the growth of gypsum crystals in capillarypores of the soil samples could also generate pressure in the soil sys-tem. We surmise that the formation of gypsum crystals starts in thelargest pores when the solution reaches supersaturation. A transportof gypsum ions might take place from the smaller pores toward thesalt crystals. This transfer could induce the growth of salt crystalsand imply increasing pressure on the soil sample.
4. Lime leaching and gypsum dissolution due to the availability ofwater: lime leaching causes a continuous reduction in calcium ions(Ca2+) that affects the pozzolanic reaction and retards the formationof new cementing compounds. Moreover, when soil samples absorbwater, the cementation property between soil and gypsum particlesis weakened and the soil structure system changes due to gypsumdissolution.
4.4. Changes in the pore size distribution
Pore size distribution and total porosity of soil samples measured bymercury porosimetry at the end of F–T cycles are presented in Figs. 8and 9. The pore size distributions extend from 0.002 μm to about30 μm. As gypsum content increased, the range of high pore diameters(N10 μm) seems to increase in the two systems (open and closed)with F–T cycles. This change in both systems was attributed tomicrocrack propagation and the growth of ettringite, and additionallyfor the open system to gypsum dissolution.
Analysis of porosimetry results shows that the range of large pore di-ameters is higher in the open system because of higher water content inthe sample.
In the open system, the pores with a diameter less than 0.01 μm de-creasedwith gypsum content. In the closed system, the opposite behav-ior was observed for pores less than 0.01 μm. This behavior can beattributed to the quantities of ice lenses that formed during freezingand which caused microcrack propagation in the soil samples. Fig. 9shows that in the open system, the porosity increases with increasinggypsum content. The increase in porosity due to gypsum dissolution,
0
0,005
0,01
0,015
0,02
0,001 0,01 0,1 1 10 100
)g/
Lm(
nois
urtnIl at
n em irc
n I
Entrance Diameter (µm)
Open
Closed
0%G
0
0,005
0,01
0,015
0,02
0,001 0,01 0,1 1 10 100
)g/
Lm(
nois
urtnIlat
nemirc
nI
Entrance Diameter (µm)
Open
Closed
15%G
Fig. 8. Pore size distribution of the soil sampl
void formation, microcrack propagation, and the growth of ettringitewas the highest for the open system. An unexpected porosity valuewas noticed for the soil samples with 25% gypsum, tested in the opensystem. This behavior could be due to the fact that these samples werestrongly affected by F–T cycles (i.e., greater volume change and crackpropagation), leading to a destruction of soil structure and the forma-tion of macro-cracks. Unfortunately, these macro-cracks are not takeninto account in the calculation of the total porosity estimated from themercury intrusion porosimetry test which may explain the low valueof the total porosity.
4.5. Gas permeability
Themeasurements of the gas permeability of the soil samples beforeand after F–T cycles provide indirect information about structuralchanges in the samples investigated. Fig. 10 shows that gypsum addi-tion caused a slight increase in the gas permeability. The initial valueswere (2.4 × 10⁻¹⁴, 3.0 × 10⁻¹⁴, 3.9 × 10⁻¹⁴ and 4.4 × 10⁻¹⁴ m2) forthe soil samples with 0%, 5%, 15%, and 25% gypsum, respectively.
0
0,005
0,01
0,015
0,02
0,001 0,01 0,1 1 10 100
Incr
imen
tal I
ntr
usi
on
(m
L/g
)
Entrance Diameter (µm)
Open
Closed
5%G
0
0,005
0,01
0,015
0,02
0,001 0,01 0,1 1 10 100
)g/
Lm(
nois
urtnIla t
nem irc
nI
Entrance Diameter (µm)
Open
Closed
25%G
es at the last applied freeze–thaw cycle.

0
2,5E-14
5E-14
7,5E-14
1E-13
1,25E-13
0 3 6 9 12
Ka
(m2 )
No. of Cycle
0%G Open
5%G Open
15%G Open
25%G Open
0
2,5E-14
5E-14
7,5E-14
1E-13
1,25E-13
0 3 6 9 12
Ka
(m2 )
No. of Cycle
0%G Closed
5%G Closed
15%G Closed
25%G Closed
Fig 10. Gas permeability with open and closed systems of freeze–thaw cycles.
0
3E-14
6E-14
9E-14
0 3 6 9 12
Kcy
cled
–K
init
ial(m
2 )
No. of Cycle
0%G Open
5%G Open
15%G Open
25%G Open
0
3E-14
6E-14
9E-14
0 3 6 9 12K
cycl
ed–
Kin
itia
l(m
2 )
No. of Cycle
0%G Closed
5%G Closed
15%G Closed
25%G Closed
Fig. 11. Gas permeability difference with open and closed systems of freeze–thaw cycles.
0%G 5%G 15%G 25%G
Cracks
Fig. 12. Crack propagation in gas soil samples during open freeze–thaw cycles.
161A. Aldaood et al. / Cold Regions Science and Technology 123 (2016) 155–163
This behavior is attributed to the fact that gypsum has a greater frac-tion of fine particles (all particles passed through the 80 μm sieve open-ing) than the soil tested, and the addition of gypsum fills up the voidsbetween the relatively coarser particles of the soil. The gas permeabilityis a function of two parameters: the porosity and the interconnectivitybetween the pores. As a result of lime addition, the interconnectivity be-tween the pores is increased, the porosity is reduced and the gas perme-ability increases slightly. With the F–T cycles applied, microcracksappear and continue to grow. They could be considered as the originof the increase in permeability.
The change in the gas permeability of lime-treated soil samples withthe number of F–T cycles in both systems is plotted in Fig. 10. In general,the evolution appears to be almost linear in both systems, with approx-imately similar slopes for all the soil samples: initially not very steepthen becoming slightly steeper with increasing gypsum content, espe-cially for samples tested in the open system. Unfortunately, the sampleswith 15% and 25% gypsum subjected to 12 cycles in the open F–T systemfailed under the effect of the confining pressure (i.e., 300 kPa) duringthe gas permeability experiment.
F–T cycles generally increased the gas permeability (Fig. 10) of thesoil samples and the effects were greater and more consistent in thesamples with 25% gypsum than in samples without gypsum. However,the effect of F–T cycles was probably not the real cause of this behavior,but rather the variability between soil samples induced these changes ingas permeability values. Thus, the gas permeability values tended to bedependent on the gypsum content during F–T tests and tended to in-crease linearly with gypsum content (Fig. 10). The main mechanismgoverning the increase in gas permeability, besides increasing gypsumcontent, is believed to be changes in the soil structure, porosity, poresize distribution, and microcrack propagation. Such changes in soilstructure facilitate gas flow through soil samples during the gas perme-ability experiment.
The variations in the normalized gas permeability values (Kcycled −Kinitial) against F–T cycles are presented in Fig. 11. Before starting F–T
tests, the gas flow percolated through the soil pores and could be con-sidered as a porous flow. During F–T cycles, the gas percolated throughsoil pores and the microcracks that developed during these cycles; thistype of flow could be called crack flow. Thus, the difference betweenthese types of flow caused the gas permeability values to increase, andthis difference represents the absolute increase in gas permeabilityvalues (i.e., Kcycled − Kinitial). The gas permeability values of samplestested in the open system were higher than those of samples tested inthe closed one. The increase in permeability values is attributed to thepropagation of microcracks which were clearly visible (Fig. 12). Experi-ments on samples in the closed system showed no significant cracking,but on the contrary an increased permeability. Chamberlain and Gow(1978) suggested that certain differences in particle size and arrange-ment during F–T cycles could explain these results. F–T cycles induceconsiderable structural transformations in soil samples (Fig. 8), whichlead to significant increases in the gas permeability values.

0
200
400
600
800
0 10 20 30 40 50 60
2θ (°)
Inte
nsi
ty (
co
un
ts/s
)
G
I00
1
CSH
+ G
K KF
I003
+ Q
101
CA
H
GG
CC
QNatural soil
0% gypsum
5% gypsum
15% gypsum
25% gypsum
CA
H
L
G
C
I004
E
L
CSH
Q
K 001
I00
2
CSH
A
0
200
400
600
800
0 10 20 30 40 50 60
2θ (°)
Inte
nsi
ty (
co
un
ts/s
)
G
I00
1
CSH
+ G
K KF
I003
+ Q
101
CA
H
GG
CC
QNatural soil
0% gypsum
5% gypsum
15% gypsum
25% gypsum
CA
HL
G
C
I004
E
L
CSH
Q
K 001
I00
2
EE
CSH
B
Fig. 13. XRD patterns of soil samples during the end of open system (A) and closed system (B) of freeze–thaw cycles.
162 A. Aldaood et al. / Cold Regions Science and Technology 123 (2016) 155–163
4.6. X-ray diffraction analysis
XRD patterns of the natural soil samples and the F–T cycled samplesof both systems are presented in Fig. 13. The XRD pattern of the natural(raw) soil samples indicated that the soil was composed mainly of kao-linite and illite as clay minerals, and contained quartz, calcite, and feld-spars as non-clay minerals. Identification revealed that the natural soilinitially contained no cementing materials. After the treatment withlime and 12 F–T cycles, the compounds formedwere products of the re-actions between soil, gypsum, and lime, namely, calcium silicate hy-drates (CSH) and calcium aluminate hydrates (CAH). Ettringite wasalso found in all the gypseous soil samples. This is attributed to the effectof the initial curing time which caused the pozzolanic reaction and theformation of ettringite. A comparison between the XRD patterns (Fig.13) of soil samples for both F–T tests shows that therewas a remarkabledecrease in pozzolanic compounds (CSH and CAH) in samples tested inthe open system. This may be attributed to the presence of a higherwater content in the soil samples, which delayed the pozzolanic reac-tion compounds during thawing. Further, in the closed system, XRD
results showed that the number of diffraction peaks attributed to limewas less than in the open system. This small amount of lime is indicativeof the continuity of pozzolanic reactions and ettringite formation. Also,gypseous soil samples in the closed system showed the appearance ofnew peaks of ettringite. This is attributed to more reactions betweensample components (soil, gypsum, and lime) occurring during thawingperiods.
5. Conclusions
The current study has attempted to further understand the effect ofwater during F–T using two test procedures: an open system wherewater uptakewas allowed during the thawing cycle and a closed systemwithout any additional water. Based on the test results, the followingconclusions can be drawn:
1. The water supplied during the open F–T test causes a significant re-duction in the strength of soil samples compared with those in theclosed system.

163A. Aldaood et al. / Cold Regions Science and Technology 123 (2016) 155–163
2. Soil performance against F–T testing procedures depends on the gyp-sum content, especially in the open system.
3. Lime addition enhances the performance of soil samples against F–Tcycles only if the added percentage of lime is optimal for the stabili-zation of the soil. Therefore, the percentage of added lime must bedetermined for each gypsum content. However, freezing affects thepozzolanic reaction and delays the reactions between the soil matrixand lime.
4. Increasing the water content in soil samples can increase the degreeof deterioration in the physical, chemical, and mineralogical proper-ties of soil samples depending on the gypsum content.
5. The coarser soil structure created after F–T cycles increases gas per-meability. In the closed system, the gas permeability of soil sampleswas always lower than that in the open system. Microcrack forma-tion controls the gas flow and may be related to the gypsum contentand the type of F–T test.
6. Gas permeability properties and volume change behavior werefound to change due to deterioration where more microcrackswere observed in the open system than in the closed one.
This research helps to demonstrate that soil should be protectedfrom any infiltration to avoid an increase in the water content thatwill be very damageable during freeze–thaw. An improved understand-ing of these test procedures should enable a more objective selection ofF–T tests by design engineers. It will also facilitate more meaningfulcomparisons of data obtained from laboratory and field studies, relatedtomonitoring the deterioration of soil properties in infrastructures suchas highways and pavement structures.
Acknowledgments
The authors would like to thank Dr. Beck for his helpful support andadvice in X-diffraction tests, Dr. E. Rowley-Jolivet for correction of theEnglish, and the anonymous reviewer for his helpful advice and inter-esting feedback on this document.
References
Aldaood, A., Bouasker, M., Al-Mukhtar, M., 2013. Mechanical Properties Degradation ofLime Stabilized Gypseous Soil with Respect to Freezing–Thawing Cycles, Proceedingsof the 3rd International Conference on Geotechnical Engineering, NewDevelopmentsin Analysis, Modeling and Design, Hammamet, Tunisia: 271–279.
Aldaood, A., Bouasker, M., Al-Mukhtar, M., 2014a. Geotechnical properties of lime-treatedgypseous soils. Appl. Clay Sci. 88–89, 39–48.
Aldaood, A., Bouasker, M., Al-Mukhtar, M., 2014b. Impact of freeze–thaw cycles on me-chanical behaviour of lime stabilized gypseous soils. Cold Reg. Sci. Technol. 99, 38–45.
Al-Mukhtar, M., Lasledj, A., Alcover, J.F., 2010a. Behaviour and mineralogy changes inlime-treated expansive soil at 20 °C. Appl. Clay Sci. 50, 191–198.
Al-Mukhtar, M., Lasledj, A., Alcover, J.F., 2010b. Behaviour and mineralogy changes inlime-treated expansive soil at 50 °C. Appl. Clay Sci. 50, 199–203.
Al-Zubaydi, A.H., 2011. Strength and erosion of lime stabilized gypseous soil under differ-ent flow conditions. Al-Rafidain Engl. J. 19 (2), 12–28.
ASTM, 2003. D560-03, Standard Test Methods for Freezing and Thawing Compacted Soil-Cement Mixtures (Withdrawn 2012). ASTM International, West Conshohocken, PA.
ASTM, 2009. D5102-09, Standard Test Method for Unconfined Compressive Strength ofCompacted Soil–Lime Mixtures. ASTM International, West Conshohocken, PA.
Aubert, J.E., Gasc-Barbier, M., 2012. Hardening of clayey soil blocks during freezing andthawing cycles. Appl. Clay Sci. 65–66, 1–5.
Bell, F.G., 1996. Lime stabilization of clay minerals and soils. Eng. Geol. 42, 223–237.Bin-Shafique, S., Rahman, K., Azfar, I., 2011. The Effect of Freezing–Thawing Cycles on Per-
formance of Fly Ash Stabilized Expansive Soil Subbases. Geo-Frontiers (ASCE).pp. 697–706.
Bouazza, A., Vangpaisal, T., 2003. An apparatus to measure gas permeability ofgeosyntheticclay liners. Geotext. Geomembr. 21, 85–101.
Chamberlain, E.J., Gow, A.J., 1978. Effect of Freezing and Thawing on the Permeability andStructure of Soils. International Symposium of Ground Freezing. Department of U. S.Army, Hanover, New Hampshire.
Dempsey, B.J., Thompson, M.R., 1972. Vacuum saturation method for predicting freeze–thaw durability of stabilized materials. Highway Research Record 442. Highway Re-search Board, Washington, D.C., pp. 44–57.
Gullu, H., Hazirbaba, K., 2010. Unconfined compressive strength and post-freeze–thawbehavior of fine-grained soils treated with geofiber and synthetic fluid. Cold Reg.Sci. Technol. 62, 142–150.
Hohmann-Porebska, M., 2002. Microfabric effects in frozen clays in relation to geotechni-cal parameters. Appl. Clay Sci. 21, 77–87.
Jafari, M., Esna-ashari, M., 2012. Effect of waste tire cord reinforcement on unconfinedcompressive strength of lime stabilized clayey soil under freeze–thaw condition.Cold Reg. Sci. Technol. 82, 21–29.
Kalkan, E., 2009. Effects of silica fume on the geotechnical properties of fine-grained soilsexposed to freeze and thaw. Cold Reg. Sci. Technol. 58a, 130–135.
Kamei, T., Ahmed, A., Shibi, T., 2012. Effect of freeze–thaw cycles on durability andstrength of very soft clay soil stabilized with recycled bassanite. Cold Reg. Sci.Technol. 82, 124–129.
Karakouzian, M., Pitchford, A., Leonard, M., Johnson, B., 1996. Measurements of solublesalt content of soils from arid and semi-arid regions. Geotech. Test. J. 19, 364–372.
Khoury, N.N., Brooks, R., 2010. Performance of a stabilized aggregate base subject to dif-ferent durability procedures. J. Mater. Civ. Eng. 22 (5), 506–514.
Khoury, N.N., Zaman, M.M., 2007. Environmental effects on durability of aggregates stabi-lized with cementitious materials. J. Mater. Civ. Eng. 19 (1), 41–48.
Klinkenberg, L.J., 1941. The permeability of porous media to liquids and gases. Drill. Prod.Pract. 200–213.
Little, D.N., 1995. Handbook for Stabilization of Pavement Sub-Grade and Base Courseswith Lime. National Lime Association, Kendall Hunt Publishing Company, Iowa, USA.
Mansour, Z.M., Chik, Z., Taha, M.R., 2008. On the procedures of soil collapse potential eval-uation. J. Appl. Sci. 8, 4434–4439.
Mathew, P.K., Rao, S.N., 1997. Effect of lime on cation exchange capacity of marine clay.J. Geotech. Geoenviron. Eng. ASCE 123 (2), 183–185.
Saiyouri, N., Bouasker, M., Khelidj, A., 2008. Gas permeability measurement on injectedsoils with cement grout. Cem. Concr. Res. 38, 95–103.
Sánchez de Rojas, M.I., Marín, F.P., Frías, M., Valenzuela, E., Rodríguez, O., 2011. Influenceof freezing test methods, composition and microstructure on frost durability assess-ment of clay roofing tiles. Constr. Build. Mater. 25 (6), 2888–2897.
Wang, D.Y., Ma, W., Niu, Y.H., Chang, X.X., Wen, Z., 2007. Effects of cyclic freezing andthawing on mechanical properties of Qinghai–Tibet clay. Cold Reg. Sci. Technol. 48(1), 34–43.
Wong, L., Haug, M., 1991. Cyclical closed-system freezing and thawing permeability test-ing of soil liner and cover materials. Can. Geotech. J. 28, 784–793.
Yarbasi, N., Kalkan, E., Akbulut, S., 2007. Modification of the geotechnical properties, as in-fluenced by freeze–thaw, of granular soil with waste additives. Cold Reg. Sci. Technol.48 (1), 44–54.
Yesuf, G.Y., Hoff, I., Vaslestad, J., 2013. Development of Excess Pore-Water Pressure inThawing Process of Frozen Subgrade Soils: Based on Analytical Solutions and FiniteElement Method. In 18 th International Conference on Soil Mechanics and Geotech-nical Engineering, Paris, France, p. 2013.
Zhang, L., Ma, W., Yang, C., Yuan, C., 2014. Investigation of the pore water pressures ofcoarse-grained sandy soil during open-system step-freezing and thawing tests. Eng.Geol. 181 (1), 233–248.

本文献由“学霸图书馆-文献云下载”收集自网络,仅供学习交流使用。
学霸图书馆(www.xuebalib.com)是一个“整合众多图书馆数据库资源,
提供一站式文献检索和下载服务”的24 小时在线不限IP
图书馆。
图书馆致力于便利、促进学习与科研,提供最强文献下载服务。
图书馆导航:
图书馆首页 文献云下载 图书馆入口 外文数据库大全 疑难文献辅助工具