Embed Size (px)
Citation preview

COINTEGRATION ANALYSIS OF ECONOMIC GROWTH AND
HUMAN DEVELOPMENT INDEX OF DISTRICTS IN CENTRAL
JAVA
Nur Andriyani, S.E1
Ana Rahmawati Wibowo, S.E2
Email : [email protected]
Magister Science Economic and Development Study
Diponegoro University
Abstract
The level of quality human development will be able to compete in the Global era, and even has the potential
to achieve development goals, are towards prosperity. The purpose of this study was to determine the long- term
relationship between economic growth and the Human Development Index (HDI) of regencies / cities in Central Java
during the period 2004 - 2013. This study used panel data, using the Klassen Typology method to see regional
classification and cointegration test to see long-term relationships. The results show that by using the Klassen
Typology there are 14 regencies / cities included in the category of fast-developed and fast-growing regions (Quadrant
I), 6 of which are urban areas. In quadrant II or fast developing areas there are 10 regencies, 4 developed but depressed
regencies (Quadrant III) and 7 regencies which are relatively underdeveloped (Quadrant IV). Meanwhile, the results
of the cointegration test show that there is a long-term balance relationship between economic growth and the Human
Development Index (HDI). The commitment to carry out the mandate of the law is important to realize this balance.
Keyword: Economic growth, Human Development Index, Cointegration, Klassen Tipology
1. INTRODUCTION
Goal of a nation to achieve general welfare can be achieved through economic development. One
indicator of the success of the implementation of economic development that can be used as a
benchmark in the macro is economic growth. It is also one of the goals of the seventeen goals to be
achieved in the Sustainable Development Goals (SDGs). In general, economic growth is an increase in
the amount of national production or often called Gross Domestic Product (GDP).
According to Kuznets, economic growth is an increase in the long-term capacity of the country
concerned to provide various economic goods to its population (Todaro 2000). The increase in capacity
was made possible by adjustments to technology, institutions and ideology. According to the views of
classical economic experts there are three factors that influence economic growth, namely capital
accumulation, population and the level used of technology (Sukirno 2010). First, the accumulation or
stock of capital is an important determinant of economic output because capital stock can change over
time and that change can lead to economic growth. Second, population growth means increasing the
number of workers. Based on the Solow model in the short term, the higher the population growth rate,
the lower the level of output per capita. Third, technology is a new way to improve the ability of people
to produce at all times. Technological progress can lead to growth in output per worker (Mankiw, 2006)
Of these various factors, economists focus more on the level of population growth. The law of additional
results which is increasingly diminishing will reduce labor productivity so that it will slow down the
pace of economic growth. However, this can be offset by technological advances and increasing human
resource capacity. Based on the principle of development, namely the implementation of development
181
Advances in Social Science, Education and Humanities Research (ASSEHR), volume 216
Copyright © 2019, the Authors. Published by Atlantis Press. This is an open access article under the CC BY-NC license (http://creativecommons.org/licenses/by-nc/4.0/).
Achieving and Sustaining SDGs 2018 Conference: Harnessing the Power of Frontier Technology to Achieve the Sustainable Development Goals (ASSDG 2018)

must provide benefits for all, it is necessary to have a commitment to sustainable development. This
can be realized through simultaneous implementation in economic aspects, social aspects and
environmental aspects.
The United Nation Development Program (UNDP) has created an index to measure the level of
human development. The Human Development Index (HDI) is a measure of the welfare of a region or
country which is viewed based on three dimensions: life expectancy at birth, average school length and
school year expectation and purchasing power parity. Indicators of life expectancy at birth measure the
level of health, the average indicator of school length and the expected level of school- level education
and the last indicator of purchasing power parity measures living standards (BPS 2014).
Central Java is one of the major provinces in Java which contributes to Indonesia's economic
growth. Central Java's economic growth in 2011 reached 6.03% and increased to 6.34% in 2012. In the
next two years the pace of economic growth began to slow to only 5.81% in 2013. While Indonesia's
economic growth slowed to 4.97%, a sharp increase was shown by the economic growth of Central
Java from 5.15% to 5.84% in 2010.
Expected economic growth is not only high but also quality. The Solow model states that the role
of human capital and technology can spur quality economic growth (Romer, 1996). Human capital can
be translated into the Human Development Index. In general, the Human Development Index in Central
Java shows progress from year to year. The development of the Central Java Human Development
Index in 2004 to 2013 shows a positive trend. In 2010 the Central Java HDI reached 66.08, this number
continued to increase by 0.84 points in 2011 and 2012 to 67.21. The biggest increase occurred in 2013
at 0.81 or 2.34%. This positive trend makes HDI experience the Central Java an increase in status from
the medium to high category, reaching 70.52.
The progress of the HDI is in line with the positive trend shown by economic growth. This means
that there is a link between economic growth and the Human Development Index. Even so, the level of
HDI in Central Java is still at a moderate level. Its value is still below DKI Jakarta which is already at
a high level. Of the 35 municipal Regencies in Central Java, there are only 13 city Regencies that have
a HDI above 70.
Human development is the main goal in human activities. Through increasing basic human
capabilities can improve the quality of human resources which will have an impact on economic
conditions and regional competitiveness. The main driving instrument in human development is
economic growth (Ranis et.al, 2000). The characteristics of modern economic growth are marked by
an increase in per capita GRDP, high per capita GRDP will change consumption patterns in meeting
needs (Todaro 1998). This means that the higher the economic growth, the higher the people's
purchasing power. This will increase the Human Development Index where one of the indicators is
purchasing power parity. (Ranis, Stewart, and Ramirez 2000) concludes that economic growth will not
be sustainable unless it is preceded or accompanied by an increase in human development.
There has been a lot of literature which states that human capital is one of the important factors in
achieving quality economic growth. Through investment in human capital is believed to achieve better
economic growth. As Solow has pointed out, modern economic growth is marked by an increase in
GDP per capita (Todaro 1998). GRDP is one indicator of economic performance in an area. According
to (Mustafa et.al, 2017) human development contributes positively to economic growth. This adds
to evidence that improvements in human development increase economic growth at the regional level.
Provinces that have quality human resources are more able to survive than other provinces. Conversely,
provinces that have high income can minimize the decline in the quality of human development (Brata,
2005).
182
Advances in Social Science, Education and Humanities Research (ASSEHR), volume 216
It has also been expressed by (Ranis, Stewart, and Ramirez 2000)that the main driving instrument
in human development is economic growth. There are two mechanisms for the relationship between
economic growth and the Human Development Index. The first mechanism is the contribution of
economic growth to the Human Development Index. In this case economic growth represented by Gross
Domestic Product (GDP) or at the regional level is called Gross Regional Domestic Product (GRDP).
There are three ways of contributing economic growth to the Human Development Index, namely: (i)
allocation of household expenditure, (ii) allocation of government expenditure and (iii) expenditure
allocation of non-government institutions. The tendency of households to spend their net income in an
effort to increase human development through food, drinks, education and health. If the per capita
income level is low then the expenditure for human development needs will also be low. The role of
the government in enhancing human development through the allocation of public spending, especially
in productive sectors. Successful policies require an initial focus on human development, not only
because of their direct impact but also because of their feedback effects on maintaining economic
growth (Suri et.al, 2011). Meanwhile, the role of non-government institutions or non-governmental
organizations (NGOs) is an additional role in improving the HDI. In order to support the potential and
even distribution of empowerment, an internet connection between institutions and NGOs is needed in
the program (Rachman and Syamsuddin 2017). The role of NGOs is (i) as a facilitator and catalyst; (ii)
as trainers and educators; (iii) as capital accumulation; (iv) organizing stimulant projects; (v) as an
advocacy agent; and (vi) as a driving force for community participation (Pratama, 2015).
The second mechanism is the contribution of the Human Development Index to Economic Growth.
The Human Development Index as a standard in assessing the level of human development can be seen
through three dimensions, namely education level, health level and living standard (BPS 2014).
Education will improve the ability of entrepreneurs, managers, workers and farmers to influence
productivity. Adequate education and good health will spur labor performance and productivity to
stimulate economic growth (Bloom et.al, 2004). Empirical results show health contributions are greater
than education. A healthy workforce is more likely to create and adopt new technologies (Ogundari and
Awokuse, 2018). Mayer Foulkes (2001) in (Ogundari and Awokuse, 2018) adds that increasing
productivity through health will reduce weakness, inability of the workforce and minimize absence
from work due to illness. On the other hand, Sianesi and Van Reenen (2003) revealedthat the effects of
human development provide positive externalities to education. Education plays an important role in
providing skilled human capital needed for job creation, economic growth and community welfare
(Pegkas and Tsamadias, 2016) (Pegkas and Tsamadias 2016). Human capital and the dynamics of
productive specialization are important factors for economic growth (Ranis et.al 2000). Moreover, the
interaction between human capital and structural changes in the high knowledge industry has a
significant impact on economic growth (Teixeira and Queirós, 2016) Thus there is a two-way
relationship between economic growth and the Human Development Index which is illustrated by the
following concepts:
183
Advances in Social Science, Education and Humanities Research (ASSEHR), volume 216

Figure 1. Conceptual Framework of relationship between HDI and EC
2. METHOD
Scope of Research
This research study examines the linkage analysis of the Human Development Index (HDI) and
economic growth in Central Java (Cointegration Method) during period of 2004 - 2013. The scope of
this research in 35 regencies/cities in Central Java.
Types and Sources of Data
This study uses panel data, which is a combination of time series data (for five years, 2004 - 2013)
and cross section data for 35 regencies/cities in Central Java. The data used in this study are secondary
data obtained from the Central Java Central Bureau of Statistics in the form of economic growth rates
and Human Development Index (HDI) data of regencies/cities in Central Java.
Analysis
The analytical method in this study uses panel data. The analytical method used to see regional
classifications through Klassen Typology, while to examine the relationship of long-term balance
between economic growth and Human Development Index uses cointegration test. Cointegration
studies are carried out to find out whether the dependent variables and independent variables have a
relationship so that long-term estimates are used.
Klassen Typology
Each region have different levels of human development and economic growth. The Klassen
typology is used to identify the sub-sector or superior sector of a region, in this case the classic typology
is done to divide the area based on two main indicators are HDI and regional economic growth. Sjafrizal
(2012) explained that by using this analytical tool, four characteristics of growth could be obtained in
each region, are rapid growth regions (Quadrant I), retarted region (Quadrant II), growing regions
(Quadrant III)and relatively backward region (Quadrant IV). Klassen Typology metric presentation as
an analytical tool can be seen as follows:
184
Advances in Social Science, Education and Humanities Research (ASSEHR), volume 216
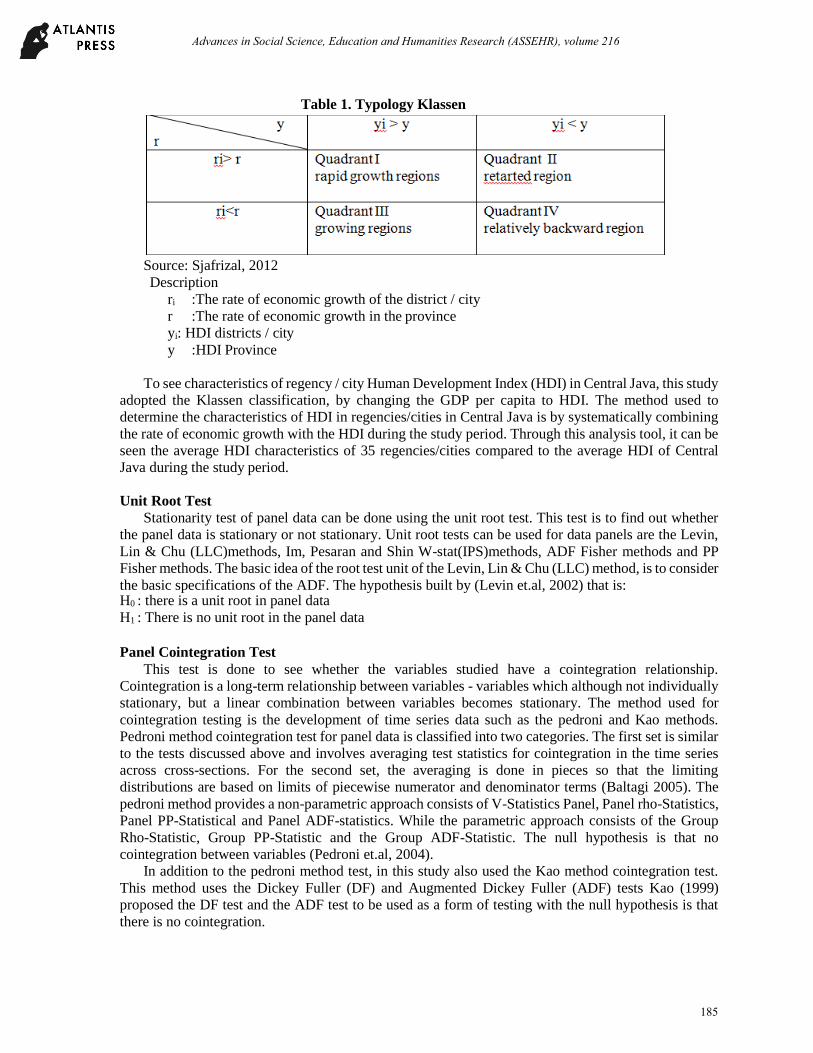
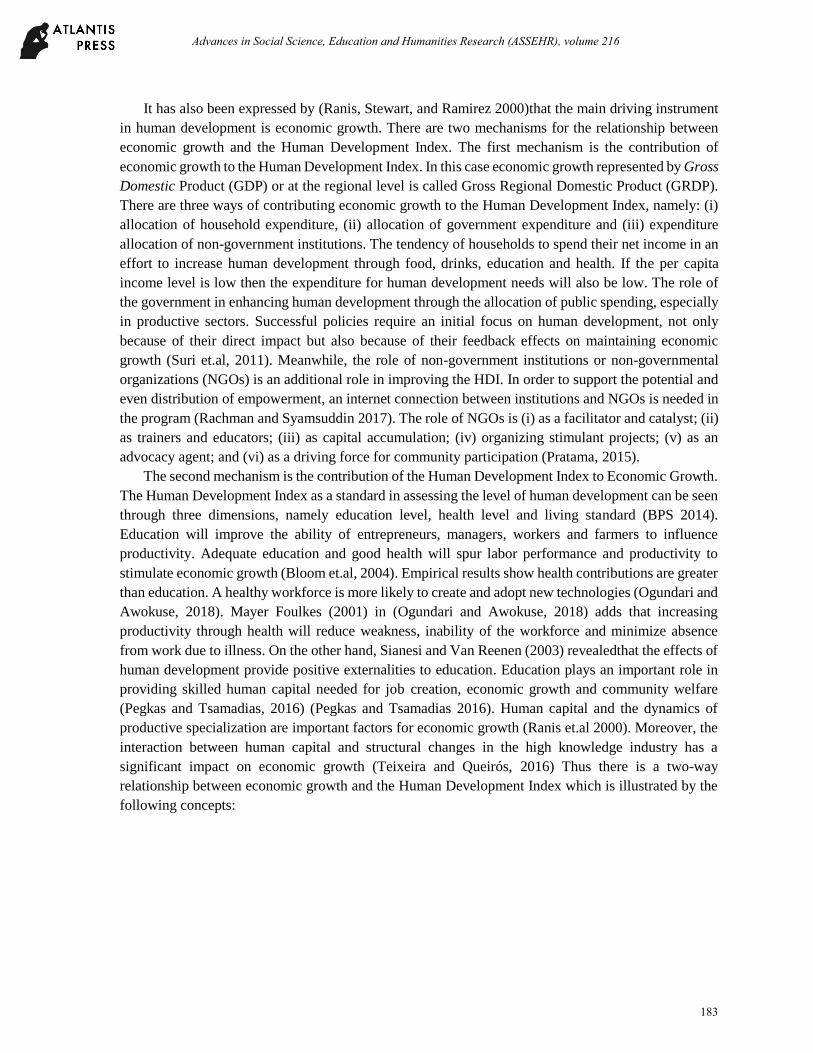
Table 1. Typology Klassen
Source: Sjafrizal, 2012
Description
ri :The rate of economic growth of the district / city
r :The rate of economic growth in the province
yi: HDI districts / city
y :HDI Province
To see characteristics of regency / city Human Development Index (HDI) in Central Java, this study
adopted the Klassen classification, by changing the GDP per capita to HDI. The method used to
determine the characteristics of HDI in regencies/cities in Central Java is by systematically combining
the rate of economic growth with the HDI during the study period. Through this analysis tool, it can be
seen the average HDI characteristics of 35 regencies/cities compared to the average HDI of Central
Java during the study period.
Unit Root Test
Stationarity test of panel data can be done using the unit root test. This test is to find out whether
the panel data is stationary or not stationary. Unit root tests can be used for data panels are the Levin,
Lin & Chu (LLC)methods, Im, Pesaran and Shin W-stat(IPS)methods, ADF Fisher methods and PP
Fisher methods. The basic idea of the root test unit of the Levin, Lin & Chu (LLC) method, is to consider
the basic specifications of the ADF. The hypothesis built by (Levin et.al, 2002) that is: H0 : there is a unit root in panel data H1 : There is no unit root in the panel data
Panel Cointegration Test
This test is done to see whether the variables studied have a cointegration relationship.
Cointegration is a long-term relationship between variables - variables which although not individually
stationary, but a linear combination between variables becomes stationary. The method used for
cointegration testing is the development of time series data such as the pedroni and Kao methods.
Pedroni method cointegration test for panel data is classified into two categories. The first set is similar
to the tests discussed above and involves averaging test statistics for cointegration in the time series
across cross-sections. For the second set, the averaging is done in pieces so that the limiting
distributions are based on limits of piecewise numerator and denominator terms (Baltagi 2005). The
pedroni method provides a non-parametric approach consists of V-Statistics Panel, Panel rho-Statistics,
Panel PP-Statistical and Panel ADF-statistics. While the parametric approach consists of the Group
Rho-Statistic, Group PP-Statistic and the Group ADF-Statistic. The null hypothesis is that no
cointegration between variables (Pedroni et.al, 2004).
In addition to the pedroni method test, in this study also used the Kao method cointegration test.
This method uses the Dickey Fuller (DF) and Augmented Dickey Fuller (ADF) tests Kao (1999)
proposed the DF test and the ADF test to be used as a form of testing with the null hypothesis is that
there is no cointegration.
185
Advances in Social Science, Education and Humanities Research (ASSEHR), volume 216

3. RESULTS
Test results from this study are Klassen Typology to see the classification of regencies/cities in
Central Java based on the main indicators are economic growth and Human Development Index and
cointegration tests to see long-term relationships between them.
Regional Classification according to Klassen Typology Analysis Analysis is used to classify the
characteristics of the Human Development Index (HDI) and the economic growth rate of regencies /
cities in Central Java into four quadrants as shown below:
Table 2. Regional Classification According to Klassen Typology Analysis
Quadrant I rapid growth regions Quadrant II retarted region
1 Semarang, 1 Banjar District
2 Salatiga City, 2 Kab. Kebumen
3 Surakarta City, 3 Kab. Magelang
4 Kota Magelang, 4 Kab. Blora
5 Pekalongan City, 5 Kab. Rembang
6 Kota Tegal 6 Kab. Pati
7 Kab. Banyumas 7 Kab. Batang
8 Kab Semarang, 8 Kab. Pemalang
9 Kab. Boyolali 9 Kab. Tegal
10 Kab. Klaten 10 Kab. Brebes
11 Kab. Sukoharjo
12 Karanganyar District
13 Kab. Sragen
14 Kab. Kendal
Quadrant III growing regions Quadrant IVrelatively backward region
1 Kab. Purworejo 1 District. Cilacap
2 Kab. Kudus 2 Kab. Purbalingga
3 Kab. Demak 3 Kab. Wonosobo
4 Kab. Jepara 4 Kab. Wonogiri
5 Kab. Grobogan
6 Kab. Temanggung
7 Kab. Pekalongan
Source: processed data BPS Central Java 2018
Based on table 2 it can be seen that regencies/cities in Central Java can be classified into four
quadrants. Quadrant I is an area that is fast progressing and fast growing, there are 6 cities and 8
regencies. Quadrant II is a region with rapid development, in this quadrant the economic growth is high
but Human Development Index is low. There are 10 districts included in this quadrant. There are only
4 regencies in the quadrant III in Central Java, this area is categorized as developed but depressed. The
last quadrant is quadrant IV, areas that are categorized as relatively underdeveloped regions. In Central
Java there are still 7 districts that fall into the category of backward region.
186
Advances in Social Science, Education and Humanities Research (ASSEHR), volume 216

Root Test Results
Before the cointegration test between two variables must be carried out the unit root test to
determine stationary data or not. The unit root test results can be seen by comparing the statistical values
with critical values. If the statistical value is greater than the critical value then the data is stationary.
However, if the statistical value is smaller than the critical value, then the data is not stationary. The
panel data unit root test results on the two variables presented in table 3 and table 4 are as follows:
Table 3. Results Root Test of Economic Growth
Cross-
Method Statistic Prob.** sections Obs
Null: Unit root (assumes common unit root process)
Levin, Lin & Chu t* -23.0773 0.0000 35 245
Null: Unit root (assumes individual unit root process)
Im, Pesaran and Shin W-stat -7.83207 0.0000 35 245
ADF - Fisher Chi-square 187.326 0.0000 35 245
PP - Fisher Chi-square 400.072 0.0000 35 280
Source: processed data
** Probabilities for Fisher tests are computed using asymptotic chi-square distribution. All other tests
assume asymptotic normality.
Table 4. Results Root Test of Human Development Index
Cross-
Method Statistic Prob.** sections Obs
Null: Unit root (assumes common unit root process)
Levin, Lin & Chu t* -17.6072 0.0000 35 245
Null: Unit root (assumes individual unit root process)
Im, Pesaran and Shin W-stat -6.64467 0.0000 35 245
ADF - Fisher Chi-square 184.207 0.0000 35 245
PP - Fisher Chi-square 252.157 0.0000 35 280
Source: processed data
** probabilities for Fisher tests are computed using an asymptotic chi-square distribution. All other
tests assume asymptotic normality.
The root test results on economic growth variables show that these variables have a coefficient of
187.326with a probability value of 0.0000 or less than the significance level of 0.05. While the Human
Development Index variable is stationary with coefficient of 184.207and a probability value of
187
Advances in Social Science, Education and Humanities Research (ASSEHR), volume 216
0.0000or less than the 0.05 level of significance. Therefore, it can be concluded that the two variables
are stationary or do not have a unit root. The root test results on both variables, stationary at at first
difference.
Cointegration Test Results
Test is used to see the long-term relationship between the variables studied, are economic growth
and the Human Development Index (HDI). The cointegration test used in this study focuses on the
concept of Kao and Concept Pedroni. The following are the results of the cointegration test:
Table 5. Pedroni Cointegration Test Results
Alternative hypothesis: common AR coefs. (within-dimension) Weighted
Statistic Prob. Statistic Prob.
Panel v-Statistic
4.442697 1.0000 4.451603 1.0000
Panel rho-Statistic 4.043896 0.0000 3.392049 0.0003
Panel PP-Statistic 7.591806 0.0000 6.942325 0.0000
Panel ADF-Statistic 3.832913 0.0001 3.566511 0.0002
Alternative hypothesis: individual AR coefs. (between-dimension)
Statistic
Prob.
Group rho-Statistic 0.749606 0.7733
Group PP-Statistic 10.42055 0.0000
Group ADF-Statistic 6.332883 0.0000
Source: processed data
Based on the results of the Pedroni cointegration test with a non-parametric (common AR coefs)
approach which consists of v-Statistics Panel has a coefficient of 4.442697with a probability of 1.0000,
are greater than 5% significance level. While the Panel Rho-Statistics has a coefficient of 4.043896,
the Panel PP-Statistics has a coefficient 7.591806and the Panel ADF-Statistics have a coefficient of
3.832913. The three probabilities of each test show cointegration at 5% significance level.
Pedroni cointegration test results with a parametric approach (individual AR coefs) show that only
Group rho-Statistic is not significant with a probability of 0.7733or above 0.05. While the Group PP-
Statistic and Group ADF-Statistic are significant at 5% significance level with their respective
coefficients of 10.42055and 6.332883
Table 6. Kao Cointegration Test Results
t-Statistic Prob.
ADF 3.181062 0.0007
Residual variance
0.309618
HAC variance 0.693672
Source: processed data
Consistent with the results of Pedroni cointegration testing, Kao's cointegration testing also shows
that the two variables are cointegrated. ADF testing method - Kao statistics is significant at a 5%
188
Advances in Social Science, Education and Humanities Research (ASSEHR), volume 216

significance level with a probability of 0.0007. From both testing methods (Pedroni and Kao) indicate
that economic growth and the Human Development Index are cointegrated. This means that both
variables have a long-term balance or have the same direction of movement. This happens because both
variables tend to make adjustments in the short term, then they can achieve long-term balance.
4. DISCUSSION
Development of Economic Growth in District/City in Central Java
Gross Regional Domestic Product (GRDP) is one of the economic data tools that can be used to
evaluate the economic development performance of a region (province or district / city). This data
device can be used as planning and decision making. The higher GRDP of an area, the greater potential
source of revenue for the region. No less important with the amount of GRDP, the rate of economic
growth is also one of the benchmarks of economic performance in a region.
Based on GRDP at districts of Central Java since 2004 - 2013, GRDP varies from 4.2 trilli693
billion rupiah to 26 trillion rupiah. The region with the lowest GRDP is Salatiga and the highest is
Cilacap. From the distribution of GRDP, Semarang, Cilacap regency and Kudus regency the value is
very striking far above other regions. The average total value of GRDP for ten years from these three
regions reached 18.18 trillion rupiah with the proportion of 34.57 percent of the average total GRDP in
Central Java.
Meanwhile, Sragen has the highest of economic growth of 5.86%. Because of that district focus to
agriculture sector and make this districts to be the best organic rice producer in Indonesia. Additional,
this district also has good mean power supply. This is evidenced by the low unemployment rate, the
spread of Sragen entrepreneurs across the archipelago and the increasing demand for labor to be
absorbed in foreign companies.
Development of the Human Development Index (HDI) in Central Java
Human development is a process of expanding preferences for humans, especially in accessing
development outcomes such as earning income, health and education. The main objective of
development is to create an environment that allows people to enjoy longevity, health and carry out a
productive life. The average Human Development Index in Central Java during 2004 - 2013 had a
positive development from 63.4 in 2004 to 78.54 in 2013. The average Human Development Index for
all regions in Central Java is relatively the same, which is around 65.00 to 70.00. There are four regions
that have the highest Human Development Index among other regions. There are Salatiga, Pekalongan,
Surakarta and Semarang. While the lowest HDI is Magelang.
Klassen Typology
Based on Klassen's Topology analysis, the development of economic growth, district/city Human
Development Index in Central Java during the period of 2004 - 2013 shows that some city districts are
in quadrant I, are the classification of rapid growth regions. There are 14 districts/cities included in this
area having high economic growth and the Human Development Index, including Semarang, Salatiga,
Surakarta, Magelang, Pekalongan, Tegal , Banyumas regency, Semarang regency, Boyolali regency,
Klaten regency, Sukoharjo regency, Karanganyar regency, Sragen, and Kendal. This shows that people
in the region have a high level of HDI with a rapid rate of economic growth and competitive advantage.
There are six cities in Central Java that support GRDP through industry, agriculture and trade. Likewise
with the HDI level, with many public facilities located in cities such as schools, hospitals, trade drivered
the level of HDI in the region to be higher. One of them is Semarang, which has a high GRDP and
economic growth rate. The construction sector and
189
Advances in Social Science, Education and Humanities Research (ASSEHR), volume 216

processing industry contributed the most to GRDP at 26.19%. (average) The high economic growth
achieved by Semarang was inseparable from the role of human development. This is evidenced in the
Priority and Budget Ceiling (PPA) which makes increasing the accessibility of education and public
health degrees the first priority. In line with the study of Bloom et al., (2004), adequate education and
good health will drive labor performance and productivity to stimulate economic growth.
Regions that include retarted region or quadrant II include Magelang Regency, Banjarnegara,
Kebumen, Blora, Rembang, Pati, Batang, Pemalang, Tegal, and Brebes. This region has a higher level
of economic growth compared to the average economic growth rate of Central Java but the level of the
HDI is below the average HDI in Central Java. Looking at the government expenditure budget in
Magelang Regency, the comparison between education sector spending is lower than public
infrastructure development spending.
Regions that have a HDI higher than the value of economic growth or included in the category of
growing regions (quadrant III) are Purworejo, Kudus, Jepara and Demak. As one of the cigarette
industry centers in Indonesia, this industry is the main supporter of the economy in Kudus.
Nevertheless, it does not make this region have a high rate of economic growth. Seriousness is more
highlighted in aspects of human development through improving health facilities and infrastructure
from both the government and the private sector.
There are seven districts included in quadrant IV, are Cilacap, Purbalingga, Wonosobo, Wonogiri,
Grobogan, Temanggung, and Pekalongan Regency. These regions have a low level of economic growth
and HDI. As an area that has the potential of the craft industry, especially batik, in fact it has not been
able to contribute significantly to the GRDP of Pekalongan Regency. The gross enrollment rate is based
on education level, the majority of primary school education.
Panel Cointegration Test
Based on the results of the cointegration panel test in regency/cities in Central Java shows that there
is cointegration or long-term relationship between economic growth and the Human Development
Index. This result is in line with the research of (Setiawan and Hakim, 2013) that GDP has a positive
influence both in the short and long term on increasing the Human Development Index. An increase in
GDP will improve the welfare of the population. As stated by Ranis et.al (2000) there is a mechanism
for the relationship of economic growth to the Human Development Index through government
spending. The role of the government through health and education spending is a long- term indirect
investment in creating quality and sustainable economic growth. Economic growth and capital
expenditure is positive influence to Human Development Index (Mirza 2012). Anggraeni's (2015) study
found that both the short and long-term government spending on the health sector has a significant
effect on GDP. Similar results were also found in spending in the education sector. Munawwaroh (2013)
revealed that government spending in the education sector has a positive impact on the quality of human
resources among regencies/ cities. Conversely, there is a mechanism for linking the Human
Development Index to economic growth. Previous economists emphasized the importance of human
capital into production. Technology knowledge and skills are immaterial equipment which without
human physical capital is not utilized productively (Anggraeni, 2015). For example, Semarang which
is in the category of developed regions and is growing fast, with a high level of economic growth and
a high Human Development Index, makes the manufacturing industry the second pillar after the
construction sector as a source of GRDP. The processing industry sector that uses a lot of technology
in the production process, certainly has a classification and labor standards with sufficient education to
operate the production machinery properly. Therefore, in order to sufficient these criteria, the Semarang
Government focuses its attention on the education sector through the implementation of the Budget
Priority Ceiling (PPA). In order to improve the accessibility of education and public health, the
government holds early childhood education programs, compulsory basic education for nine years,
improving the quality of educators and education personnel and so on. The greater government
spending in the education sector will increase
190
Advances in Social Science, Education and Humanities Research (ASSEHR), volume 216

human capital which will increase productivity so that regional income also increases (Anggraeni, 2015)
Sitepu's (2007) research also revealed that investment in human resources is able to increase
economic growth. Increased investment in human resources has an impact on increasing labor
productivity which will encourage an increase in aggregate output. Demand for labor will also increase
along with increasing investment in human resources for education. Investment in education is a higher
stimulation than physical investment in the long term. The causality relationship between the role of
education and economic growth becomes increasingly evident and strong. The education sector as the
main driver of the dynamics of economic development increasingly encourages a long- term structural
transformation process, because education provides a high rate of return in the future. Proportional and
targeted government spending on education programs (12 year compulsory education or universal
secondary education pioneering) has an accelerating impact on economic growth (Subroto, 2014). So
that, the income and welfare of the community will also be encouraged. This means that through public
policies made to encourage human development will be a stimulus to create accelerated economic
growth in the long term and sustainable.
5. CONCLUSION
Based on the results of the study, it can be concluded that most regencies/cities in Central Java have
shown concern for human development. This is evidenced by the increase in the Human Development
Index in all regencies/cities. In addition, positive trends are also shown in the variable economic growth.
Although the value is varies, it even tends to be slow in some regencies/cities. This can be influenced
by various factors, in accordance with regional potential, regional natural wealth and human resources.
With the cointegration between economic growth and the Human Development Index, then the long-
term balance between the two variables will be achieved. Economic growth is the main driving
instrument for increasing the Human Development Index and conversely, the Human Development
Index is one of the important factors in creating quality economic growth. In other words, it can be
concluded that to encourage economic growth, humans are no longer used as a development tool. But
as the subject of development is the ultimate goal of development to achieve general welfare.
As a recommendation, there needs to be a strong commitment from the policy taker to implement
law No. 20 of 2003 in terms of allocating education funds by 20% of the APBD and Law No. 36 of
2009 concerning the health budget allocation of 10% of the APBD.
191
Advances in Social Science, Education and Humanities Research (ASSEHR), volume 216

BIBLIOGRAPHY
Anggraeni, Merlin (2017). Analisis Pengaruh Pengeluaran Pemerintah Di Sektor Pendidikan, Kesehatan,
Dan Pertanian Terhadap Pertumbuhan Ekonomi Indonesia Periode 1970-2015. Jurnal Pendidikan dan
Ekonomi Vol. 6 No. 5, 2017
Badan Pusat Statistik Provinsi Jawa Tengah(2014). Indeks Pembangunan Manusia.Bps. Accessed October
3, 2018 from: https://doi.org/10.1017/CBO9781107415324.004
Baltagi, Badi H (2005). Econometric Analysis of Panel Data. England : John Wiley & Sons Ltd
Bloom, David .E, David Canning, and Jaypee Sevilla (2004). The Effect of Health on Economic Growth:
A Production Function Approach.World Development Vol 32 No 1 pp.1–13.
doi.org/10.1016/j.worlddev.2003.07.002.
Brata, Aloysius Gunadi (2002). Investasi Sektor Publik Lokal, Pembangunan Manusia, Dan
Kemiskinan.Jurnal Ekonomi Pembangunan Vol 7 No 2 113 -122
Subroto, Gatot (2014). Hubungan Pendidikan Dan Ekonomi: Perspektif Teori Dan Empiris.Universitas
Nasional Jakarta 20 (September): 390–400.
Setiawan, Mohammad Bhakti dan Hakim, Abdul (2008). Indeks Pembangunan Manusia Indonesia, Jurnal
Economia 9 (April): 18–26.
Kao, Chihwa(1999). Driveious Regression and Residual-Based Tests for Cointegration in Panel Data.
Journal of Econometrics 90 (1): 1–44. https://doi.org/10.1016/S0304-4076(98)00023-2.
Levin, Andrew et.al (2002). Unit Root Tests in Panel Data: Asymptotic and Finite-Sample
Properties.Journal of Econometrics 108 (1): 1–24. https://doi.org/10.1016/S0304-4076(01)00098-7.
Mankiw, N.Gregory (2006). Makroekonomi6th ed. Jakarta: Erlangga.
Mirza, Denni Sulistio (2012). Pengaruh Kemiskinan, Pertumbuhan Ekonomi, dan Belanja Modal terhadap
Indeks Pembangunan Manusia di Jawa Tengah.Economics Development Analysis Journal (1)
DOI.10.15294/EDAJ.V1I2.474
Munawwaroh (2013). Faktor-Faktor Yang Mempengaruhi Kualitas Sumberdaya Manusia Dan
Perekonomian Kabupaten/Kota Di Provinsi Jambi. Jurnal Kajian Ekonomi, Juli 2013, Vol. II, No.03
Mustafa, Ghulam, Marian Rizov, and David Kernohan (2017). Growth, Human Development, and Trade:
The Asian Experience.Economic Modelling 61 (December 2016): 93–101.
https://doi.org/10.1016/j.econmod.2016.12.007.
Ogundari, Kolawole, and Titus Awokuse (2018). Human Capital Contribution to Economic Growth in Sub-
Saharan Africa: Does Health Status Matter More than Education?. Economic Analysis and Policy 58:
131–40. https://doi.org/10.1016/j.eap.2018.02.001.
Pedroni, P (2004). Panel Cointegration: Asymptotic And Finite Sample Properties Of Pooled Time Series
Tests With An Application To The PPP Hypothesis. The Econometric Theori , Vol. No. 3, Pp .” 20:
597–625. https://doi.org/10.1017/S0266466604203073.
Pegkas, Panagiotis, and Tsamadias, Constantinos (2016). How Important Are Foreign and Domestic
Investments, Exports and Human Capital for Greece's Economic Growth?Economic Issues, Vol. 21,
Part 1, 2016
Pratama, Sandy Adi(2015). Peran Lembaga Swadaya, Pemberdayaan Masyarakat dan Pedesaan.Accessed
October 1st, 2018 from: http://skpm.ipb.ac.id/karyailmiah/index.php/studipustaka/article/view/1631
Rachman, M Aulia, and Syamsuddin (2017). Meningkatkan Peran Mobilisasi Sosial Dalam Membentuk
Sinergi Antara Pemerintah Dan Non-Govermental Organization ( NGO ) Dalam Upaya
Pemberdayaan Ekonomi Di Daerah Tertinggal. Proceeding of Community DevelopmentVolume 1
(2017): 135-145; DOI: https://doi.org/10.30874/comdev.2017.18
Ranis, Gustav, Frances Stewart, and Alejandro Ramirez(2000). Economic Growth and Human
Development.World Development 28 (2):197–219. https://doi.org/10.1016/S0305-750X(99)00131-X.
Romer, David (1996). Advanced-Macroeconomic.United State of America : McGraw-Hill Companies Inc 192
Advances in Social Science, Education and Humanities Research (ASSEHR), volume 216

Sianesi, Barbara, and John Van Reenen (2003). The Returns to Education: Macroeconomics.Journal of
Economic Surveys 17 (2): 157–200. https://doi.org/10.1111/1467-6419.00192.
Sitepu, Rasidin (2007). Dampak Investasi Sumberdaya Manusia Dan Transfer Pendapatan Terhadap
Distribusi Pendapatan Dan Kemiskinan Di
Indonesia.Thesis.http://repository.ipb.ac.id/handle/123456789/40840.
Sukirno, Sadono(2010). Makroekonomi.Teori Pengantar Edisi Ketiga. 3rd ed. jakarta.
Suri, Tavneet et.al (2011). Paths to Success: The Relationship Between Human Development and Economic
Growth.World Development 39 (4): 506–22.
https://doi.org/10.1016/j.worlddev.2010.08.020.
Teixeira, Aurora AC, and Anabela SS Queirós( 2016). Economic Growth, Human Capital and Structural
Change: A Dynamic Panel Data Analysis.Research Policy 45 (8): 1636–48.
https://doi.org/10.1016/j.respol.2016.04.00S6.
Todaro, Michael P. 1998. Pembangunan Ekonomi Di Dunia Ketiga. 6th ed. Jakarta : Erlangga
———. 2000. Pembangunan Ekonomi Di Dunia Ketiga. jakarta: Erlangga.
193
Advances in Social Science, Education and Humanities Research (ASSEHR), volume 216