Embed Size (px)
Citation preview
Coincidence to Image: PET Imaging
Jennifer WhiteMarketing Manager
SNS WorkshopOctober 13, 2003
2
Coincidence to Image:
PET ImagingThe PET Mission
“Disease is a biological process and PET is a biological imaging technique that uses molecular probes.”
-Michael Phelps
The CPS mission is to utilize CPS’ unique foundation of knowledge and experience in molecular imaging technology to manage disease better through earlier detection and more complete diagnosis.
3
Coincidence to Image:
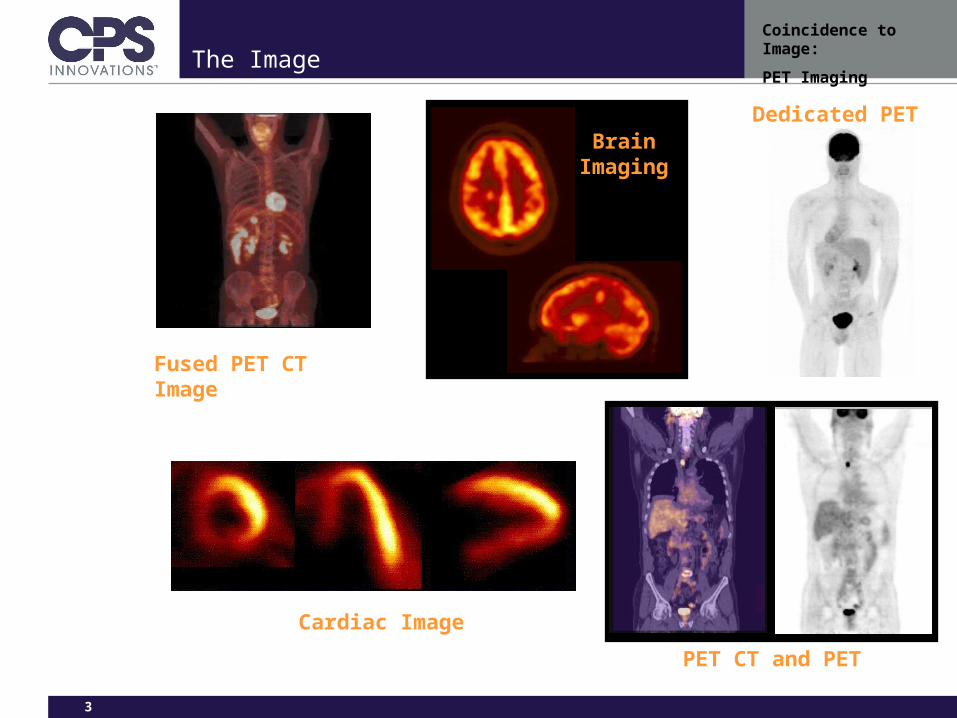
PET ImagingThe Image
Fused PET CT Image
Brain Imaging
Cardiac Image
PET CT and PET
Dedicated PET
4
Coincidence to Image:
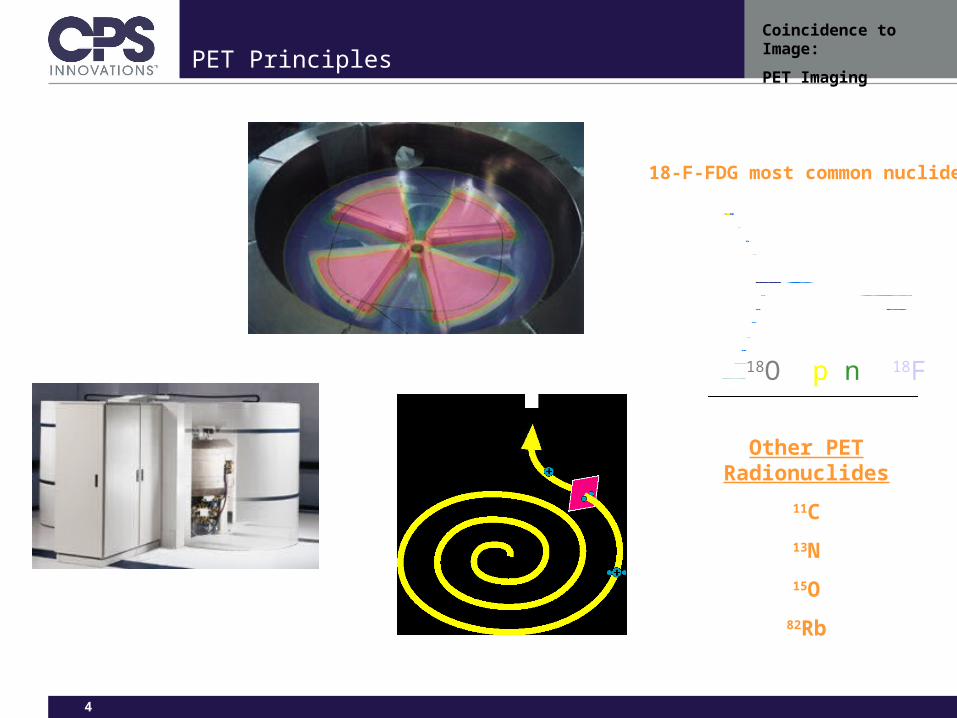
PET ImagingPET Principles
18O (p,n) 18F
18-F-FDG most common nuclide
Other PET Radionuclides
11C
13N
15O
82Rb
5
Coincidence to Image:
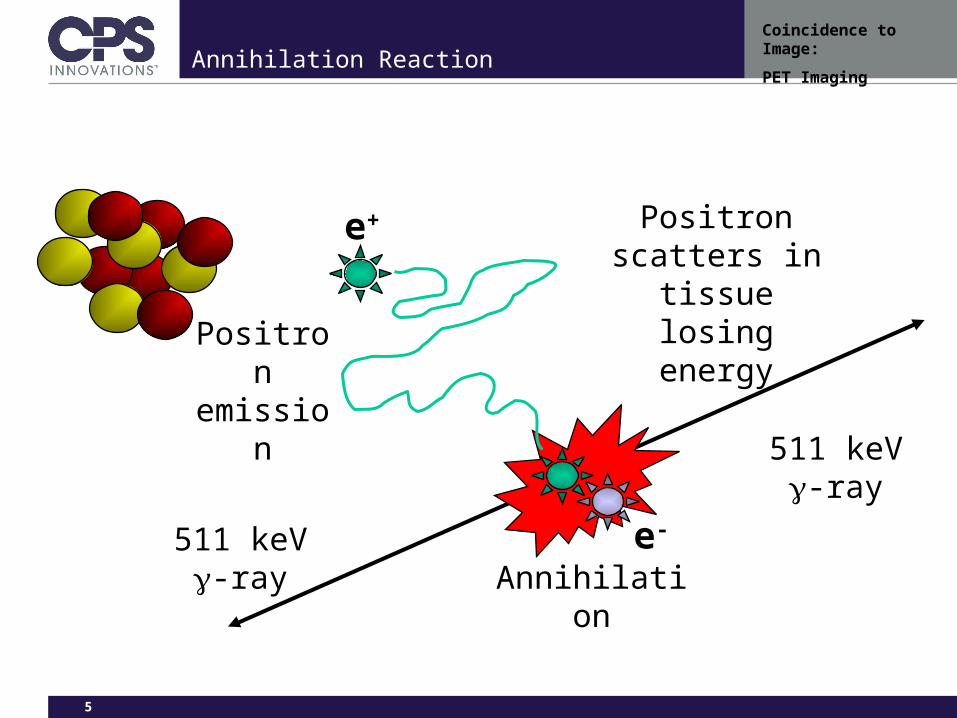
PET ImagingAnnihilation Reaction
e+
e-
Positron emission
Positron scatters in tissue losing
energy
Annihilation511 keV -ray
511 keV -ray
6
Coincidence to Image:
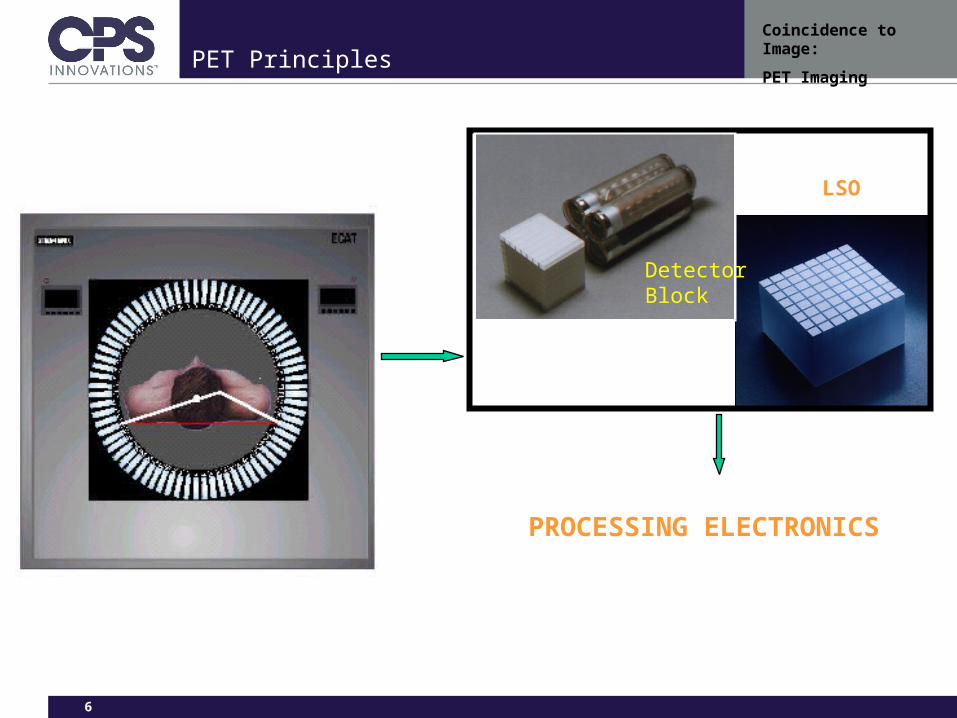
PET ImagingPET Principles
Detector Block
LSO
PROCESSING ELECTRONICS
7
Coincidence to Image:
PET ImagingPET Principles
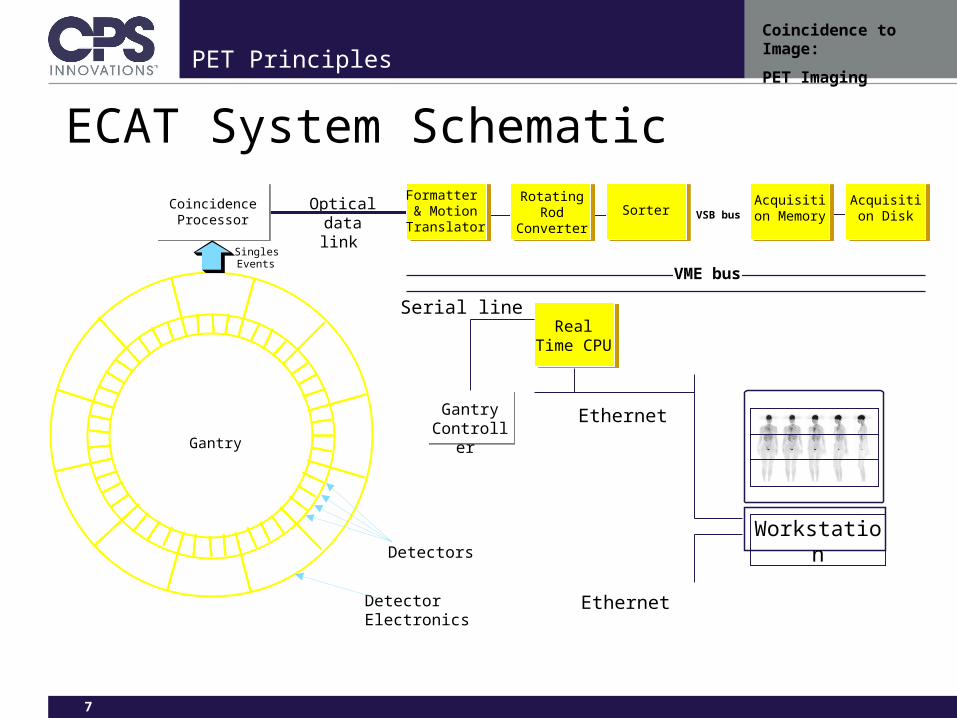
Acquisition Disk
Real Time CPU
Ethernet
Optical data link
Workstation
Detector Electronics
GantryController
Serial line
Ethernet
Acquisition MemoryVSB bus
Coincidence Processor
Gantry
Detectors
Singles Events
Formatter & Motion
TranslatorSorter
Rotating Rod
Converter
VME bus
ECAT System Schematic
8
Coincidence to Image:
PET ImagingPET Principles
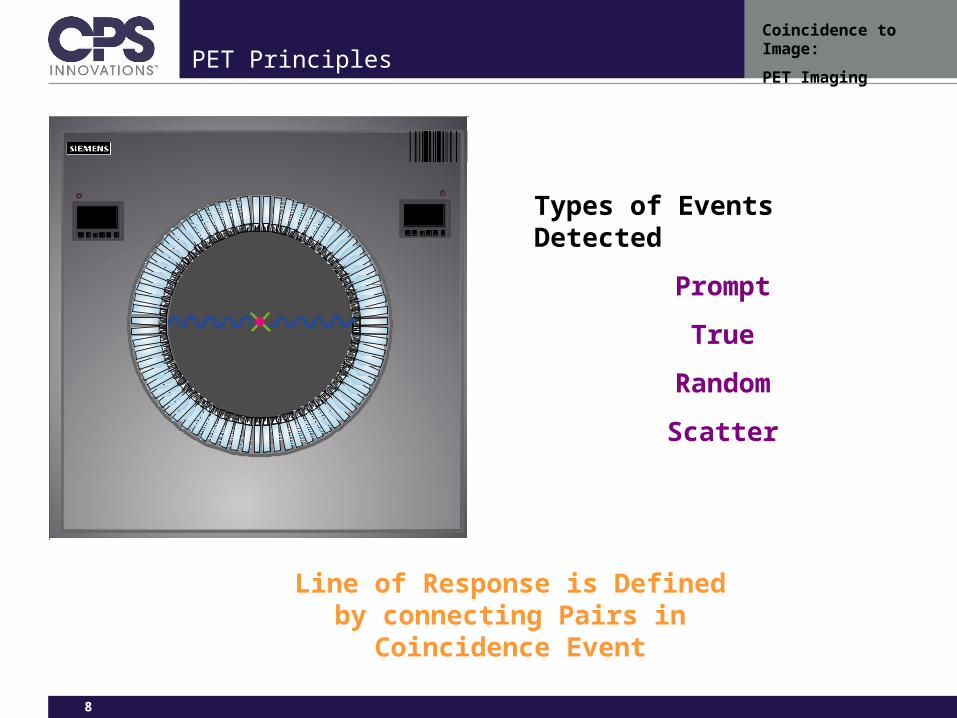
Line of Response is Defined by connecting Pairs in Coincidence
Event
Types of Events Detected
Prompt
True
Random
Scatter
9
Coincidence to Image:
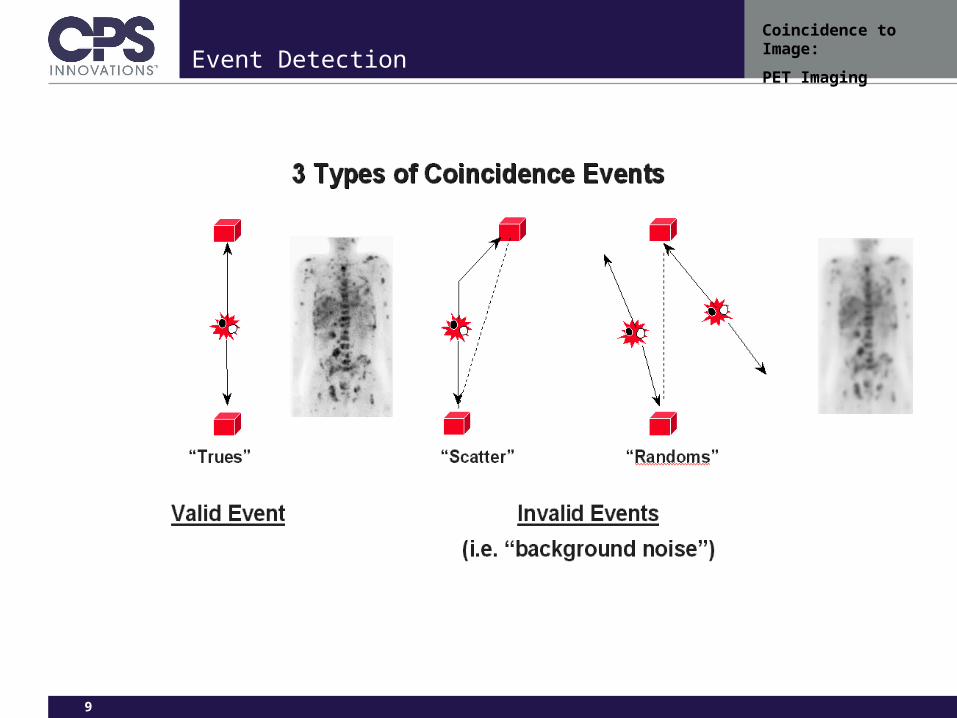
PET ImagingEvent Detection
10
Coincidence to Image:
PET ImagingEvent Detection
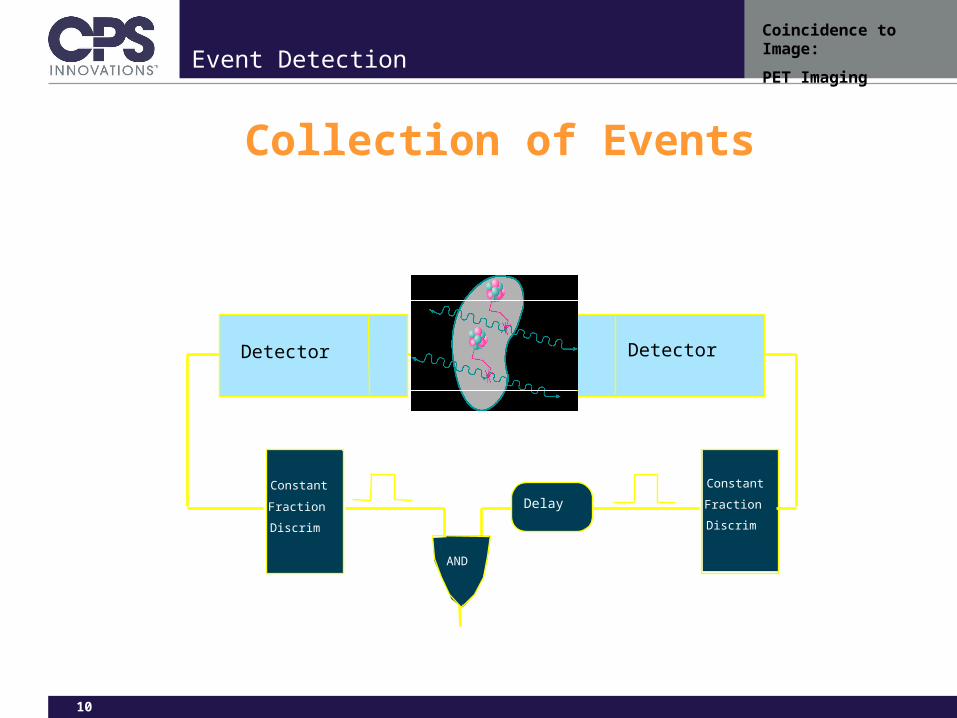
Collection of Events
t = 12ns t = 12ns
DelayConstant
Fraction
Discrim
Detector Detector
t>>12ns
AND
Constant
Fraction
Discrim
11
Coincidence to Image:
PET ImagingSinogram Formation
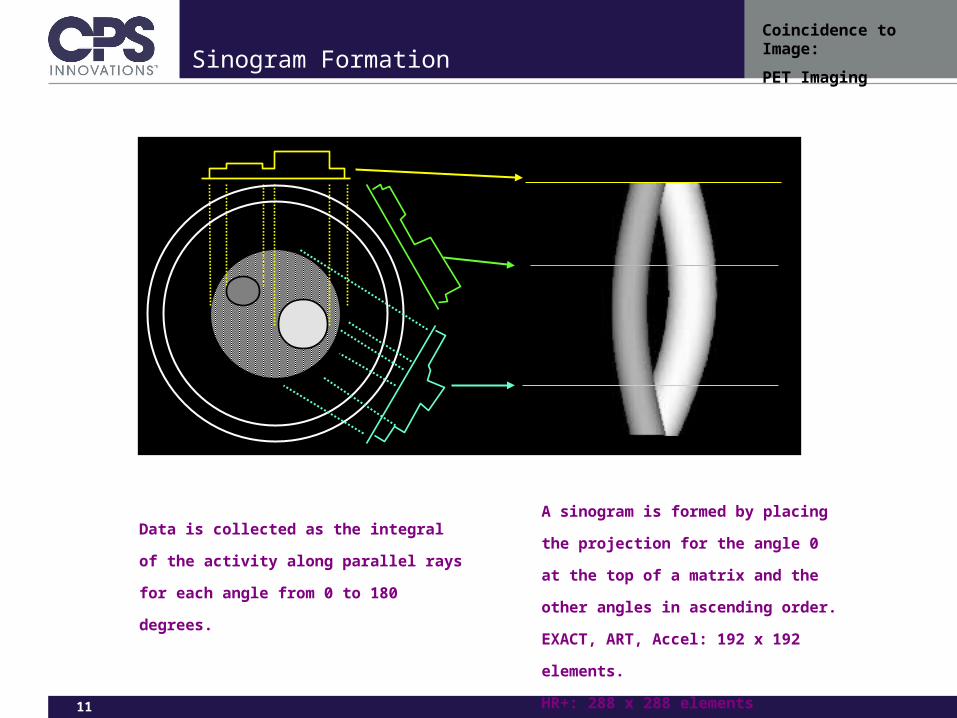
A sinogram is formed by placing the
projection for the angle 0 at the top of a
matrix and the other angles in
ascending order.
EXACT, ART, Accel: 192 x 192 elements.
HR+: 288 x 288 elements
Data is collected as the integral of the
activity along parallel rays for each angle
from 0 to 180 degrees.
12
Coincidence to Image:
PET ImagingPET Principles
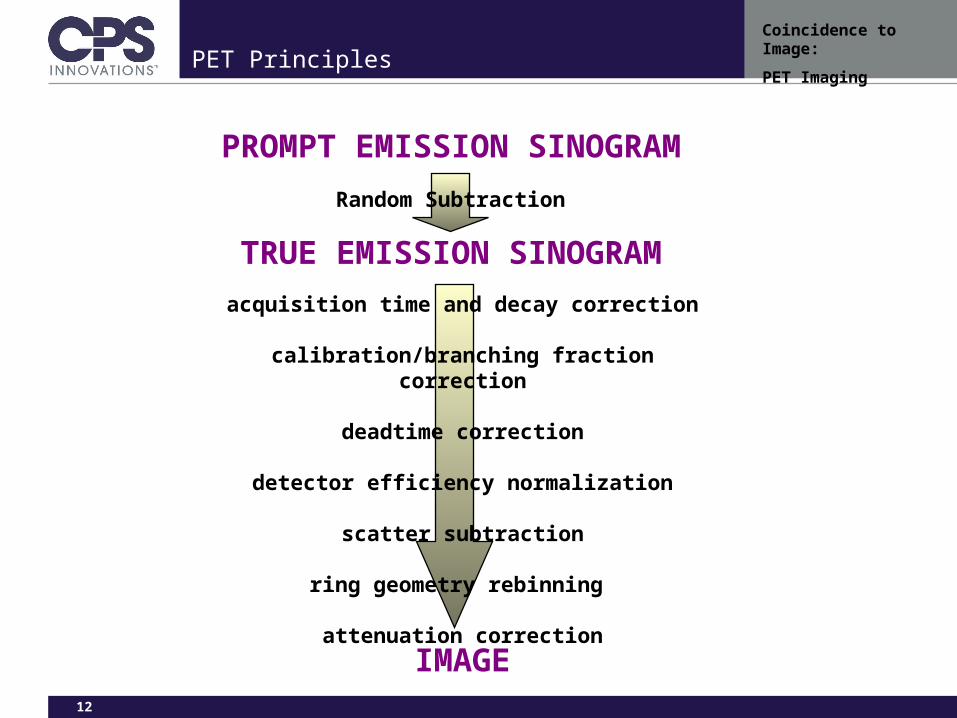
PROMPT EMISSION SINOGRAM
TRUE EMISSION SINOGRAM
IMAGE
Random Subtraction
acquisition time and decay correction
calibration/branching fraction correction
deadtime correction
detector efficiency normalization
scatter subtraction
ring geometry rebinning
attenuation correction
13
Coincidence to Image:
PET ImagingPET Imaging
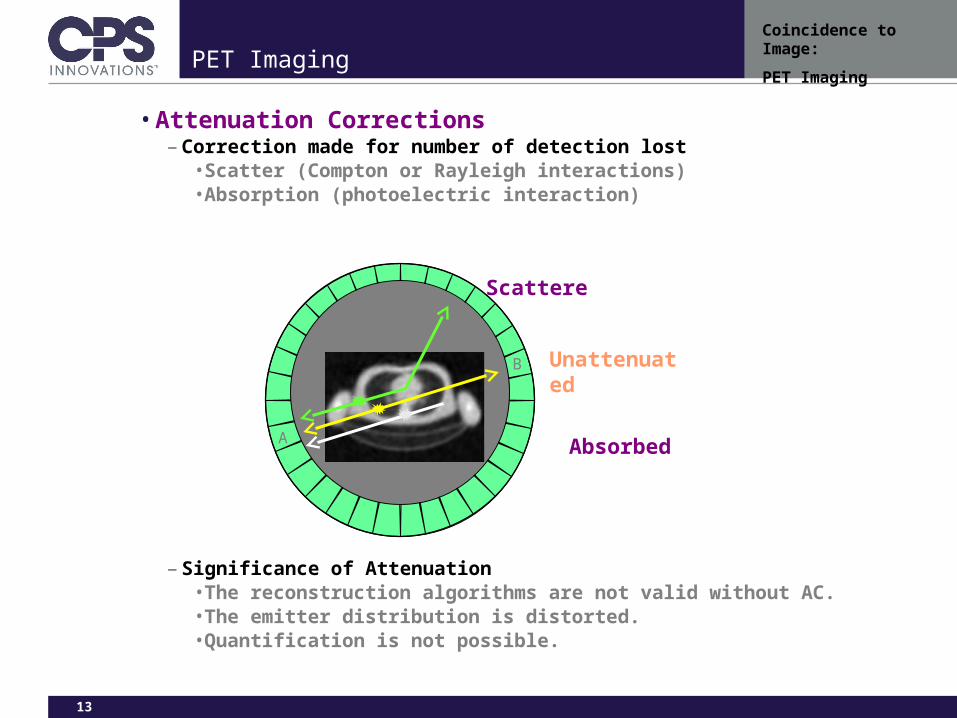
• Attenuation Corrections– Correction made for number of detection lost
• Scatter (Compton or Rayleigh interactions)• Absorption (photoelectric interaction)
– Significance of Attenuation• The reconstruction algorithms are not valid without AC.• The emitter distribution is distorted.• Quantification is not possible.
Scattered
A
B
Absorbed
Unattenuated
Absorbed
14
Coincidence to Image:
PET ImagingPET Principles
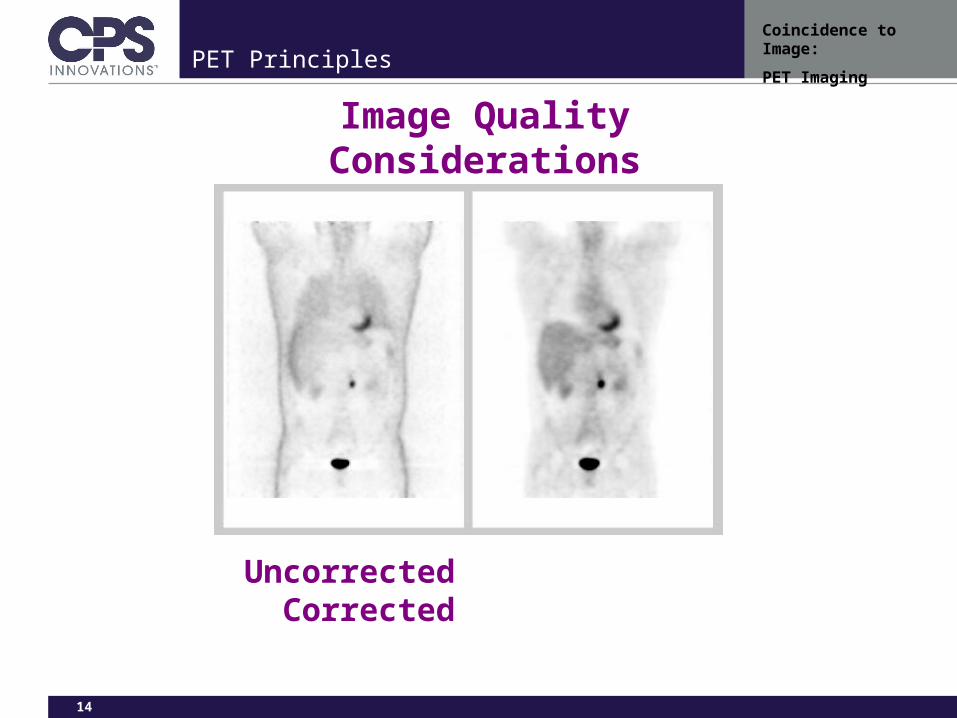
Uncorrected Corrected
Image Quality Considerations
15
Coincidence to Image:
PET ImagingPET Attenuation Correction
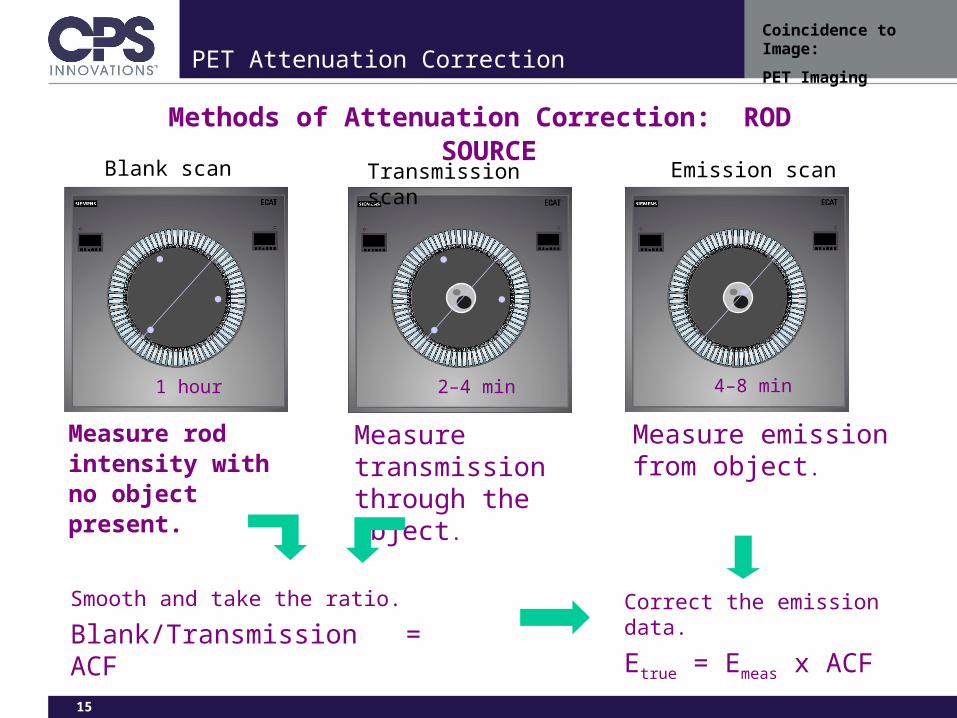
Methods of Attenuation Correction: ROD SOURCE
Measure rod intensity with no object present.
Measure transmission through the object.
Smooth and take the ratio.
Blank/Transmission = ACF
Blank scan Transmission scan Emission scan
Measure emission from object.
Correct the emission data.
Etrue = Emeas x ACF
1 hour 2–4 min 4–8 min
16
Coincidence to Image:
PET ImagingPET Attenuation Correction
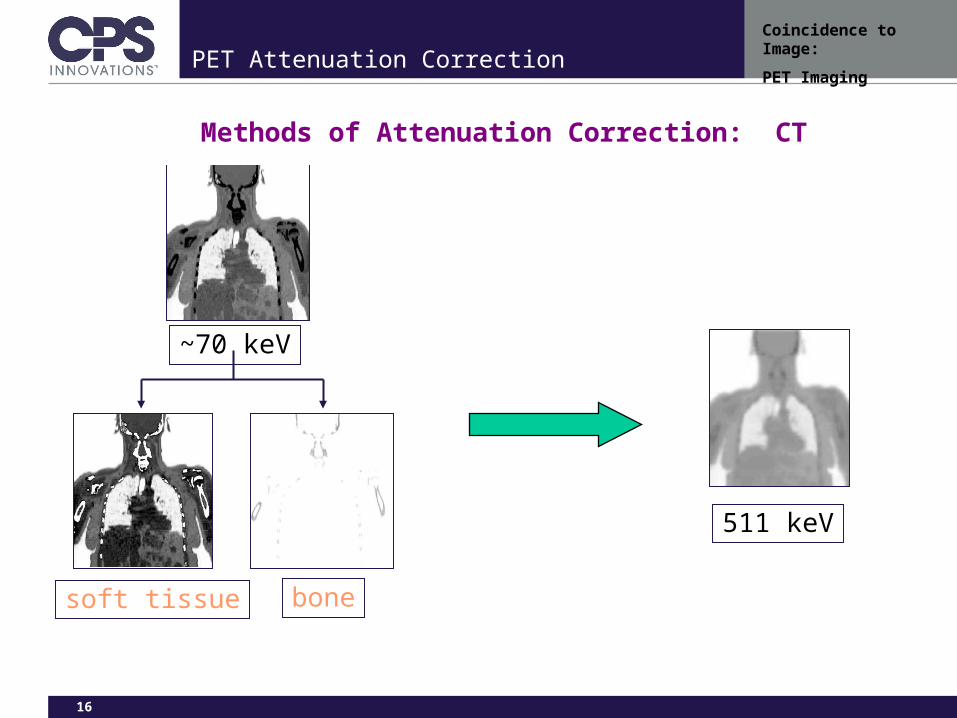
Methods of Attenuation Correction: CT
soft tissue bone
511 keV
~70 keV
17
Coincidence to Image:
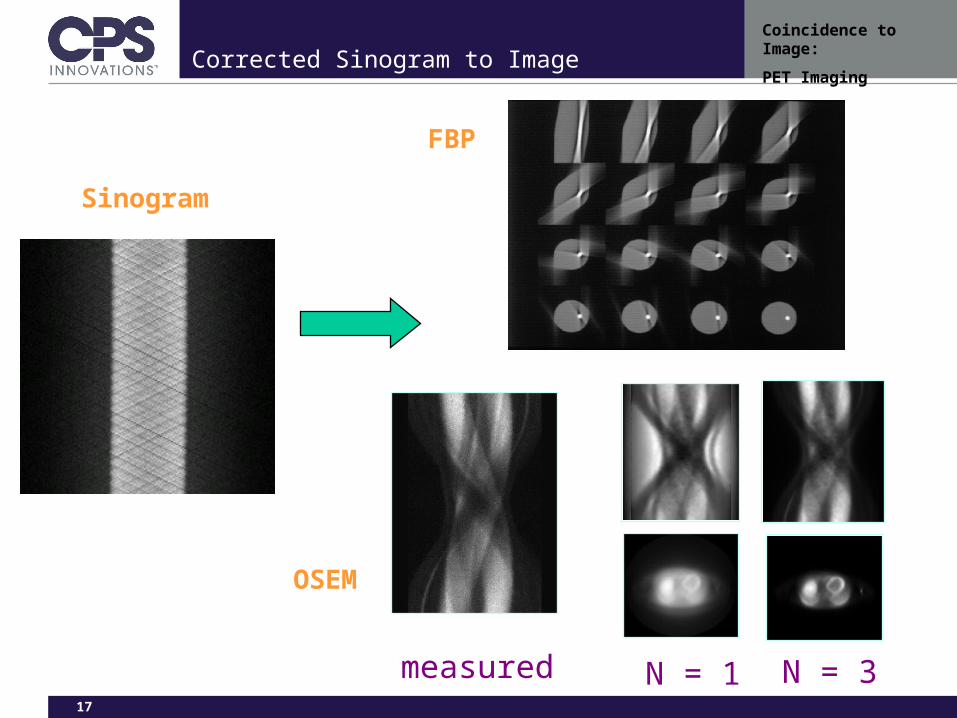
PET ImagingCorrected Sinogram to Image
measured N = 1 N = 3
FBP
OSEM
Sinogram
18
Coincidence to Image:
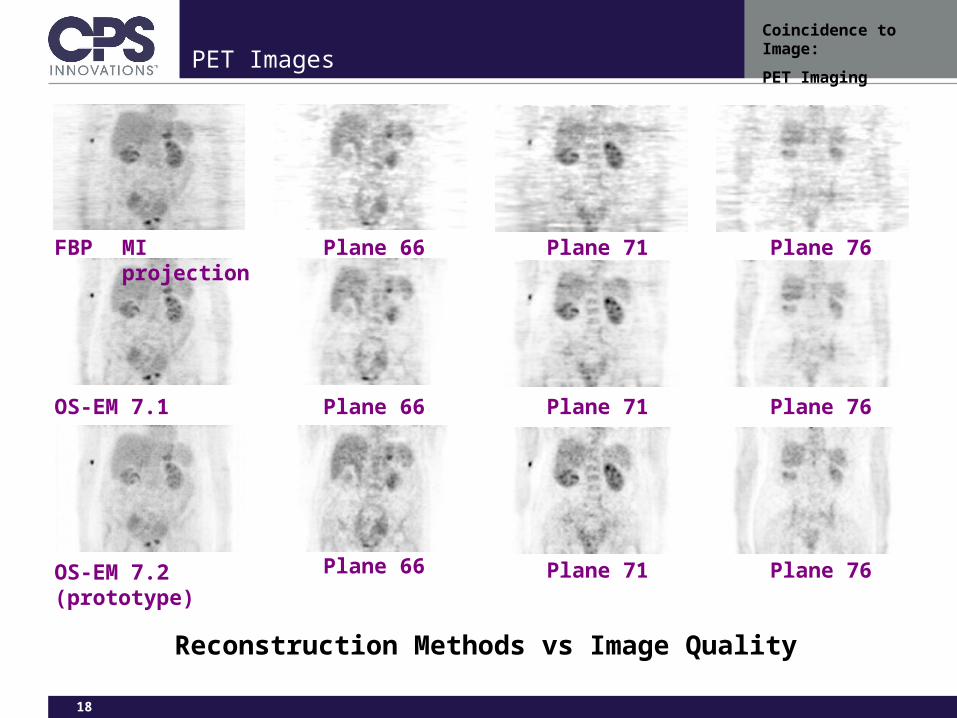
PET ImagingPET Images
MI projection Plane 66
Plane 66
Plane 66
FBP
OS-EM 7.1
OS-EM 7.2 (prototype)
Plane 71
Plane 71
Plane 71
Plane 76
Plane 76
Plane 76
Reconstruction Methods vs Image Quality
19
Coincidence to Image:
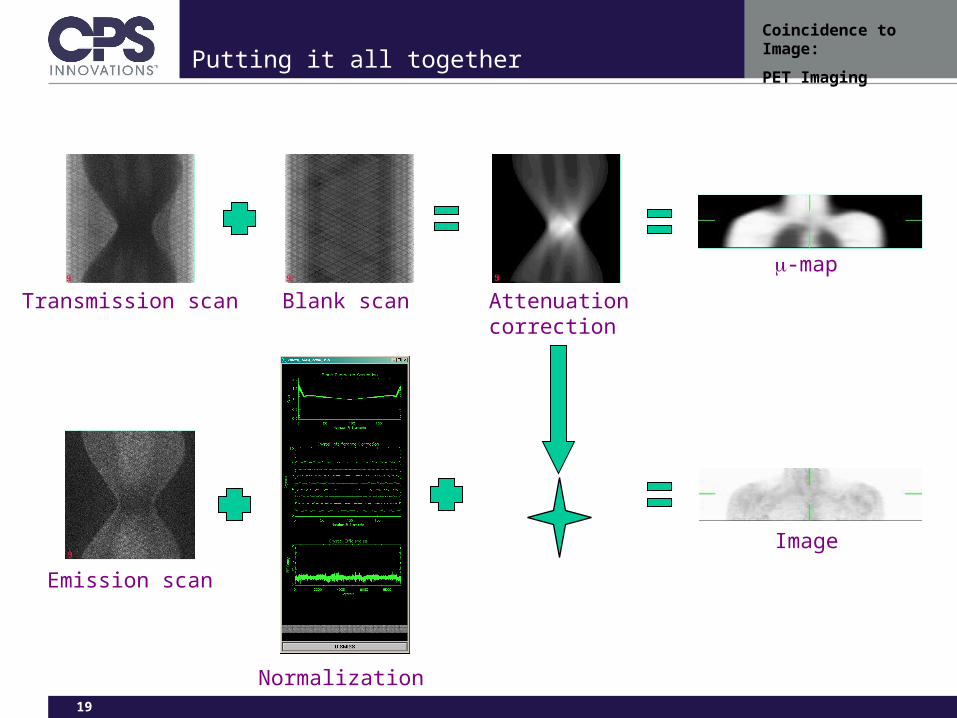
PET ImagingPutting it all together
Transmission scan
Emission scan
Blank scan
Normalization
Attenuationcorrection
-map
Image
20
Coincidence to Image:
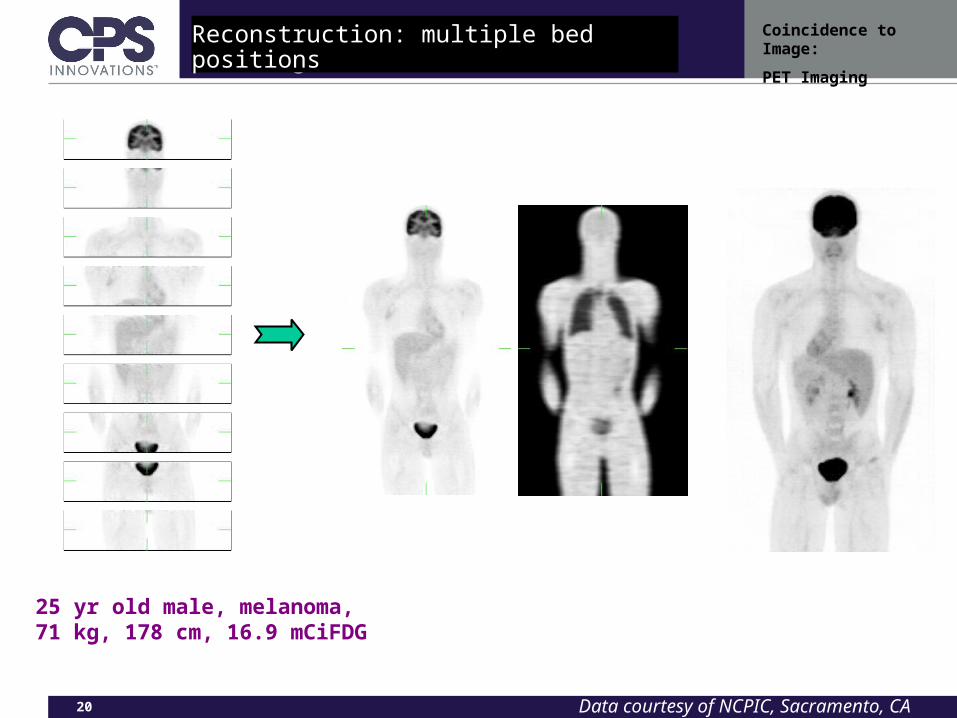
PET ImagingPET ImageReconstruction: multiple bed positions
25 yr old male, melanoma, 71 kg, 178 cm, 16.9 mCiFDG
Data courtesy of NCPIC, Sacramento, CA

21
Coincidence to Image:
PET ImagingCase Study
22
Coincidence to Image:
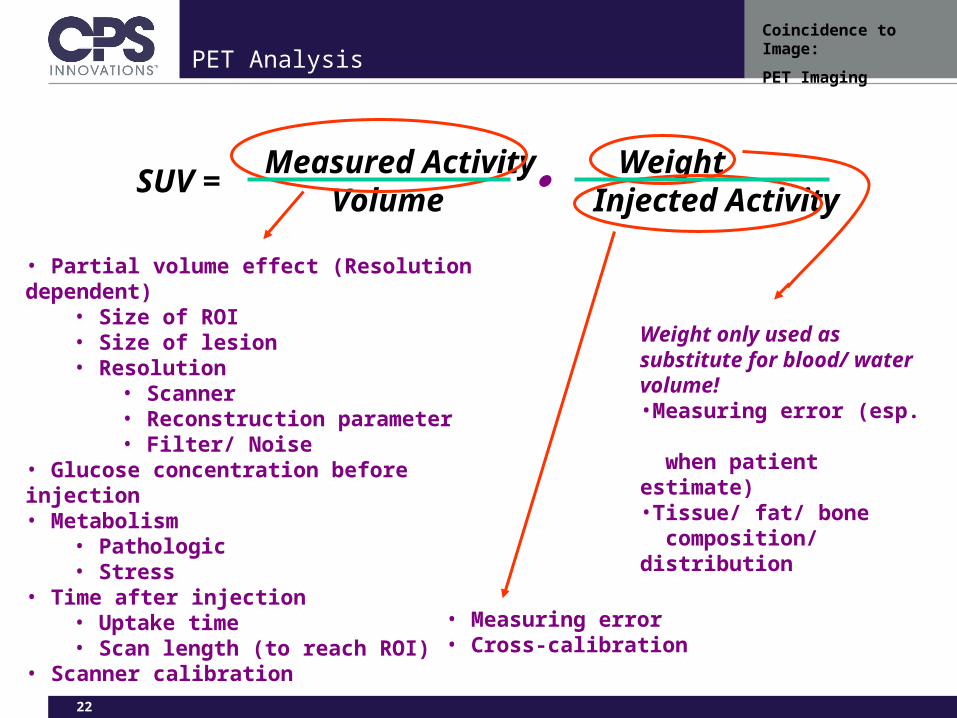
PET ImagingPET Analysis
Measured Activity Weight Volume Injected Activity
SUV =
• Partial volume effect (Resolution dependent)• Size of ROI• Size of lesion• Resolution
• Scanner• Reconstruction parameter• Filter/ Noise
• Glucose concentration before injection• Metabolism
• Pathologic• Stress
• Time after injection• Uptake time• Scan length (to reach ROI)
• Scanner calibration
Weight only used as substitute for blood/ water volume!•Measuring error (esp. when patient estimate)•Tissue/ fat/ bone composition/ distribution
• Measuring error• Cross-calibration
23
Coincidence to Image:
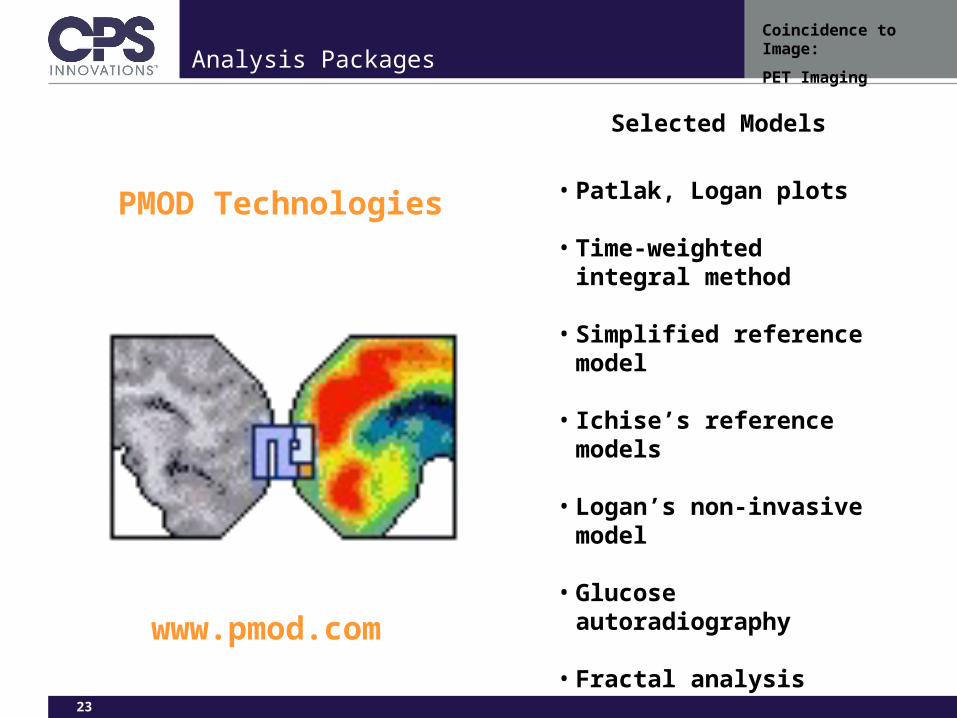
PET ImagingAnalysis Packages
Selected Models
• Patlak, Logan plots
• Time-weighted integral method
• Simplified reference model
• Ichise’s reference models
• Logan’s non-invasive model
• Glucose autoradiography
• Fractal analysis
• Fourier analysis
PMOD Technologies
www.pmod.com
24
Coincidence to Image:
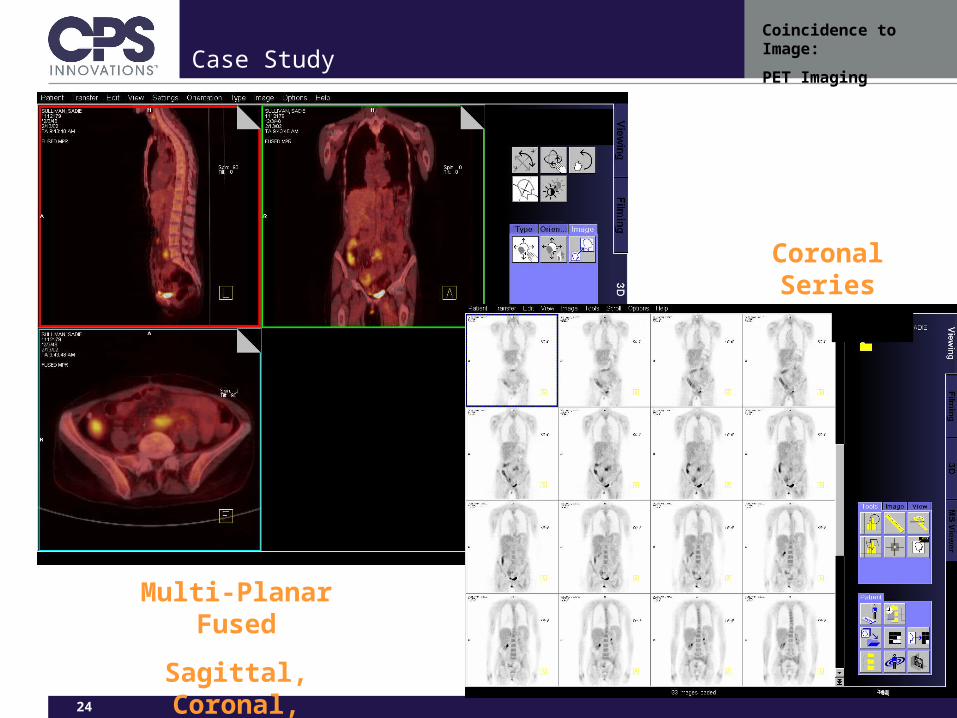
PET ImagingCase Study
Multi-Planar Fused
Sagittal, Coronal, Transaxial
Coronal Series
25
Coincidence to Image:
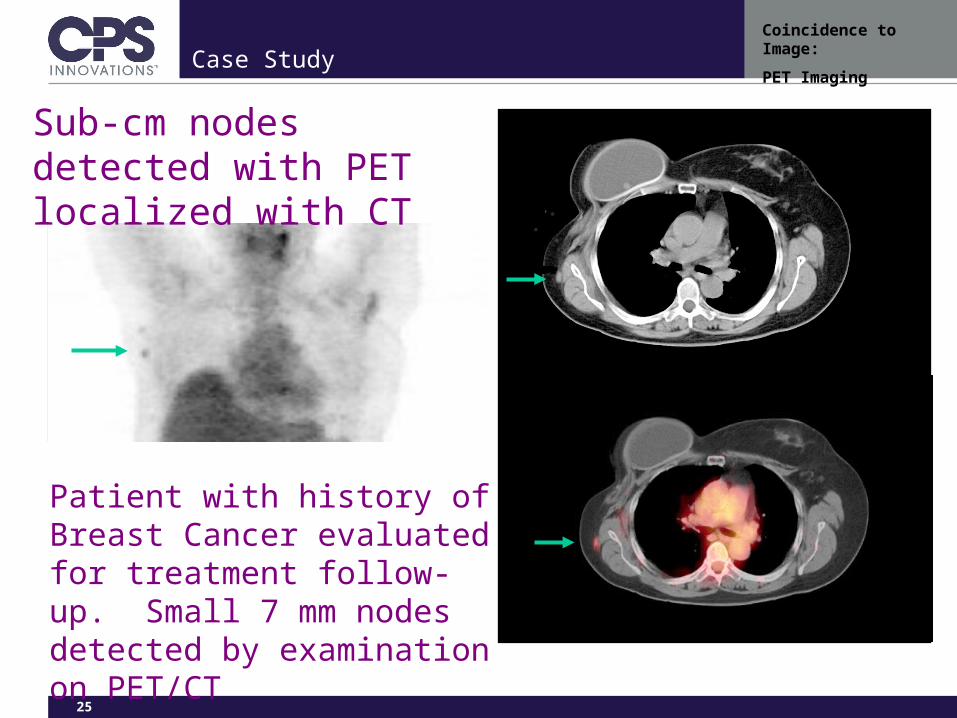
PET ImagingCase Study
Sub-cm nodes detected with PET localized with CT
Patient with history of Breast Cancer evaluated for treatment follow-up. Small 7 mm nodes detected by examination on PET/CT
26
Coincidence to Image:
PET Imaging
Thank youP N + e + + energy+