Embed Size (px)
Citation preview

Coiled-Coil Stability Analysis
and
Hydrophobic Core Characterization
by
David Brinkmann
B.S., University of Colorado at Colorado Springs, 1994
A thesis submitted to the Faculty of Graduate School of the
University of Colorado at Colorado Springs
In partial fulfillment of the
Requirements for the degree of
Master of Science
Department of Computer Science
2003

ii
©Copyright By David C. Brinkmann 2003All Rights Reserved

iii
This thesis for Master of Science degree by
David Brinkmann
has been approved for the
Department of Computer Science
by
_______________________________________________________Jugal K. Kalita, Chair
_______________________________________________________C. Edward Chow
_______________________________________________________Robert Hodges
_______________________________________________________Karen Newell
Date___________

iv
CONTENTS
CHAPTER
1. INTRODUCTION ............................................................................................
Biology .................................................................................................................. 2
DNA .................................................................................................................. 2
The Central Dogma of Molecular Biology .......................................................... 3
Protein Structure .................................................................................................... 3
Coiled-Coil .......................................................................................................... 13
2. LITERATURE REVIEW........................................................................................
Protein Structure Analysis .................................................................................... 16
Early Proteins Structure Prediction ................................................................... 16
Coiled-coil Characterizations............................................................................ 21
Stability................................................................................................................ 22
Coiled Coil Stability Using Experimental Data..................................................... 25
3. STABLE INPUT ..............................................................................................
UCHSC................................................................................................................ 27
Stable Input Parameters ........................................................................................ 28
Helical Propensity ............................................................................................ 33
Hydrophobicity ................................................................................................ 33
E/G Interactions ............................................................................................... 34
Intra-Chain Electrostatic Interactions................................................................ 35

v
Clusters ........................................................................................................... 36
Entropy ............................................................................................................ 36
Program Flow ...................................................................................................... 37
Output Table ........................................................................................................ 45
Output Graphs...................................................................................................... 47
4. COILED-COIL CLUSTER ANALYSIS ................................................................. 58
Why Coiled-Coils?............................................................................................... 58
Protein Database Analysis .................................................................................... 59
SPTR dataset .................................................................................................... 60
Swiss-Prot Coiled-Coils ................................................................................... 61
Stable Coil Pre-Processing ................................................................................... 65
Coil Analysis........................................................................................................ 68
Summary of Findings ........................................................................................... 95
5. CONCLUSION ...............................................................................................
GLOSSARY ..................................................................................................
BIBLIOGRAPHY ..............................................................................................
APPENDIX A STABLE INPUT GUI....................................................................104
APPENDIX B TABULATED OUTPUT ................................................................106
vi
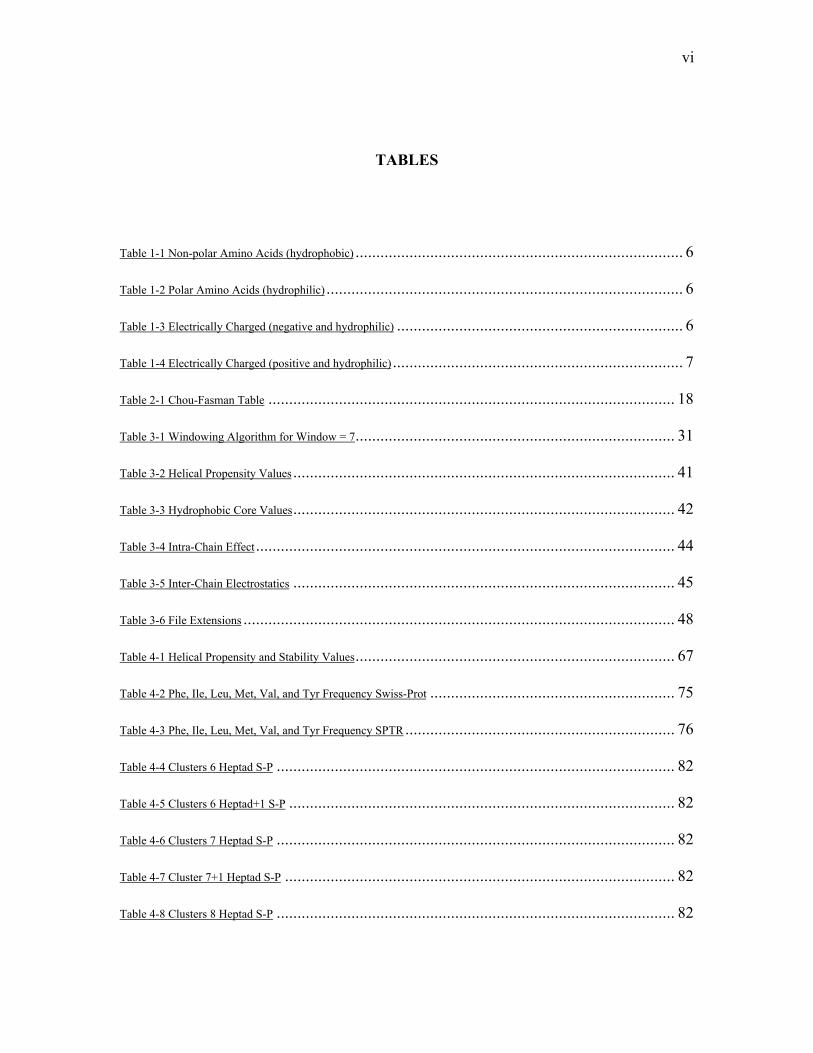
TABLES
Table 1-1 Non-polar Amino Acids (hydrophobic) ............................................................................... 6
Table 1-2 Polar Amino Acids (hydrophilic) ...................................................................................... 6
Table 1-3 Electrically Charged (negative and hydrophilic) ..................................................................... 6
Table 1-4 Electrically Charged (positive and hydrophilic) ...................................................................... 7
Table 2-1 Chou-Fasman Table .................................................................................................. 18
Table 3-1 Windowing Algorithm for Window = 7............................................................................. 31
Table 3-2 Helical Propensity Values ............................................................................................ 41
Table 3-3 Hydrophobic Core Values............................................................................................ 42
Table 3-4 Intra-Chain Effect..................................................................................................... 44
Table 3-5 Inter-Chain Electrostatics ............................................................................................ 45
Table 3-6 File Extensions ........................................................................................................ 48
Table 4-1 Helical Propensity and Stability Values............................................................................. 67
Table 4-2 Phe, Ile, Leu, Met, Val, and Tyr Frequency Swiss-Prot ........................................................... 75
Table 4-3 Phe, Ile, Leu, Met, Val, and Tyr Frequency SPTR................................................................. 76
Table 4-4 Clusters 6 Heptad S-P ................................................................................................ 82
Table 4-5 Clusters 6 Heptad+1 S-P ............................................................................................. 82
Table 4-6 Clusters 7 Heptad S-P ................................................................................................ 82
Table 4-7 Cluster 7+1 Heptad S-P .............................................................................................. 82
Table 4-8 Clusters 8 Heptad S-P ................................................................................................ 82

vii
Table 4-9 Clusters 8+1 Heptad S-P ............................................................................................. 82
Table 4-10 Clusters 6 Heptad SPTR ............................................................................................ 83
Table 4-11 Clusters 6 Heptad+1 SPTR ......................................................................................... 83
Table 4-12 Clusters 7 Heptad SPTR ............................................................................................ 83
Table 4-13 Clusters 7+1 Heptad SPTR ......................................................................................... 83
Table 4-14 Clusters 8 Heptad SPTR ............................................................................................ 83
Table 4-15 Clusters 8+1 Heptad SPTR ......................................................................................... 83
Table 4-16 Hydrophobic Cluster Count, Swiss-Prot........................................................................... 87
Table 4-17 Non-Hydrophobic Cluster Count, Swiss-Prot ..................................................................... 88
Table 4-18 Hydrophobic Cluster Count, SPTR ................................................................................ 89
Table 4-19 Non-Hydrophobic Cluster Count, SPTR........................................................................... 89
Table 4-20 Stabilizing Cluster, Swiss Prot ..................................................................................... 90
Table 4-21 Stabilizing Cluster, SPTR........................................................................................... 91
Table 4-22 Cluster Amino Acids Swiss-Prot ................................................................................... 93
Table 4-23 Cluster Amino Acids SPTR......................................................................................... 94

viii
FIGURES
Figure 1-1 Amino Acid ................................................................................................... 4
Figure 1-2 Phi and Psi Angles ......................................................................................... 5
Figure 1-3 _-Helices...................................................................................................... 10
Figure 1-4 Beta Sheets .................................................................................................. 11
Figure 1-5 Heptad Repeat.............................................................................................. 13
Figure 1-6 Heptad Positions in a Coiled Coil................................................................. 14
Figure 3-1 Coiled Coil A/D and E/G Interactions .......................................................... 34
Figure 3-2 Lateral View Coiled Coil E/G Interaction..................................................... 35
Figure 3-3 Clustered Hydrophobic Core........................................................................ 36
Figure 3-4 Stable Input Program Flow .......................................................................... 38
Figure 3-5 Clusters........................................................................................................ 40
Figure 3-6 Mapping Example........................................................................................ 40
Figure 3-7 Tropomyosin Sequence................................................................................ 49
Figure 3-8 Summary Output.......................................................................................... 51
Figure 3-9 Total Stability .............................................................................................. 52
Figure 3-10 A/D Hydrophobic Stability ........................................................................ 53
Figure 3-11 Helical Propensity...................................................................................... 54
Figure 3-12 E/G Electrostatic Interaction ...................................................................... 55
Figure 3-13 Chain Length ............................................................................................. 56

ix
Figure 3-14 Density Stability ........................................................................................ 57
Figure 4-1 SPTR Protein Entry ..................................................................................... 61
Figure 4-2 Coiled-Coil Retrieval ................................................................................... 63
Figure 4-3 Coiled Coil Entry ......................................................................................... 64
Figure 4-4 Normalized Length Frequency ..................................................................... 69
Figure 4-5 Amino Acid in A and D positions 6&7 Heptads-SPTR................................. 70
Figure 4-6 Amino Acid in A and D positions 6&7 Heptads - Swiss-Prot ....................... 70
Figure 4-7 Normalized Amino Acid Distribution Swiss-Prot......................................... 71
Figure 4-8 Normalized Amino Acid Distribution SPTR ................................................ 72
Figure 4-9 Normalized Cluster by Heptad Length ......................................................... 74
Figure 4-10 Total Clusters and Ratio by Heptad Length Swiss-Prot .............................. 78
Figure 4-11 Total Clusters and Ratio by Heptad Length SPTR...................................... 78
Figure 4-12 Total Clusters by Cluster size Swiss-Prot ................................................... 80
Figure 4-13 Total Clusters by Cluster size SPTR........................................................... 80
Figure 4-14 Hydrophobic Amino Acids in Clusters ....................................................... 85
Figure 4-15 Non-Hydrophobic Amino Acids in Clusters ............................................... 86

Chapter 1
CHAPTER 1
INTRODUCTION
The scientific community now has access to many completely sequenced
genomes of several different species, including the genome of humans. When it comes to
the human genome, however, a complete understanding of the 500000 proteins encoded
by the 30000 genes will take many more years of further study. Not only is there a great
volume of data to be interpreted, but the complexities of the biological systems need to be
understood as well. As a complement to the physical genomic research, proteomics, a
discipline of molecular biology has been initiated for the comparative study of proteomes
under different conditions. Among the research facilities dedicated to the field of
proteomics is the Peptide Chemistry lab of Robert Hodges at the University of Colorado
Health Sciences Center (UCHSC). Dr. Hodges’ group is interested in being able to
determine the absolute stability of the coiled-coil oligomerization domain because the
ability to determine coiled-coil stability would greatly facilitate the prediction of coiled-
coil protein structures and advance protein design.
This thesis explores two areas that are currently being researched at UCHSC.
First, in order to expedite analysis of experimental data a comprehensive tool is needed to
calculate the relative stability of an experimental sequences. Currently, all sequence
stability calculations are done by hand and because of the length of the sequences and the

2
calculations involved this process can take a great deal of time. In addition to performing
the calculations, there is a need for a graphical display of various aspects of the
calculations.
The second part of this thesis examines how hydrophobic amino acids, are
grouped in successive heptads of coiled-coil sequences found in the Swiss-Prot protein
database. The hydrophobic residues appear in the ‘a’ and ‘d‘ heptad position in coiled-
coil conformations. It has been proposed that clusters of hydrophobic amino acids in the
‘a’ and ‘d’ positions play an important role in protein folding and other activities. For
example, when all other stability factors are constant and only the hydrophobic cluster
arrangement is altered, two proteins exhibit different levels of stability.
A comprehensive analysis of all coiled-coils regions is needed found is to be done
to determine if clusters exist in nature. In this analysis, the answers to the following
questions is sought: first, what is the frequency of the hydrophobic amino acids in the ‘a’
and ‘d’ position; second, what is the length of the clusters; third, what amino acids are
present in the different cluster lengths; fourth, how many hydrophobic amino acids and
how many other amino acids are present in clusters of various length; and fifth, Coiled-
coils always start with stabilizing clusters; can these be characterized, and if so how?
Biology
DNA
Physically, DNA is described as a double helix. The double helix is a
conformation that is made up of two anti-parallel sequences connected periodically along
their lengths. The parallel sequences in the DNA molecule are made of series of repeated
sugar and phosphate molecules. This repeated pattern is found along the entire length of

3
the molecule. One of the most important roles DNA plays is that it provides a code that
ultimately leads to the synthesis of proteins in the cell.
The Central Dogma of Molecular Biology
The transfer of information in cells generally goes from DNA to RNA to the
synthesis of a protein. In brief, a single segment of one DNA strands serves as a template
for the synthesis of a RNA molecule. This process is called transcription because during
this phase of gene expression a transfer of information from one nucleic acid type to
another occurs. Next, the RNA molecule is translated into a protein sequence. The RNA
that is translated into a protein is called messenger RNA (mRNA) and the molecular
machinery which carries out his step is called the ribosome [Becker 200b]. Using
complementary base pairing (3 nucleotides or 1 codon) between a tRNA molecule (which
carries one amino acid) and the mRNA molecule, the ribosome catalyzes the chemical
reaction linking a new incoming amino acid with the previously linked amino acid in the
translated polypeptide chain. Following synthesis, the amino acid sequence can go
through further processing in the endoplasmic reticulum and golgi complex to acquire
post-translational modifications (e.g. glycosylation) [Becker 2000c] to form the final
synthesized protein.
Protein Structure
The Central Dogma of Molecular Biology describes the protein synthesis process.
Although the steps used to synthesis a protein are well known, the processes that causes a
protein to assume a particular physical structure after it is synthesized is not as well

4
understood. The specific structures and substructures a protein ultimately forms, plays an
important role in how the protein will function in the cell. Basic protein structure is
determined by the elemental components of the amino acids and can be described using a
four level hierarchy.
Proteins are generally composed of a linear main amino acid chain or back bone.
Each of the amino acids has a four part molecular substructure. The amino acid begins
with an amide group (--NH2) and end with a carboxylate group (--COOH). In between
these two groups is an _-carbon, C_. Bonded to the C_ are an R group and a hydrogen
atom. The backbone of the amino acid sequence is formed by a linear combination of
amino acids bonding together so that a repeated link of individual amino acids anime
groups, C_, and carboxylate groups form a chain. Figure 1-1, Amino Acid, shows the
details.
Figure 1-1 Amino Acid
Amino acids are connected to each other through a peptide bond that forms
between the carboxylate group of one amino acid and the amine group of its neighbor.

5
Once the bond is formed, the two joined amino acids have only one amine group or N-
terminus and one carboxylate group or C-terminus. The relationship between the joined
amino acids is described using two angles psi and phi. The phi angle is the angle formed
by the amine group to the C_, and the psi angle is the angle formed by the C_, and the
former carboxylate carbon. These angles show the level of twist in the amino acid
backbone and have been used to predict overall structure stability [Gromiha 2002].
Secondary structures are found in globular proteins when the phi and psi angles of
contiguous amino acids in a sequence are repetitive. Figure 1-2, Phi and Psi Angles,
illustrates these relationships.
Figure 1-2 Phi and Psi Angles
The R-group attached to the C_ of each amino acid is called the amino acid side-
chain. Side-chains are what give the amino acids their particular characteristic. It is the
side-chain that makes the amino acid hydrophobic, polar or non-polar. Side-chains range
in size from a simple hydrogen atom as in glycine to relatively large complex aromatic
groups. Nine of the amino acids have non-polar side-chain groups and form the
C_
C
O
C
O
N
H
N
H
C_
RH
_ _

6
hydrophobic amino acids. The remaining 11 amino acids can be further categorized as
hydrophilic charged and hydrophilic uncharged. The different categories of amino acids
are listed in Tables 1-1 though 1-4.
Amino Acid Three Letter Code Single Letter CodeGlycine Gly GAlanine Ala AValine Val V
Leucine Leu LIsoleucine Ile I
Methionine Met MPhenylalanine Phe F
Tryptophan Trp WProline Pro P
Table 1-1 Non-polar Amino Acids (hydrophobic)
Amino Acid Three Letter Code Single Letter CodeSerine Ser S
Threonine Thr TCysteine Cys CTyrosine Tyr Y
Asparagines Asn NGlutamine Gln Q
Table 1-2 Polar Amino Acids (hydrophilic)
Amino Acid Three Letter Code Single Letter CodeAspartic Acid Asp DGlutamic Acid Glu E
Table 1-3 Electrically Charged (negative and hydrophilic)

7
Amino Acid Three Letter Code Single Letter CodeLysine Lys K
Arginine Arg RHistidine His H
Table 1-4 Electrically Charged (positive and hydrophilic)
Protein structure is influenced by the type and number of side-chains present in its
sequence. Hydrophobic amino acids have side chains that will not form hydrogen bonds
or ionic bonds with other groups. These hydrophobic amino acids tend to be buried in the
center of proteins away from the surrounding aqueous environment. The amino acids in
this category are listed in Table 1-1, Non-polar Amino Acids (hydrophobic). Some
references to glycine include it in the hydrophobic category and some consider its side
chain neutral. This amino acid has no strong hydrophobic or hydrophilic properties.
Amino acids with uncharged but polar side chains are uncharged at physiological pH.
These are listed in Table 1-2, Polar Amino Acids (hydrophilic). Amino acids with acidic
side chains have a carboxylic acid group in their side chain and are very hydrophilic.
These amino acids are listed in Table 1-3, Electrically Charged (negative and
hydrophilic). Amino acids with basic side chains have a positive charge on these side
chains that makes them hydrophilic and they are likely to be found at the protein surface.
These are listed in Table 1-4, Electrically Charged (positive and hydrophilic). In addition
to these amino acid characteristics, the Van der Waals forces, hydrogen bonds,
electrostatic interactions and hydrophobic effect also affect protein structure.
The Van der Waals forces are the attractions and repulsions atoms have for one
another that gives matter its general cohesion [Lesk 2002]. These come from the
positively charged nucleus of one atom and the negative charge from the electron cloud

8
of another. Hydrogen bonds are the weaker attractions between uncharged, yet polarized
atoms. Hydrogen bonds commonly form between the O and H atoms. Electrostatic
interactions form the basis for the Van der Waals interactions and the Hydrogen bond.
These interactions are common at the N and C termini of the peptide chains. Electrostatic
side chain interactions occur between Lys, Arg, His, Asp, and Glu. These are listed in
Table 1-4, Electrically Charged (negative and hydrophilic) and Table 1-5, Electrically
Charged (positive and hydrophilic).
The hydrophobic effect is the force that is imposed on the overall structure by the
non-polar side chain groups. The association of the non-polar groups reduces the
collective surface area, and therefore the amount of water that can influence the proteins’
structure. This association forces the side-chains closer together.
Protein structures are classified according to a four level hierarchy. These levels
begin with a simple linear arrangement to complex multiple substructure aggregates.
These levels are commonly referred to as the protein’s primary, secondary, tertiary, and
quaternary structures. A protein’s primary structure is the linear amino acid sequence list
of the amino acid chain or chains. These are those with which are commonly used to
describe the protein in the various databases. Secondary protein structures are local
structures of linear segments of amino acid backbone atoms that do not take into account
the effects of the side chains. The major arrangements found in the secondary structure
category are turns, sheets, and helices. These account for about 70% of the substructures
present in a protein. Tertiary structures are an organization of secondary structures linked
by weak interactions. These are best thought of as a three-dimensional arrangement of all

9
atoms in a single polypeptide chain. Quaternary structures are the aggregation of separate
polypeptide chains into the functional protein.
The primary protein structure is the linear arrangement of amino acids in the order
in which they appear in the protein. When describing a protein, the sequence begins at the
N-terminus and ends at the C-terminus. Once assembled into a primary structure, the
individual amino acid side chains are referred to as amino acid residues. Fredrick Sanger
reported the first amino acid sequence of the insulin hormone [Becker 2000].
The secondary structure of a protein is the result of the local interaction of the
amino acid residues. These interactions form three different structures or conformations.
The _-helix, also know as a repetitive secondary structure get its name because the
relationship of one amino acid to the next is the same. The parameters “n” and “r” are
two parameters that are used to characterize a general helix. The convention nr is used to
describe the helix. The “n” is the number of residues per turn and the subscript “r” is the
rise per helical residue. An _- helix is designated 3.64. It has 3.6 residues per turn and
raises 4 residues in height. In the helix, there is a possible hydrogen bond between every
fourth amino acid. This relationship allows an amino acid to form a bond with the amino
acids “above” it and “below” it. Figure 1-3, Coiled _-Helices [UWK 2003], shows this
relationship and the 3.6 residues per turn.

10
Figure 1-3 _-Helices
A beta strand is an amino acid string that does not form a coil. It zigzags in a
more extended way than a helix. One of three types of beta-sheets is formed when two or
more beta strands link side by side. The links are hydrogen bonds between the main
carboxyl ate and amide groups in the amino acid chains. The three types of beta-sheets
are anti-parallel, parallel, and mixed. In anti-parallel sheets the strands run in opposite
directions, in parallel sheets the strands run in the same directions and in the mixed
conformation there is a mix of anti-parallel and parallel strands. The beta sheet is
characterized by a maximum of hydrogen bonding. Unlike the intra-molecular hydrogen
bonds in the _- helix, the hydrogen bonds in the beta sheet are perpendicular to the plane
of the sheet that link amino acids of different amino acid chains or distant members of the
same amino acid chain.

11
The _ turn is the third type of general secondary structure and involves about one-
third of residues in a globular protein. Turns are important substructures in proteins.
Antibody recognition, phosporylation, glycosylation, hydroxzylation and intron/exon
splicing are found frequently at or adjacent to turns. It has also been proposed that turns
are a mechanism used for tertiary folding of globular proteins. Turns usually occur
between two anti-parallel beta strands and are generally less than seven residues in
length. The turn enables the amino acid chain to reverse itself by 180˚. Turns come in
four types, gamma turns, Type I, Type II and Type III turns. Turns are distinguished by
the hydrogen bonds between the ith, ith+1, ith+2, and ith +3 residues [Brook 2003]. Figure
1-4, Beta Sheets [UOFG 2003], illustrates the how beta sheets are organized.
Figure 1-4 Beta Sheets

12
While the secondary protein structures form because of the repetitive nature of the
amino acid chains and the hydrogen bonds between the amino acids, the tertiary protein
structures develop mainly because of the variety in the amino acid side chains. The
tertiary structure is not a repetitive structure and is highly dependant on the interaction of
the side chains. For example, the hydrophobic residue will be drawn to the center of the
protein while the hydrophilic residues will seek other polar molecules including water.
These interactions will force the tertiary structure to fold, bend and twist in unpredictable
way.
Stabilizing the tertiary structure is achieved through both covalent and non-
covalent bonds. The non-covalent stabilizers are the hydrogen bond, electrostatic and
hydrophobic interactions. The most common stabilizing covalent bond is the disulfate
bond. This type of bond is formed between two linearly distant cystines that are situated
near each other. A protein will maintain its stable shape for a given set of environmental
conditions.
The quaternary protein structure is formed by an aggregation of tertiary
component of the same or different proteins. This form of structure applies to multi-meric
proteins. Many proteins belong to this class, particularly those of molecular weight
greater than 50000 [Becker 2000a]. The same forces that stabilize the tertiary structure in
a particular environment stabilize these structures. Anfinsen proposed in his
"Thermodynamic Hypothesis", that the native conformation of a protein is adopted
spontaneously. In other words, there is sufficient information contained in the protein
sequence to guarantee correct folding from any of a large number of unfolded states
[Anfinsen 1973].

13
Coiled-Coil
The coiled-coil is a tertiary oligomerization domain that is formed when two or
more _- helices wrap around each other in a left-handed super coil. Coiled-coils are found
throughout nature and occur in a wide variety of proteins and play an important role in
basic biology. Two examples of this are the kinesin [Thormahlen 1998] and myosin
[Tripet 1997] proteins. Kinesin is a molecule that transports cellular components from
place to place in the cell. The ability to perform this is due in part to the coiled-coil.
Myosin, a fundamental protein used in muscle contractions, is another protein that
employs the coiled-coil conformation. Studies have shown that Myosin depends, in part,
on the coiled-coil to function properly [Chakrabarty 2002]. In both these proteins, the
ability of the coiled-coil to uncoil allowing the attached heads to move gives the protein
the mobility needed to perform its function.
Coiled-coils are found to have hydrophobic amino acids spaced at every third and
then every fourth residue within its sequence. A grouping of seven residues forms a
heptad repeat designated (abcdefg), where the ‘a’ and ‘d’ positions are occupied by
hydrophobic amino acids. An example of the heptad repeat pattern aligned with an amino
acid sequences is in Figure 1-5, Heptad Repeat. This figure shows the amino acid
sequence and directly below it the heptad repeat position each residue occupies.
Sequence: CGG-EVGALKA-EVGALKA-QIGALQK-QIGALQK-EVGALKK-heptadposition: gabcdef-gabcdef-gabcdef-gabcdef-gabcdef
Figure 1-5 Heptad Repeat

14
This pattern repeats and on average places a hydrophobic side-chain every 3.5
residues in the sequence. A typical _-helix has 3.6 residues per turn and takes less than
two full heptads to turn twice.
Figure 1-6 Heptad Positions in a Coiled Coil.
In the coiled-coil, the two _-helices bury their hydrophobic residues in the center
of the coil that causes the coiled-coil itself to form a super coil. These are depicted in as
positions a, a`, d, and d` in Figure 1-5. The super coil character of the coiled-coil also
gives rise to other interactions within the individual _-helices and between the _-helices
in the super coil. A portion of a coiled-coil is illustrated in Figure 1-3, _-Helices. This
figure shows the relative position of the different amino acids in their heptad positions.
The on-going research [Kwok 2003, Tripet 2000, Wagschal 1999] of coiled-coils
at the UCHSC and the University of Alberta has demonstrated that there are a number of
possible factors that determines if a stable coiled-coil exists. Using these stability factors,

15
proteins can be evaluated to find possible coiled-coil domains. Once these domains are
found, they can be further studied. Information about the domain’s composition and other
statistic can be gathered and used to predict their presence in newly sequenced proteins.
16
Chapter 2
CHAPTER 2
LITERATURE REVIEW
Protein Structure Analysis
Protein structure analysis is borne out of the desire to determine protein
characteristics without doing it experimentally or through crystallography. These two
methods can be expensive and time consuming. Processes based on protein statistics and
past experimental data have been generalized to create methods and algorithms to provide
quick answers to protein structure questions. This chapter describes some of the
approaches that have been used to characterize proteins in general and coiled-coils in
particular.
Early Proteins Structure Prediction
Early protein structure prediction algorithms [Chou 1974, Garnier 1978] were
derived by gathering statistics from a relatively small group of proteins. The statistics
related four different protein secondary structures to the amino acids that comprised
them. This information was then generalized in an attempt to predict the secondary

17
structures of other proteins. These approaches proved to be about 60%-65% accurate and
only considered the local amino acid neighborhood.
Outlined in a 1974 paper, “Conformational Parameters for Amino Acids in
Helical, _-Sheets, and Random Coil Regions Calculated from Proteins”, the Chou-
Fasman algorithm is one of the oldest algorithms that attempted to predict the secondary
protein structures using a larger number of proteins [Chou 1974]. Previous attempts used
far fewer than the 15 proteins and 2400 residues used by Chou-Fasman. Up to this point,
the two Zimm-Bragg parameters, _ and s, where investigated for the individual amino
acids. _ is the cooperativity factor for helix initiation and s is the equilibrium constant for
converting a coil residue to a helix. These investigations lead to some generalizations
about how some of the amino acids participate in certain conformations in some proteins.
Chou and Fasman studied all 20 amino acids in 15 proteins and compared the frequency
of the amino acids’ occurrence in various conformational states to the _ and s values. The
result of Chou and Fasman’s research was a better understanding of protein structure
prediction, which led them to develop a table of values called the “Frequency of Helical,
Inner Helical, _, and Coil Residues in the 15 Proteins with Their Conformation
Parameters P_, P_i, P_, and Pc.”
Derived from observed protein structures and their propensity to form different
structures, the Chou-Fasman parameter table consists of seven columns and has twenty
rows. The values assigned to each amino acid in the first three columns, P(_), P(_), and
P(turn), are roughly equivalent to the propensity of an amino acids to form an _-helix, _-
strand and hairpin turn respectively. To provide a sense of the information in the Chou-

18
Fasman parameter table, the first two rows of the table are listed below in Table 6, Chou-
Fasman table.
Name P(_) P(_) P(turn) f(i) f(i+1) f(i+2) f(i+3)Alanine 1.42 .83 .66 .06 .076 .035 .058Arginine .98 .93 .95 .07 .106 .099 .085
Table 2-1 Chou-Fasman Table
The Chou-Fasman algorithm can be explained in three parts. The first part detects
the presence of alpha helices, the second detects the presence of beta sheets and the third
part detects hairpin turns.
The helix detection algorithm starts by dividing the sequence into two regions.
The first region comprises areas where the amino acids have a P_ value greater than 1,
everything else are in the second region. Next, groups of four out of six peptides having
P_ values greater than 1 are identified. These form the base regions of the helix. From
these bases, the amino acids immediately before and after are included in the proposed
helix until the region is found to contains four peptides that have an average P_ value of
less than 1. These are the regions predicted as alpha helices. Beta sheets are predicted in
a similar fashion. This time regions of four or six amino acids with P_ values less than 1
are examined. These regions are expanded until four amino acids average a P_ of less
than 1 are found. A region is declared a beta sheet if over the entire region the P_ average
is greater than 1 and the sum of all P_ is greater than the sum of the P_’s.

19
Beta turns are calculated by calculating a turn propensity value, Pt, for all the
amino acids in the sequence based on that amino acid and the next three that follow. If
the product of all four is greater than .000075 and the Pturn average is greater than 1 and
the sum of Pturn value is greater than both P_ and P_ value, then the amino acid is
predicted to turn at that point.
To improve on the Chou-Fasman algorithm, “Analysis of the Accuracy and
Implications of Simple methods For Predicting the Secondary Structure of Globular
Proteins”, was written by Garnier, Osguthorpe and Robson (GOR) in 1978 [Garnier
1978]. This paper was an attempt to describe and test the simple statistical procedures for
determining secondary protein structures that have been developed. The GOR paper took
particular interest in the performance of the Chou-Fasman algorithm. At the time, the
Chou-Fasman approach was considered one of the best ways to determine a protein’s
structure using amino acid statistics.
Ultimately, the GOR paper sets forth the GOR algorithm. Over the past 25 years
the GOR algorithm has been improved a number of times. The latest was set forth in
1996 in the form of GOR IV. Today the GOR algorithm is an alternative to the Chou-
Fasman algorithm in the area of statistical models.
The GOR algorithm, like the Chou-Fasman algorithm, seeks to predict four
secondary structures of a protein by evaluating the weighted position of the amino-acid
sequence. GOR divides the predicted structures into four types; helix, extended sheets,
turns and coils. The first three structures have been introduced earlier. The coil or
aperiodic state is defined as not being of the first three conformations. In developing this
20
method, the GOR algorithm used 30 proteins; the paper did not provide the number of
residues.
The GOR algorithm implementation is straightforward. The paper provides four
tables, one for each secondary structure to be predicted. Each of the tables lists all 20
amino acids and each acid has 17 spatial parameters derived from experimental
observations.
This implementation of the algorithm starts by progressively calculating an
information value, “I”, for each amino acid in the sequence. The “I” value is defined as
I(Sj;R1, R2, R3, R4,… Rlast)=∑I(Sj; Rj +m or -m)
where last = 17 and –m < j < +m m=8.
The “I” value calculated for the jth amino acid is based on the preceding and succeeding
eight residues. In each of the tables, the 17 parameters are based on the acid’s relative
distance from the jth “I” value being calculated. The “I” values for each amino acid in the
sequence are calculated. This is done four times using values from each of the four
different tables. Once the four values are determined the one with greatest value
determines in which of the four structures the amino acid is likely to participate.
Following the “I” calculation, another statistically determined value can be
applied. The decision constant, DC, can be used to further optimize the evaluation of
each of the four calculated “I” values. The DC values are determined on a protein-by-
protein basis.
There is a second approach outlined in the GOR paper. It is called the “single
residue information method.” As the name suggests, the only information considered is

21
the information that a residue carries about its own conformation. This approach was not
introduced to provide a simpler approach, but to see how much influence adjacent amino
acids have on the predicted structure.
Coiled-coil Characterizations
Predictions
Proteins can be statistically analyzed for important features like charge-clusters,
repeats, hydrophobic regions, and compositional domains. As one of the many important
structural domains, much attention has been directed at developing algorithms to
determine the characteristics of coiled-coils. The basic heptad repeats is what makes the
coiled-coil particularly conducive to computer-based characterization.
PAIRCOILS [Berger 1995] classifies coiled-coils using a statistical approach. It
uses a database of all known coiled-coil sequences from myosin, tropomyosin, and
intermediate filament proteins that was created by extracting sequences from the
GENpept database [OCGC 2003]. These sequences are heptad aligned and form the basis
for PAIRCOILS predictions. From these selected proteins, the conditional probability
that two amino acids are found in any two-heptad position is determined. The frequencies
are normalized and used to determine the probability that a pair of amino acids appear in
a heptad repeat. As a result, PAIRCOIL is able to distinguish two-stranded coiled-coils
from non-coiled-coils and does not produce any false positives or false negative when
tested against a Brookhaven Protein data bank [Brook 2003].
A special coiled-coil is the ‘leucine zipper’. Bornberg-Baur, Rivals and Vingron
[Bornberg 1996] used the Swiss-Prot protein database to retrieve annotated leucine
22
zippers, leucine like zippers, and non-leucine zippers. They made the observation that
there can be two general classes of the leucine zipper. The strict zipper is characterized
by sequences that have leucine appearing regularly in the ‘d’ position in four or more
consecutive heptads. The relaxed zipper is a leucine zipper that has had one of the
leucines replaced by Met, Val, or Ile. Using the TRESPASSER program to predict the
presence of leucine zippers, they evaluated the three groups of proteins. Their results
showed that annotated leucine zippers in the Swiss-Prot database are not often predicted
to follow the strict or relaxed definition of leucine zippers. They did observe, however,
that leucine zippers frequently occur together with DNA binding basic region (bZIP) or a
helix-loop-helix (bHLH-ZIP) domain. These two are hybrid zipper domains and both the
bZIP and bHLH-ZIP regions show coiled-coil characteristics. They concluded that the
presence of a coiled-coil is a better indicator of a leucine zipper than simply the presence
leucine repeat.
Stability
Coiled-coils have been shown to play an important role in many large proteins.
The coiled-coil conformation is found in elongated or fiber-forming proteins such as
myosin, alpha keratin, tropomyosin, and kinesin. Lauzon [Lauzon 2001] analyzes the role
played by coiled-coils in myosin and Tripet [Tripet 1997] examined the coiled-coil in the
kinesin “neck” region.
Kinesin is a microtubule-dependent motor protein. This type of protein is used to
transport other proteins and vesicles from location to location within cells. Kinesin has
two heads, a linker region, and a stalk. Movement is produced when the leading head

23
detaches from the microtubule and moves forward and reattaches. The trailing head then
detaches from the microtubule and reattaches in a location closer to the leading head. The
kinesin travels from the negative to the positive end of the microtubule. The kinesin
counter part is the dynein and travels from the negative to positive end of the
microtubule.
The two heads of the kinesin are globular ATP-binding sites. These two regions
are joined through an alpha helical linker region to the stalk. The linker regions of the
two heads come together and form a coiled-coil stalk. The end of the kinesin is a light
chain region that is used to attach the kinesin to the vesicle being transported.
The “neck” of the kinesin is where the _-helix linker region joins the stalk. This
region forms a coiled-coil stabilized with the classic stabilizing factors plus additional
interactions. The “neck” can be seen as two separate segments, I and II. Segment I does
not have the classic characteristics of a coiled-coil and is considered to be less stable than
segment II [Thormahlen 1998]. Segment I has charged or hydrophilic residues in the
interface; this departs from the classical definition of a stable coiled-coil. Segment II
forms a more classical coiled-coil where the “a” and “d” positions are occupied by
hydrophobic residues.
The model advanced by Tripet [Tripet 1997] suggests that the coiled-coil region
of the “neck” coils and uncoils in response to binding site changes. Segment I is able to
uncoil more than segment II. The action in the model starts with one head bound to the
microtubule and the second detached. The coiled-coil region of the “neck” does not allow
the detached head from finding a binding site in the microtubule. In response to the
leading heads binding, a conformational change occurs that could cause a portion of the
24
“neck” coiled-coil to uncoil. This allows the trailing head to rotate and find a new binding
site in the positive charge direction on the microtubule. In this model the coiled-coil in
the neck is found to be a key element in the performance of the protein.
Myosin II is another protein where the coiled-coil conformation plays an
important role. The myosin II protein plays a fundamental role in muscle contractions and
cellular and intercellular mobility. Structurally, the myosin II protein and kinesin are
similar. Both have a separate globular binding sites connected to stalk or tail through a
polypeptide chain called a “neck”. The tail of the myosin and kinesin are formed from
two helices coiled around each forming a coiled-coil.
The myosin protein has been studied to determine how the stability of the coiled-
coil neck region impacts the head to head interactions, force generations and regulation
[Chakrabarty 2002]. They found that the coiled-coil conformation remains largely intact
in the presences and absence of actin and it is estimated that it would require about 5-
6kJ/mol per residue to uncoil. Another study tested how important neck flexibility was
on the mechanical performance of the myosin [Lauzon 2001]. They showed that the
presence of a stable coiled-coil region at the neck of the myosin significantly impairs the
mechanical performance of the myosin. They also found that a stable coiled-coil region
needed to be 15 heptads removed from the neck before normal mechanical function is
restored. Although the last two studies sites appear to contradict each other, these studies
demonstrate the important role the coiled-coil plays in different proteins.

25
Coiled Coil Stability Using Experimental Data
An approach being explored at the UCHSC, the relative stability of a coiled-coil
substructure within a protein is being determined. It has been shown that the stability of a
coiled-coil varies with the residues that occupy ‘a’ and ‘d’ positions within the
hydrophobic core of a coiled-coil [Tripet 2000, Wagschal 1999]. Core stability may be an
indicator that a coiled-coil may be able to form, but this does not necessarily indicate a
coiled-coil is present. It has also been noted that if the structure within the protein is not
stable, the protein’s structure will not fold and function properly. This would naturally
lead one to conclude that the structure is not present.
The hydrophobic core of a protein has a great influence on the overall stability
and folding rate. It has been shown [Baldi 2000] that by modifying a protein’s
hydrophobic core by a single methyl group, the folding rate can be reduced and the
overall stability can be increased from between 0.8 to 2 kcal/mol. It was suggested that
this change is caused by the overall conformational strain within the core because of the
residue changes
Studies have explored the relationship between selected hydrophobic core amino
acids and coiled-coil stability. Two studies examined the effects that replacing a single
amino acid with each of the 18 other amino acids on the stability and oligomerization
state of the protein. Both of these take a similar approach by replacing one of the
hydrophobic amino acids in the core of the coiled-coil. The first study replaced the amino
acids at the ‘a’ position. The second study replaced the amino acid in the ‘d’ position.

26
The results of these studies allowed the generation of a relative thermodynamic stability
scale for the 19 naturally occurring amino acids in the ‘a’ or ‘d’ position of a coiled-coil.
How does the constituent amino acids in the ‘a’ and ‘d’ positions in the
hydrophobic core of adjacent heptad affect overall stability and protein folding? A
hydrophobic cluster is defined as a consecutive string of three hydrophobic non-polar
amino acids in the hydrophobic core of a coiled-coil [Kwok 2003]. Kwok designed two
proteins with identical properties; the only difference between the two was they have a
different number of hydrophobic clusters. Two proteins were designed for this study.
Protein P2 had two clusters and protein P3 had three clusters. The results of this study
showed that the P3 protein folded more often than that of P2 in benign buffer. It also
showed that P3 was more stable than P2. Kwok suggests that the differences between the
two proteins are due mainly to the burial of the non-polar surface. Kwok further suggests
that clusters may stabilize the proteins in structurally significant regions, while the non-
clustered areas are involved in conformational changes that allow for protein-protein
interactions.

27
Chapter 3
CHAPTER 3
STABLE INPUT
UCHSC
Protein research at the UCHSC has used a model 2 stranded, homo-stranded,
parallel coiled-coil protein to determine the effects that replacing different amino acids in
the sequence has on the relative stability of the protein. From this and other work [Kwok
2003], it is hoped that the relative and absolute stability of the protein can be determined.
There are a number of advantages of studying the coiled-coil domain. The advantages are
[TRI2 2003]:
∞ Abundant motif in proteins∞ There is only one type of secondary structure present, i.e. the α-helix∞ Only two interacting α -helices are required to introduce tertiary and
quaternary structure∞ Diversity in length makes it an ideal system to test predictions∞ All the non-covalent interactions that stabilize the three-dimensional structure
of proteins are found in coiled-coils∞ Experimentally easy to analyze structure and stability
Being able to determine protein stability is important because a minimum
threshold of stability is required to initiate final protein folding and stability is intimately

28
involved in conformational changes and function of proteins [Kwok 2003, Lauzon 2001,
Chakrabarty 2002]. To expedite this work, an analysis tool is needed to calculate the
stability of an amino acid sequence. The “Stable Input” tool was developed in
conjunction with UCHSC to help the center determine coiled-coil stability over an entire
sequence prior to conducting a lengthy experiment.
Stable Input Parameters
An HTML graphical user interface program that is available on University of
Colorado at Colorado Springs Computer Science department Linux server provides input
to “Stable Input” [SI 2003]. This program allows the biologists the opportunity to enter a
sequence, set parameters, and perform calculations based on custom or default parameter
values. The results are provided in the form of up to eight different graphs and a tab
delimited text file of sequence values in kilo-calories per mole (kcals/mol).
The input from the HTML program is parsed and a common gateway interface
PERL program called “stable_coiled_sub.pl” calculates the results. The calculations are
based either user inputs or program defaults. The user settable inputs are summarized in
below.
Sequence Information1. Sequence2. Sequence Name3. Heptad Registry offset4. Window width

29
Tabulated Input1. Helical Propensity2. Hydrophobic core stability between a and d’ and d and a’ positions3. Intra-chain (i to i+3 or i to i+4) electrostatic interactions4. Inter-chain (g-e’ or i to i’+5) electrostatic interactions5. Hydrophobic Clusters6. Entropy-Chain Length
The window width allows the user to determine the number of amino acids over which to
calculate the relative stability. There are two options, 7 and 11. A window size of 7 is the
default window size in the program. The idea is that windowing the results for a
particular amino acid sequence will include the influence of at least one heptad on the
one amino acid being scored. The windowed point, when aligned with the amino acid
sequence, represents the stability trend for that position derived from the amino acids
slightly before and slightly after the current amino acid position. The beginning and end
of the sequence need special handling because there are too few amino acids to populate
a full window. The windowing algorithm is outlined below for a window width of 7, it
takes three parameters, the sequence array, Window array and the widow width and
returns an array of the same len:
WindowingINPUT: Raw Sequence Array
Window Array Window width
current position=0FOR EACH $Amino Acid in the ( Raw Sequence Array ) IF ( current position > window width /2 ) and (current position <= (Raw Sequence length) - window width /2) THEN 7 Windowed Array[current position] = Σ Raw Sequence [i]; i=current-3 ELSE IF ( current position == 0 ) THEN Window width/2 Windowed Array [current position] = Σ Raw Sequence [i]; i=0

30
ELSE IF ( current position == 1 ) THEN
Windowed Array [current position]= Windowed Array [0]+Raw Sequence [4]
ELSE IF ( current position == 2 ) THEN
Windowed Array [current position]= Windowed Array[1]+ Raw Sequence [5]
ELSE IF ( current position == Two From Sequence End ) THEN 6 Windowed Array [current position] = Σ Raw Sequence [i]; i=current position -3
ELSE IF ( current position == one from sequence end ) THEN 5 Windowed array [current position] = Σ Raw Sequence [i]; i=current position -3
ELSE IF ( current position == sequence end ) THEN 4 Windowed array [current position] = Σ Raw Sequence [i]; i=current position -3
current position = current position +1
A similar approach is used to implement the 11 amino acid window width. The
major difference is that the beginning and ending partial windows are extended to include
5 positions before and after the current position.
The “beginning” case is handled by summing the first window/2+1 positions to
produce the 0th windowed result value, summing the first window/2+2 positions produces
the 1st windowed result value. This continues until the values for the window width/2 -1
result value is calculated. A similar calculation produces the windowed value for the
“end” corner case. When the number of positions goes below the window value, the
remaining values are used until the last four values are used for the last windowed

31
positions. An example of this calculation is illustrated for a small sequence in Table 3-1,
Windowing Algorithm for Window = 7.
AminoAcid D F Y H L A D E R G H A L V L L ITableValue 1 1 2 4 1 2 3 1 2 1 3 1 3 1 1 2 1Values A B C D E F G H I J K L M N O P Q
ValuesUsedForWindow A
BCD
ABCDE
ABCDEF
ABCDEFG
BCDEFGH
CDEFGHI
DEFGHIJ
EFRGHJK
FGHIJKL
GHIJKLM
HIJKLMN
IJKLMNO
JKLMNOP
KLMNOPQ
LMNOPQ
MNOPQ
NOPQ
WindowedValue 8 9 11 14 14 15 14 13 13 14 12 12 12 12 9 8 5
Table 3-1 Windowing Algorithm for Window = 7
The heptad registry position parameter sets the heptad registry offset for the input
sequence. This parameter defaults to ‘g’ if not specified by the user. The heptad registry
offset determines the heptad registry position of the first amino acid in the sequence.
Having set the first registry position, the rest of the sequence is set according to the
heptad repeat (abcdefg)n. The registry position of the sequence is stored in a parallel
array and is used in all the calculations performed by the Stable Input tool.
There are five experimentally determined parameter tables provided by UCHSC
that form the basis of all calculations. The user can override these tables by selecting the
custom radio button for any of the input parameters and providing a complete table of

32
values in the prescribed format. One or all of the five tables can be customized without
affecting the other tables.
Each of the five tables is formatted according to the information being described.
The helical propensity table contains the one helical propensity value for each of the 20
amino acids. The Intra-Chain Electrostatics Interactions table contains a value for a select
set of amino acid pairs and their values are based on the spatial separation of the pair
members. The Inter-Chain E/G Electrostatic Interaction table has two values for each
amino acid. These values are based on whether the amino acid is in the ‘e’ heptad
position or the ‘g’ heptad position. The Hydrophobic core stability table also has two
values per amino acid. These values are based on the relative heptad position, either ‘a’
or ‘d’, for each amino acid. The entropy table has a single entry per amino acid and
represents the amount of energy that should be removed from the final stability
calculation based on the amino acids in the sequence.
All table values in all five tables are listed in kcals/mol and are listed in tables and
represent the amount of relative stability each of these amino acid interactions contribute
to the over all stability of the sequence. Some of these tables represent a characteristic of
the amino acid such as helical propensity. Whereas others are based on amino acid
interactions that are derived not only on the amino acids involved but their relative
position to other amino acids within the coiled-coil.

33
Helical Propensity
The helical propensity value measures the effect a particular amino acid has on
the creation of a helix. The first propensity scale was actually a measure of the statistical
frequency that the different amino acids were found to occur in helices. Ala has the
highest helical propensity while Glu, Met, Leu, and Lys are slightly less helically prone.
Those amino acids with the least helical propensity are Gly, Ser, Thr, and Pro. Pro
actually disrupts helical formations.
Hydrophobicity
Hydrophobicity refers to the tendency of non-polar molecules to associate with
each other rather than with a polar substance such as water. The most hydrophobic
amino acids are those with aliphatic and aromatic non-polar side chains. An aliphatic
compound is one that is not aromatic; i.e., it lacks a particular arrangement of atoms in its
molecular structure. These amino acids are Ile, Met, Leu, and Val. An aromatic molecule
or compound is one that has special stability and properties due to a closed loop of its
electrons. Phe is an aromatic amino acid. The other amino acids Arg, Lys, Tyr, and Trp
have a mixture of hydrophobic, polar and charged characteristics. The experimental
tables used in Stable Input have ‘a’ and ‘d’ hydrophobic core stability values with the
helical propensity component removed. The hydrophobic core of a coiled-coil is depicted
looking down the axis of the coils in Figure 3-1, Coiled Coil A/D and E/G Interactions
[UOFG 2003]. The hydrophobic interaction between amino acids in the ‘a’ and ‘d’

34
positions is one of two interactions that occurs between the amino acids of the different
coils.
Figure 3-1 Coiled Coil A/D and E/G Interactions
E/G Interactions
Also depicted in Figure 3-1, Coiled Coil A/D and E/G Interactions, is the relative
position of the amino acids in the ‘e’ and ‘g’ positions on the different coils. Leu, Ile,
Met, and Val are the only amino acids that can occur in the ‘e’ or ‘g’ position that
impacts the stability. The other amino acids do not contribute to stability when found in
these positions. The arrows in Figure 3-2 Lateral View Coiled Coil E/G Interaction,
depicts the relative positions of the ‘e’ and ‘g’ positioned amino acids along the coiled-
coil pair. The E/G interactions add to overall coiled-coil stability by creating bonds
between these amino acids and pulling the two coiled regions together.

35
Figure 3-2 Lateral View Coiled Coil E/G Interaction
Intra-Chain Electrostatic Interactions
The intra-chain Electrostatics Interaction is the interaction that occurs between
amino acids in the same coil. These interactions only apply between the charged amino
acids His, Arg, Lys, Asp, and Glu that are found at a distance of i+3, i+4, or i+5 from its
pair partner i. In the case of the pair partner being at a distance of i+5, this interaction is
applied only if the i+5 position is in the heptad position ‘e’ or ‘g’. This calculation
determines the additional stability gained by having charged amino acids above and
below the current amino acid. The spatial relationship is due to the relative positions of
the amino acid around the helix.

36
Clusters
When hydrophobic amino acids occupy the hydrophobic core of the coiled-coil in
consecutive heptads, stability increases [Kwok 2003]. The clustering of hydrophobic
amino acids is also considered in the Stable Input program. Considering only heptad
positions ‘a’ and ‘d’, Figure 3-3, Clustered Hydrophobic Core, illustrates clustering in
consecutive heptads. In the figure, the hydrophobic amino acids, Phe, Ile, Leu, Met, Val,
and Tyr are the darkened circle, while all others are open circles. A cluster is defined
starting and ending with three or more consecutive hydrophobic amino acids occupying
the hydrophobic core positions with no more than one of these positions being occupied
by anything else.
Amino Acid Sequence
Seq1Seq2
GabcdefEAEALKA-EIEALKA-KAEAAEG-KAEALEG-KIEALEG-KAEAAEG-KAEALEG-EIEALKAEAEALKA-EAEALKA-KIEAAEG-KAEALEG-KIEALEG-KAEAAEG-KAEALEG-EIEALKA
Schematic Representation of Hydrophobic residue at a and d positions
Seq 1
Seq 2
a d a d a d a d a d a d a d a d3 Clusters
2 Clusters
Figure 3-3 Clustered Hydrophobic Core
Entropy
The entropy table has one experimentally determined entropy value per amino
acid. These values represent the change in system entropy due to the presence of each of
37
the 20 amino acids. Entropy is a measure in the energy distribution within a system. As
an example, the amino acid Pro does not appear in helical conformations. The entropy
table shows that Pro changes the entropy by 17 kcal/mol, this suggests that a large change
in entropy indicates a decrease in coiled-coil stability.
Program Flow
Program flow is illustrated in Figure 3-4, Stable Input Program Flow. The
program begins by reading the five stability parameter tables into five hash tables. The
keys for the hash tables are either the amino acids or, in the case if the intra-chain
interactions table, the amino acid pairs. Each amino acid is then assigned a heptad
position. The first amino acid position is determined by the user; rest of the positions
follow the heptad repeat pattern (abcdefg)n, the heptad positions are saved in a parallel
array. Parallel arrays are also used to save the data for derived from the five input tables
corresponding to each amino acid.

38
Figure 3-4 Stable Input Program Flow
A parallel array is also used to save the final cluster map. A cluster map is used in
the program to identify the regions in the sequence that form hydrophobic core clusters
and includes the positions that separate clusters by at least one position. The pseudo-
code, Cluster Algorithm, below outlines the process of creating the cluster map. This
routine takes three input parameters and returns an array that includes a 1 in each amino
acid position that participates in a cluster.
Input
SequenceHeptad OffsetTablesReq. Graphs
InputTables toHashTables
CreateHeptadRegistryArray
CreateParallelarrays fromtables
ApplyClusterAlgorithm
ApplyWindowingAlgorithm
Windowed Stability =∑ Window ArraysNon-Windowed Stability =∑ Non-Window Arrays
CGI OutputTable/Graphs
39
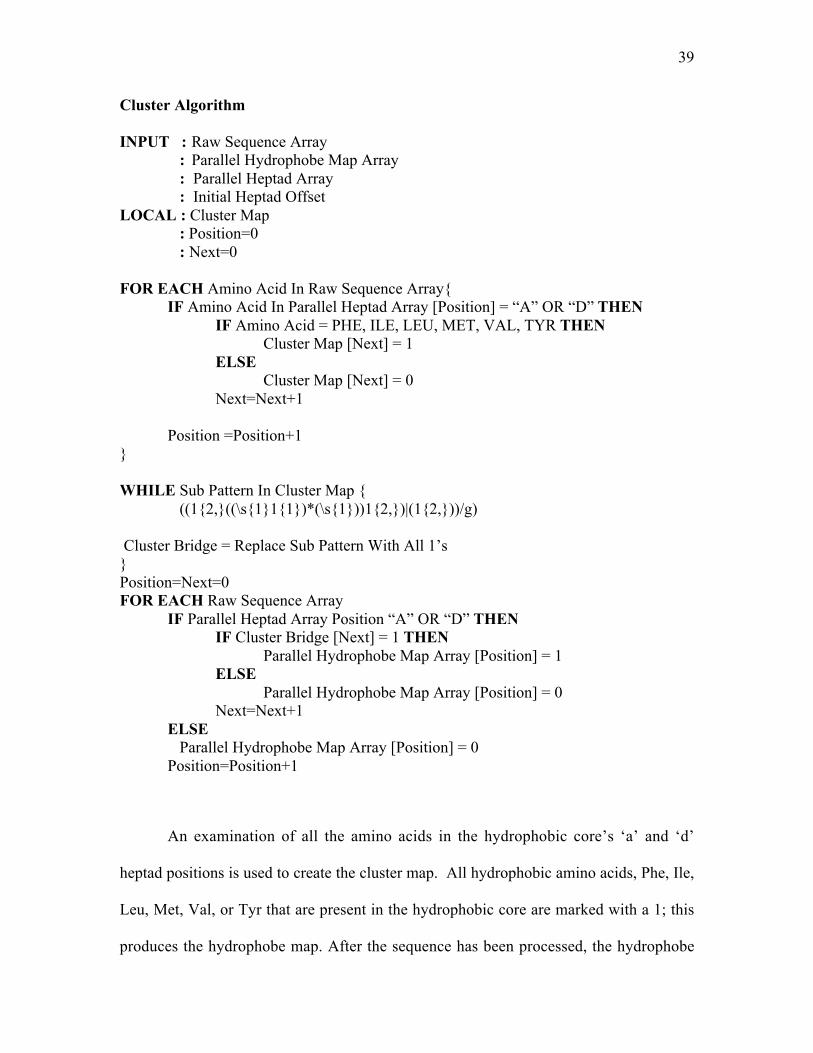
Cluster Algorithm
INPUT : Raw Sequence Array : Parallel Hydrophobe Map Array
: Parallel Heptad Array : Initial Heptad OffsetLOCAL : Cluster Map
: Position=0 : Next=0
FOR EACH Amino Acid In Raw Sequence Array{IF Amino Acid In Parallel Heptad Array [Position] = “A” OR “D” THEN
IF Amino Acid = PHE, ILE, LEU, MET, VAL, TYR THEN Cluster Map [Next] = 1
ELSECluster Map [Next] = 0
Next=Next+1
Position =Position+1}
WHILE Sub Pattern In Cluster Map { ((1{2,}((\s{1}1{1})*(\s{1}))1{2,})|(1{2,}))/g)
Cluster Bridge = Replace Sub Pattern With All 1’s}Position=Next=0FOR EACH Raw Sequence Array
IF Parallel Heptad Array Position “A” OR “D” THENIF Cluster Bridge [Next] = 1 THEN
Parallel Hydrophobe Map Array [Position] = 1ELSE
Parallel Hydrophobe Map Array [Position] = 0Next=Next+1
ELSE Parallel Hydrophobe Map Array [Position] = 0 Position=Position+1
An examination of all the amino acids in the hydrophobic core’s ‘a’ and ‘d’
heptad positions is used to create the cluster map. All hydrophobic amino acids, Phe, Ile,
Leu, Met, Val, or Tyr that are present in the hydrophobic core are marked with a 1; this
produces the hydrophobe map. After the sequence has been processed, the hydrophobe

40
map is condensed to remove all position but those of the hydrophobic core. This is the
cluster map. At this point the cluster map has no relationship to the sequence and is better
suited for cluster pattern searches. Once a cluster pattern is found, the entire cluster
region is marked 1’s; this produces a bridge map. It is called a bridge map because the
clustered areas are bridged by non-hydophobic amino acids that will be included in the
cluster. Figure 3-5, Clusters, illustrates what cluster map patterns are bridged and which
are not.
Cluster Map Cluster Bridge11011011 1111111110111011 0011111111010101 0000000001011010 0000000011100111 11100111
Figure 3-5 Clusters
After all clusters have been found in the sequence, the bridge map is expanded
back using the starting heptad offset provided by the user. Figure 3-6, Mapping Example,
is an example of this process.
Heptad Position GABCDEFGABCDEFGABCDEFGABCDEFGAmino Acid AMHTISCWHKRLDEKLPAKKRSIKRMKACHydrophobe Map 01001000000100010000001001000Cluster Map 11011011Cluster Bridge 11111111Final Map 01001001000100010010001001000
Figure 3-6 Mapping Example
The final map serves as a per amino acid multiplier when the total stability is calculated
for that particular amino acid in the sequence.

41
The five stability parameter tables are used to create sequence-aligned arrays for
the attributes being evaluated. The helical propensity attribute is done by a simple hash
look-up. This attribute is not dependant on heptad position or its relation to any other
amino acid. When completed, each amino acid in the sequences has a helical propensity
value. Table 3-2, Helical Propensity Values, show all values used in the default case and
were derived experimentally and provided by UCHSC [TRI 2003]. The helical propensity
values listed are the amount of stability these amino acids add to the relative stability to
the protein. Note, that Pro has the only negative value and is considered a helix killer
when found in a sequence.
Amino Acid Single Letter
Helical PropensityScore kcal/mol
Alanine A 0.53Cysteine C 0.24
Aspartic acid D 0.12Glutamic acid E 0.18Phenylalanine F 0.26
Glycine G 0.00Histidine H 0.18Isoleucine I 0.33
Lysine K 0.39Leucine L 0.45
Methionine M 0.37Asparagine N 0.18
Proline P -2.5Glutamine Q 0.34Arginine R 0.50Serine S 0.18
Threonine T 0.15Valine V 0.23
Tryptophan W 0.27Tyrosine Y 0.24
Table 3-2 Helical Propensity Values

42
The Hydrophobic core stability between a and d’ and d and a’ positions is
dependant on the heptad positions of the amino acids. In these case a sequence aligned
array is generated that contains a value for only amino acids in the ‘a’ and ‘d’ positions.
The hash lookup for this parameter is the amino acid and is premised on its heptad
position. For example, if an amino acid is in the ‘a’ heptad position it will receive a
different score than the same amino acid in the ‘d’ heptad position. Table 3-3,
Hydrophobic Core Values, shows the default values used in the calculations [TRI 2003].
Amino Acid SingleLetter
PositionA
PositionD
Alanine A 0.72 1.27Cysteine C 0.72 1.27
Aspartic acid D -0.63 0.78Glutamic acid E 0.07 0.27Phenylalanine F 2.49 2.14
Glycine G 0.00 0.00Histidine H 0.47 1.22Isoleucine I 2.87 2.97
Lysine K 0.66 0.51Leucine L 2.55 3.25
Methionine M 2.58 3.03Asparagine N 1.52 1.32
Proline P -5.00 -5.00Glutamine Q 0.86 1.71Arginine R 0.35 -0.15Serine S 0.42 0.72
Threonine T 1.20 1.05Valine V 3.07 2.12
Tryptophan W 1.38 1.48Tyrosine Y 2.11 2.26
Table 3-3 Hydrophobic Core Values

43
The fourth sequence aligned array is for the Intra-chain (i to i+3, i to i+4, and i to
i+5(g)) electrostatic interactions. This calculation is not only sensitive to which heptad
position the amino acid is in, but is also dependant on the amino acids at a sequence
distances of i+3, i+4, and i+5. In this calculation, consideration is only given amino acid
pairs consisting of Asp, Glu, Lys, Arg, and His at the i and i+3 and i+4 positions. If the
amino acid at the ith position is in heptad registry position ‘c’ or ‘a’, then the amino acid
in the i+5 position is considered too with the same pairing restriction applies. Table 3-4,
Intra-Chain Effect, lists the default values used [TRI 2003].

44
Residue Pair i to i+3Score
i to i+4Score
i to i+5Score(e/g)
Lys- Glu 0.2 0.2 0.4Lys-Asp 0.2 0.2 0.4Arg-Glu 0.2 0.2 0.4Arg-Asp 0.2 0.2 0.4His-Glu 0.2 0.2 0.4His-Asp 0.2 0.2 0.4Glu-Lys 0.2 0.2 0.4Glu-Arg 0.2 0.2 0.4Glu-His 0.2 0.2 0.4Asp-Lys 0.2 0.2 0.4Asp-Arg 0.2 0.2 0.4Asp-His 0.2 0.2 0.4Glu-Glu -0.2 -0.2 -0.4Glu- Asp -0.2 -0.2 -0.4Asp-Asp -0.2 -0.2 -0.4Asp- Glu -0.2 -0.2 -0.4Lys- Lys -0.2 -0.2 -0.4Lys- Arg -0.2 -0.2 -0.4Lys- His -0.2 -0.2 -0.4Arg-Arg -0.2 -0.2 -0.4Arg-Lys -0.2 -0.2 -0.4Arg-His -0.2 -0.2 -0.4His-His -0.2 -0.2 -0.4His-Lys -0.2 -0.2 -0.4His-Arg -0.2 -0.2 -0.4
Table 3-4 Intra-Chain Effect
When scoring the intra-chain interaction, 1/2 of the table score is given to each residue
position. If more than one interaction can occur in any of the pair positions then the value
assigned to the amino acids is added.
The fourth sequentially aligned array that is created is the Inter-chain (g-e’or i to
i’+5) electrostatic interactions array. This array is created by considering only those
amino acids in the heptad registry positions ‘e’ and ‘g’. Figure 3-1 and Figure 3-2
illustrate the positional interactions between the two amino acids. Hash lookups for this

45
parameter are straightforward and are only dependent on position. These interactions are
just outside the hydrophobic core and a very few amino acids participate. Ile, Leu, Met,
and Val are the amino acids that have been identified as being significant in these
positions. Table 3-5, Inter-Chain Electrostatics, lists the default values used [TRI 2003].
Amino Acid Position eScore
Position gScore
Ile 0.7 0.8Leu 0.7 0.8Met 0.4 0.5Val 0.4 0.5
Table 3-5 Inter-Chain Electrostatics
Output Table
Appendix A, Tabulated Output, is an example of the 19 column tab-delimited
table produced by Stable Input. The first column is the sequence position number, the
second column is the amino acid in that sequence position, and the third column is the
heptad registry position. Columns 4, 5, 6, and 7 are the values assigned to that amino acid
based on the four of the five input parameter tables. The tenth column is the final cluster
map. Clusters can be identified by 1’s marking consecutive ‘a’ and ‘d’ heptad positions.
Columns 11, 12, 13, and 14 are the helical, intra-chain electrostatic interactions,
hydrophobic core, and inter-chain electrostatic interaction that have had the windowing
algorithm applied. The remaining columns are derived based on the values found in the
five-parameter tables and the cluster map.

46
Column 8, Relative Stability, is the position specific relative stability value for
each amino acid. Amino acids found in clusters are given a full hydrophobicity score in
this calculation. If no clusters are present no hydrophobicity score is added to the relative
stability score.
Relative Stability[i] = Heli Propensity[i]+AD Electro[i]+EG Electro+Cluster[i]*Hydro[i]
Column 9, Windowed Relative Stability, applies the windowing function to the position
specific Relative Stability values calculated above.
Total Stability, column 16, takes into account the entropy in the coiled-coil.
Entropy was introduced late in the project to help reconcile the deviation between the
results obtained using only the four-parameter tables and the experimental data when
longer coiled-coils were used [TRI 2003]. In his research, Dr. Tripet noticed that as the
coiled-coil length was increased, the experimentally measured stability values differed
from the calculated values. The chain length effect, as it has become known as, is an
informal theory advanced to help account for these differences. To assist, the program
was modified to account for entropy in the coiled-coil. The total stability calculation is
made by removing the total accumulated entropy from the total accumulated stability.
i Total Stability [i] = ∑ Relative Stability[j] – Entropy[j]
j=0
47
Column 17, Running Stability is the accumulated stability calculated from the
four input parameters. This represent the amount of stability the sequence gains as a
result of the chain length.
i Running Stability [i] = ∑ Relative Stability[j]
j=0
Column 18, Density stability, is an attempt to normalize the Running Stability
value based on the number of amino acids that were used to determine it. This value is
the total accumulated stability divided by the number of residues used to calculate it.
i Density Stability [i] =( ∑ Relative Stability[j] )/ i
j=0
Finally, the Density window column 19, is the windowed values obtained from
applying the window function to the Density Stability column. These columns are used in
the graphical output.
Output Graphs
When requested, graphs are generated based on the tabulated values. The graphs
are generated using the Linux based program GNUPLOT. This program is called directly
from the Stable Input program and stores the .PNG file in the local directory. The
tabulated and graphical output follows a naming convention that prevents the current
operating directory from getting cluttered by old data. This convention is the system time

48
stamp plus an extension indicating which file it describes. Table 3-6, File Extensions,
shows which files are associated with which data set.
File Extension Data set associated*all.png Graphic with all values graphed*hel.png Helical Propensity*ele.png Intra-Chain Electrostatic Interactions*e_g.png Inter-Chain Electrostatic Interactions*hyd.png Hydrophobic Core*chl.png Stability with Entropy*den.png Stability Density*sum.png Total Stability*ent.png Windowed Entropy*.text Tabulated results
Table 3-6 File Extensions
After all the calculations are complete and the graphs generated, the output is
written to a HTML formatted page. The text file is written to a local file and a HTML
link is provided in the HTML output. The HTML output is formatted to include the
protein sequence with position markers, the initial heptad offset, and all the graphs
requested by the user. After each run, all the old graphs and tabulated data files are
deleted and replaced with the new files. To further assist the biologist, the individual
graphs of the last run are saved in the cgi-bin directory on the server.
The graphs are produced using the GNUPLOT program is installed on the Linux
server. GNUPLOT uses the various columns from the output text file as the data points
for the graphs. The graphs use as the X-axis the amino acid sequence position, the Y-axis
is the column information found in the text file. The summary (*all.png) plot is a
composite of four columns in the text file and requires GNUPLOT to re-plot the graph
49
for each of the columns used. It has four different line graphs, one for each of the four
input parameter, and a point plot. The point plot is the sequence positions that represent
that clustered ‘a’ and ‘d’ positions. In all the graphs, a legend in set in the upper right
hand portion of the graph that is color and symbol coded.
Figure 3-7, Tropomyosin Sequence, was used to demonstrate the graphical output
of Stable Input. Figures 3-8 through 3-18 are the produced using the tool with the heptad
registry option set to A. Appendix A has the table output generated by the Stable Input
program.
0 MDAIKKKMQM LKLDKENALD RAEQAEADKK AAEDRSKQLE DELVSLQKKL KGTEDELDKY60 SEALKDAQEK LELAEKKATD AEADVASLNR RIQLVEEELD RAQERLATAL QKLEEAEKAA120 DESERGMKVI ESRAQKDEEK MEIQEIQLKE AKHIAEDADR KYEEVARKLV IIESDLERAE180 ERAELSEGKC AELEEELKTV TNNLKSLEAQ AEKYSQKEDR YEEEIKVLSD KLKEAETRAE240 FAERSVTKLE KSIDDLEDEL YAQKLKYKAI SEELDHALND MTSI
Figure 3-7 Tropomyosin Sequence
Figure 3-8, Summary Output, shows the summary plot produced. This plot and
all other plots produced have as the X-axis the sequence position and as the Y-axis the
Relative stability in kilo-calories per mole. The Summary Output plot shows a composite
of the windowed helical propensity, E/G and A/D interactions, and the clustered
positions. The clustered regions are identified as points at their respective positions in the
sequence.
This graph shows that in nature a coiled-coil protein, such as tropomyosin, has
significant regions of high helical propensity and hydrophobic clusters. This graph also
shows a correlation between the clustered regions and A/D stability. Since this graph is
an analysis of the entire protein, there are regions in the protein that are not stable coiled-

50
coils. In the graph this is shown in the region around position 175. This region shows that
all the indicators of coiled-coil stability fall off significantly. This is a region where no
clusters form, helical propensity is low and the A/D stability is very low.

51
Figure 3-8 Summary Output

52
Figure 3-9 Total Stability
Figure 3-9, Total Stability, is the sum of all stability factors. It shows that regions
in the tropomyosin protein have a great amount of stability in many different regions.
These are regions in the protein that can be examined in greater detail to determine what
amino acids are in these regions.

53
Figure 3-10 A/D Hydrophobic Stability
Figure 3-10, A/D Hydrophobic Stability, is a graph that shows the amount of
stability gained because of the interaction between the amino acid in the ‘a’ and ‘d’
position Positions ~45 - ~75, ~80 - ~115, and ~235 - ~275 are three regions that stand
out as having in the tropomyosin protein that have high hydrophobic contributions to
stability. There are other regions but these stand out because they represent large trend
regions.

54
Figure 3-11 Helical Propensity
Figure 3-11 Helical propensity, is the helical propensity of the windowed values
for the individual amino acids. This graph shows regions where coil formation is
favored. Since a single amino acid cannot for an amino acid, the windowing of the helical
propensity shows the propensity for a region. The strongest region shown here is in the
region between ~60 and ~120, but to a lesser degree the entire protein show a propensity
to form coils.

55
Figure 3-12 E/G Electrostatic Interaction
Figure 3-12, E/G Electrostatic Interaction, windowed or not, is one of the sparest
graphs generated. The E/G interactions are based on finding two charged (Lys, Glu,
Asp,Arg, or His) amino acids in the ‘e’ or ‘g’ heptad positions. This indicates that the
tropomyosin protein does not rely heavily on the E/G interactions for stability.

56
Figure 3-13 Chain Length
Figure 3-13 Chain Length, is a graph that shows the average amount of stability
gained for each additional amino acid. The idea is that as the length of the sequence
increases there would be a corresponding increase in stability. This was a part of the
research that continues to have trouble and the theory is not set [TRI 2003]. Keeping in
mind that all output graphs are optional, this graph was included here because as the
theory becomes more refined the algorithm can be changed and this graph can become
meaningful.

57
Figure 3-14 Density Stability
Figure 3-14, Density Stability is a graph of Figure 3-13 with the windowing
algorithm. This graph shows how the stability changes over the length of the protein by
dividing the accumulated relative stability as each new amino acid is added divided by
the number of amino acids used to calculate it.

58
Chapter 4
CHAPTER 4
COILED-COIL CLUSTER ANALYSIS
Why Coiled-Coils?
This chapter describes the analysis of hydrophobic amino acids clusters in the ‘a’
and ‘d’ heptad positions in coiled-coil proteins of length 42 amino acids or greater. The
‘a’ and ‘d’ positions are the only significant positions because they form the hydrophobic
core of the coiled coil. The minimum sequences length of 42 was chosen as the minimum
length because the stabilizing effect has been observed when there are at least 3 minimum
length (3 amino acids) clusters separated by at least one minimum length destabilizing
cluster. Kwok cluster experiments used two proteins. The first protein had 3, 3 amino
acid, clusters and 2, 3 amino acid, destabilizing clusters, and the second protein had 2, 3
amino acids, cluster and 1, 3, and 1, 2, amino acid destabilizing clusters [Kwok 2003]. A
sequence length of 42 is the smallest full heptad length in which 3 minimum length
clusters this can be observed.
Hydrophobic interactions contribute significantly to protein stability because
the burial of the hydrophobic surfaces is thermodynamically favorable in aqueous
solutions. Hydrophobic core clustering may play an important role in the structure and
the function of long native coiled-coil proteins as well as be an important mechanism for

59
long coiled-coil proteins to maintain chain integrity. Hydrophobic core clusters can also
serve as “knots” to keep that chain together while allowing regions flexible regions to
function. The stabilizing regions can control protein stability in structurally important
regions and destabilizing clusters of a coiled-coil may be involved in conformational
changes that allow protein-to-protein interactions. Finally, the hydrophobic core clusters
are a natural nucleation sites for protein folding intermediates. Investigating the structural
and functional roles of hydrophobic clusters will improve the understanding of the
mechanism of coiled-coils and protein folding in general [Kwok 2003]. Because the
hydrophobic core can have non-hydrophobic amino acids and form destabilizing clusters
that separate stabilizing clusters. Hydrophobic clusters are those clusters of the amino
acids Phe, Ile, Leu, Met, Val, and Tyr while destabilizing clusters are those clusters of the
amino acids Ala, Ser, Thr, Gln, Asp, Glu, and Lys. Both cluster types are characterized in
this analysis.
Protein Database Analysis
This analysis compares annotated coiled-coil domain data to that of a complete
database of all protein sequences after each has been pre-processed through a modified
coiled-coil prediction algorithm. This analysis will attempt to find answers to five
questions concerning coiled-coil clusters. First, how often do the hydrophobic amino
acids (Phe, Ile, Leu, Met, Val, and Tyr) occur in the ‘a’ and ‘d’ position; second, what are
the lengths of these clusters; third, what amino acids are present in clusters of different
cluster lengths; fourth, how are the various amino acids distributed in various length

60
clusters; and fifth, Coiled-coils always start with stabilizing clusters, can these be
characterized, and if so how? Two sources of data were used to find the answers to these
questions. The first source of data comes from the annotated coiled-coil domain found in
the Swiss-Prot database via SWall on the European Bioinformatics Institute (EBI) servers
[EBI 2003]. The second source of data is the entire protein database found in Swiss-Prot
and TrEMBL [SIB 2003], or SPTR, database via the ExPASy server [EXP 2003]. Since
the SPTR data is a collection of all proteins, a method for determining where in the
proteins coiled-coils may appear is necessary. Both datasets are pre-processed using an
algorithm similar to that found in the Stable Coil program to identify stable coil regions.
After both sets of data have been processed, two working files of data are produced. The
dataset derived from the annotated coiled-coils is referred to as the Swiss-Prot dataset and
the dataset derived from the entire Swiss-Prot TrEMBL database is referred to as the
SPTR dataset.
SPTR dataset
The SPTR dataset was derived from data retrieved from ExPASy Molecular
Biology Server. The ExPASy (Expert Protein Analysis System) proteomics server of the
Swiss Institute of Bioinformatics is dedicated to the analysis of protein sequences.
ExPASy provides a number of different tools, databases, and, other documentation
dedicated to the study of proteins. This server provides access to Swiss-Prot and
TrEMBL Protein Knowledgebase. Swiss-Prot is a protein sequence database that strives
to provide a high level of annotations (such as the description of the function of a protein,
61
its domains structure, post-translational modifications, variants, etc.), a minimal level of
redundancy and high level of integration with other databases. TrEMBL is a computer-
annotated supplement of Swiss-Prot database that contains all the translations of EMBL
nucleotide sequence entries not yet integrated in the Swiss-Prot database. As of mid
August 2003 the Swiss-Prot Release 41.20 had 132675 entries.
The ExPASy server provides a file that contains a copy of the latest Swiss-Prot
database. From the Swiss-Prot TrEMBL web page, a link can be followed to the database
file download page. The complete database is available on CD or by FTP. FTP
downloads can be done from seven different mirror sites. The SPTR dataset used in this
analysis was done using a weekly updated-complete non-redundant database-from the US
mirror site. The database contained 132000 formatted protein entries packet into 55
megabytes. The raw data found in this file is in the format shown in Figure 4-1, SPTR
Protein Entry. This entry contains the Entry name, 108_LYCES, the primary accession
number, Q43495, and the protein name, Protein 108 precursor - Lycopersicon esculentum
(Tomato). The rest of the entry is the protein sequence.
sp|Q43495|108_LYCES (Q43495) Protein 108 precursor. - Lycopersicon esculentum (Tomato).MASVKSSSSSSSSSFISLLLLILLVIVLQSQVIECQPQQSCTASLTGLNVCAPFLVPGSPTASTECCNAVQSINHDCMCNTMRIAAQIPAQCNLPPLSCSAN
Figure 4-1 SPTR Protein Entry
Swiss-Prot Coiled-Coils
Swiss-Prot TrEMBL is a nearly non-redundant protein database consisting of the
SwissProt, SwissProtNew, TrEMBL, and TrEMBLNEW data repositories [SPTR 2003].

62
This database will provide the sub-sequences for queried coiled-coil domains. In this
case, the coiled-coil domain is sought for all annotated proteins. What follows is the
method used to retrieve the coiled-coil domain sequences. Unfortunately the coiled-coil
information is not available in a concise format.
The Swiss-Prot database [SWPR 2003] provides two classes of data: the core
protein data and the annotations. The core data has the sequence data, the citation
information (bibliographical references), and the taxonomic data (description of the
biological source of the protein). The annotation data consists of the description of the
functions of the protein, domains and sites, secondary structure, quaternary structure,
similarities to other proteins, diseases associated with any number of deficiencies in the
protein and sequence conflicts, variants.
A query of the Swiss-Prot TrEMBL database for the coiled-coil domain with the
protein sequence option set will return a list of 70 proteins from SWall (SPTR on the EBI
SRS server) with additional 2600 proteins available on additionally linked pages. Figure
4-2, Coiled-Coil Retrieval, is the method using PERL to retrieve the coiled-coil
sequences.

63
Figure 4-2 Coiled-Coil Retrieval
To get the additional pages, the database is re-queried with the display set to display as
many as 3000 entries on a single page. The retrieved page contains a link to every SWall
entry and another link through the accession number to all 2600 proteins that contain a
coiled-coil reference.
Following one of the SWall entry links opens a detailed page describing the
protein. Near the bottom of the page, the feature section shows the different domain types
identified in the protein. Each of these domains is a link to another page with detailed
information about the particular domain. For the purpose of this analysis, only the Coiled
Coil (POTENTIAL) domain is of interest. Each of the protein links will have at least one
Coiled Coil domain link, but could also have multiple domain links. The coiled-coil
Open SWall2643 Proteins
Parse and Saveall ProteinAccessionNumbers
Assemble “GET”Command fromProtein AccessionData
Parse and Save allCoiled Coil DomainRef’s
Assemble “GET”Command fromCoiled Coil Refs
Parse Coiled CoilDomain Information
Save Coiled CoilSequences

64
domain link provides a page that greatly simplifies coiled-coil sub-sequence retrieval.
The sub-sequence pages contain only the sequence, sequence ID, length, and start/end
position.
Retrieving the coiled-coil data from each entry is done in a three-step process.
First, a list of HTML links is extracted from the 2600 entry protein query page. Second,
the HTML links are used to form a PERL GET call to retrieve the Swiss-Prot entry page
for each protein. The contents of all the Swiss-Prot pages are parsed to find all the links
to the COILED COIL (POTENTIAL) link. The final step uses the coiled-coil linked
pages to form another PERL GET call to retrieve the page that has only the details of the
coiled region.
The information retrieved from this page is shown in Figure 4-3, Coiled Coil
Entry. This entry has the identifier ID A2S3_Human and was the parent protein in which
it was found. This is followed by the domain identification and the sequence positions in
which it was found. Finally, the domain sequence is displayed along with the length of
the region.
ID A2S3_HUMAN_1; parent: A2S3_HUMANFT DOMAIN 134 354 COILED COIL (POTENTIAL).SQ Sequence 221 AA; QALLKRNHVL SEQNESLEEQ LGQAFDQVNQ LQHELCKKDE LLRIVSIASE ESETDSSCST PLRFNESFSL SQGLLQLEML QEKLKELEEE NMALRSKACH IKTETVTYEE KEQQLVSDCV KELRETNAQM SRMTEELSGK SDELIRYQEE LSSLLSQIVD LQHKLKEHVI EKEELKLHLQ ASKDAQRQLT MELHELQDRN MECLGMLHES QEEIKELRSR S//
Figure 4-3 Coiled Coil Entry
From this page, the coiled-coil sub-sequence, name and start and end position
information are save to a file.

65
The saved file is not perfect. There are over 2600 protein links that were followed.
This process took over one hour and forty minutes using a high-speed network
connection. During this process there were a number of “server time-out” errors that
were also written to output file. There were multiple attempts to get an error free run.
This was not possible. These entries had to be removed by hand. Of the 2600 links
followed, about nine “time-out” errors were found. Since this was a small proportion of
all the links removing them should not affect the overall results.
Stable Coil Pre-Processing
Before any analysis can begin, the specific coiled regions of each sequence need
to be determined. Coiled-coils are composed of multiple coiled coils that wrap around
each other. The individual coils are not necessarily aligned on the same heptad registry.
To identify the coils on different heptad alignments, the modified Stable Coil algorithm is
used. Even though the Swiss Prot dataset has already identified purported coiled-coil
regions, the individual coils have not been. Using the modified Stable Coil algorithm,
both datasets can be processed to determine specific coiled regions and the heptad
registry offset in which they exist.
Stable Coil is offered by Pence, The Canadian Protein Engineering Network [SCP
2003], and is a program designed to predict the location and stability of alpha-helical
coiled-coil conformations within protein sequences. The program uses experimentally
derived alpha-helical propensity and stability coefficients as reported by [Zhou 1994,
Wagschal 1999 and Tripet 2000]. By summing the residue scores over variable window

66
widths and comparing the total score assigned to each amino acid to a known globular
and cytoskeletal coiled-coil containing sequences, the program displays the region and
probability (in kcal/mol) that a particular sequence will adopt a coiled-coil conformation.
The modified version of the algorithm uses a 42 amino acid window with a probability
that the sequence is a coiled region set to 38kcal/mol.
The modified Stable Coil analysis algorithm uses coil stability and helical
propensity to identify coiled regions. Each sequence is processed seven times; once for
each heptad position. Each amino acid has the combined helical propensity and stability
coefficient applied to it based on its heptad registry position. The value the amino acid
position assigned is determined by which heptad position it occupies in the heptad
alignment. The amino acid position is set to one of three different values whether the
amino acid is in the ‘a’, ‘d’, or one of the other five positions. Table 4-1, Helical
Propensity and Stability Values, lists the values that are used.

67
AminoAcid
PositionA
PositionB Other
A 1.245 1.8 0.528C 1.245 1.8 0.237D -0.75 0.9 0.116E 0.255 0.45 0.176F 2.75 2.4 0.264G 0 0 0H 0.67 1.4 0.182I 3.185 3.3 0.325K 1.045 0.9 0.385L 2.985 3.7 0.446M 2.96 3.4 0.369N 1.67 1.5 0.182P -10 -10 -5Q 1.18 2.05 0.336R 0.86 0.35 0.495S 0.605 0.9 0.182T 1.345 1.2 0.154V 3.295 2.35 0.231W 1.635 1.75 0.27Y 2.285 2.5 0.237
Table 4-1 Helical Propensity and Stability Values
After applying these values to the sequence, windowing is applied to locate coils.
Starting with the sequence values and a zeroed parallel array, a window of the first 42
values is summed. This sum is applied to the parallel array if the present value in a
position is less that the new sum. This process is repeated until the entire parallel array is
set. After the windowing process is complete, the regions that have at least 3 heptads with
a value of greater than 38 are deemed to be coiled regions. These regions are then
extracted from the sequences and saved along with the heptad registry positions with
which it was found. When preprocessing is complete, all coiled regions in all the protein
sequences are identified and each coiled sequence has a starting heptad offset assigned to
it. These new sequences are place in one of two new datasets that are used in this
analysis. The first dataset, containing 2817 coil sequences, is the Swiss-Prot data having

68
originally come from the Swiss-Prot coiled-coil annotated database, and the set second
dataset, containing 67358 coil sequences, is the SPTR data having been derived from the
entire SPTR database.
Coil Analysis
The Swiss-Prot and SPTR dataset have a great variety sequence lengths. A graph
depicting this variety in total sequence length is shown in Figure 4-4, Normalized Length
Frequency. This graph shows that both datasets have a similar distribution of sequence
length when normalized to the greatest sequence length in the set. Both datasets had
recorded the most frequent length at 44 amino acids. The Swiss-Prot dataset was
normalized to 216 sequences and the SPTR dataset was normalized to 8660 sequences.

69
Normalized Length Frequency
0.0000
0.0200
0.0400
0.0600
0.0800
0.1000
0.1200
0.1400
42 49 56 63 70 77 84 91 98 105
Sequence Length
No
rma
lize
d C
ou
nt
Swiss-Prot SPTR
Figure 4-4 Normalized Length Frequency
Having collected about 70000 coil sequences between the two dataset the first question to
be answered is at what frequency do the hydrophobic amino acids Phe, Ile, Leu, Met,
Val, and Tyr occupy the hydrophobic core positions ‘a’ and ‘d?’
The frequency at which the different amino acids appear in the hydrophobic core
are listed in Figure 4-5, Amino Acid in A and D positions 6&7 Heptads -SPTR and
Figure 4-6, Amino Acid in A and D 6&7 Heptads -Swiss-Prot. These two tables show the
data for sequences that are 6 and 7 heptads in length in both the ‘a’ and ‘d’ heptad
positions. Going from left to right the bars in each graph represent the frequency of the
amino acid in the A then D position with the 6 heptad data set first the 7 heptad data.

70
6&7 Heptad Amino Acid SPTR Data
0.00
0.05
0.10
0.15
0.20
0.25
0.30
A C D E F G H I K L M N P Q R S T V W Y
Amino Acids
No
rm
alize
d C
ou
nt
A 6 Heptad D 6 Heptad A 7 Heptad D 7 Heptad
Figure 4-5 Amino Acid in A and D positions 6&7 Heptads-SPTR
6&7 Heptad Amino Acid Swiss Prot Data
0.00
0.05
0.10
0.15
0.20
0.25
0.30
0.35
0.40
0.45
A C D E F G H I K L M N P Q R S T V W Y
Amino Acids
No
rma
lize
d C
ou
nt
A 6 Heptad D 7 Heptad A 7 Heptad D 7 Heptad
Figure 4-6 Amino Acid in A and D positions 6&7 Heptads - Swiss-Prot

71
In both sets of data the in raw numbers for the first two full heptads show that in
either case Leu is the dominate amino acid in either the ‘a’ or the ‘d’ position, but Leu is
preferred in the ‘d’ position. Ile and Val are the next two dominant amino acids. These
two are preferred in the ‘a’ position in the Swiss-Prot data, but in the SPTR data the
preference is strong in Val but almost even in Ile. Phe appears to favor the ‘a’ position in
the SPTR data but is very sparse in the Swiss-Prot data. Surprisingly the non-
hydrophobic amino acid Ala appears in the ‘a’ and ‘d’ position more often than Tyr in
both datasets and favors the ‘d’ position.
Aminio Acid Frequency Swiss-Prot
0.00
0.05
0.10
0.15
0.20
0.25
0.30
0.35
0.40
0.45
0.50
A C D E F G H I K L M N P Q R S T V W Y
Amino Acid
No
rma
lize
d C
ou
nt
Heptad Position A Heptad Position D
Figure 4-7 Normalized Amino Acid Distribution Swiss-Prot

72
Amino Acid Frequency SPTR
0.00
0.05
0.10
0.15
0.20
0.25
0.30
0.35
A C D E F G H I K L M N P Q R S T V W Y
Amino Acid
No
rma
lize
d C
ou
nt
Heptad Position A Heptad Position D
Figure 4-8 Normalized Amino Acid Distribution SPTR
Figure 4-7, Normalized Amino Acid Distribution Swiss-Prot, and Figure 4-8,
Normalized Amino Acid Distribution SPTR, shows the relative frequency the amino
acids appear in the A and D positions for both sets of data. For the Swiss-Prot dataset the
A position is dominated by Leu, Ile, Val, Lys, Asn, Arg and Ala and in the ‘d’ position
Leu, Ala, Ile, Val, Lys, Gln, and Met. The SPTR data shows that the ‘a’ position is
dominated by Leu, Ile, Val, Phe, Ala, and Tyr and in the ‘d’ position Leu, Ile, Val, Ala,
Phe, Met, and Tyr. Both of these datasets show that Ala competes with the hydrophobic
amino acids in occurrence frequency. Other studies (Tripet 2000, Wagschal 1999, Lupas
1991) have found that L is most likely to be found in the ‘a’ and ‘d’ positions followed by
the other hydrophobic amino acids with a strong showing of Ala in both the ‘a’ and ‘d’

73
positions. The strongest disagreement was in the frequency in which Met occurred. This
study showed it was consistently one of the least likely hydrophobic amino acid to occur
in the in the ‘a’ and ‘d’ position, but in the other studies, Met was the third most likely
hydrophobic amino acid to appear in the ‘a’ and ‘d’ positions.
The stabilizing effect that clusters have on longer sequence chains has been seen
experimentally. Do long protein chains have more clusters? If they, do how are they
characterized?
To answer this question the clusters found in all the sequences in both datasets are
examined. A minimum sequence length of 42 amino acids or 6 heptads is examined and
compared. The distribution of the normalized cluster length across all sequence lengths is
shown in Figure 4-8, Normalized Cluster Count by Heptad Length. This figure shows the
total number of clusters of length three or greater that appear in the various length
sequences. The Swiss-Prot dataset has 5526 clusters and the SPTR dataset had 102718.
Figure 4-9, Normalized Clusters by Heptad Length, shows that the Swiss-Prot
dataset has a slight propensity for having fewer clusters in shorter sequences than that of
the SPTR dataset. As the sequences get longer the cluster count for both sets of data falls
off, but the SPTR data diminishes more rapidly than that of the Swiss-Prot data. While
the SPTR dataset approaches no clusters counted beyond 12 heptads in length there is a
relative consistent from length 12 through 19 heptads. Since the Swiss-Prot data is comes
from the coiled-coil data set this data seems to suggest that clusters are important in
longer coiled-coils.

74
Total Clusters in Heptad Lengths
-
0.050
0.100
0.150
0.200
0.250
0.300
0.350
0.400
6 7 8 9 10 11 12 13 14 15 16 17 18 19 20 21 22
Heptads
No
rm
alize
d C
lus
te
rs
Co
un
t
Swiss-Prot SPTR
Figure 4-9 Normalized Cluster by Heptad Length
When considering the number of hydrophobic amino acid in any given length,
how often do the coiled sequences have them in the hydrophobic core positions ‘a’ and
‘d’? Do the coils in nature have a minimum number of hydrophobic amino acids in their
hydrophobic core?
The frequency of hydrophobic amino acids in the coiled sequences is determined
by counting the number of times a hydrophobic amino acid appear in the ‘a’ and ‘d’
positions for all sequence lengths. The results are summarized in Table 4-2, Phe, Ile, Leu,
Met, Val, and Tyr Frequency Swiss-Prot, and Table 4-3, Phe, Ile, Leu, Met, Val, and Tyr
Frequency SPTR. Both tables are based on the number of ‘a’ and ‘d’ positions found in
the coiled sequence. The averages are based on the number of ‘a’ and ‘d’ positions
available in the given heptad length, divided by the average number of hydrophobic
amino acids found in all sequences of that length.

75
HeptadLength
AveHydroph
SeqsFound
%Hydroph
HeptadLength
Ave LrgHydroph
SeqsFound
% LrgHydroph
6 7.75 557 0.65 16 19.65 20 0.618.57 311 0.66 21.11 18 0.64
7 9.04 309 0.65 17 21.06 16 0.629.71 232 0.65 21.15 20 0.6
8 10.16 178 0.63 18 23.06 17 0.6410.97 155 0.65 23.27 15 0.63
9 11.27 135 0.63 19 24 17 0.6312.13 112 0.64 25.17 6 0.65
10 12.92 75 0.65 20 25.43 7 0.6413.33 83 0.63 23.56 9 0.57
11 14.04 80 0.64 21 27.4 15 0.6514.52 82 0.63 25.44 9 0.59
12 15.95 44 0.66 22 28.7 10 0.6516.49 41 0.66 27.83 6 0.62
13 17.03 29 0.66 23 29.17 12 0.6317.04 48 0.63 30 1 0.64
14 18.03 35 0.64 24 29 1 0.618.84 37 0.65 30.4 5 0.62
15 18.52 33 0.62 25 32 1 0.6419.52 23 0.63 34.5 2 0.68
Table 4-2 Phe, Ile, Leu, Met, Val, and Tyr Frequency Swiss-Prot

76
HeptadLength
AveHydroph
SeqsFound
%Hydroph
HeptadLength
Ave LrgHydroph
SeqsFound
% LrgHydroph
6 8.2 27039 0.68 16 20.65 51 0.658.89 12137 0.68 22.04 52 0.67
7 9.48 7673 0.68 17 22.34 50 0.6610.1 5204 0.67 22.34 38 0.64
8 10.72 3966 0.67 18 23.48 33 0.6511.26 2719 0.66 24.32 31 0.66
9 11.97 1978 0.66 19 24.4 30 0.6412.69 1500 0.67 25.27 15 0.65
10 13.44 1279 0.67 20 26.64 11 0.6713.99 892 0.67 26.71 21 0.65
11 14.74 736 0.67 21 27.79 19 0.6615.49 452 0.67 26 12 0.6
12 16.7 240 0.7 22 29.38 16 0.6717.16 222 0.69 30.08 12 0.67
13 17.34 160 0.67 23 28.85 13 0.6317.73 175 0.66 31 4 0.66
14 18.74 123 0.67 24 30.67 3 0.6419.51 133 0.67 30.4 5 0.62
15 19.49 136 0.65 25 32 1 0.6420.25 75 0.65 32 1 0.63
Table 4-3 Phe, Ile, Leu, Met, Val, and Tyr Frequency SPTR
An examination of all sequences of all lengths show that on average, the
hydrophobic core of these coiled regions are occupied by hydrophobic amino acids about
66% of the time. The Swiss-Prot dataset had an average of 65% for heptad lengths of 6 to
15. As the sequence length extends and few sequences are found, the average falls to
60%. The SPTR dataset show that in the heptad lengths of 6 to 15 the hydrophobic core
occupancy rate was about 67% and beyond that the average was 65%. This would seem
to suggest that when the Stable Coil algorithm is used to predict coiled-coil regions there

77
is a constant number of hydrophobic amino acid that must reside in the hydrophobic core.
This could prove to be a minimum cutoff for coiled-coil regions.
Knowing that clusters exist in both the Swiss-Prot and SPTR datasets, how many
clusters of any length are in sequences of different length? Are hydrophobic clusters
more numerous that non-hydrophobic clusters? This analysis will provide insight into
what separates hydrophobic clusters. The cluster effect can extend beyond the
hydrophobic cluster if two clusters are separated by a single hydrophobic core position
[TRI 2003].
Hydrophobic core clusters are characterized next. In this analysis a hydrophobic
cluster is consecutive ‘a’ and ‘d’ positions being occupied by the amino acids Phe, Ile,
Leu, Met, Val, and Tyr and a non-hydrophobic cluster is when two or more consecutive
‘a’ and ‘d’ positions are occupied by a non-hydrophobic amino acid. Both datasets are
analyzes and are summarized below in the graphs. The first two graphs Figure 4-10, Total
Clusters and Ratio by Sequence Length Swiss-Prot, and Figure 4-11, Total Clusters and
Ratio by Sequence Length SPTR, show the total number of hydrophobic and non-
hydrophobic clusters that are present for a given sequence length.

78
Total Clusters and Ratio By Length Swiss-Prot
0
100
200
300
400
500
600
700
6 7 8 910
11
12
13
14
15
16
17
18
19
20
21
22
23
24
25
26
27
28
Heptads
Clu
ste
r C
ou
nt
0
0.2
0.4
0.6
0.8
1
1.2
1.4
Ra
tio
Hydro Clusters Non-Hydro Clusters Ratio
Figure 4-10 Total Clusters and Ratio by Heptad Length Swiss-Prot
Total Clusters and Ratio by Heptad Length SPTR
0
5000
10000
15000
20000
25000
30000
35000
40000
6 7 8 910
11
12
13
14
15
16
17
18
19
20
21
22
23
24
25
Heptads
Clu
ste
r C
ou
nt
0
0.2
0.4
0.6
0.8
1
1.2
Ra
tio
Hydro Clusters Non-Hydro Clusters RatioFigure 4-11 Total Clusters and Ratio by Heptad Length SPTR

79
Both charts show that the number of clusters for both the hydrophobic and non-
hydrophobic amino acids, diminish sharply after sequences grow beyond 12 heptads and
very few are found beyond 28 heptads. Even thought the total numbers diminish, both
dataset show a similar pattern ratio of hydrophobic clusters to non-hydrophobic clusters
as the sequence length goes from 6 heptads to over 25 heptads. This indicates that when
hydrophobic clusters are present they are separated by non-hydrophobic clusters between
60 and 80% of the time.
The next set of charts, Figure 4-12, Total Clusters by Cluster Size Swiss-Prot and
Figure 4-13, Total Clusters by Cluster Size SPTR, show the size of the clusters of both
types found in both datasets. The non-hydrophobic clusters are counted starting at length
two while the hydrophobic clusters are counted starting at length 3. Non-hydrophobic
clusters never exceed 6 in length, while the hydrophobic clusters had a diminished
presence beyond length 12.
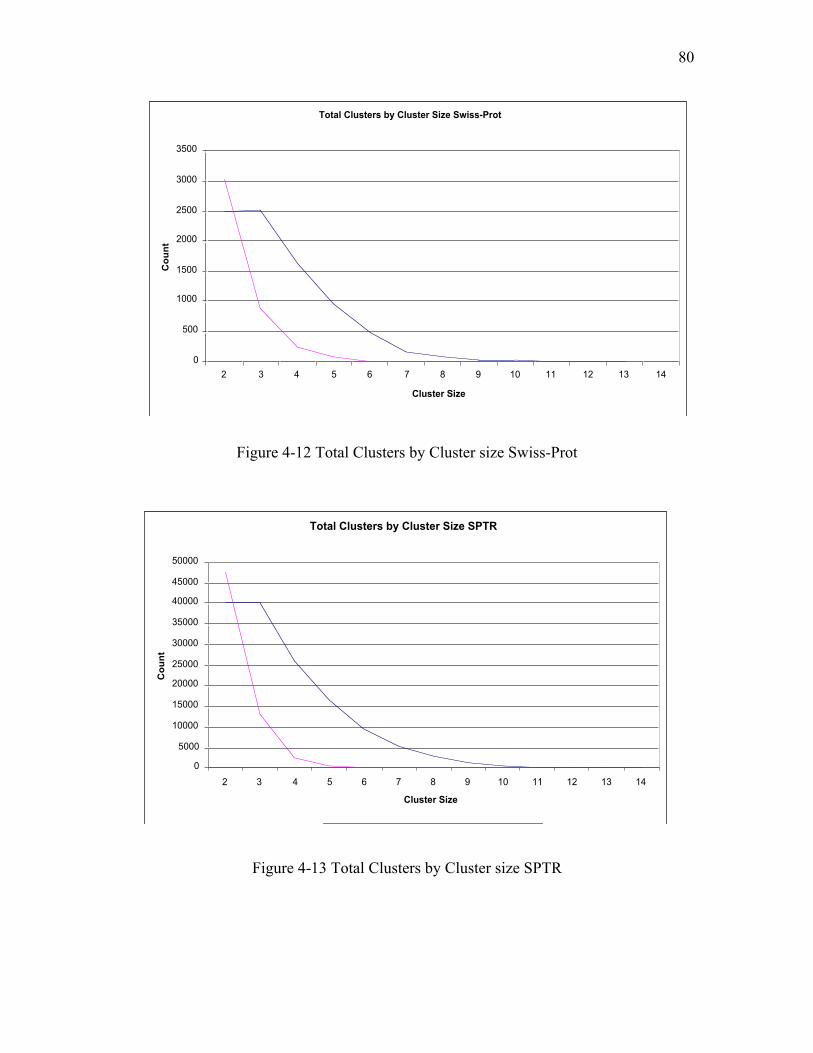
80
Total Clusters by Cluster Size Swiss-Prot
0
500
1000
1500
2000
2500
3000
3500
2 3 4 5 6 7 8 9 10 11 12 13 14
Cluster Size
Co
un
t
Hydro Clusters Non-Hydro Clusters
Figure 4-12 Total Clusters by Cluster size Swiss-Prot
Total Clusters by Cluster Size SPTR
0
5000
10000
15000
20000
25000
30000
35000
40000
45000
50000
2 3 4 5 6 7 8 9 10 11 12 13 14
Cluster Size
Co
un
t
Hydro Clusters Non-Hydro Clusters
Figure 4-13 Total Clusters by Cluster size SPTR

81
Tables 4-4 though 4-15, detail the distribution of the hydrophobic clusters and
non-hydrophobic clusters for 6 specific heptad lengths found in the two datasets. The
first 6 tables show the analysis for the Swiss-Prot data and the second set of six is for the
SPTR data. Each table represents a different sequence length. The hydrophobic and non-
hydrophobic cluster lengths range from 3 to 10. The first column in the table is the cluster
length, the second and third column, Hydro and Non-Hydro respectively. These columns
have the number of clusters of each length and type that are found for the sequence length
the table represents.

82
ClusterLength
Hydro NonHydro
3 343 1124 164 235 84 46 357 58 49 110Total 636 139
Table 4-4 Clusters 6 Heptad S-P
ClusterLength
Hydro NonHydro
3 211 484 82 105 75 76 397 158 89 210Total 432 65
Table 4-5 Clusters 6 Heptad+1 S-P
ClusterLength
Hydro NonHydro
3 214 514 109 125 76 16 467 108 79 210Total 464 73
Table 4-6 Clusters 7 Heptad S-P
ClusterLength
Hydro NonHydro
3 139 494 85 55 69 16 337 178 79 410 1Total 355 55
Table 4-7 Cluster 7+1 Heptad S-P
ClusterLength
Hydro NonHydro
3 135 514 59 45 45 16 267 78 99 110 2Total 284 56
Table 4-8 Clusters 8 Heptad S-P
ClusterLength
Hydro NonHydro
3 124 354 64 45 41 26 187 128 89 010 1Total 268 41
Table 4-9 Clusters 8+1 Heptad S-P

83
ClusterLength
Hydro NonHydro
3 15346 47814 9453 9215 5156 96 27787 12828 5749 21310 91Total 34939 5711
Table 4-10 Clusters 6 Heptad SPTR
ClusterLength
Hydro NonHydro
3 7214 17484 4500 3035 2981 786 1642 27 842 18 8429 18510 185Total 17959 2132
Table 4-11 Clusters 6 Heptad+1 SPTR
ClusterLength
Hydro NonHydro
3 4041 10304 2947 2125 1959 456 1220 27 7268 3699 19510 19Total 11571 1289
Table 4-12 Clusters 7 Heptad SPTR
ClusterLength
Hydro NonHydro
3 2756 9544 1905 1195 1444 126 9107 5458 2479 14710 60Total 8071 1085
Table 4-13 Clusters 7+1 Heptad SPTR
ClusterLength
Hydro NonHydro
3 2242 9244 1237 1535 1115 146 7517 4178 2579 14910 72Total 6318 1091
Table 4-14 Clusters 8 Heptad SPTR
ClusterLength
Hydro NonHydro
3 1695 6804 958 1385 729 116 4817 3318 1979 9010 52Total 4582 829
Table 4-15 Clusters 8+1 Heptad SPTR

84
These tables show that for the Swiss-Prot dataset, as the size of the cluster
increases by one from 3 to 4 the number found in the sequences declines by 60%,
whereas the SPTR dataset the number found declines by 38%. This would indicate that
clusters of three are favored over the clusters of four in the Swiss-Prot dataset, whereas in
the SPTR dataset the clusters of appear more often than clusters of four these are not as
strongly favored. The most dramatic declines are found in the non-hydrophobic clusters
in both datasets. In the SPTR dataset, when the cluster size is increased from 3 to 4, the
number of clusters found declines by 80%. Similarly, the drop for the Swiss-Prot dataset
is 85%. This data seems to suggest that the presence of small clusters is favored over
large clusters in both the hydrophobic and non-hydrophobic cases. This could suggest
that nature uses small hydrophobic clusters in combination with many small non-
hydrophobic clusters to form longer stable regions in coiled sequences. Nature seems to
favor small stable regions to long stable regions. This may allow flexibility in protein
folding and performance.
Counting the clusters found in the different length sequences gives an
appreciation for the difference found in sequences of different lengths, but how are the
various amino acids distributed in various cluster lengths?
Having determined the frequency of the various cluster lengths, the next step is to
attempt to describe the amino acids that participate in the dominant cluster lengths for
both the hydrophobic and non-hydrophobic amino acids. From the tabulated data above
most hydrophobic clusters are 3 to 4 amino acids in length and appear in sequence length

85
of 6 and 7 heptads. The non-hydrophobic clusters are more selective. These occur in
clusters of two and diminish quickly and are rare beyond length 6.
Figure 4-14, Hydrophobic Amino Acids in Clusters, is a normalized count of the
hydrophobic amino acids that occur in clusters. Both datasets show a similar trend in that
Leu appears most often and Tyr the least. The only discrepancy is in the appearance of
Phe. Phe appear much more often in cluster in the total SPTR dataset than in that of the
Swiss-Prot dataset. The Non-hydrophobic clusters are not as easily characterized. Figure
4-15, Non-Hydrophobic Amino Acids in Clusters, shows that while the Swiss-Prot
dataset favors Ala, Asn, Thr, Ser, and Gln, the SPTR data set favors Ala, Lys, Gln, Glu,
and Arg. The only area of agreement between the two datasets is in what does not appear
in non-hydrophobic clusters. Gly, His, Cys, Asp, and Trp do not appear in either datasets.
Of these Cys, His, and, Asp are hydrophilic amino acids.
Hydrophobic Cluster
0
0.1
0.2
0.3
0.4
0.5
0.6
L I V M Y F
Amino Acid
No
rm
alize
d C
ou
nt
Swiss-Prot SPTR
Figure 4-14 Hydrophobic Amino Acids in Clusters
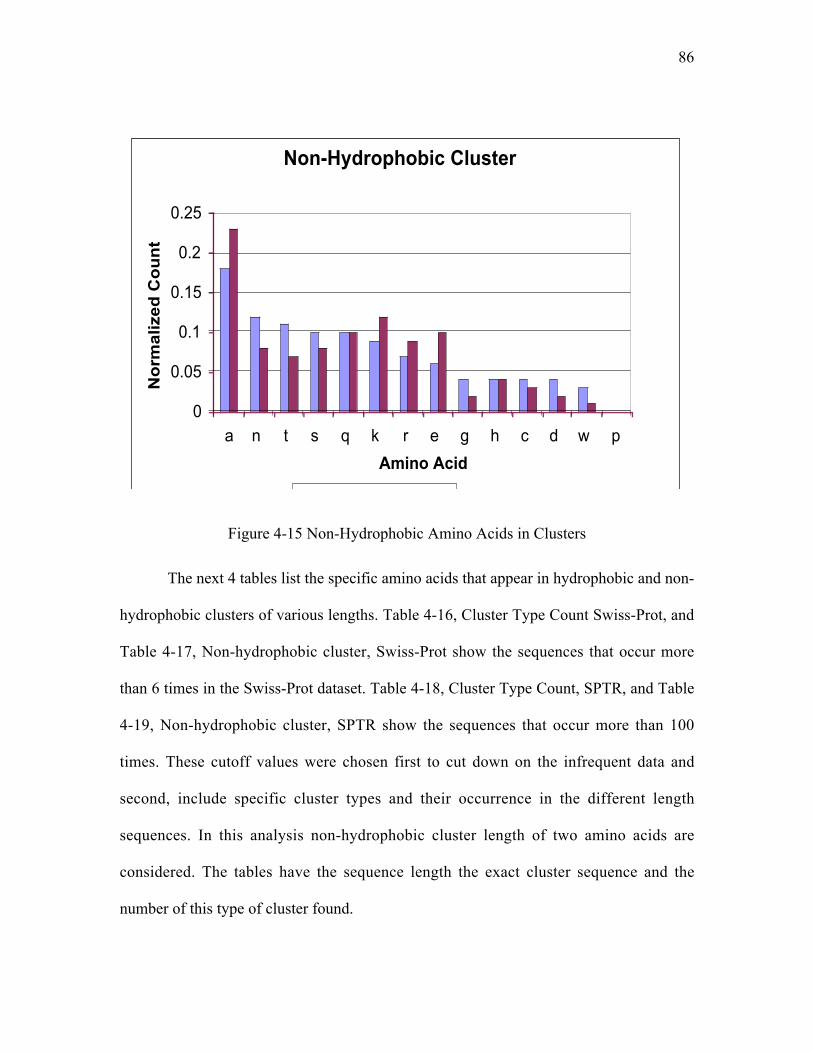
86
Non-Hydrophobic Cluster
0
0.05
0.1
0.15
0.2
0.25
a n t s q k r e g h c d w p
Amino Acid
No
rm
alize
d C
ou
nt
Swiss-Prot SPTR
Figure 4-15 Non-Hydrophobic Amino Acids in Clusters
The next 4 tables list the specific amino acids that appear in hydrophobic and non-
hydrophobic clusters of various lengths. Table 4-16, Cluster Type Count Swiss-Prot, and
Table 4-17, Non-hydrophobic cluster, Swiss-Prot show the sequences that occur more
than 6 times in the Swiss-Prot dataset. Table 4-18, Cluster Type Count, SPTR, and Table
4-19, Non-hydrophobic cluster, SPTR show the sequences that occur more than 100
times. These cutoff values were chosen first to cut down on the infrequent data and
second, include specific cluster types and their occurrence in the different length
sequences. In this analysis non-hydrophobic cluster length of two amino acids are
considered. The tables have the sequence length the exact cluster sequence and the
number of this type of cluster found.

87
Lngth Cluster Num Lngth Cluster Num Lngth Cluster Num Lngth Cluster Num12 IIL 7 13 ILL 16 14 LVL 15 17 ILL 1712 ILI 10 13 LIL 12 14 LVLL 6 17 LIL 612 ILIL 7 13 LLF 7 14 VLL 15 17 LLI 612 ILL 40 13 LLI 6 15 ILL 10 17 LLL 1612 ILLL 9 13 LLL 21 15 ILV 10 17 LVL 712 IML 8 13 LLLL 7 15 LIL 21 18 ILI 612 IVL 8 13 LLV 13 15 LILL 7 18 ILL 912 LIL 21 13 LML 7 15 LLL 16 18 LLL 1812 LLFV 6 13 LVL 8 15 LLLL 8 18 LVL 812 LLI 8 13 VLL 18 15 LLV 6 18 LYL 712 LLL 38 13 VLV 8 15 LLY 7 19 ILL 1212 LLLL 9 13 VLVVV 6 15 LVL 6 19 LILL 612 LLM 6 14 ILL 17 15 LVLL 6 19 LLL 1412 LLV 8 14 LIL 16 15 VLL 8 19 LVL 1212 LLY 10 14 LIV 8 16 ILI 6 20 LLL 712 LML 12 14 LLI 8 16 ILL 12 21 LILL 712 LVL 26 14 LLL 42 16 LIL 10 21 LLL 1712 LYL 6 14 LLLL 10 16 LLI 6 21 LML 712 VLL 13 14 LML 10 16 LLL 25 21 LVL 913 ILI 11 14 LMLLL 6 16 LVL 16 21 LVLL 8
Table 4-16 Hydrophobic Cluster Count, Swiss-Prot
Table 4-16, Hydrophobic Cluster Count, Swiss-Prot, shows that Leu, Ile and Val are the
dominant amino acids in the clusters from the Swiss-Prot dataset and the majority of the
clusters are 3 and 4 amino acids long. Table 4-17, Non-Hydrophobic Cluster Count,
Swiss-Prot, shows that the amino acid Ala is dominant in clusters of 2 and 3.

88
Lngth Cluster Num Lngth Cluster Num Lngth Cluster Num Lngth Cluster Num12 AA 9 13 RA 6 16 AQ 8 42 AAA 1012 AK 8 14 AA 11 16 QN 6 46 EK 612 AN 8 14 AE 6 17 AT 8 52 EK 1112 AQ 13 14 AK 7 17 HE 6 62 ER 1312 AR 10 14 AQ 7 17 TN 6 62 KT 612 EK 11 14 AR 6 18 HK 6 76 ER 1112 ER 12 14 ER 10 19 AN 10 77 EK 812 HA 7 14 KE 6 20 AAA 6 86 ER 612 KA 8 14 QK 6 21 AC 612 KQ 7 14 TA 6 21 EK 812 NA 10 14 TK 8 22 EK 612 NK 6 14 TS 6 23 AA 612 QA 11 15 AK 11 23 SA 812 QKE 7 15 AN 7 23 TK 712 QT 7 15 AS 12 24 AK 712 RQ 8 15 KA 6 27 AAAN 812 SA 7 15 NA 7 27 ENS 1112 TK 9 15 QK 6 27 TD 913 AK 7 15 TE 7 28 TK 713 QA 7 16 AK 9 29 AASN 6
Table 4-17 Non-Hydrophobic Cluster Count, Swiss-Prot
Table 4-18, Hydrophobic Cluster Count, SPTR, shows the SPTR dataset is
dominated by 3 and 4 length clusters with Leu, Ile, and Val, but there are more Phe than
in the Swiss-Prot dataset. Table 4-19, Non-Hydrophobic Cluster Count, SPTR, shows
that most of the clusters are 2 amino acids long composed main of Ala and Asn.

89
Lngth Cluster Num Lngth Cluster Num Lngth Cluster Num Lngth Cluster Num12 FIL 113 12 LLF 189 12 VVL 170 14 LIL 12812 FLI 123 12 LLI 422 12 YLL 115 14 LLI 12712 FLL 277 12 LLL 823 12 YYL 118 14 LLL 22212 III 251 12 LLLL 186 13 FLL 122 14 LLV 10212 IIL 293 12 LLM 169 13 IIL 146 14 LVL 11412 IIV 125 12 LLV 282 13 ILI 163 15 LLL 18912 ILF 225 12 LLY 131 13 ILL 193 16 LLL 14612 ILI 323 12 LML 196 13 LII 135 17 LLL 11612 ILL 514 12 LVF 103 13 LIL 20712 ILLL 128 12 LVI 158 13 LIV 10412 ILV 230 12 LVL 399 13 LLF 17812 IVI 133 12 LVV 140 13 LLI 18712 IVL 184 12 LYL 126 13 LLL 45212 LFI 116 12 MLL 183 13 LLLL 11912 LFL 217 12 VII 129 13 LLV 15712 LIF 113 12 VIL 173 13 LML 10512 LII 250 12 VLI 220 13 LVL 18412 LIL 408 12 VLL 372 13 VLI 10512 LILL 122 12 VLM 107 13 VLL 21612 LIV 192 12 VLV 166 14 ILL 168
Table 4-18 Hydrophobic Cluster Count, SPTR
Lngth Cluster Num Lngth Cluster Num Lngth Cluster Num Lngth Cluster Num12 AA 516 12 KQ 133 12 SA 251 13 TN 10512 AE 134 12 KS 147 12 SK 141 14 AA 19812 AG 147 12 KT 127 12 SN 201 14 AT 11312 AK 241 12 NA 263 12 SQ 171 14 TA 11112 AN 225 12 ND 115 12 SS 158 15 AA 11712 AQ 208 12 NK 153 12 ST 22212 AR 155 12 NN 247 12 TA 31512 AS 235 12 NQ 162 12 TE 11112 AT 328 12 NR 132 12 TK 15112 CA 120 12 NS 221 12 TN 20012 EA 125 12 NT 184 12 TQ 18112 EK 118 12 QA 217 12 TS 21512 EN 103 12 QH 122 12 TT 20412 GA 173 12 QK 126 13 AA 25112 GN 106 12 QN 167 13 AK 11312 HA 126 12 QQ 163 13 AN 10412 HT 124 12 QS 122 13 AT 13312 KA 224 12 QT 150 13 NA 11912 KK 183 12 RA 171 13 NN 16912 KN 214 12 RN 113 13 SA 118
Table 4-19 Non-Hydrophobic Cluster Count, SPTR

90
Finally, do stabilizing clusters exist and if so, how can they be characterized? It is
thought that each coiled-coil begins with a stabilizing cluster. Each of the coil sequences
in the two datasets are examined, first to find if there is a cluster beginning each
sequence, and then which amino acids populate these clusters. For this part of the
analysis, a convention of 0’s and _’s are used to signify the hydrophobic amino acids and
non-hydrophobic amino acids respectively. Table 4-20, Stabilizing Cluster Swiss-Prot,
shows that only about 33% of the Swiss-Prot sequences begin with a cluster and Table 4-
21, Stabilizing Cluster SPTR shows that 38% of the SPTR begin with clusters.
ClusterPattern
NumberFound
PercentOf total
000 591 20.44%_000 358 12.38%__000 164 5.67%___000 65 2.25%____000 17 0.59%000__ 95 3.29%000_0 172 5.95%0000_ 153 5.29%00000 171 5.91%000___ 37 1.28%000__0 58 2.01%
Table 4-20 Stabilizing Cluster, Swiss Prot

91
ClusterPattern
NumberFound
PercentOf total
000 18527 27.51%_000 7537 11.19%__000 2776 4.12%
___000 906 1.35%____000 255 0.38%
000__ 2355 3.50%000_0 4832 7.17%0000_ 4479 6.65%00000 6861 10.19%
000___ 763 1.13%000__0 1592 2.36%
Table 4-21 Stabilizing Cluster, SPTR
In an attempt to find starting stabilizing clusters other beginning sequences
patterns were examined. Offsetting the starting sequences by _ heptad at a time, shows
that a beginning cluster does not appear even after offsetting 2 full heptads. The Swiss-
Prot analysis examined 2891 sequences and the SPTR analysis examined 67358
sequences.
The majority of the sequences used in this analysis do not begin with a stabilizing
cluster. To search the beginning of the sequence for a starting cluster, the assumed
beginning of the sequence was advanced by increments of _ a heptad. This attempt still
revealed that a majority of the sequences contain no starting stabilizing cluster. At best
between the two data sets 35% of the sequences used began with a cluster.
Of the sequences that did begin with a stabilizing cluster, a closer look at the
cluster patterns 000, 0000, and 00000 shows that the dominant amino acids found in these
clusters are Leu and Ile. Most of the clusters appear in the 12 heptads long sequences.
The cluster sequence Leu-Leu-Leu appears most often. Table 4-22, Cluster Amino Acids

92
Swiss-Prot, shows all the starting cluster combinations that occurred more than once. The
table is sorted on sequence length and has the clusters that appear and the number that are
found for each sequence length. This table contains 274 entries out of the 591 sequences
that begin with clusters of three or more. There are a total of 2891 sequences in this
dataset. When a sequence begins with a stabilizing cluster, the amino acids that appear at
the beginning of those clusters most often are Leu occurring 46%, Ile occurs 19% and
Val 13.5 %.

93
Len Cluster Num Len Cluster Num Len Cluster Num Len Cluster Num12 ILIL 5 13 FYF 2 15 ILV 2 25 YLI 312 ILL 6 13 ILILL 3 15 VLL 3 26 LLL 412 ILLL 4 13 ILL 4 16 ILI 4 27 ILILL 512 IVLVLL 2 13 ILVLIM 2 16 LLI 2 27 ILVLL 212 LFL 2 13 LLFYFL 2 16 LVL 4 27 LLVLL 812 LIL 4 13 LLI 2 16 LVLLLL 2 27 VLVLF 212 LILL 2 13 LLL 4 17 LLI 2 28 ILVLL 212 LIV 2 13 LLLL 2 18 LLL 7 32 LVL 212 LIVVL 2 13 LLV 3 19 ILL 2 34 FILILL 412 LLFV 6 13 MVL 2 19 ILLV 2 42 MLL 512 LLI 3 13 VLI 2 19 LLVL 2 86 MMFVL 312 LLILL 3 13 VLILL 2 19 VLL 2 87 MMFVL 312 LLL 7 13 VLILLV 2 20 FLL 2 95 MMF 212 LLLL 6 13 VLL 2 20 MLL 412 LLLM 2 13 VLLL 2 21 LLILL 312 LLLY 2 13 VLV 2 21 LLL 212 LLM 3 14 FILILV 2 21 MMF 612 LLMLL 2 14 FLIV 3 22 LLL 412 LLV 3 14 IFILM 2 22 LML 212 LLVL 2 14 LFLL 2 22 VLIL 212 LML 3 14 LIL 2 23 LIVL 212 LVL 5 14 LLL 2 24 ILLI 412 LYL 2 14 LVLVLL 2 24 LVL 212 LYV 3 14 VLL 212 MIMM 2 14 VLV 212 VLFL 2 14 YILILL 412 VLI 3 14 YILL 312 VLL 212 VLLL 212 VVL 312 YLIY 3
98 64 67 45
Table 4-22 Cluster Amino Acids Swiss-Prot
The SPTR database results are shown in Table 4-23, Cluster Amino Acids SPTR,
which lists the number of times the different cluster combinations occur as long as it
appears over 15 times.

94
Len Seq Num Len Seq Num Len Seq Num Len Seq Num12 FII 23 12 LFV 24 12 MFL 20 13 FLL 2712 FIL 21 12 LFY 26 12 MII 17 13 FLV 1612 FLF 17 12 LIF 43 12 MIL 34 13 III 2812 FLI 31 12 LII 64 12 MLI 26 13 IIL 1912 FLL 42 12 LIL 114 12 MLL 40 13 ILF 2612 FLV 16 12 LILL 21 12 MVII 20 13 ILI 4112 FLY 20 12 LIM 21 12 MVL 30 13 ILL 2712 FVL 18 12 LIV 71 12 VFL 17 13 ILV 1712 IFL 19 12 LIY 17 12 VII 31 13 IVF 2212 IFLFML 37 12 LLF 75 12 VIL 40 13 LFL 1912 IFLL 16 12 LLFL 16 12 VIV 27 13 LIF 1712 IFLLMV 25 12 LLI 126 12 VLF 31 13 LII 3212 III 92 12 LLIL 26 12 VLI 69 13 LIL 3012 IIL 61 12 LLIV 20 12 VLIL 17 13 LIMII 1612 IILL 25 12 LLL 192 12 VLL 83 13 LIV 1612 IIV 37 12 LLLI 23 12 VLLL 17 13 LLF 8012 IIY 17 12 LLLL 47 12 VLM 30 13 LLI 3312 ILF 107 12 LLLLL 18 12 VLV 40 13 LLL 4812 ILI 91 12 LLLV 25 12 VVF 19 13 LLLL 2212 ILIL 16 12 LLM 50 12 VVL 34 13 LLV 4212 ILL 130 12 LLMIM 23 12 YFM 21 13 LLY 1712 ILLL 21 12 LLML 25 12 YIL 24 13 LVI 1612 ILV 48 12 LLV 72 12 YLI 17 13 LVL 3412 ILY 18 12 LLVL 20 13 LVV 2112 IMI 28 12 LLY 33 13 MLF 2112 IVF 22 12 LMI 37 13 VIL 1812 IVI 20 12 LML 51 13 VLI 3312 IVL 33 12 LMV 16 13 VLL 3812 IVLL 17 12 LVF 27 13 VLLIML 1612 IVV 27 12 LVI 34 13 YLMYLL 2112 IYL 16 12 LVL 122 14 IIL 1612 LFF 23 12 LVLY 18 14 ILL 1612 LFI 32 12 LVV 37 14 LILV 2012 LFL 74 12 LVY 22 16 VLL 2112 LFLL 32 12 LYL 25 22 YFL 18
1272 1581 3557 904
Table 4-23 Cluster Amino Acids SPTR
When a sequence begins with a stabilizing cluster, the amino acids that appear at
the beginning of those clusters most often are Leu occurring 49.5%, Ile occurring 25%

95
and Val 13 %. This is a similar rate at which the Swiss-Prot clusters began. The SPTR
analysis is based on the 4461 clusters found out of the 18527 clusters found in all the
sequences. There are a total of 67358 sequences in the SPTR dataset.
These data show that between 30 and 40% of the sequences used in this analysis
do start with a stabilizing cluster. When a sequence does begin with a stabilizing cluster,
those clusters have a 90% chance of beginning with either Leu, Ile, of Val. This may be a
broad marker that signifies the beginning of a coiled sequence. But the definition offered
by Stable Coil may be too broad. Since the Stable Coil is using a windowing algorithm to
define the coiled region, it my not define the starting and ending point of the coil well
enough to define a starting stabilizing cluster.
Summary of Findings
In this chapter, an analysis of the hydrophobic core of the coiled regions in coiled
coil sequences was preformed. The hydrophobic core of the sequences was first
characterized to find which amino acids were present and how often they occurred. This
was followed by an analysis of clusters of hydrophobic amino acids that are found in the
hydrophobic core of adjacent heptads. The important findings are listed below.
∞ Hydrophobic amino acids occupy the hydrophobic ‘a’ and ‘d’ core positions on
average 65% for the Swiss-Prot dataset and 67% for the SPTR dataset.
∞ The number of hydrophobic clusters decreases by a factor of 2 for each
hydrophobic core position added to the sequence length.
96
∞ The number of non-hydrophobic clusters decreases by a factor of 8 as the each
hydrophobic core position added to the sequence length.
∞ Ala is the most likely non-hydrophobic amino acid to appear in the hydrophobic
core in both the Swiss-Prot and SPTR datasets.
∞ The ratio of hydrophobic clusters to non-hydrophobic clusters is .6 to .8 for
sequences from 6 heptads to 22 heptads in length.
∞ Cluster frequency decreases sharply for sequences 6 heptads to 9 heptads in
length.
∞ In both the Swiss-Prot and SPTR datasets Leu is favored in the ‘d’ hydrophobic
core position and Val and Ile is favored in the ‘a’ hydrophobic core position.
∞ Stabilizing Clusters are found in 39% of the of the SPTR sequences and 33% of
the Swiss-Prot sequences.

97
Chapter 5
CHAPTER 5
CONCLUSION
This thesis would not have been possible without the direct support and guidance
from Dr. Robert Hodges and Dr. Brian Tripet of the UCHSC and their research on coiled-
coils. Their willingness to help was far beyond anything expected.
Coiled-coil protein domain research has lead to better understanding of this
structure domain in kinesin, myosin, and more recently the SARS virus. Biologists’
ability to create experiments and interpret experimental rapidly will only benefit this
research. However, if insight into the experiment can be gained prior to the lengthy
experiment, time and resources can be saved. In this thesis, the Stable Input program was
written to give biologists at the UCHSC the ability to determine the relative stability of
the coiled-coil protein domain. This program has the capacity to incorporate 6 different
stability factors which produces output that is easily interpreted and portable to other
platforms. The most important aspect of this work is the research biologists now have the
ability to create theoretical protein sequences and draw initial stability conclusions at the
click of a button.

98
In addition to the Stable Input tool, the coiled-coil hydrophobic clustering theory
was explored and quantified. Kwok showed that clustering of hydrophobic amino acids in
the hydrophobic core of consecutive heptad leads to greater stability in the overall coiled-
coil. In an attempt to provide more information about clusters in nature, an exhaustive
search was initiated to quantify clusters in the Swiss-Prot database. This research has
lead to a better understanding to which amino acids frequent the hydrophobic core in
clustered regions.
The analysis between the Swiss-Prot annotated coiled-coils to the protein database
as a whole could be improved by using different coiled-coil prediction algorithms. To
perform this task a method needed to be found that would determine where in the
sequence a coiled-coil might be located and at which heptad registry offset they begin.
This was done using the Stable Coil algorithm because, first, it is used was based on the
experimentally determine stability and helical propensity values and not statistics and
second, both datasets were primarily analyzed using the criteria. The problem with this
approach is in the way the windowing function in Stable Coil may include many more
heptads at the beginning and end of each sequence. Once the windowing function
evaluated the first and last 42 positions they were not evaluated as strictly as the
intermediate positions. This may overestimate the starting and ending point of the
suspected coils. The evaluation of the stabilizing cluster shows in this analysis that the
coils selected showed it missing in over 70% of the time. The true remedy to this problem
is to define with greater precision the starting heptads of a coiled-coil. It seemed apparent
from this analysis that treating the starting and ending heptads of a coiled-coil my not be
the best approach.

99
In future analysis a more selective coiled-coil prediction method could be used to
better identify the coiled-coil regions thereby eliminating the start heptad and end heptad
problem. However, the same problem may arise when attempting to determine the heptad
registry. One suggestion would be to used that ‘a’ and ‘d’ positioned amino acids found
in this analysis to a help determine the offset value. An algorithm that would continue to
move the heptad offset until the strongest correlation between the ‘a’ and ‘d’ position and
the presence of the hydrophobic amino acids is found.
Another possible improvement to this thesis and to truly gain an appreciation of
the variety of cluster combinations, a relational database could be created. The data
shown in the tables have been distilled to the point where only the most repetitive
sequences are displayed. A database could allow for absolute queries if particular
sequences are found to be interesting.
100
GLOSSARY
Alpha helix: a repetitive secondary structure that gets its name because the relationshipof one amino acid to the next is the same. See Figure 1-3
Beta strand: an amino acid string that does not form a coil. It zigzags in a more extendedway than a helix. See Figure 1-4.
Coiled-coil: a tertiary oligomerization domain that is formed when two or more _-helices wrap around each other in a left-handed super coil
Heptad: the specific repeated 7 positions a, b, c, d, e, f, g that identifies the sevenpositions that characterize the coiled-coil sequences.
Hydrophobic amino acids: for the purpose of this analysis, the amino acids Phe, Ile,Leu, Met, Val, and Tyr. Some references do not include Tyr among the hydrophobicamino acids. A complete list of amino acids can be found in Tables1-2 through 1-5
Hydrophobic cluster: a sequence of 3 or more consecutive hydrophobic core positionsthat have hydrophobic amino acids in them.
Hydrophobic core: the ‘a’ and ‘d’ heptad position in a coiled coil.
Kinesin: Similar to myosin, a family of microtubule-associated motor proteins.
Myosin: a mechanoenzyme protein that supports the movement of cellular componentswith a characteristic actin binding domain head, a neck and tail.
Non-hydrophobic cluster: a sequence of 2 or more consecutive hydrophobic corepositions that have non-hydrophobic amino acids in them
Oligomer: A polymer that consists of two, three, or four monomers.
Oligomerization: The process of converting a monomer or a mixture of monomers intoan oligomer.
SPTR dataset: this is that data that was derived from the entire Swiss-Prot and TrEMBLdatabase.
Swiss-Prot dataset: the dataset used in the analysis that came from the Swiss-Protannotated
Tropomyosin: is a long, rod-like molecule, similar to myosin, that fits in the groove ofthe actin helix

101
BIBLIOGRAPHY
[Anfinsen 1973] Anfinsen, C. (1973) Science 181, 223–230.
[Baldi 2000] Baldi, P., and Pollastri, G., Andersen, C., and Brunak, S. (2000). Proteinbeta-Sheet Partner Prediction by Neural Networks. Department of Information andComputer Science, University of California Irvine.
[Becker 2000] Becker W., Kleinsmith, L., Hardin, J. Chapter 3 in ”The World of theCell-4th ED”, The Benjamin/Cummings Publishing Company 2000[p 49-51]
[Becker 2000a] Becker W., Kleinsmith, L., Hardin, J. Chapter 3 in ”The World of theCell-4th ED”, The Benjamin/Cummings Publishing Company 2000[p51-55]
[Becker 2000b] Becker W., Kleinsmith, L., Hardin, J. Chapter 19 in ”The World of theCell-4th ED”, The Benjamin/Cummings Publishing Company 2000[p634-645]
[Becker 2000c] Becker W., Kleinsmith, L., Hardin, J. Chapter 12 in ”The World of theCell-4th ED”, The Benjamin/Cummings Publishing Company 2000[p341-342]
[Bornberg 1996] Bornberg, E., Rivals, E, and Vingron, M. (1996). Computationalapproaches to identify leucine zippers. Nucleic Acids Research, Vol. 26, 2740-2746.
[Brook 2003] Principles of Protein Structure Using the Internet; Brookhaven PDBMariusz Jaskólski & Janusz Kazmarek, Center for Biocrystallographic Research, Poznan;and Clare Sansom, Heiko Schinke, Martin-Luther-University, Dept. ofBiochemistry/Biotechnology, Halle; www.cryst.bbk.ac.uk/PPS2
[ Chakrabarty 2002] Chakrabarty, T., Xiao, M., Cooke, R., and Selvin, P. Holding TwoHeads together: Stability of the myosin II rod measured by resonance energy transferbetween the heads. PNAS April 30 2002 Vol. 99 No 9 pp6011-6016.
[Chou 1974] Chou, P., and Fasman, G. (1974). Conformational Parameters for AminoAcids in Helical, _-Sheets, and Random Coil Regions Calculated from Proteins.BioChemistry, Vol 13 No. 2 222-245
102
[Crick 1970] Crick, F., Central Dogma of Molecular Biology. Nature , Vol. 227, pp. 561-563 (August 8, 1970)
[EBI 2003]. European Bioinformatics Institute.http://www.ebi.ac.uk/Information/index.html
[EXP 2003] ExPASy Molecular Biology Server. http://us.expasy.org/
[Garnier 1978] Garnier, Osguthorpe and Robson (1978).Analysis of the Accuracy andImplications of Simple Methods for Predicting the Secondary Structure of GlobularProteins. J Mol Biol. Mar; Vol. 120, 97-120.
[ Gromiha 2002] Gromiha, M., Oobatake, M., Kono, H., Uedaira, H., Sarai, A (2002).Importance of mutant position in Ramachandran plot for predicting protein stability ofsurface mutations. Biopolymers. Aug 5; Vol. 64(4):210-20.
[Lauzon 2001] Lauzon, A., Fagnant, P., Warshaw, D., and Trybus, K. (2001). Coiled CoilUnwinding at the Smooth Muscle Myosin Head Rod junction is required for optimalmechanical Performance. Biophysical Journal Vol. 80 April 2001 pp1900-1904
[Lesk 2002] Arthur M. Lesk, “Introduction to Bioinformatic.” New York, NY:OxfordPress 2002
[Kwok 2003]Kwok, S., Hodges, R.(2003). Hydrophobic Clusters Affect Protein Stability.Dept. of Biochemistry and Molecular Genetics, Univ. of Colorado Health SciencesCenter, Denver, Co and Dept. of Biochemistry, Univ. of Alberta, Edmonton, AB.
[NCBI 2003] National Center for Biotechnology Information.http://www.ncbi.nlm.nih.gov/Sitemap/samplerecord.html
[OCGC 2003] Ontario Centre for Genomic Computinghttp://ocgc.ca/databases/genpept.html
[SCP 2003] Stable Coil; Pence The Canadian Protein Engineering Network.http://biomol.uchsc.edu/researchFacilities/ComputationalCore/stablecoil/
[SI 2003] Stable Input http://dirac.uccs.edu/~dcbrinkm/thesis/stable_input.html
[SIB 2003] Swiss-Prot Protein knowledgebase TrEMBL Computer-annotatedsupplement to Swiss-Prot. http://us.expasy.org/sprot/
[SPTR 2003] SPTR database is found at the web site:http://www.hgmp.mrc.ac.uk/Bioinformatics/Databases/sptr-help.html

103
[SWPR 2003] Swiss-Prot Protein Knowledgebase User Manual, Release 41.20 of 16-Aug-2003; Amos Bairoch Swiss Institute of Bioinformatics (SIB) Centre MedicalUniversitaire
[Thormahlen 1998] Thormahlen, M.,Marx A., and Mandelkow, E. (1998).The coiled-coilhelix in the neck of Kinesin. Journal of structural Biology Vol. 122, 30-41
[TRI 2003] Tripet, B. University of Colorado Health Sciences Center
[TRI2 2003] Coiled-coil Presentation 2003. Tripet, B. University of Colorado HealthSciences Center
[Tripet 1997] Tripet, B., Vale, R., Hodges, R (1997). Demostration of Coiled-coilinteraction within the Kinesin Neck Region using synthetic peptides; Journal ofBiological Chemistry. Vol 272, No.14 Issue of April 4, pp. 8946-8956.
[Tripet 1998] Tripet, B., Wagschal, K., Lavigne, P., Mant, C., Hodges, R.(1998). The roleof postion a in determining the stability and oligomerization state of _-helical coiled-coils: 20 amino acid stability coefficients in the hydrophobic core of proteins. ProteinSciences Vol. 8, 2312-2329.
[Tripet 2000] Tripet, B., Wagschal, K., Lavigne, P., Mant, C., Hodges, R. Effects of SideChain Characteristics on Stability and Oligomerization State of a de Novo-designedModel Coiled-coil: 20 Amino Acid Substitutions in Position “d”. Journal of MolecularBiology (2000) Vol. 300, p377-402
[UWK 2003] University of western Kentucky Biotechnology Centerhttp://bioweb.wku.edu/courses/biol22000/3AAprotein/Fig.html
[UOFG 2003 ] University of Guelph Chemistry Chem730.http://www.chembio.uoguelph.ca/educmat/chm730.
[Wagschal 1999] Wagschal, K.,Tripet,B.,Lavigne,P., Mant, C. & Hodges R., (1999). Therole of position a in determining the stability and oligomerization state of alpha-helicalcoiled coils: 20 amino acid stability coefficients in the hydrophobic core of proteins.Protein Sci Vol 8, 2312-2329
[Zhou 1994] Zhou, N.E., Monera, O, Kay C. & Hodges, R. (1994) alpha-helicalpropensities of amino acids in the hydrophobic face of an amphipathis alpha-helix.Protein and Pretide Letters, 1, 114-119.

104
APPENDIX A STABLE INPUT GUI

105

106
APPENDIX B TABULATED OUTPUT