Embed Size (px)
Citation preview

Running Head: Cognitive strategies for hierarchical visual search
Cognitive strategies for the visual search
of hierarchical computer displays
Anthony J. HornofDepartment of Computer and Information Science
University of Oregon
Email addresses:[email protected]
Mailing address and phone number:Department of Computer and Information Science
1202 University of OregonEugene, Oregon 97403-1202
(541)346-1372
Accepted to the journalHuman-Computer Interaction
on August 7, 2003
Initial submission: July 20, 2002Revised submission: July 9, 2003
Word count: 13,100
© 2003 Anthony J. Hornof. All Rights Reserved.

ABSTRACT
This article investigates the cognitive strategies that people use to search computer displays. Several different visual layouts are examined: unlabeled layouts that contain multiple groups of items but no group headings; labeled layouts in which items are grouped and each group has a useful heading; and a target-only layout that contains just one item.
A number of plausible strategies were proposed for each layout. Each strategy was programmed into the EPIC cognitive architecture, producing models that simulate the human visual-perceptual, oculomotor, and cognitive processing required for the task. The models generate search time predictions. For unlabeled layouts, the mean layout search times are predicted by a purely random search strategy, and the more detailed positional search times are predicted by a noisy systematic strategy. The labeled layout search times are predicted by a hierarchical strategy in which first the group labels are systematically searched, and then the contents of the target group. The target-only layout search times are predicted by a strategy in which the eyes move directly to the sudden appearance of the target.
The models demonstrate that human visual search performance can be explained largely in terms of the cognitive strategy that is used to coordinate the relevant perceptual and motor processes; a clear and useful visual hierarchy triggers a fundamentally different visual search strategy and effectively gives the user greater control over the visual navigation; and cognitive strategies will be an important component of a predictive visual search tool. The models provide insights pertaining to the visual-perceptual and oculomotor processes involved in visual search, and contribute to the science base needed for predictive interface analysis.
2
CONTENTS
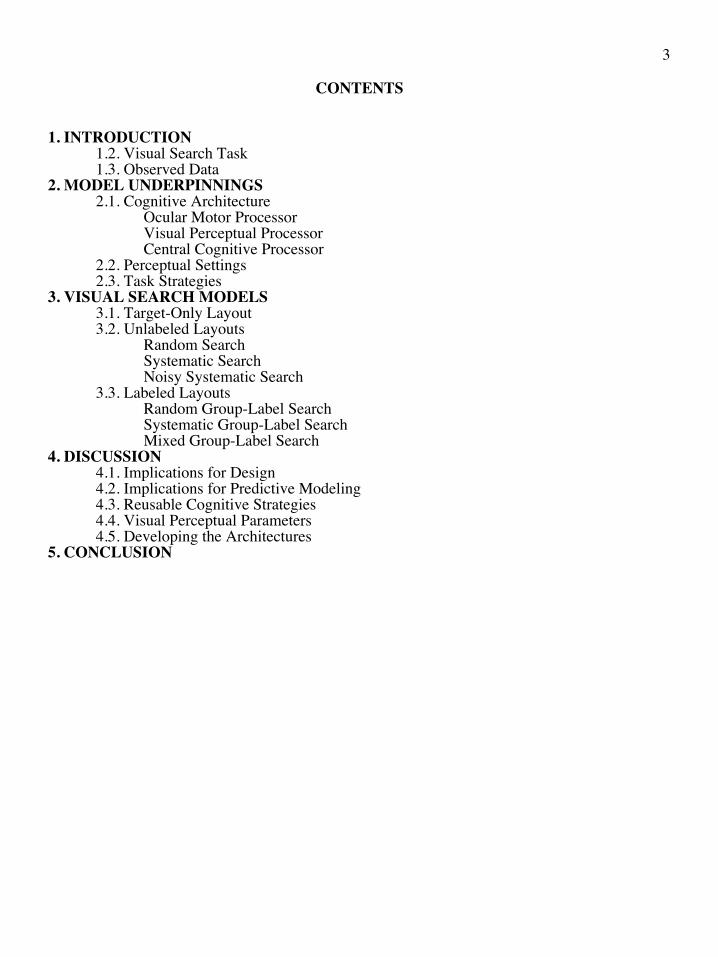
1. INTRODUCTION1.2. Visual Search Task1.3. Observed Data
2. MODEL UNDERPINNINGS2.1. Cognitive Architecture
Ocular Motor ProcessorVisual Perceptual ProcessorCentral Cognitive Processor
2.2. Perceptual Settings2.3. Task Strategies
3. VISUAL SEARCH MODELS3.1. Target-Only Layout3.2. Unlabeled Layouts
Random SearchSystematic SearchNoisy Systematic Search
3.3. Labeled LayoutsRandom Group-Label SearchSystematic Group-Label SearchMixed Group-Label Search
4. DISCUSSION4.1. Implications for Design4.2. Implications for Predictive Modeling4.3. Reusable Cognitive Strategies4.4. Visual Perceptual Parameters4.5. Developing the Architectures
5. CONCLUSION
3

1. INTRODUCTION
Cognitive models are computer programs that behave in some way like humans (John, 1998). In the context of this article, and in most cognitive modeling in human-computer interaction (HCI), the models simulate the perceptual, cognitive, and motor processes that people use to accomplish a task, and predict the time required for the task. Cognitive modeling is useful to the field of HCI because it reveals patterns of behavior at a level of detail not otherwise available to analysts and designers (Gray, John & Atwood, 1993). The ultimate promise for cognitive modeling in HCI is that it provides the science base needed for predictive analysis tools and methodologies (Card, Moran & Newell, 1983).
There are two phases of cognitive modeling: (1) exploratory and (2) predictive. In the trajectory of scientific development, exploratory modeling must precede predictive modeling. In the exploratory mode, models are constructed to explain empirical data that have already been collected and analyzed. In the predictive (or confirmatory) mode, models are constructed to make a priori predictions of user performance; that is, predictions before human data have been collected. In both phases, the output from the model is referred to as a “prediction” even though in exploratory modeling it is really a post-diction.
Accurate high-fidelity a priori predictive models of visual search tasks are not currently attainable on a routine basis. Computational cognitive modeling of visual search is currently in an exploratory mode. This paper presents exploratory cognitive models of the visual search of hierarchical computer screen layouts, and contributes to the science base needed for predictive models.
This article has two main goals: (1) Explain the perceptual, cognitive, and motor processing that people use to search hierarchical visual layouts on a computer screen. The explanations should be useful to interface designers outside of the context of cognitive modeling. (2) Provide guidance and insight, including details of the cognitive strategies and perceptual-motor parameters that are appropriate and not appropriate, for building future predictive models of visual search.
The bracketing heuristic (Gray & Boehm-Davis, 2000; Kieras & Meyer, 2000) guides the construction of the models in this article. Following this approach, a slowest-reasonable--an upper bracket--and a fastest-reasonable model--a lower bracket--are identified early in the development of the models. It is expected that human performance will fall in between the two brackets, and that the observed performance will vary based on motivation and task demands. A final good-fitting model is developed by integrating aspects of the slowest- and fastest-reasonable models. Bracketing allows the analyst to examine the plausibility of model parameters early in the process, and provides guidance for closing in on the observed human data.
Visual search has been studied at great length, and many models have been constructed. See Brogan (1993) for an extensive collection of work and Wolfe (1998) for an extensive review. But there is relatively little work that integrates the perceptual, cognitive, and motor processes involved in visual search tasks using a computational framework. Individual instances of such work includes Byrne (2001), Ehret (2002), and Hornof and Kieras (1997). This article
4
contributes to the growing body of integrative computational and psychological models of visual search.
1.2. Visual Search Task
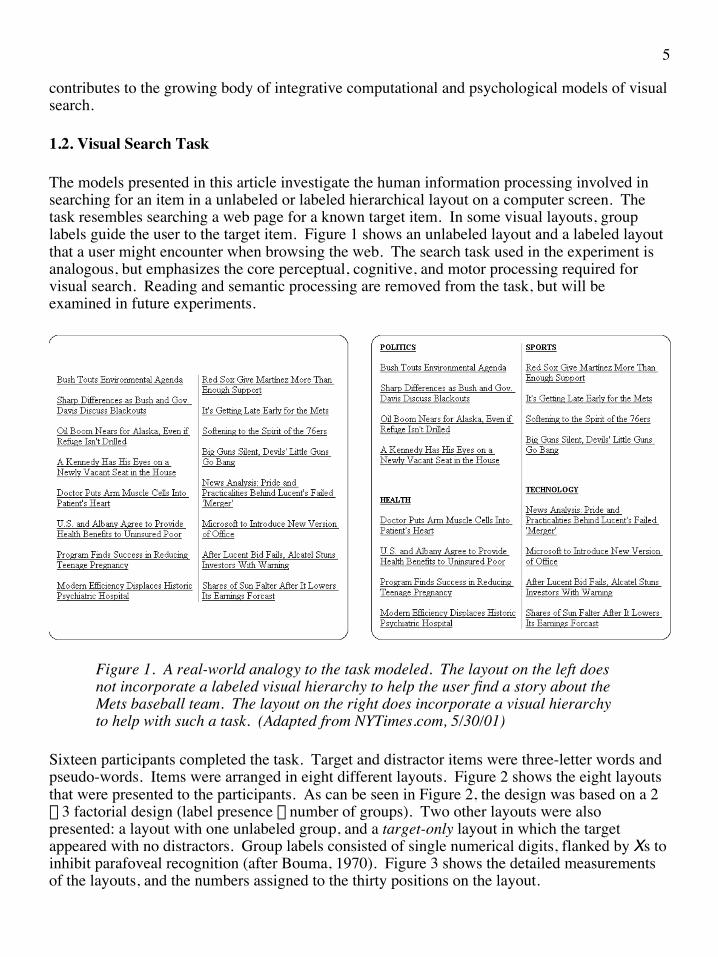
The models presented in this article investigate the human information processing involved in searching for an item in a unlabeled or labeled hierarchical layout on a computer screen. The task resembles searching a web page for a known target item. In some visual layouts, group labels guide the user to the target item. Figure 1 shows an unlabeled layout and a labeled layout that a user might encounter when browsing the web. The search task used in the experiment is analogous, but emphasizes the core perceptual, cognitive, and motor processing required for visual search. Reading and semantic processing are removed from the task, but will be examined in future experiments.
Figure 1. A real-world analogy to the task modeled. The layout on the left does not incorporate a labeled visual hierarchy to help the user find a story about the Mets baseball team. The layout on the right does incorporate a visual hierarchy to help with such a task. (Adapted from NYTimes.com, 5/30/01)
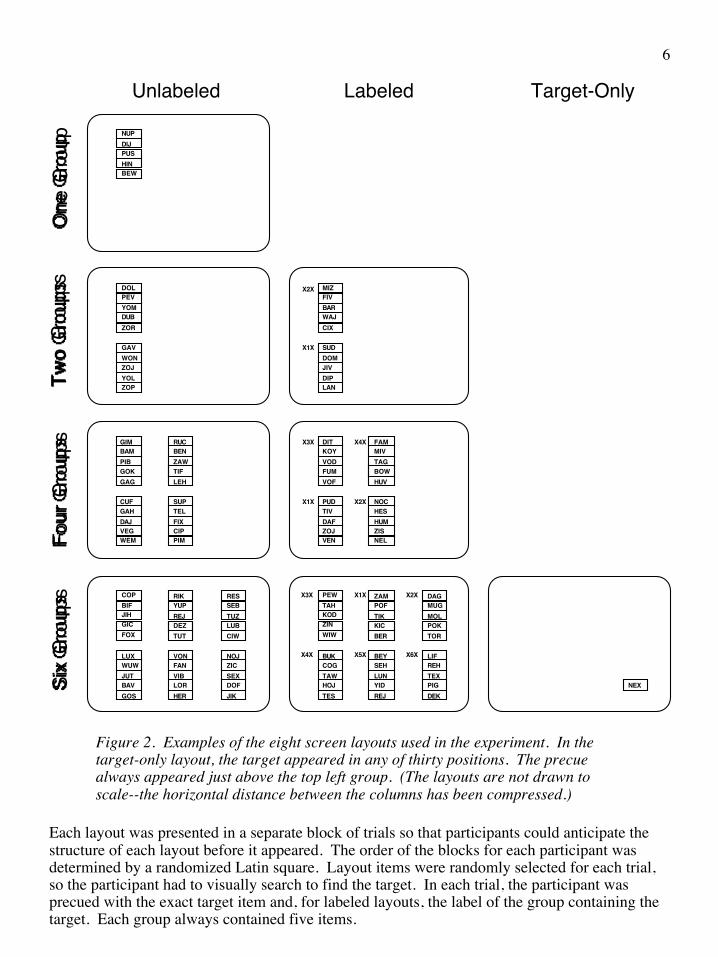
Sixteen participants completed the task. Target and distractor items were three-letter words and pseudo-words. Items were arranged in eight different layouts. Figure 2 shows the eight layouts that were presented to the participants. As can be seen in Figure 2, the design was based on a 2 ¥ 3 factorial design (label presence ¥ number of groups). Two other layouts were also presented: a layout with one unlabeled group, and a target-only layout in which the target appeared with no distractors. Group labels consisted of single numerical digits, flanked by Xs to inhibit parafoveal recognition (after Bouma, 1970). Figure 3 shows the detailed measurements of the layouts, and the numbers assigned to the thirty positions on the layout.
5
NUPDIJPUSHINBEW
MIZFIVBARWAJCIX
SUDDOMJIVDIPLAN
X2X
X1X
DOLPEVYOMDUBZOR
GAVWONZOJYOLZOP
DITKOYVODFUMVOF
PUDTIVDAFZOJVEN
FAMMIVTAG
HUV
NOCHESHUMZISNEL
BOW
X3X
X1X
X4X
X2X
GIMBAMPIBGOKGAG
CUFGAHDAJVEGWEM
RUCBENZAWTIFLEH
SUPTELFIXCIPPIM
PEWTAHKODZINWIW
BUKCOGTAWHOJTES
ZAMPOFTIKKICBER
BEYSEHLUNYIDREJ
DAGMUGMOLPOKTOR
LIFREHTEXPIGDEK
X3X
X4X
X1X
X5X
X2X
X6X
COPBIFJIHGICFOX
LUXWUWJUTBAVGOS
RIKYUPREJDEZTUT
VONFANVIBLORHER
RESSEBTUZLUBCIW
NOJZICSEXDOFJIK
LabeledUnlabeled Target-OnlyO
ne G
roup
Two
Gro
ups
Four
Gro
ups
Six
Gro
ups
NEX
Figure 2. Examples of the eight screen layouts used in the experiment. In the target-only layout, the target appeared in any of thirty positions. The precue always appeared just above the top left group. (The layouts are not drawn to scale--the horizontal distance between the columns has been compressed.)
Each layout was presented in a separate block of trials so that participants could anticipate the structure of each layout before it appeared. The order of the blocks for each participant was determined by a randomized Latin square. Layout items were randomly selected for each trial, so the participant had to visually search to find the target. In each trial, the participant was precued with the exact target item and, for labeled layouts, the label of the group containing the target. Each group always contained five items.
6

Group labels
1
2
3
4
5
6
7
8
9
10
11
12
13
14
15
16
17
18
19
20
21
22
23
24
25
26
27
28
29
30
Precue(disappearswhen layoutappears)
2° of visual angle at 56 cm
Figure 3. A sample layout with six labeled groups, drawn to scale and annotated with the number of each target position. The precue is X5X REJ. The target is in position 20, in the group labeled X5X. Two degrees of visual angle at a distance of 56 cm are shown.
Each trial proceeds as follows: The participant studies the precue and clicks on the precue; the precue disappears and the layout appears; the participant finds the target, moves the mouse to the target, and clicks on the target; the layout disappears and the next precue appears. Participants were financially motivated to perform each trial as quickly as possible while maintaining a very low error rate.
There were sixteen participants, eight women and eight men, ranging from twenty-two to fifty-one years of age, with a mean age of thirty-eight years. Ten participants were recruited from a church in Ann Arbor, Michigan. Six were graduate students and support staff at the University of Michigan. All participants were experienced computer users and had no apparent visual or motor impairments.
Search time was separated from pointing-and-clicking time (hereafter referred to simply as pointing time) by means of a “point-completion deadline” (Hornof, 2001). Participants were instructed to not move the mouse until they found the target. Once they started to move the mouse, they had a small amount of time to click on the target. The deadline was determined using Fitts’ law (see Card et al., 1983), but with slightly increased a and b parameters. If the participant did not click on the target in time, the trial was interrupted and the participant lost a small amount of bonus pay. The start of the mouse movement thus separated the search time from the pointing time, and these two times were recorded separately.
1.3. Observed Data
Based on a consistently low interruption rates, averaging 1.9% across all participants, it appears as if the point-completion deadline successfully motivated participants to wait until they found the target before starting to move their mouse. Search time was thus measured from the appearance of the layout to when the participant started moving the mouse.
7
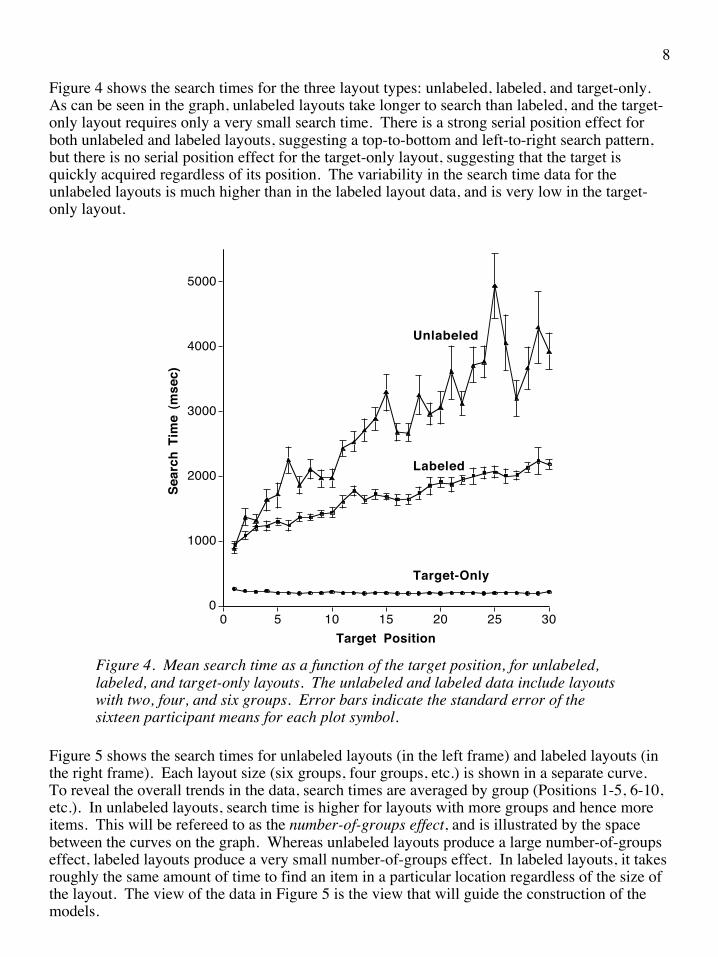
Figure 4 shows the search times for the three layout types: unlabeled, labeled, and target-only. As can be seen in the graph, unlabeled layouts take longer to search than labeled, and the target-only layout requires only a very small search time. There is a strong serial position effect for both unlabeled and labeled layouts, suggesting a top-to-bottom and left-to-right search pattern, but there is no serial position effect for the target-only layout, suggesting that the target is quickly acquired regardless of its position. The variability in the search time data for the unlabeled layouts is much higher than in the labeled layout data, and is very low in the target-only layout.
0
1000
2000
3000
4000
5000
Sear
ch T
ime
(mse
c)
0 5 10 15 20 25 30Target Position
Unlabeled
Labeled
Target-Only
Figure 4. Mean search time as a function of the target position, for unlabeled, labeled, and target-only layouts. The unlabeled and labeled data include layouts with two, four, and six groups. Error bars indicate the standard error of the sixteen participant means for each plot symbol.
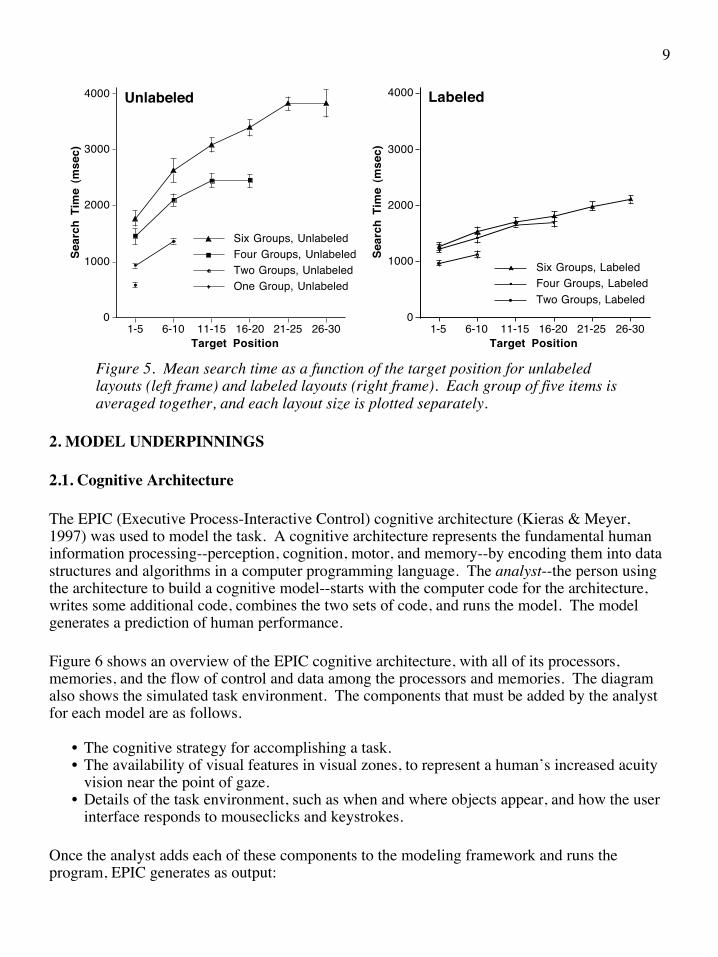
Figure 5 shows the search times for unlabeled layouts (in the left frame) and labeled layouts (in the right frame). Each layout size (six groups, four groups, etc.) is shown in a separate curve. To reveal the overall trends in the data, search times are averaged by group (Positions 1-5, 6-10, etc.). In unlabeled layouts, search time is higher for layouts with more groups and hence more items. This will be refereed to as the number-of-groups effect, and is illustrated by the space between the curves on the graph. Whereas unlabeled layouts produce a large number-of-groups effect, labeled layouts produce a very small number-of-groups effect. In labeled layouts, it takes roughly the same amount of time to find an item in a particular location regardless of the size of the layout. The view of the data in Figure 5 is the view that will guide the construction of the models.
8
0
1000
2000
3000
4000Se
arch
Tim
e (m
sec)
1-5 6-10 11-15 16-20 21-25 26-30Target Position
Unlabeled
One Group, UnlabeledTwo Groups, UnlabeledFour Groups, UnlabeledSix Groups, Unlabeled
0
1000
2000
3000
4000
Sear
ch T
ime
(mse
c)
1-5 6-10 11-15 16-20 21-25 26-30Target Position
Labeled
Two Groups, LabeledFour Groups, LabeledSix Groups, Labeled
Figure 5. Mean search time as a function of the target position for unlabeled layouts (left frame) and labeled layouts (right frame). Each group of five items is averaged together, and each layout size is plotted separately.
2. MODEL UNDERPINNINGS
2.1. Cognitive Architecture
The EPIC (Executive Process-Interactive Control) cognitive architecture (Kieras & Meyer, 1997) was used to model the task. A cognitive architecture represents the fundamental human information processing--perception, cognition, motor, and memory--by encoding them into data structures and algorithms in a computer programming language. The analyst--the person using the architecture to build a cognitive model--starts with the computer code for the architecture, writes some additional code, combines the two sets of code, and runs the model. The model generates a prediction of human performance.
Figure 6 shows an overview of the EPIC cognitive architecture, with all of its processors, memories, and the flow of control and data among the processors and memories. The diagram also shows the simulated task environment. The components that must be added by the analyst for each model are as follows.
• The cognitive strategy for accomplishing a task.• The availability of visual features in visual zones, to represent a human’s increased acuity
vision near the point of gaze.• Details of the task environment, such as when and where objects appear, and how the user
interface responds to mouseclicks and keystrokes.
Once the analyst adds each of these components to the modeling framework and runs the program, EPIC generates as output:
9
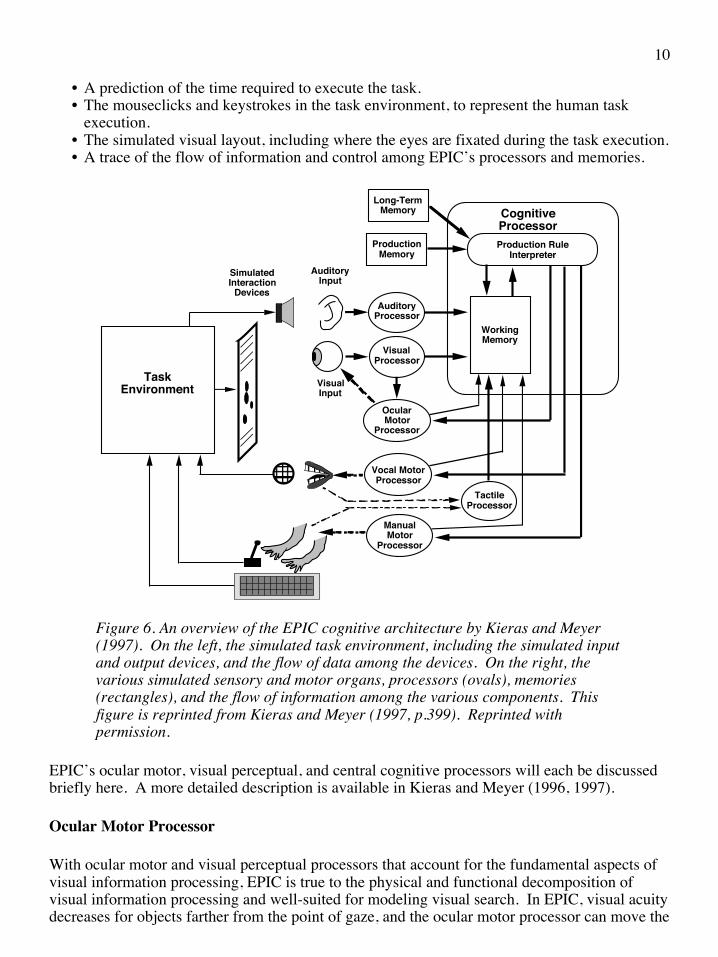
• A prediction of the time required to execute the task.• The mouseclicks and keystrokes in the task environment, to represent the human task
execution.• The simulated visual layout, including where the eyes are fixated during the task execution.• A trace of the flow of information and control among EPIC’s processors and memories.
Task Environment
Cognitive Processor
WorkingMemory
Production RuleInterpreter
Vocal MotorProcessor
VisualInput
AuditoryInput
Long-TermMemory
Ocular Motor
Processor
AuditoryProcessor
VisualProcessor
Production Memory
TactileProcessor
Manual Motor
Processor
Simulated Interaction
Devices
Figure 6. An overview of the EPIC cognitive architecture by Kieras and Meyer (1997). On the left, the simulated task environment, including the simulated input and output devices, and the flow of data among the devices. On the right, the various simulated sensory and motor organs, processors (ovals), memories (rectangles), and the flow of information among the various components. This figure is reprinted from Kieras and Meyer (1997, p.399). Reprinted with permission.
EPIC’s ocular motor, visual perceptual, and central cognitive processors will each be discussed briefly here. A more detailed description is available in Kieras and Meyer (1996, 1997).
Ocular Motor Processor
With ocular motor and visual perceptual processors that account for the fundamental aspects of visual information processing, EPIC is true to the physical and functional decomposition of visual information processing and well-suited for modeling visual search. In EPIC, visual acuity decreases for objects farther from the point of gaze, and the ocular motor processor can move the
10

eyes to get different parts of the world into high resolution vision.
EPIC does not commit itself to attentional-spotlight explanations at the architectural level because it is not clear whether such phenomena result from invariant aspects of the human architecture or are an artifact of a particular set of task strategies. Furthermore it appears that “when the eyes are free to move, no additional covert attentional scanning occurs” (Findlay & Gilchrist, 1998, p.295). For real world visual search tasks, it may be inappropriate to simulate attentional shifts independent of eye movements.
The ocular motor processor moves the gaze to objects in the environment as commanded by the executing strategy. Time is required to both prepare and execute an eye movement. In the models discussed here, all eye movements are saccades, which are rapid and ballistic. The phrases saccade destinations and fixation locations are used interchangeably.
Visual Perceptual Processor
One of the analyst-defined components in an EPIC model is the availability of object properties. These parameters define (a) which properties are available in which zones, and (b) the sensory encoding time required for each property in each zone. Figure 7 shows the retinal zones, which are defined as concentric circles around the center of the gaze. The zones include the bouquet (with a radius of 0.25˚ of visual angle), the fovea (1˚), the parafovea, (7.5˚), and the periphery (60˚).
bouquet fovea
parafovea
periphery
center of gaze
0.25˚1˚
7.5˚60˚
ƒnot in view
Figure 7. The retinal zones defined in EPIC, and typical sizes used in modeling. Sizes are the radii in degrees of visual angle. The visual stimulus “ƒ” appears outside of the bouquet and fovea, but inside of the parafovea and periphery.
The availability of each property is a function of the zone in which the object is located during the current fixation. Thus, there is an availability and delay setting for each property in each zone (bouquet, fovea, parafovea, periphery, and not-in-view). The LOCATION property, for example, is typically available for all objects that are in view, with an encoding delay of 50 ms. The TEXT property is typically available only in the fovea, with an encoding delay of 100 ms. The TEXT of a word appearing in the parafovea can be accessed by executing an eye movement to that object’s LOCATION.
Setting these zones with fixed boundaries is clearly a simplification of human visual processing,
11
but it is a very useful architectural feature. The feature allows the availability of object properties to decrease as the objects appear farther from the center of the gaze. This is a well-documented aspect of human performance that is not present in other cognitive architectures such as Soar (Laird, Rosenbloom & Newell, 1986), ACT-R (Anderson & Lebiere, 1998), and ACT-R/PM (Byrne, 2001). The effect of foveal eccentricity was added to a set of ACT-R models (Salvucci, 2001) but is not currently built into the architecture and has not been used for all ACT-R models of visual search. The effect needs to be incorporated because it will constrain the strategies and ocular motor processing that can be used to explain and predict data.
Central Cognitive Processor
EPIC’s cognitive processor includes a production rule interpreter running PPS (the Parsimonious Production System, Covrigaru & Kieras, 1987), and a working memory (WM). The cognitive processor works as a classic production rule system. Production rules are if-then statements. The if part of each rule is the condition. The then part is the action. The WM maintains the current state of the world. In PPS, the WM is technically referred to as the database (DB) to distinguish it from human WM, but it will be discussed here as the WM.
A component found in most production rule systems but deliberately omitted from PPS is a conflict resolution algorithm. The conflict resolution algorithm is used to decide which rule will fire when more than one rule’s conditions are satisfied by the current contents of WM. This gives EPIC its capability of firing multiple production rules in parallel. The analyst is responsible for writing PRs that do not conflict with each other.
The PPS production rule interpreter is multi-match and multi-fire. Every 50 ms, every rule is compared in parallel against the current contents of WM. All rules with conditions satisfied by the contents of working memory fire in the same cycle. This is part of the parsimony of PPS, which permits EPIC to remove the “gratuitous” central cognitive processing bottleneck. The multi-fire feature of EPIC permits the analyst to develop rich theories of executive process-interactive control (hence the name EPIC), but also requires the analyst to write production rules that do not conflict with each other, such as by sending two different commands to move the eyes in the same cycle.
What follows is a PPS production rule to move the eyes and the cursor to the precue. The IF part contains a number of clauses, each of which must exist in WM for the rule to fire. When the rule fires, the THEN part commands the ocular motor and manual motor processors to move the eyes and mouse to the ?OBJECT variable, which will have been bound to the precue object. The comments after semicolons explain how the rule works.
;; Look at and point to the precue.(LOOK-AT-AND-MOVE-CURSOR-TO-PRECUEIF ( ;; This the current high level goal and step. (GOAL DO VISUAL SEARCH TASK) (STEP LOOK AT AND MOVE CURSOR TO PRECUE)
;; The precue and cursor are identified. (VISUAL ?OBJECT OBJECT-TYPE PRECUE) (WM CURSOR IS ?CURSOR-OBJECT)
12
;; Wait until the motor processors are available. (MOTOR OCULAR PROCESSOR FREE) (MOTOR MANUAL PROCESSOR FREE) ) THEN ( ;; Delete one items from WM, and add two items. (DELDB (STEP LOOK AT AND MOVE CURSOR TO PRECUE)) (ADDDB (STEP GET TARGET PRECUE)) (ADDDB (WM PRECUE IS ?OBJECT))
;; Move the eyes and cursor to the precue. (SEND-TO-MOTOR OCULAR MOVE ?OBJECT) (SEND-TO-MOTOR MANUAL PERFORM POINT RIGHT ?CURSOR-OBJECT ?OBJECT) ))
Every EPIC model includes a task strategy, a set of production rules that represent the procedural knowledge used to coordinate the perceptual and motor processes to accomplish a piece of work. Multiple strategies could accomplish the same task. Strategies are developed based on cognitive task analysis (Schraagen, Chipman & Shalin, 2000), previous modeling and established conventions, and the bracketing heuristic.
2.2. Perceptual Settings
For every physical object perceived by EPIC’s simulated eyeball, a corresponding psychological object is created, with sensory properties that become available as a function of the visual zone in which the object appears. Sensory properties are recoded into perceptual properties, which are deposited into visual WM.
What follows is a list of the object properties used in the models presented in this paper, and the corresponding availabilities and delays. All visual objects have a LOCATION, ZONE, ONSET, and OBJECT-TYPE, available in all zones with a delay of 50 ms. The mouse cursor and sometimes the group labels have a SHAPE, available in the fovea (and all zones within the fovea) with a delay of 100 ms. The cursor has a POINTS-TO property, which indicates the object to which the cursor is pointing, available in the parafovea with a delay of 50 ms. All text items have a TEXT property, available in the fovea with a delay of 100 ms, but which also requires an additional 100 ms for perceptual recoding. All items that get pointed-to by the mouse have a SIZE, available in all zones with a delay of 50 ms. To indicate the group to which each belongs, all layout items have a GROUP-POSITION, NEXT-GROUP, and NEAR-TOP-IN-GROUP property, available in all zones with a delay of 50 ms. To indicate their relative position to each other, all layout items have an IS-ABOVE, IS-BELOW, and IS-n-ABOVE property (where n ranges from TWO to SEVEN), available in all zones with a delay of 50 ms. Most of these parameters were established and validated in previous EPIC models that involved processing text on computer screens (Kieras & Meyer, 1997).
Most of the properties listed above can be extracted directly from the physical visual layout. This is important for the long term goal of building models that can predict search time based on physical features that are automatically extracted from a screen layout, which will be necessary to allow models to interact directly with interfaces (Ritter, Baxter, Jones & Young, 2000; Ritter & Young, 2001; St.!Amant & Riedl, 2001). Properties that cannot be extracted directly from the layout but instead require some additional contextual knowledge include OBJECT-TYPE, which
13

represents whether a screen object is a precue item, layout item, or group label; and NEXT-GROUP, which imposes a top-to-bottom and then left-to-right search order on the groups. The IS-ABOVE feature can be extracted directly from the layout, except for items at the bottom of a column, which are defined here as being above the top item in the next column.
A named location in EPIC is a point in the visual field that is available to WM even if no object is at that location. Named locations have been created for the first five positions in the screen layout. These are named ITEM-LOCATION-n where n is 1 through 5. These named locations guide the first saccade that initiates the search of the layout. Prior research (Hornof & Kieras, 1999) suggests that people are likely to initiate a visual search of a known structure before the layout appears using anticipated location knowledge.
A global feature is a visual feature that is available in WM but is not tied directly to a visual object. The models use one global feature, GAZE-IS-ON-MENU-ITEM, which keeps track of the object that is currently at the center of the gaze. It is used once in each trial, to convert the fixation at the anticipated location into the object that appears at that location.
2.3. Task Strategies
One of the primary goals of this modeling project is to identify general-purpose strategies that people use to coordinate perceptual-motor processes when finding and clicking on an item on the computer screen. Based on task analysis, the strategy used in each model can be decomposed into seven substrategies executed in roughly serial order: (1) Start the trial. (2) Memorize the precue. (3) Prepare for the search. (4) Click on the precue. (5) Find the target. (6) Click on the target. (7) Prepare for the next trial.
Though a different model was developed for each type of layout (target-only, unlabeled, and labeled), the only substantial difference across the various models, aside from the different layout configurations, was the “Find the target” substrategy for each layout. The “Find the target” substrategy is at the core of the visual search models, and its development is discussed next.
3. VISUAL SEARCH MODELS
After the perceptual and motor parameters discussed in the previous section were established, cognitive strategies were developed for each type of layout. Except in the few instances noted, the EPIC architecture was used with no modifications whatsoever. This practice contributes to the long-term goal of developing cognitive architectures and modeling practices that can be used to routinely and accurately predict aspects of human performance.
Each layout was presented in a separate block, so participants could plan a unique search strategy for each layout before the layout appeared. Blocking by layout type is critical for differentiating and identifying different task strategies. If layouts are presented in every block (as in Byrne, 2001), then the participant has little motivation or opportunity to plan and prepare a search strategy unique to that layout, and will need to program eye movements based on stimuli presented during the task (local programming) rather than on the anticipated structure of the visual layout (global programming). Models built based on such data might be biased in favor
14
of local over global strategies (as in Byrne, 2001), and may contribute to the conclusion that “that there is great power in considering tasks like this as being driven by local rather than global strategies.” (Byrne, 2001 #544, p.80.) Not blocking by unique layout might also reduce features in the observed data such as the the space between the curves for different layout sizes, features that are useful for identifying differences in visual search strategies.
A different set of cognitive strategies are examined for each layout type--target-only, unlabeled, and labeled. The strategies for unlabeled layouts include 20 to 25 rules; labeled layouts, 25 to 30. The exploration through plausible search strategies was guided by previous EPIC models of visual search, and by the bracketing heuristic discussed in the introduction. Roughly 100 hours were spent developing the models.
3.1. Target-Only Layout
In the target-only layout, a single target item appears on the screen with no distractors. To the extent that a search involves moving the eyes and looking for the target amidst distractors, there is little or no search required for this layout. The intuitive perception when doing the target-only task is that the target suddenly ‘pops out’ in the periphery. This intuition is supported by the fast, constant search times across all thirty positions (an average of 208 ms, which can be seen in Figure 4).
The very fast search times allow the target-only task to be used as a sort of lower bracket for all layouts. It is important to correctly predict this base level search time in order to confirm that the subsequent models, which will require a more involved search, are starting with a reasonable lower bound of processing requirements.
The cognitive strategy used to search the target-only layout was developed primarily based on strategies developed in previous models (Hornof & Kieras, 1997; Hornof & Kieras, 1999). The following straightforward strategy was developed: Click on the precue to make the target appear; move the mouse to the visual object that appears; click on the target.
Based on previous modeling (Hornof & Kieras, 1999), a CLICK-AND-POINT compound movement was simulated. The CLICK-AND-POINT compound movement allows a POINT movement to be prepared at the same time as a PUNCH. A compound CLICK-AND-POINT movement style is appropriate here because the participant knows that they will need to move the mouse as soon as they click to make the target appear, even though they do not know where the target will appear. A partial POINT movement could be prepared in advance, with the precise direction and extent determined after the target appears. The movement style was implemented by reducing the number of POINT features to prepare after a PUNCH from 4 to 1.
The strategy predicts a target-only search time of 275 ms. Compared to the observed search time of 208 ms, the average absolute error (AAE) of the model is 32%. This is a large error in percentage, but not in magnitude (67 ms). The discrepancy relates to how the manual motor processor functions in such a high speed task. Studying the trace of information in EPIC, it is clear that the target is perceived after just 50 ms, and the manual motor response is prompted shortly thereafter. The delay is in manual motor processing, not visual. As soon as search times increase beyond 400 ms, as they do in all other layouts, visual and oculomotor processing
15

dominate, and the problem disappears. This is an adequate prediction for the target-only layout, and an adequate lower bound prediction for this task.
3.2. Unlabeled Layouts
Three sets of models were built to explain the visual search of the unlabeled layouts: purely random, purely systematic, and noisy systematic. Though it is unlikely that people are purely random or purely systematic, these two strategies are examined for three reasons: (1) These are the two prototypical search strategies proposed and examined in previous visual search studies, and models built with each strategy have been very informative (see Card, 1983; Hornof & Kieras, 1997; MacGregor & Lee, 1987). (2) Each strategy has its merits as a candidate for a priori predictive modeling--random search can be easily incorporated into practical modeling tools, and systematic search can leverage a designer’s intuitions of search order. (3) The two strategies lend themselves to bracketing, with random search as the upper bracket, systematic search as the lower bracket, and the observed data falling in between. The third strategy--noisy systematic--proposes one possible integration of random and systematic search that homes in on the observed data.
Random Search
The first search strategy examined is purely random. The positive slope in the observed data (the serial position effect) suggests a self-terminating, systematically ordered search. Nonetheless, a random search strategy is useful to examine first because it can be implemented with a minimum of visual features (basically just LOCATION, TEXT, and SIZE) and might be useful as a first-guess predictor of search time, or as an upper bound when bracketing.
There are a number of ways to add randomness to a search. One of the most parsimonious approaches, used here, is to randomly select the next item to examine from all of the objects outside of the fovea. In the screen layouts, items were vertically spaced with one item every 0.8° of visual angle. With EPIC’s fovea fixed at 2° of visual angle in diameter, at most three items could fit into the fovea simultaneously. With the TEXT feature only available in the the fovea, each fixation could examine the TEXT feature of two or three items simultaneously.
The left frame of Figure 8 shows the search times predicted by the model, averaged across 100 trials run for each target position for each layout. The left graph in Figure 8 shows search time as a function of the target position, and the right graph shows search time averaged across all target positions in a layout. As can be seen in the graphs, the model is within range of the observed data. In the left graph, the predicted data intersect the observed data for each layout, but do not accurately predict the serial position effect (the slope). The model explains this view of the data with an average absolute error (AAE) of 19% and a root mean squared error (RMSE) of 529 ms, which is not a good fit. The rule of thumb applied in this paper is that a model that explains the observed data with an AAE that is greater than 10% is not a good fit, an AAE of less than 10% is a good fit, and an AAE of less than 5% is a very good fit.
16

0
1000
2000
3000
4000Search.LvU.2-12/16/01
Mean forEach Layout
0
1000
2000
3000
4000
Sear
ch T
ime
(mse
c)
1-5 6-10 11-15 16-20 21-25 26-30Target Position
Search.LvU.2-9/13/01
1 Group, Predicted2 Groups, Predicted4 Groups, Predicted6 Groups, Predicted1 Group, Observed2 Groups, Observed4 Groups, Observed6 Groups, Observed
Figure 8. Unlabeled layout search times observed (solid lines) and predicted (dashed lines) by a random search strategy with two or three items fitting in the fovea with each fixation. Though the location-based search times (left graph) are not accurately predicted (AAE=19%, RMSE=529 ms), the mean search times of the layouts (right graph) are accurately predicted (AAE=6%, RMSE=157 ms). The 1-group prediction is directly behind the 1-group observation.
Though the purely random strategy does a poor job of predicting search time as a function of the target position, the strategy does a good job of predicting the mean layout search time, in which all positions are averaged together. The good fit is illustrated in the right frame of Figure 8. Averaging across all positions in each layout, the AAE is 6% and the RMSE is 157 ms. It appears as if a purely random search strategy combined with the examination of multiple items with each fixation does not fully explain how people do the task, but may be useful model for a priori predictions of mean layout search times.
Systematic Search
A purely systematic search strategy was examined next. Alongside a purely random search, this is the other prototypical visual search strategy discussed in the literature (Lee & MacGregor, 1985). A systematic search should be a good lower bracket for the observed data. A systematic search strategy examines a layout in an efficient and regular order, leaving nothing to chance and never examining the same item twice. Most features necessary to guide the search can be extracted directly from the physical representation of the layout.
A top-to-bottom and then left-to-right search order is assumed for the layout, based on (1) the physical structure of the layout, in which the precue appears above the top left, and items are arranged in three columns with some distance between the columns, and (2) a post-hoc analysis of the observed data, which shows a strong serial position effect in this search order. Figure 9 shows the search order of the systematic strategy.
17
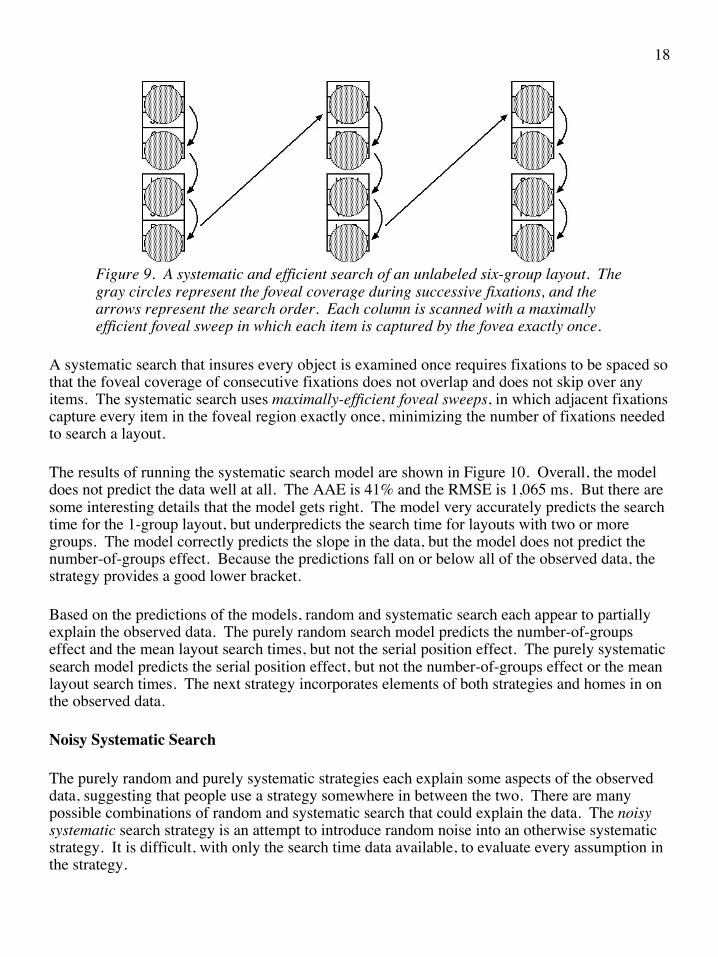
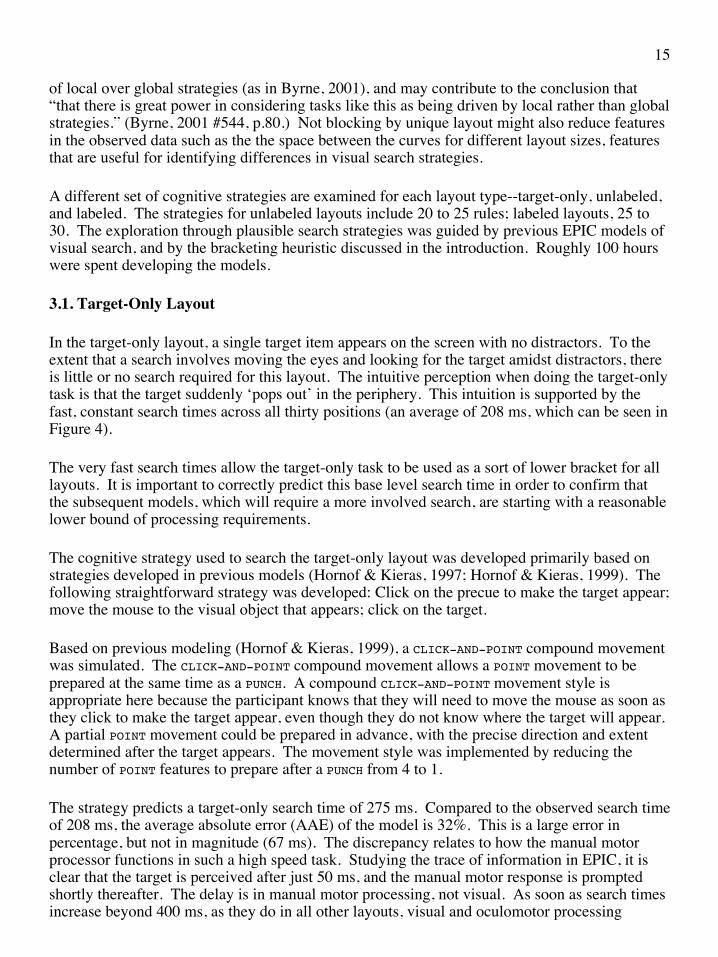
Figure 9. A systematic and efficient search of an unlabeled six-group layout. The gray circles represent the foveal coverage during successive fixations, and the arrows represent the search order. Each column is scanned with a maximally efficient foveal sweep in which each item is captured by the fovea exactly once.
A systematic search that insures every object is examined once requires fixations to be spaced so that the foveal coverage of consecutive fixations does not overlap and does not skip over any items. The systematic search uses maximally-efficient foveal sweeps, in which adjacent fixations capture every item in the foveal region exactly once, minimizing the number of fixations needed to search a layout.
The results of running the systematic search model are shown in Figure 10. Overall, the model does not predict the data well at all. The AAE is 41% and the RMSE is 1,065 ms. But there are some interesting details that the model gets right. The model very accurately predicts the search time for the 1-group layout, but underpredicts the search time for layouts with two or more groups. The model correctly predicts the slope in the data, but the model does not predict the number-of-groups effect. Because the predictions fall on or below all of the observed data, the strategy provides a good lower bracket.
Based on the predictions of the models, random and systematic search each appear to partially explain the observed data. The purely random search model predicts the number-of-groups effect and the mean layout search times, but not the serial position effect. The purely systematic search model predicts the serial position effect, but not the number-of-groups effect or the mean layout search times. The next strategy incorporates elements of both strategies and homes in on the observed data.
Noisy Systematic Search
The purely random and purely systematic strategies each explain some aspects of the observed data, suggesting that people use a strategy somewhere in between the two. There are many possible combinations of random and systematic search that could explain the data. The noisy systematic search strategy is an attempt to introduce random noise into an otherwise systematic strategy. It is difficult, with only the search time data available, to evaluate every assumption in the strategy.
18

0
1000
2000
3000
4000
Sear
ch T
ime
(mse
c)
1-5 6-10 11-15 16-20 21-25 26-30Target Position
Search.LvU.5.1-12/18/01
1 Group, Predicted2 Groups, Predicted4 Groups, Predicted6 Groups, Predicted1 Group, Observed2 Groups, Observed4 Groups, Observed6 Groups, Observed
Figure 10. Unlabeled layout search times predicted by the systematic search model when an average of 2.5 items are considered with each fixation. The predictions for the four different layout sizes are superimposed. This is perhaps the optimal search strategy for an unlabeled layout. The model explains the data for the 1-group layout (superimposed with the lowest prediction), but underpredicts the data for the other layouts.
The noisy systematic strategy assumes that people will try to search a layout in a regular and systematic manner, examining each item exactly once (as shown in figure 9), but that random noise will disrupt the process. Random noise is introduced into the strategy by (1) varying the destination of the first saccade and (2) varying the extent of each subsequent saccade. In the systematic search strategy, the next item to fixate was always two- or three-below the currently-fixated object. Now the next item to fixate will vary randomly between two-below to seven-below. Varying these saccade destinations while maintaining a fovea of 2° of visual angle, which means that some items will not be foveated in a visual sweep and will need to be examined with additional sweeps. Once the layout is searched, the search starts again at the beginning.
The strategy randomly selects the first fixation location from a set of candidate items, and selects subsequent fixation locations from a variety of distances below the current item. The PPS production rules for the strategy are listed in the Appendix.
The noisy systematic strategy integrates both local and global programming of eye movements. It is local in that the parameters for the next saccade are programmed based on decisions made during the current fixation. It is global in that the only alternatives that are considered are those that are part of the structure of the layout and the task at hand, which do not change during the task execution. This interleaving is consistent with integrated theories of local and global search, such as Cohen’s (1981) hypothesis that people use schemata that are influenced by perceptual features.
The strategy is parsimonious in that it varies only two parameters--the set items considered for the first fixation, and the set of distances considered for subsequent fixations. Eighty-four versions of the strategy were written independently varying each parameter. Across different models, the first fixation varied among positions: 12, 123, 1234, 12345, 23, 234, and 2345.
19

Across different models, subsequent fixation distances were varied among items that were the following distances below the current fixation: 23, 34, 45, 56, 234, 345, 456, 2345, 3456, 4567, 23456, 34567. Each position and saccade distance was chosen with equal probability. Each strategy was run in EPIC, and all of the predictions were compared to the observed data. Figure 11 shows a noisy systematic search that starts in Position 1, and in which subsequent fixations are three to seven items below the previous item.
Figure 11. EPIC’s visual space during a noisy systematic search of an unlabeled 6-group layout. The target is in Position 22, near the top of the third column. If the fovea had missed the target on this sweep, it would have picked it up on a subsequent sweep.
All of the models assume a purely random search when there is only one group in the layout. A purely systematic search strategy could just as easily have been assumed. As could be seen in Figures 8 and 10, both explain the search times for the 1-group layout very well. With either strategy, all items are usually examined within two or three saccades.
Figure 12 shows the noisy systematic model’s prediction when run with saccade distributions that provide the best fit with the observed data. The first fixation is equally distributed among items 1234&5 and subsequent fixations are equally distributed among items 456&7 items below the currently-fixated item. The model accounts for all primary features in the observed data, including the group size effect. Across all eighty-four combinations of fixation settings that were evaluated, the best-fitting models tended to be those with subsequent saccade distances of 45&6, 456&7, and 3456&7. The initial fixation location did not affect the prediction as much as the subsequent saccade distances.
The noisy systematic model represents a parsimonious explanation of how random and systematic search could be integrated within the same strategy. The model also fits with the intuitive perception that a person sometimes misses the target on the first pass, and finds it on a subsequent pass. The model demonstrates how not fixating every word may lead to a more
20

efficient search, but might lead to a strategy in which people try to pick up more items than possible with a fixation, and sometimes miss items, thus introducing random noise into an otherwise systematic search. The modeling has led to a plausible explanation of how random and systematic search can be integrated into a single strategy when searching layouts that are not organized with a clear and useful visual hierarchy.
0
1000
2000
3000
4000Se
arch
Tim
e (m
sec)
1-5 6-10 11-15 16-20 21-25 26-30Target Position
LvU.11-12345-4567
1 Group, Predicted2 Groups, Predicted4 Groups, Predicted6 Groups, Predicted1 Group, Observed2 Groups, Observed4 Groups, Observed6 Groups, Observed
Figure 12. Unlabeled layout search times predicted by the noisy systematic search strategy with the saccade distributions that best explain the data. Initial fixations were distributed among positions 1234&5 and subsequent fixations among items 456&7 below. The model predicts the data with an AAE of 6.0% and a RMSE of 171 ms.
3.3. Labeled Layouts
Three sets of models were built to explain the visual search of the labeled layouts: random group-label search, systematic group-label search, and mixed group-label search. Task analysis and the observed search time data suggest that participants used the group labels when searching the labeled layouts. The search was likely two-tiered: first search the group labels first, and then search within the target group. All three strategies discussed here assume a two-tiered search.
The bracketing heuristic was again applied to the development of the models. The purely random search strategy for unlabeled layouts, with the predictions shown in Figure 8, might be considered an extreme upper bracket, predicting search times much higher than those observed for labeled layouts. A more plausible upper bracket strategy might be a random search of the group labels until the target group is found, and then a search within the target group. A good candidate for a lower bracket might be a systematic search of group labels followed by a search within the target group.
Random Group-Label Search
PPS production rules were written to represent a random group-label search followed by a random search within the target group (though a systematic search within the target group would perform roughly the same). Figure 13 shows the search time results after running the model for 100 trials per target position. Overall, the model does not predict the observed data very well,
21

with an AAE of 35% and a RMSE of 605 ms. The model accurately predicts a faster search than the models for the unlabeled layouts, but overpredicts the observed data. The model does not predict the position effect, which suggests that people search the groups in a top-left to bottom-right order. Instead, the predicted slope is roughly zero. The model also overpredicts the number-of-groups effect--there is too much space between the curves. The strategy provides a good upper bracket for the modeling process.
0
1000
2000
3000
4000
Sear
ch T
ime
(mse
c)
1-5 6-10 11-15 16-20 21-25 26-30Target Position
Search.LvU.3-9/22/01
2 Groups, Predicted4 Groups, Predicted6 Groups, Predicted2 Groups, Observed4 Groups, Observed6 Groups, Observed
Figure 13. Labeled layout search times predicted by a random group-label search strategy model, with two or three items fitting in the fovea with each fixation. The reduced layout-size effect is promising, but overall the model explains the data very poorly , with an AAE of 35% and a RMSE of 605 ms.
Systematic Group-Label Search
The next two-tiered strategy systematically searches labels until the target group is found, and then systematically searches within the target group (though a random within-group search would perform roughly the same). This is somewhat analogous to the purely systematic search strategy used for unlabeled layouts, except that it utilizes the visual hierarchy. It is anticipated that the strategy will provide a good lower bracket, consistently predicting search times faster than those observed. An outline of the PPS production rules written for the hierarchical systematic group-label search strategy are listed in the Appendix.
Figure 14 shows EPIC’s visual space during one trial of the systematic group-label search model. The model predicts the data rather well, with an AAE of 9.4%, but has a slightly larger slope than that in the observed data, and slightly overpredicts the search times for positions 16 through 30. The overprediction is troubling because this would seem to be the optimal strategy for a labeled layout and yet people accomplish the task faster than the model. The first version of the strategy does not provide a good lower bracket.
22
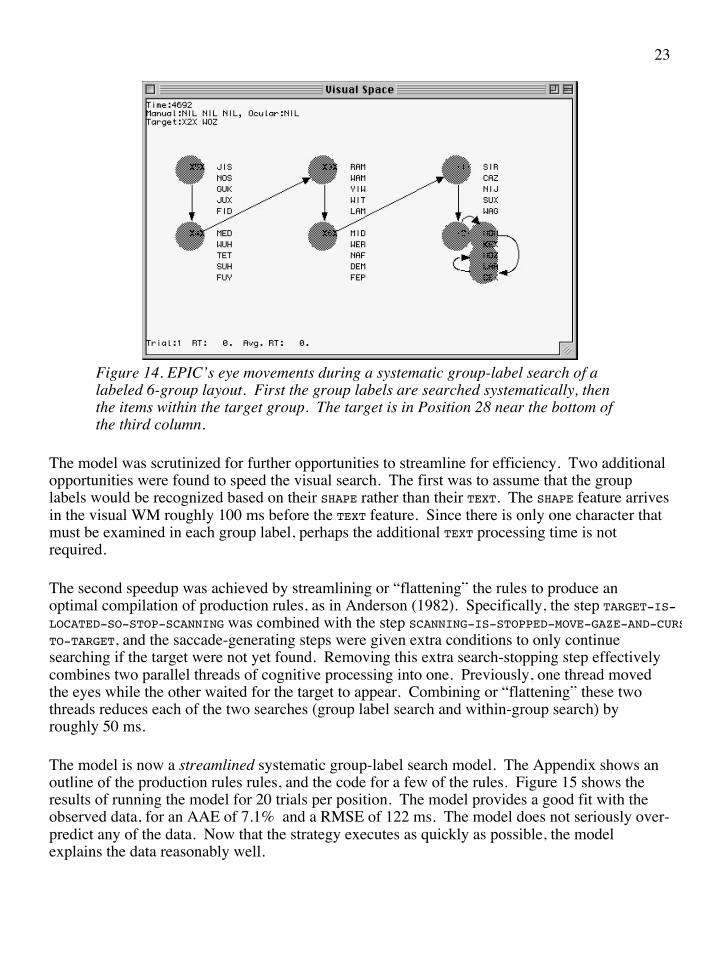
Figure 14. EPIC’s eye movements during a systematic group-label search of a labeled 6-group layout. First the group labels are searched systematically, then the items within the target group. The target is in Position 28 near the bottom of the third column.
The model was scrutinized for further opportunities to streamline for efficiency. Two additional opportunities were found to speed the visual search. The first was to assume that the group labels would be recognized based on their SHAPE rather than their TEXT. The SHAPE feature arrives in the visual WM roughly 100 ms before the TEXT feature. Since there is only one character that must be examined in each group label, perhaps the additional TEXT processing time is not required.
The second speedup was achieved by streamlining or “flattening” the rules to produce an optimal compilation of production rules, as in Anderson (1982). Specifically, the step TARGET-IS-LOCATED-SO-STOP-SCANNING was combined with the step SCANNING-IS-STOPPED-MOVE-GAZE-AND-CURSOR-TO-TARGET, and the saccade-generating steps were given extra conditions to only continue searching if the target were not yet found. Removing this extra search-stopping step effectively combines two parallel threads of cognitive processing into one. Previously, one thread moved the eyes while the other waited for the target to appear. Combining or “flattening” these two threads reduces each of the two searches (group label search and within-group search) by roughly 50 ms.
The model is now a streamlined systematic group-label search model. The Appendix shows an outline of the production rules rules, and the code for a few of the rules. Figure 15 shows the results of running the model for 20 trials per position. The model provides a good fit with the observed data, for an AAE of 7.1% and a RMSE of 122 ms. The model does not seriously over-predict any of the data. Now that the strategy executes as quickly as possible, the model explains the data reasonably well.
23

0
1000
2000
3000
4000
Sear
ch T
ime
(mse
c)
1-5 6-10 11-15 16-20 21-25 26-30Target Position
Search.LvU.6-10/12/01
2 Groups, Predicted4 Groups, Predicted6 Groups, Predicted2 Groups, Observed4 Groups, Observed6 Groups, Observed
Figure 15. Labeled layout search times predicted by the streamlined systematic group-label search strategy model. The model explains the observed data rather well, with an AAE of 7.1% and a RMSE of 122 ms.
It appears as if participants searched labeled layouts more systematically than unlabeled layouts, and in a highly streamlined manner. Interestingly, the model does not provide a great lower bracket because it predicts the observed data so well. Evidently, participants adopted a near-optimal search strategy.
It would be reasonable to end the search for the best-fitting strategy here. However, the AAE is not below the 5%, which was the stated goal in this modeling exercise. As well, there is a slight number-of-groups effect in the observed data (the space between the curves) that is not predicted by the model. One additional strategy will be examined to explain this number-of-groups effect.
Mixed Group-Label Search
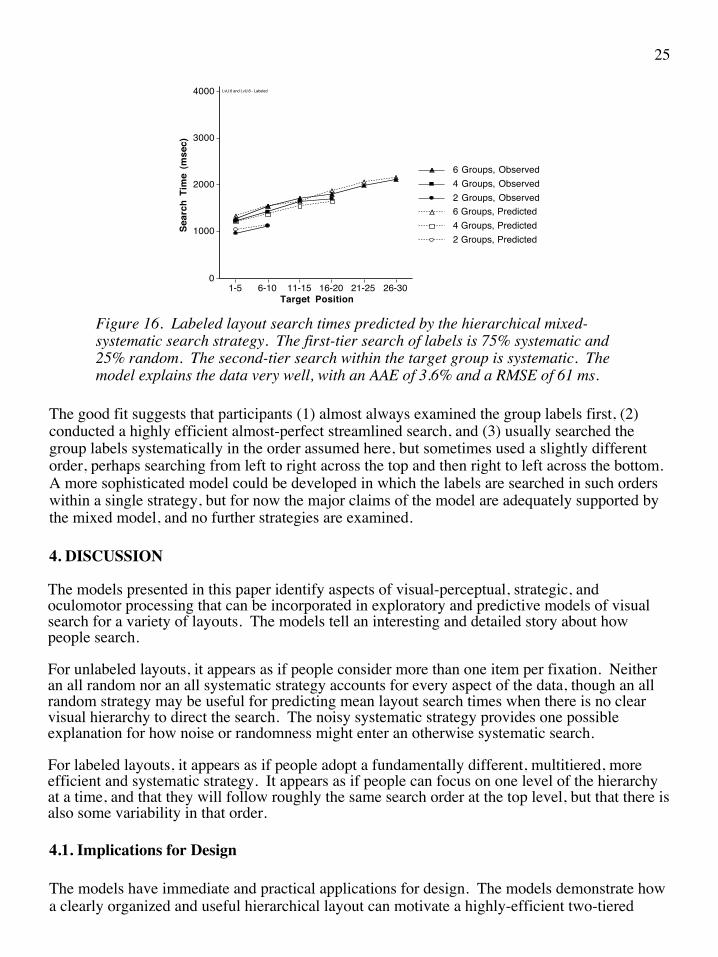
A final hybrid strategy assumes an mixed random and systematic search of the group labels (systematic 75% of the time, and random 25% of the time), and a systematic search within the target group. The mixed group-label search model was simulated by taking a weighted average of the predictions made by the streamlined systematic group-label search model and an equivalently streamlined random group-label search model. After trying all possible weightings of the two sets of predictions (using every 1-percent increment), it was found that a weighted average of 75% systematic and 25% random fit the observed data best. Figure 16 shows the predictions of the model, which accounts for all of the features in the observed data and explains the observed data with an AAE of 3.6% and a RMSE of 61 ms.
There are many possible interpretations as to why 75% systematic search and 25% random search predicts the data. One is simply that on some trials or saccades, people will follow a pattern determined completely in advance, and on some trials or saccades, people will add random variations to try to improve performance, and that the characteristics of this experimental design and participant selection resulted in these percentages.
24
0
1000
2000
3000
4000
Sear
ch T
ime
(mse
c)
1-5 6-10 11-15 16-20 21-25 26-30Target Position
LvU.6 and LvU.8 - Labeled
2 Groups, Predicted4 Groups, Predicted6 Groups, Predicted2 Groups, Observed4 Groups, Observed6 Groups, Observed
Figure 16. Labeled layout search times predicted by the hierarchical mixed-systematic search strategy. The first-tier search of labels is 75% systematic and 25% random. The second-tier search within the target group is systematic. The model explains the data very well, with an AAE of 3.6% and a RMSE of 61 ms.
The good fit suggests that participants (1) almost always examined the group labels first, (2) conducted a highly efficient almost-perfect streamlined search, and (3) usually searched the group labels systematically in the order assumed here, but sometimes used a slightly different order, perhaps searching from left to right across the top and then right to left across the bottom. A more sophisticated model could be developed in which the labels are searched in such orders within a single strategy, but for now the major claims of the model are adequately supported by the mixed model, and no further strategies are examined.
4. DISCUSSION
The models presented in this paper identify aspects of visual-perceptual, strategic, and oculomotor processing that can be incorporated in exploratory and predictive models of visual search for a variety of layouts. The models tell an interesting and detailed story about how people search.
For unlabeled layouts, it appears as if people consider more than one item per fixation. Neither an all random nor an all systematic strategy accounts for every aspect of the data, though an all random strategy may be useful for predicting mean layout search times when there is no clear visual hierarchy to direct the search. The noisy systematic strategy provides one possible explanation for how noise or randomness might enter an otherwise systematic search.
For labeled layouts, it appears as if people adopt a fundamentally different, multitiered, more efficient and systematic strategy. It appears as if people can focus on one level of the hierarchy at a time, and that they will follow roughly the same search order at the top level, but that there is also some variability in that order.
4.1. Implications for Design
The models have immediate and practical applications for design. The models demonstrate how a clearly organized and useful hierarchical layout can motivate a highly-efficient two-tiered
25

search. Designers can leverage this by using clear, concise, peripherally salient, and mutually-exclusive group labels. For high-traffic web sites, it would be a good idea to user-test group labels for their effectiveness. As suggested by Mullet (1995, p.94), grouping similar items together and imposing a high-level structure will help the user to establish a strategy for moving their eyes to the relevant part of the display.
The models demonstrate why a screen layout with a large number of items to choose from will not necessarily result in a long search time. If the layout is well-organized, search times will not increase dramatically as the number of items on the screen increases. Well-structured layouts may be searched in a predictable manner, giving designers control over search order. These models demonstrate the fallacy of screen layout guidelines that set arbitrary limits to screen density, such as those proposed in Galitz (1996), and helps to explain why a densely packed screen is sometime preferable (Staggers, 1993).
4.2. Implications for Predictive Modeling
The models provide useful insight for predictive modeling, and may be immediately useful in tools such as in Apex (John, Vera, Matessa, Freed & Remington, 2002) and GLEAN (Kieras, Wood, Abotel & Hornof, 1995). These tools simulate at the keystroke level and do not include models of visual search. The models account for hierarchical search better than tools built to predict visual search, such as Lohse’s (1993) Understanding Cognitive Information Engineering (UCIE) and Tullis’ (1988) Display Analysis Program (DAP).
Neither UCIE nor DAP will automatically predict that a visual hierarchy decreases search time. UCIE incorporates strategies, but not specifically for hierarchical layouts. DAP does not incorporate strategies, but instead predicts search times based on grouping, density, and layout complexity, and does not predict a faster search for a hierarchical layout. Nonetheless, DAP is still the only empirically-validated self-contained tool for predicting visual search times, and provides a good benchmark for evaluating visual search models.
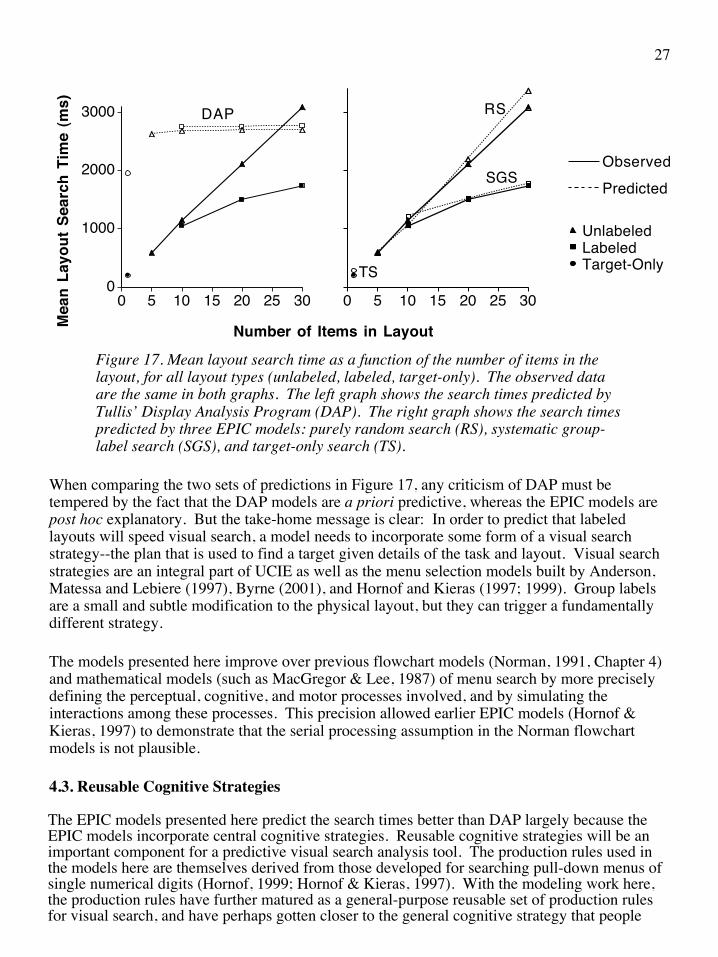
The screen layouts used in this experiment were converted into the 25¥80 alphanumeric screenshots required by DAP, and input into the tool. Figure 17 (left frame) shows the mean search time observed for each layout, and DAP’s predictions for each layout. As can be seen, DAP predicts the upper bound of the observed search times, but not the dramatic speed improvements observed with smaller layouts and labeled layouts. Note that this view of the data--search time as a function of layout size rather than target position--is different from that in the previous graphs.
Figure 17 (right frame) shows the mean layout search times predicted by the preliminary models proposed for each layout discussed in this paper. These are not the final best-fitting models, but rather the good-fitting models with strategies that could be easily reused for other, similar tasks. Each explains the mean layout search time very well. Random search (RS) explains unlabeled layouts. Systematic group-label search (SGS) search explains labeled layouts. Target-only (TS) search explains the target-only layout.
26
0
1000
2000
3000
Mea
n La
yout
Sea
rch
Tim
e (m
s)
0 5 10 15 20 25 30
Number of Items in Layout
DAP
LabeledUnlabeled
Target-Only
0 5 10 15 20 25 30
RS
SGS
TS
PredictedObserved
Figure 17. Mean layout search time as a function of the number of items in the layout, for all layout types (unlabeled, labeled, target-only). The observed data are the same in both graphs. The left graph shows the search times predicted by Tullis’ Display Analysis Program (DAP). The right graph shows the search times predicted by three EPIC models: purely random search (RS), systematic group-label search (SGS), and target-only search (TS).
When comparing the two sets of predictions in Figure 17, any criticism of DAP must be tempered by the fact that the DAP models are a priori predictive, whereas the EPIC models are post hoc explanatory. But the take-home message is clear: In order to predict that labeled layouts will speed visual search, a model needs to incorporate some form of a visual search strategy--the plan that is used to find a target given details of the task and layout. Visual search strategies are an integral part of UCIE as well as the menu selection models built by Anderson, Matessa and Lebiere (1997), Byrne (2001), and Hornof and Kieras (1997; 1999). Group labels are a small and subtle modification to the physical layout, but they can trigger a fundamentally different strategy.
The models presented here improve over previous flowchart models (Norman, 1991, Chapter 4) and mathematical models (such as MacGregor & Lee, 1987) of menu search by more precisely defining the perceptual, cognitive, and motor processes involved, and by simulating the interactions among these processes. This precision allowed earlier EPIC models (Hornof & Kieras, 1997) to demonstrate that the serial processing assumption in the Norman flowchart models is not plausible.
4.3. Reusable Cognitive Strategies
The EPIC models presented here predict the search times better than DAP largely because the EPIC models incorporate central cognitive strategies. Reusable cognitive strategies will be an important component for a predictive visual search analysis tool. The production rules used in the models here are themselves derived from those developed for searching pull-down menus of single numerical digits (Hornof, 1999; Hornof & Kieras, 1997). With the modeling work here, the production rules have further matured as a general-purpose reusable set of production rules for visual search, and have perhaps gotten closer to the general cognitive strategy that people
27

really use.
The target-only strategy can be used to predict visual acquisition of a single item that appears suddenly on the screen, and can also be used to find items that “pop-out” (Treisman, 1986). For the latter, the model would simply be modified so that, instead of looking for the onset, the strategy looks for a peripherally salient feature such as color.
The purely random search strategy, with parallel consideration of adjacent items, is a good first-cut search model for predicting mean layout search time for unhierarchical layouts. This is consistent with Neisser’s (1963) simple search model that predicts that response time will increase linearly as a function of the total number of objects that must be examined.
The noisy systematic strategy is useful for predicting search times to different regions of an unhierarchical layout. The strategy may also be useful for predicting visual search when there are many items in a single level of a hierarchical display. For example, if the groups here were much larger, a noisy systematic search should probably be used for the within-group search. The noisy systematic search strategy provides a different integration of random and systematic search than was earlier proposed by Hornof and Kieras (1997) and by Hornof (1999), but supports the main point of the earlier models which is that human search behavior can be characterized by some sort of combination of random and systematic search.
Cognitive strategies in predictive tools need to incorporate both local and global programming of eye movements. Here, global programming kept the eyes on the group labels until the target group was found, but local programming decided exactly which item to fixate next. The models suggest that global programming of eye movements is necessary for a predictive model, though it as been suggested that local programming is sufficient (Byrne, 2001).
4.4. Visual Perceptual Parameters
The visual-perceptual parameters used here continue to be useful for modeling visual search tasks. Previous assumptions appear to hold, including the assumption that people consider multiple adjacent items with a single fixation (Hornof, 1999; Hornof & Kieras, 1997).
This research contributes to the practice of predictive modeling by converting visual objects into visual working memory objects as directly as possible, using the encoding parameters listed in Section 2.2. This explicit listing of these parameters in is provided in part for the benefit of researchers who are working on the front end of the process--tools that take screenshots of graphical user interfaces as input, automatically parse the screenshot, and generate visual objects that can be fed directly into a cognitive model (Ritter et al., 2000; Ritter & Young, 2001; St.!Amant & Riedl, 2001).
It remains an open question whether people miss items simply because the items fall too far from the fovea and people cannot perceive them, as in the model here, or whether there is a processing limit on the number of items that can be perceived with a single fixation regardless of whether the items appear in the fovea. Sperling (1960) found a “span of apprehension” of about four items per fixation, but this was found studying single fixations. Perhaps the number of objects that can be examined with a single fixation further decreases in the course of a rapid sequence of
28
saccades, such as when conducting a visual search. Perhaps the four slots in visual working memory (Cowan, 2000; Vogel, Woodman & Luck, 2001) or four visual indexes (Pylyshyn, 2001) are sometimes occupied with processing a previous fixation even though the eyes have moved on to a new location, and few if any slots are available for processing anything new.
Eye tracking analyses of the current experiment will help to evaluate these questions, as well as other assumptions of the models. Note that, in the two best-fitting noisy systematic models, subsequent saccade distances are on average about five items below the current item. This means that on average there would be about one fixation per group, with multiple passes of the layout starting from the top left and going down each column. It should be relatively straightforward to determine, based on eye movement data, whether people exhibit this precise pattern, or whether the integration of random and systematic search needs to be further refined.
4.5. Developing the Architectures
Though this research demonstrates the viability of EPIC, it also identifies potential improvements to the architecture. In order to account for the target-only search times, it appears as if EPIC needs a more complex PUNCH-AND-POINT compound motor program. It appears as if the architectures should support the full preparation of the POINT subprogram even before the POINT distance is known, finalizing the distance during the POINT. Any architecture that inherit EPIC’s motor modules, such as ACT-R/PM, will have the same issues.
EPIC’s fovea is currently fixed at 2° of visual angle. It has been proposed that EPIC should vary the size of its fovea when items are spaced more widely apart in order to accurately represent how visual acuity gradually decreases as a function of the distance from the center of the gaze (Nilsen & Evans, 1999). This was not done here in part because this recommendation was made based on screen layouts less dense that those used here. The author is, however, currently examining the issue of how many items can be perceived in parallel as a function of item proximity and other visual features, and how to incorporate these details into the models.
It may also be appropriate to impose a limit on the number of items that can be perceived in parallel, in line with the evolving research on the limitations of visual working memory. These modifications to the architecture would permit a richer set of noisy systematic models to be developed, as may be necessary to explain the eye movement data for this task, which is also a current research endeavor of the author.
5. CONCLUSION
This article provides numerous applied and theoretical contributions with respect to predictive modeling of human-computer visual tasks, model-based evaluation of computer interfaces, interface design and analysis, integrated and unified theories of visual search, and the development of cognitive architectures.
The ultimate promise for cognitive modeling in human-computer interaction is that it provides the science base needed for predictive analysis tools and methodologies. It will be evident that the practice has arrived in the predictive phase when the methodology is as well-defined as NGOMSL (John & Kieras, 1996), can be taught in a short-course, is routinely applied to real-
29

world engineering problems with automated predictive tools, is routinely validated with human data collected after the model is built. Until then, further exploratory modeling will be conducted. The cognitive models presented in this article build on the growing body of modeling research, and contribute to exploratory and predictive cognitive modeling.
30
APPENDIX
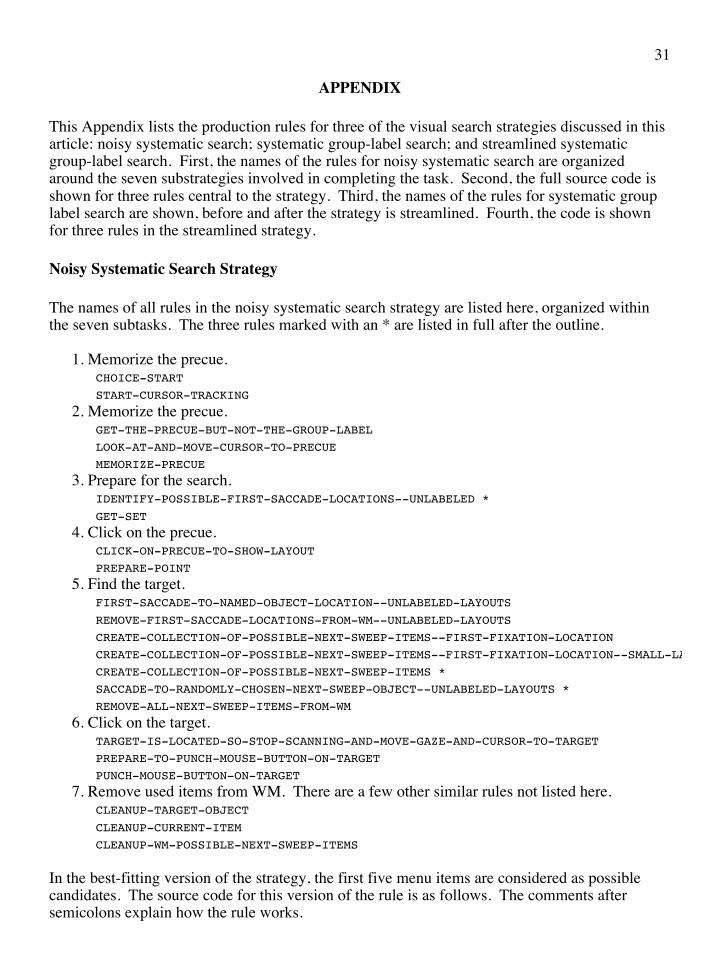
This Appendix lists the production rules for three of the visual search strategies discussed in this article: noisy systematic search; systematic group-label search; and streamlined systematic group-label search. First, the names of the rules for noisy systematic search are organized around the seven substrategies involved in completing the task. Second, the full source code is shown for three rules central to the strategy. Third, the names of the rules for systematic group label search are shown, before and after the strategy is streamlined. Fourth, the code is shown for three rules in the streamlined strategy.
Noisy Systematic Search Strategy
The names of all rules in the noisy systematic search strategy are listed here, organized within the seven subtasks. The three rules marked with an * are listed in full after the outline.
1. Memorize the precue.CHOICE-STARTSTART-CURSOR-TRACKING
2. Memorize the precue.GET-THE-PRECUE-BUT-NOT-THE-GROUP-LABELLOOK-AT-AND-MOVE-CURSOR-TO-PRECUEMEMORIZE-PRECUE
3. Prepare for the search.IDENTIFY-POSSIBLE-FIRST-SACCADE-LOCATIONS--UNLABELED *GET-SET
4. Click on the precue.CLICK-ON-PRECUE-TO-SHOW-LAYOUTPREPARE-POINT
5. Find the target.FIRST-SACCADE-TO-NAMED-OBJECT-LOCATION--UNLABELED-LAYOUTSREMOVE-FIRST-SACCADE-LOCATIONS-FROM-WM--UNLABELED-LAYOUTSCREATE-COLLECTION-OF-POSSIBLE-NEXT-SWEEP-ITEMS--FIRST-FIXATION-LOCATIONCREATE-COLLECTION-OF-POSSIBLE-NEXT-SWEEP-ITEMS--FIRST-FIXATION-LOCATION--SMALL-LAYOUTCREATE-COLLECTION-OF-POSSIBLE-NEXT-SWEEP-ITEMS *SACCADE-TO-RANDOMLY-CHOSEN-NEXT-SWEEP-OBJECT--UNLABELED-LAYOUTS *REMOVE-ALL-NEXT-SWEEP-ITEMS-FROM-WM
6. Click on the target.TARGET-IS-LOCATED-SO-STOP-SCANNING-AND-MOVE-GAZE-AND-CURSOR-TO-TARGETPREPARE-TO-PUNCH-MOUSE-BUTTON-ON-TARGETPUNCH-MOUSE-BUTTON-ON-TARGET
7. Remove used items from WM. There are a few other similar rules not listed here.CLEANUP-TARGET-OBJECTCLEANUP-CURRENT-ITEMCLEANUP-WM-POSSIBLE-NEXT-SWEEP-ITEMS
In the best-fitting version of the strategy, the first five menu items are considered as possible candidates. The source code for this version of the rule is as follows. The comments after semicolons explain how the rule works.
31
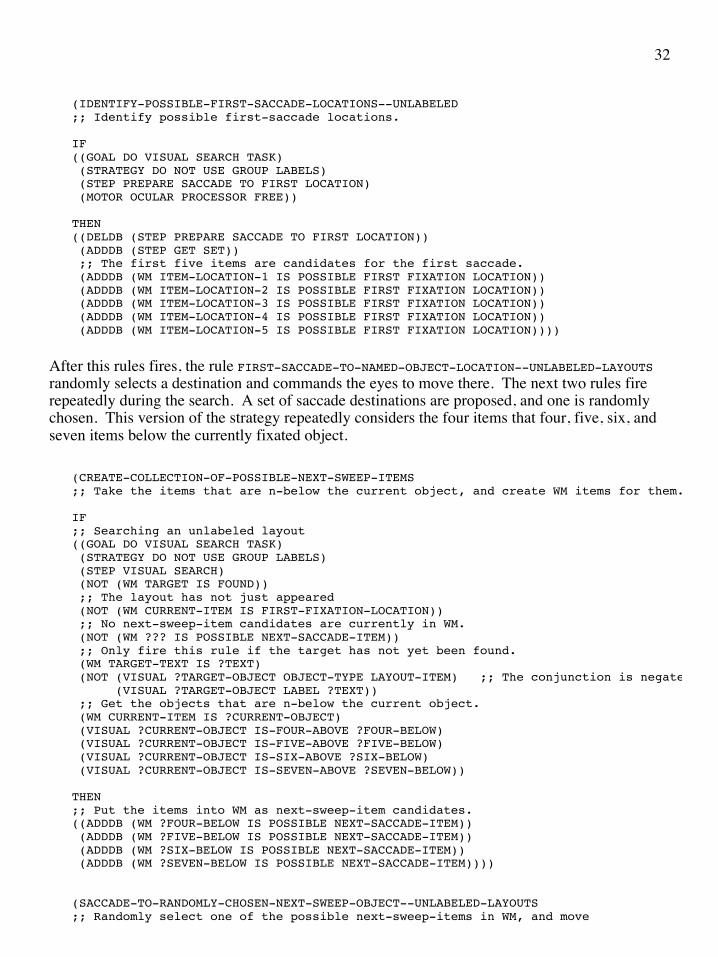
(IDENTIFY-POSSIBLE-FIRST-SACCADE-LOCATIONS--UNLABELED;; Identify possible first-saccade locations.
IF((GOAL DO VISUAL SEARCH TASK) (STRATEGY DO NOT USE GROUP LABELS) (STEP PREPARE SACCADE TO FIRST LOCATION) (MOTOR OCULAR PROCESSOR FREE))
THEN((DELDB (STEP PREPARE SACCADE TO FIRST LOCATION)) (ADDDB (STEP GET SET)) ;; The first five items are candidates for the first saccade. (ADDDB (WM ITEM-LOCATION-1 IS POSSIBLE FIRST FIXATION LOCATION)) (ADDDB (WM ITEM-LOCATION-2 IS POSSIBLE FIRST FIXATION LOCATION)) (ADDDB (WM ITEM-LOCATION-3 IS POSSIBLE FIRST FIXATION LOCATION)) (ADDDB (WM ITEM-LOCATION-4 IS POSSIBLE FIRST FIXATION LOCATION)) (ADDDB (WM ITEM-LOCATION-5 IS POSSIBLE FIRST FIXATION LOCATION))))
After this rules fires, the rule FIRST-SACCADE-TO-NAMED-OBJECT-LOCATION--UNLABELED-LAYOUTS randomly selects a destination and commands the eyes to move there. The next two rules fire repeatedly during the search. A set of saccade destinations are proposed, and one is randomly chosen. This version of the strategy repeatedly considers the four items that four, five, six, and seven items below the currently fixated object.
(CREATE-COLLECTION-OF-POSSIBLE-NEXT-SWEEP-ITEMS;; Take the items that are n-below the current object, and create WM items for them.
IF;; Searching an unlabeled layout((GOAL DO VISUAL SEARCH TASK) (STRATEGY DO NOT USE GROUP LABELS) (STEP VISUAL SEARCH) (NOT (WM TARGET IS FOUND)) ;; The layout has not just appeared (NOT (WM CURRENT-ITEM IS FIRST-FIXATION-LOCATION)) ;; No next-sweep-item candidates are currently in WM. (NOT (WM ??? IS POSSIBLE NEXT-SACCADE-ITEM)) ;; Only fire this rule if the target has not yet been found. (WM TARGET-TEXT IS ?TEXT) (NOT (VISUAL ?TARGET-OBJECT OBJECT-TYPE LAYOUT-ITEM) ;; The conjunction is negated. (VISUAL ?TARGET-OBJECT LABEL ?TEXT)) ;; Get the objects that are n-below the current object. (WM CURRENT-ITEM IS ?CURRENT-OBJECT) (VISUAL ?CURRENT-OBJECT IS-FOUR-ABOVE ?FOUR-BELOW) (VISUAL ?CURRENT-OBJECT IS-FIVE-ABOVE ?FIVE-BELOW) (VISUAL ?CURRENT-OBJECT IS-SIX-ABOVE ?SIX-BELOW) (VISUAL ?CURRENT-OBJECT IS-SEVEN-ABOVE ?SEVEN-BELOW))
THEN;; Put the items into WM as next-sweep-item candidates.((ADDDB (WM ?FOUR-BELOW IS POSSIBLE NEXT-SACCADE-ITEM)) (ADDDB (WM ?FIVE-BELOW IS POSSIBLE NEXT-SACCADE-ITEM)) (ADDDB (WM ?SIX-BELOW IS POSSIBLE NEXT-SACCADE-ITEM)) (ADDDB (WM ?SEVEN-BELOW IS POSSIBLE NEXT-SACCADE-ITEM))))
(SACCADE-TO-RANDOMLY-CHOSEN-NEXT-SWEEP-OBJECT--UNLABELED-LAYOUTS;; Randomly select one of the possible next-sweep-items in WM, and move
32

;; the eyes to that item. Delete all of the remaining WM items.
IF;; Searching an unlabeled layout((GOAL DO VISUAL SEARCH TASK) (STRATEGY DO NOT USE GROUP LABELS) (STEP VISUAL SEARCH) (NOT (WM TARGET IS FOUND)) ;; Only fire this rule if the target has not yet been found. (WM TARGET-TEXT IS ?TEXT) (NOT (VISUAL ?OBJECT OBJECT-TYPE LAYOUT-ITEM) ;; The conjunction is negated. (VISUAL ?OBJECT LABEL ?TEXT)) ;; Choose one of the next-sweep-item candidates currently in WM. (WM ?NEXT-OBJECT IS POSSIBLE NEXT-SACCADE-ITEM) (RANDOMLY-CHOOSE-ONE ?NEXT-OBJECT) ;; Make sure the eye has landed on the current object. (WM CURRENT-ITEM IS ?CURRENT-OBJECT) (VISUAL ?CURRENT-OBJECT FOVEA YES) (MOTOR OCULAR MODALITY FREE))
THEN((DELDB (WM CURRENT-ITEM IS ?CURRENT-OBJECT)) (ADDDB (WM CURRENT-ITEM IS ?NEXT-OBJECT)) (SEND-TO-MOTOR OCULAR MOVE ?NEXT-OBJECT)))
Systematic Group-Label Search Strategy
The rules for the systematic group-label search strategy are almost identical to those written for the noisy systematic strategy, above, except for Substrategy #5 “Find the Target.” For searching labeled layouts, this substrategy is expanded into two, one for finding the group, and one for finding the target in the group. The rules include:
5a. Find the target group with a systematic search of the group labels.FIRST-SACCADE-TO-GROUP-LABEL-LOCATIONIDENTIFY-THE-FIRST-CURRENT-GAZE-ITEMSACCADE-TO-THE-NEXT-GROUP-LABEL-IN-ORDERTARGET-GROUP-IS-FOUND
5b. Find the target with a systematic search in the group.START-SYSTEMATIC-SEARCH-IN-TARGET-GROUPSACCADE-TO-NEXT-SWEEP-ITEM-DOWN-IN-TARGET-GROUPTARGET-IS-LOCATED-SO-STOP-SCANNING
6. Click on the target.SCANNING-IS-STOPPED-MOVE-GAZE-AND-CURSOR-TO-TARGETPREPARE-TO-PUNCH-MOUSE-BUTTON-ON-TARGETPUNCH-MOUSE-BUTTON-ON-TARGET
The PPS production rules for the streamlined systematic group-label search are listed next. In this strategy, the two rules for identifying the target group and starting the within-group search are combined into one, as are the two rules for identifying the target and moving the cursor to it. The full source code for the rules marked with an * are listed after the outline.
5a. Find the target group with a systematic search of the group labels.FIRST-SACCADE-TO-GROUP-LABEL-LOCATIONFIRST-SACCADE-TO-THE-NEXT-GROUP-LABEL-AFTER-LAYOUT-APPEARS
33
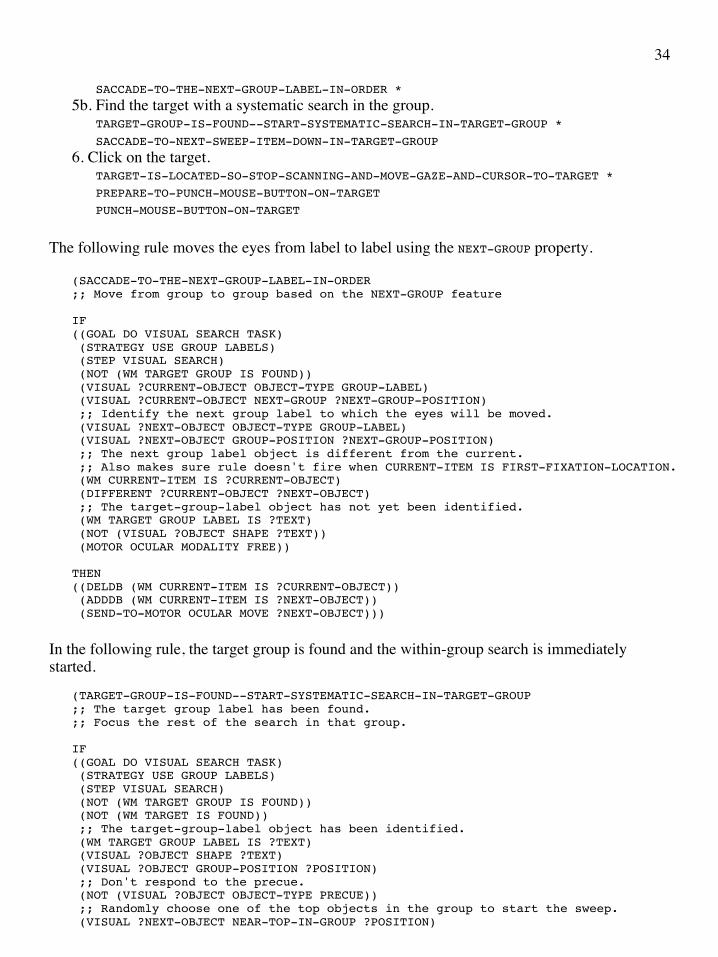
SACCADE-TO-THE-NEXT-GROUP-LABEL-IN-ORDER *5b. Find the target with a systematic search in the group.
TARGET-GROUP-IS-FOUND--START-SYSTEMATIC-SEARCH-IN-TARGET-GROUP *SACCADE-TO-NEXT-SWEEP-ITEM-DOWN-IN-TARGET-GROUP
6. Click on the target.TARGET-IS-LOCATED-SO-STOP-SCANNING-AND-MOVE-GAZE-AND-CURSOR-TO-TARGET *PREPARE-TO-PUNCH-MOUSE-BUTTON-ON-TARGETPUNCH-MOUSE-BUTTON-ON-TARGET
The following rule moves the eyes from label to label using the NEXT-GROUP property.
(SACCADE-TO-THE-NEXT-GROUP-LABEL-IN-ORDER;; Move from group to group based on the NEXT-GROUP feature
IF((GOAL DO VISUAL SEARCH TASK) (STRATEGY USE GROUP LABELS) (STEP VISUAL SEARCH) (NOT (WM TARGET GROUP IS FOUND)) (VISUAL ?CURRENT-OBJECT OBJECT-TYPE GROUP-LABEL) (VISUAL ?CURRENT-OBJECT NEXT-GROUP ?NEXT-GROUP-POSITION) ;; Identify the next group label to which the eyes will be moved. (VISUAL ?NEXT-OBJECT OBJECT-TYPE GROUP-LABEL) (VISUAL ?NEXT-OBJECT GROUP-POSITION ?NEXT-GROUP-POSITION) ;; The next group label object is different from the current. ;; Also makes sure rule doesn't fire when CURRENT-ITEM IS FIRST-FIXATION-LOCATION. (WM CURRENT-ITEM IS ?CURRENT-OBJECT) (DIFFERENT ?CURRENT-OBJECT ?NEXT-OBJECT) ;; The target-group-label object has not yet been identified. (WM TARGET GROUP LABEL IS ?TEXT) (NOT (VISUAL ?OBJECT SHAPE ?TEXT)) (MOTOR OCULAR MODALITY FREE))
THEN((DELDB (WM CURRENT-ITEM IS ?CURRENT-OBJECT)) (ADDDB (WM CURRENT-ITEM IS ?NEXT-OBJECT)) (SEND-TO-MOTOR OCULAR MOVE ?NEXT-OBJECT)))
In the following rule, the target group is found and the within-group search is immediately started.
(TARGET-GROUP-IS-FOUND--START-SYSTEMATIC-SEARCH-IN-TARGET-GROUP;; The target group label has been found.;; Focus the rest of the search in that group.
IF((GOAL DO VISUAL SEARCH TASK) (STRATEGY USE GROUP LABELS) (STEP VISUAL SEARCH) (NOT (WM TARGET GROUP IS FOUND)) (NOT (WM TARGET IS FOUND)) ;; The target-group-label object has been identified. (WM TARGET GROUP LABEL IS ?TEXT) (VISUAL ?OBJECT SHAPE ?TEXT) (VISUAL ?OBJECT GROUP-POSITION ?POSITION) ;; Don't respond to the precue. (NOT (VISUAL ?OBJECT OBJECT-TYPE PRECUE)) ;; Randomly choose one of the top objects in the group to start the sweep. (VISUAL ?NEXT-OBJECT NEAR-TOP-IN-GROUP ?POSITION)
34

(RANDOMLY-CHOOSE-ONE ?NEXT-OBJECT) ;; Just so we can delete it (WM CURRENT-ITEM IS ?LAST-OBJECT) (MOTOR OCULAR MODALITY FREE))
THEN((DELDB (WM CURRENT-ITEM IS ?LAST-OBJECT)) (ADDDB (WM CURRENT-ITEM IS ?NEXT-OBJECT)) (SEND-TO-MOTOR OCULAR MOVE ?NEXT-OBJECT) (ADDDB (WM TARGET GROUP IS FOUND)) (ADDDB (WM TARGET-GROUP-POSITION IS ?POSITION))))
In the following rule, the target is found, and the eye and mouse movements to the target are initiated.
(TARGET-IS-LOCATED-SO-STOP-SCANNING-AND-MOVE-GAZE-AND-CURSOR-TO-TARGET
IF((GOAL DO VISUAL SEARCH TASK) (STEP VISUAL SEARCH) (NOT (WM TARGET IS FOUND)) ;; Target is not found yet. ;; The target is found. (WM TARGET-TEXT IS ?T) (VISUAL ?TARGET-OBJECT LABEL ?T) (VISUAL ?TARGET-OBJECT OBJECT-TYPE LAYOUT-ITEM) ;; Don't react to the precue! (MOTOR OCULAR PROCESSOR FREE) (WM CURSOR IS ?CURSOR-OBJECT) (MOTOR MANUAL PROCESSOR FREE))
THEN((DELDB (STEP VISUAL SEARCH)) (ADDDB (STEP PREPARE TO PUNCH MOUSE BUTTON ON TARGET)) (ADDDB (WM TARGET IS FOUND)) (ADDDB (WM TARGET-OBJECT IS ?TARGET-OBJECT)) ;; Needed for PUNCH below (SEND-TO-MOTOR OCULAR MOVE ?TARGET-OBJECT) (SEND-TO-MOTOR MANUAL PERFORM POINT RIGHT ?CURSOR-OBJECT ?TARGET-OBJECT)))
35

REFERENCESAnderson, J. R. (1982). Acquisition of cognitive skill. Psychological Review, 89(4), 369-406.
Anderson, J. R., & Lebiere, C. (Eds.). (1998). The Atomic Components of Thought. Mahwah, NJ: Erlbaum.
Anderson, J. R., Matessa, M., & Lebiere, C. (1997). ACT-R: A theory of higher level cognition and its relation to visual attention. Human-Computer Interaction, 12(4), 439-462.
Bouma, H. (1970). Interaction effects in parafoveal letter recognition. Nature, 226, 177-178.
Brogan, D., Gale, A., & Carr, K. (Eds.). (1993). Visual Search 2. London: Taylor and Francis Ltd.
Byrne, M. D. (2001). ACT-R/PM and menu selection: Applying a cognitive architecture to HCI. International Journal of Human-Computer Studies, 55, 41-84.
Card, S. K. (1983). Visual search of computer command menus. In H. Bouma & D. G. Bouwhuis (Eds.), Attention and Performance X: Control of Language Processes. London: Lawrence Erlbaum Associates, 97-108.
Card, S. K., Moran, T. P., & Newell, A. (1983). The Psychology of Human-Computer Interaction. Hillsdale, NJ: Lawrence Erlbaum Associates.
Cohen, K. M. (1981). The development of strategies of visual search. In D. F. Fisher, R. A. Monty, & J. W. Senders (Eds.), Eye movements, Cognition, and Visual Perception. Hillsdale, NJ: Lawrence Erlbaum Associates, 271-288.
Covrigaru, A., & Kieras, D. E. (1987). PPS: A Parsimonious Production System. (Tech. Rep. No. 26, TR-87/ONR-26). Ann Arbor: University of Michigan Technical Communication Program.
Cowan, N. (2000). The magical number 4 in short-term memory: A reconsideration of mental storage capacity. Behavioral and Brain Sciences, 24, 87–185.
Ehret, B. (2002). Learning where to look: Location learning in graphical user interfaces. Proceedings of ACM CHI 2002: Conference on Human Factors in Computing Systems, New York: ACM, 211-218.
Findlay, J. M., & Gilchrist, I. D. (1998). Eye guidance and visual search. In G. Underwood (Ed.), Eye Guidance in Reading and Scene Perception. Amsterdam: Elsevier, 295-312.
Galitz, W. O. (1996). The Essential Guide to User Interface Design: An Introduction to GUI Design Principles and Techniques. New York: John Wiley & Sons.
Gray, W. D., & Boehm-Davis, D. A. (2000). Milliseconds matter: An introduction to microstrategies and to their use in describing and predicting interactive behavior. Journal of Experimental Psychology: Applied, 6(4), 322-335.
Gray, W. D., John, B. E., & Atwood, M. E. (1993). Project Ernestine: Validating a GOMS analysis for predicting and explaining real-world task performance. Human-Computer Interaction, 8, 237-309.
Hornof, A. J. (1999). Computational models of the perceptual, cognitive, and motor processes
36
involved in the visual search of pull-down menus and computer screens. Doctoral dissertation in Computer Science and Engineering. The University of Michigan, Ann Arbor, Michigan.
Hornof, A. J. (2001). Visual search and mouse pointing in labeled versus unlabeled two-dimensional visual hierarchies. ACM Transactions on Computer-Human Interaction, 8(3), 171-197.
Hornof, A. J., & Kieras, D. E. (1997). Cognitive modeling reveals menu search is both random and systematic. Proceedings of ACM CHI 97: Conference on Human Factors in Computing Systems, New York: ACM, 107-114.
Hornof, A. J., & Kieras, D. E. (1999). Cognitive modeling demonstrates how people use anticipated location knowledge of menu items. Proceedings of ACM CHI 99: Conference on Human Factors in Computing Systems, New York: ACM, 410-417.
John, B., Vera, A., Matessa, M., Freed, M., & Remington, R. (2002). Automating CPM-GOMS. Proceedings of ACM CHI 2002: Conference on Human Factors in Computing Systems, New York: ACM, 147-154.
John, B. E. (1998). Cognitive modeling for human-computer interaction. Graphic Interfaces '98.
John, B. E., & Kieras, D. E. (1996). The GOMS family of user interface analysis techniques: Comparison and contrast. ACM Transactions on Computer-Human Interaction, 3(4), 320-351.
Kieras, D. E., & Meyer, D. E. (1996). The EPIC Architecture: Principles of Operation. (Published electronically at http://www.eecs.umich.edu/~kieras/epic.html).
Kieras, D. E., & Meyer, D. E. (1997). An overview of the EPIC architecture for cognition and performance with application to human-computer interaction. Human-Computer Interaction, 12(4), 391-438.
Kieras, D. E., & Meyer, D. E. (2000). The role of cognitive task analysis in the application of predictive models of human performance. In J. M. C. Schraagen, S. E. Chipman, & V. L. Shalin (Eds.), Cognitive task analysis. Mahwah, NJ: Lawrence Erlbaum.
Kieras, D. E., Wood, S. D., Abotel, K., & Hornof, A. (1995). GLEAN: A computer-based tool for rapid GOMS model usability evaluation of user interface designs. Proceedings of the ACM Symposium on User Interface Software and Technology, UIST ‘95, New York: ACM, 91-100.
Laird, J., Rosenbloom, P., & Newell, A. (1986). Universal subgoaling and chunking. Boston: Kluwer Academic Publishers.
Lee, E., & MacGregor, J. (1985). Minimizing user search time in menu retrieval systems. Human Factors, 27(2), 157-162.
Lohse, G. L. (1993). A cognitive model for understanding graphical perception. Human-Computer Interaction, 8, 353-388.
MacGregor, J., & Lee, E. (1987). Menu search: Random or systematic? International Journal of Man-Machine Studies, 26(5), 627-631.
Mullet, K., & Sano, D. (1995). Designing Visual Interfaces: Communication Oriented Techniques. Englewood Cliffs, New Jersey: Prentice Hall PTR.
Neisser, U. (1963). Decision-time without reaction-time: experiments in visual scanning.
37

American Journal of Psychology, 76, 376-385.
Nilsen, E., & Evans, J. (1999). Exploring the divide between two unified theories of cognition: Modeling visual attention in menu selection. CHI 99 Extended Abstracts, New York: ACM, 288-289.
Norman, K. L. (1991). The Psychology of Menu Selection: Designing Cognitive Control of the Human/Computer Interface. Norwood, N. J.: Ablex.
Pylyshyn, Z. W. (2001). Visual indexes, preconceptual objects, and situated vision. Cognition, 80, 127-158.
Ritter, F. E., Baxter, G. D., Jones, G., & Young, R. M. (2000). Supporting cognitive models as users. ACM Transactions on Computer-Human Interaction, 7(2), 141-173.
Ritter, F. E., & Young, R. M. (2001). Embodied models as simulated users: introduction to this special issue on using cognitive models to improve interface design. International Journal of Human-Computer Studies, 55, 1-14.
Salvucci, D. D. (2001). An integrated model of eye movements and visual encoding. Cognitive Systems Research, 1(4), 201-220.
Schraagen, J. M., Chipman, S. F., & Shalin, V. J. (Eds.). (2000). Cognitive Task Analysis. Mahwah, NJ: Lawrence Erlbaum.
Sperling, G. (1960). The information available in brief visual presentations. Psychological Monographs, 74, 1-29.
St.!Amant, R., & Riedl, M. O. (2001). A perception/action substrate for cognitive modeling and HCI. International Journal of Human-Computer Studies, 55, 15-39.
Staggers, N. (1993). Impact of screen density on clinical nurses’ computer task performance and subjective screen satisfaction. International Journal of Man-Machine Studies, 39, 775-792.
Treisman, A. (1986). Features and objects in visual processing. Scientific American, 255, 114B-125.
Tullis, T. S. (1988). A System for Evaluating Screen Formats: Research and Application. In R. Hartson & D. Hix (Eds.), Advances in Human-Computer Interaction. (Vol. 2). Norwood, NJ: Ablex, 214-286.
Vogel, E. K., Woodman, G. F., & Luck, S. J. (2001). Storage of features, conjunctions, and objects in visual working memory. Journal of Experimental Psychology: Human Perception and Performance, 27(1), 92-114.
Wolfe, J. M. (1998). Visual Search. In H. Pashler (Ed.), Attention. Philadelphia: Taylor & Francis Press, 13-73.
38