Embed Size (px)
Citation preview

COFFEE TO GO? The vital role of Indian coffee towards
ecosystem services and livelihoods
The vital role of Indian coffee towards
ecosystem services and livelihoods
October- 2012October- 2012

First published in October 2012
United Nations COP-11 CBD Edition
Published by
Centre for Social MarketsA-1 Hidden Nest, 16 Leonard Lane,Richmond Town, Bangalore 560 025,
India
Tel: + 91 80 40918235Website :www.csmworld.org
All rights reserved.
Centre for Social Markets.
COFFEE TO GO? The vital role of Indian coffee towards
ecosystem services and livelihoods
October 2012
United Nations COP-11 CBD Edition

For more information on this report
Contact Viva Kermani, Centre for Social Markets (CSM), Bangalore
Email: [email protected]

12
20STATUS OF BIODIVERSITY AND ECOSYSTEM SERVICES IN COFFEE PLANTATIONS
CONTENTS
PARTNERS
2
3
6CHAPTER 1
CHAPTER 2
CHAPTER 3
CHAPTER 4
1
ACKNOWLEDGEMENTS
FOREWORD
INTRODUCTION
OVERVIEW OF COFFEE CULTIVATION IN KARNATAKA
44
20
COFFEE CULTIVATION IN KARNATAKA ANALYSIS OF EIGHT COFFEE ESTATES FROM 1999 TO 2011
COFFEE CULTIVATION IN KARNATAKAIMPLICATIONS FOR LIVELIHOOD AND BIODIVERSITY
25
52
CHAPTER 5
CONCLUSIONS AND RECOMMENDATIONS
REFERENCES

In order to assess the extent of contribution of coffee growing practices of Southern India to ecosystem services and biodiversity, the Centre for Social Markets (CSM) and Karnataka Growers Federation (KGF) have convened a team, on behalf of the farmers and coffee plantation owners of the region, of the world’s leading practioners in the economic valuation of natural resources, entrepreneurship and coffee productivity and research. Centre for Social Markets (CSM)
CSM is an independent, non-profit organization promoting entrepreneurship for the triple bottom line – people, planet and prosperity. This study and report are being commissioned by CSM as part of its programme to promote sustainability and resilience in the Indian coffee sector in the face of multiple challenges. In partnership with KGF, CSM is interested in understanding the contribution of existing coffee farming practices to ecosystem services in forested areas and local economic development.
Karnataka Growers Federation (KGF)
KGF represents the coffee farmers across three districts of Karnataka and their initiative to assess the environmental linkages of their coffee in the context of climate change and the sensitive ecosystem they inhabit. KGF was formed out of the necessity of smaller growers associations joining together to have strength to make their voices heard at the national level. Its mandate is to provide increasing knowledge and capacity building among the growers. Wanting to conduct a scientific, empirical study to demonstrate the multiple benefits provided by coffee growers to the larger community, KGF partnered with the Center for Social Markets (CSM) to estimate the true economic value of shade-grown coffee. KGF brings a valuable ability to disseminate the findings of this study and transcend the results into practical actions with the capacity to mobilise and reach more than a million people in the region.
GIST Advisory
Led by Pavan Sukhdev, author of the UN study, The Economics of Ecosystems and Biodiversity (TEEB), GIST Advisory is a consultancy that assists governments in establishing systems for calculating the real value of ecosystem services and biodiversity for local communities and incorporating the value of nature into decision-making. GIST is the lead research partner in the study and its role is to highlight the economic value of shade-grown coffee in representative farms of Karnataka. It also seeks to explore potential or real impacts to local biodiversity and human welfare from climatic impacts and deforesta-tion activities.
Central Coffee Research Institute (CCRI), Chickmagalur District
A premier coffee research institute in Asia and under the wing of Coffee Board of India, CCRI is striving to evolve strategies aimed at increasing productivity and improvement is the quality of coffee of India. CCRI is instrumental in providing the ground level data for the study. Support has also been received by Coffee Board of India.
Café Coffee Day (CCD)
A division of India's largest coffee conglomerate, the Amalgamated Bean Coffee Trading Company Limited (ABCTCL) Coffee Day is Asia's second-largest network of coffee estates (10,500 acres) and 11,000 small growers . Started in 1996 in the city of Bangalore, today it is the largest organized retail cafe chain in the country. CCD has been a knowledge partner in this study.
A Pioneering Partnership
1

ACKNOWLEDGEMENTS
2
Kaavya Varma, Prof Lalit Kumar , Sanjib Jha , Nachiketa Das and Dhaval Negandhi from GIST Advisory Services for preparing the report
Jawaid Akhtar,The Chairman, Coffee Board, for his support to this study
Dr.Raghu Ramalu , Joint Director, Central Coffee Research Institute
Mr.H.R.Basanna, Mr. Mohan Kumar,Secretary of KGF, Mr. Teerthamallesh Treasurer, KGF
Mr.Y.S.Girish
Dr. Anand Titus Pereira
The office staff at Karnataka Growers Federation (KGF) and all its members
The President and members of Hassan District Planters' Association and all the Taluks , hoblis and associations of KGF
Anshu Ogra of JNU (Centre for Studies in Science Policy)
Krushika Team at Chikmagalur District
Suresh Chandra Dutta ,an avid photographer and also a coffee farmer, for providing the photopragphs for this report
Dr Kushalappa and his team at The Forestry College, Ponnampet , Kodagu , for their initial guidance
Thara Thomas (design)
Jwalamukhi Mudranalaya Private Limited,Bangalore (Printing) The team also acknowledges the invaluable insights and feedback from Pushpanath Krishnamurthy of Oxfam, GB, Dr Pradeep, President of KGF and Viva Kermani of CSM
The Center for Social Markets (CSM) and Karnataka Growers Federation(KGF) would like to thank the following for their support in making this report possible.

This explorative study is the first of its kind on coffee in India. It emphasises the link between the economic and ecosystem values of coffee production. A link upon which depend the livelihoods and interests of more than one million workers and 150,000 growers. A cultivating community that produces India’s unique shade-grown coffee under the forest canopy of more than 60 million trees, contributing simultaneously to tending a natural ecosystem and growing a unique economic asset.
The story of coffee in India (about 70% comes from the southern state of Karnataka) is the story of the small farmers (98.8 % of coffee farmers own small holdings) and the inspiring breadth of their vision. They grow their coffee under two tiers of shade, the forest canopy of the Western Ghats, a treasure trove of biodiversity and the water tower of peninsular India, a hill chain originally recognised as among the several global 'hotspots of biodiversity'.
Coffee is the world’s most widely traded tropical agricultural commodity and yet the singularly ecological growing practices of Indian coffee are but a little-known aspect of this globally popular beverage. The coffee beans of the districts of Kodagu, Hassan and Chikmagalur share their air and nutrients with other plants, vegetation and wildlife in a concert that contributes to biodiversity conservation, protects watersheds, generates rural livelihoods and soaks up greenhouse gas emissions.
As this study signals, coffee agro-forest systems can substantially aid in reducing the intensity of physical damages to the ecosystem by providing an alternative habitat to local biodiversity, and also by serving as a source of ecosystem services that are generally provided by natural forests. Our farmers and growers are willing and committed custodians of the richness of the Western Ghats – their coffee-growing practice helps prevent soil erosion, conserves the water that peninsular India thirsts for, maintains wildlife corridors, sequesters carbon and provides dependable livelihoods that feed into local socio-economic development.
The critical analysis found in this exploratory study – which scrutinises the linkages between coffee agro-systems and the extent of their impacts on ecosystem services – has come at a turning point for India’s coffee farmers and growers, for they are experiencing ever more frequently the effects of destabilising climate change. This change is affecting coffee production in India, and is causing the degradation of the invaluable ecosystem services provided by the shade-grown coffee cultivation practice. Just as the small coffee farmers deserve recognition of (and support to) their unique role in biodiversity conservation, so too do they need the outcomes from a partnership such as this which aids them in their efforts to adapt to a changing climate.
This is the central message of ‘Coffee To Go’, the result of a partnership which will undertake further research in the main coffee-growing districts of South India to capture the impacts of climate change on the coffee production of small and medium producers over the last decade. The strengths and synergies of this partnership reposition the Indian coffee farmer as a student
How we brewed ‘Coffee To Go’
3

of the risks that climate change has brought into their green hills, and who rises to the challenge by being steadfast towards biodiversity protection, thereby ensuring the real benefits of conservation and traditional coffee farming practices to local communities as they confront a climate and resource-constrained world. It is part of a broader multi-stakeholder Sustainable Coffee Initiative started by CSM and KGF in 2011 which involves leading private sector, academic, governmental and non-governmental partners.
4
Viva Kermani Chief Operating Officer Centre For Social Markets
Dr Pradeep NandipurPresident
Karnataka Growers Federation

5

The coffee plant is a woody perennial dicotyledon of the genus Coffea (Rubiaceae)
consisting of over 80 species; out of which only two species are important for
production of coffee beans – Arabica (Coffea arabica) and Robusta (Coffea
canephora). Characterised by a complex value chain and despite rapid rise in retail
prices and economic turmoil; in 2011, the value of global coffee exports touched
the US$ 24.9 billion mark (ICO 2012).
Globally, the coffee industry employs around 25 million farmers – mostly
smallholders – in over 50 developing countries (IBRD 2004) and historically coffee
exports have been linked to the development ‘success’ stories of Brazil, Colombia
and Costa Rica. As of 2010, coffee exports accounted for over 10 per cent of total
foreign exchange earnings for several African and Latin American developing
countries including Burundi, Ethiopia, Rwanda, Uganda, Nicaragua, Honduras and
Guatemala. With the emergence of large actors in the global coffee value chain and
increasing productivity; global coffee prices have averaged a 3 per cent per year
decline for Arabica and 5 per cent for Robusta, since 1970. This has culminated in
significant socio-economic disturbances such as high labour displacement,
worsening poverty, balance of payment problems and lost revenues across coffee
producing countries based upon prevailing industry structures in each (ibid).
Chapter 1: Introduction
Coffee is the world’s most valuable agricultural commodity and the
ubiquitous cup of coffee is characterized by massive economies of
production, consumption and trade.
Intr
oduc
tion
1
6

The crop’s susceptibility to climatic disturbances, such as increase in temperatures
and extreme rainfall events, is being compounded by the emerging paradigms of
coffee production that diverge from traditional shade-grown biodiversity-friendly
coffee agroforestry management practices – including more fertiliser and pesticide
use, non-shade farming and intensification. The inherent linkage between
biodiversity and ecosystems services (BES) and coffee cultivation has a vital role in
the commodity’s future; including permanent impact on the livelihoods of the
millions who depend on it.
Coffee, as the popular legend goes, was discovered sometime around 800 A.D.
when an Ethiopian goatherd named Kaldi noticed that the goats of his herd
became abnormally frisky after consuming the cherry-red berries from a certain
shrub (Taylor 1965). Intrigued, the goatherd tried some of the berries himself and
later passed on the berries to the abbot of a local monastery, who discovered that
it enabled him to remain alert even after the long evening prayer. Passing from the
abbot to other monks and monasteries, the knowledge of the berries began to
spread east and eventually reached the Arabian Peninsula. Coffee beans were first
roasted and brewed in Arabia in 1000 A.D., and by the 13th century coffee drink-
ing had become an integral part of Islamic culture; spreading along with Islam to
North Africa, eastern Mediterranean and India. As a result of the strict regulation
of monopoly of the bean; the concentration of coffee production was limited to
Africa and Arabia until the 1600’s (National Geographic Society 1999).
Discovery of the bean
The journey out of Arabia
Coffee made its appearance in India in the 16th century from the Yemeni port of
Mocha, carried by the Muslim saint Baba Budan (Ukers 1935). Planted in the hills
of the Western Ghats, coffee cultivation was soon embraced by several
indigenous and ethnic tribes of the region. From there, coffee travelled to
South-East Asia, when the Dutch founded the first European-owned coffee estate
in Java, Indonesia, in 1969. Passing from the hands of the Dutch, in 1714, the
coffee sapling travelled to France and to the court of Louis XIV and from there
Introduction
1
7

to the hands of a young naval officer named Gabriel Mathieu de Clieu, who
brought it to the Latin American island of Martinique. In 1727, the Brazilian
government obtained its first coffee seedlings from Martinique. Taking instantly
to the climate, Brazilian coffee production yielded huge harvests and by the
second half of the 19th century coffee production had expanded throughout the
most important agricultural areas of Brazil (Monaco, L.C., 1977).
Post-independence, coffee emerged as an important export commodity for India,
and currently India accounts for 4.5 per cent of the global coffee production. In
2011, India exported a total of 344,606 tonnes of coffee (including re-export),
earning a foreign exchange of US$ 1048.5 million (Coffee Board, 2012).
The traditional coffee growing areas of India comprise of Karnataka, Kerala and
Tamil Nadu, with Andhra Pradesh, Orissa and the North Eastern Region
constituting the non-traditional areas. From 1950 to 2012, the total area under
coffee cultivation in India has increased from 92,523 hectares to over 409,690
hectares, with Karnataka accounting for around 229,658 hectares (56.1 per cent)
of the total area and 226,335 million tonnes (70.7 per cent) of total national
production (Coffee Board, 2012).
Although India is the only country that grows all its coffee under shade (ibid), by
Current state of coffee cultivation in India
Intr
oduc
tion
1
8

Human activity is unarguably the most important factor in contemporary
alteration of natural landscapes (Morris, 1995). However mosaic habitats such as
traditional coffee agro-forests are less susceptible to physical changes, especially
when of reasonable size and proximity to natural forests. This is evident by the fact
that the tree, bird and fungal diversity in coffee plantations in Kodagu were
comparable between adjacent protected forest and sacred groves (Bhagwat et al.,
2005). As a result coffee agro-forest systems can aid in effectively reducing the
intensity of physical damages to the ecosystem by providing alternative habitat to
local biodiversity and source of ecosystem services generally provided by natural
forests, including prevention of soil erosion, water sequestration, wildlife
corridors, carbon sequestration and livelihoods for the poor.
A critical link between coffee and ecosystems
retaining the traditional practice of cultivating coffee under a three-tiered canopy;
the expansion of coffee cultivation in the 1970’s and 1980’s took place at the
expense of native vegetation cover (Garica et al., 2007) and has been associated
with the trend of replacing native shade trees with the exotic Silver Oak (Grevillea
robusta) due to economic pressures discussed in subsequent chapters of this
report. There has been a marked by a shift from Arabica to Robusta cultivation
over the years, with the area under Arabica cultivation declining from 73 per cent
of total area under coffee cultivation to 49 per cent, and Robusta cultivation
increasing from 27 per cent to 51 per cent to total area, from 1950 to 2012 (Coffee
Board, 2012).
Introduction
1
9

Intended as a purely scoping study, this report undertakes a critical analysis that
considers the inter-linkages between coffee agro systems and the extent of their
impacts on ecosystem services, with a particular focus on carbon. The long-term
effects of climate change through variability in rainfall and underground water
levels and their impacts on coffee growing practices in Karnataka are further taken
into account. This is vital as a positive correlation between the existing farming
practices on the plantations of the Karnataka Growers Federation and the
ecosystem they inhabit is globally significant, as it could represent a best-practice
example of coffee farming with low impacts on ecosystem services and
biodiversity; a relationship that would then need to be preserved, scaled and
replicated.
Intr
oduc
tion
1
10

11

India is the fifth largest coffee producer in the world, with 2 per cent of global
area under coffee contributing to around 4 per cent of global coffee production.
Important varieties of coffee grown in India include Kents (an early variety of
Arabica noted for its exceptional cup quality); S.795 (a high yield Arabica noted for
its superior cup quality and tolerance to leaf rust); Cauvery (an Arabica descendent
incorporating the superior quality of Caturra and resistance of Hybrido-de-Timor
variety); Sln.9 (an award winning Arabica variety that inherits the superior cup
quality of Tafarikela); S.274 (an improved variety of Robusta) and CxR (a hybrid of
Congensis and Robusta). Acclaimed for the unique flavour of its berries and
plantation biodiversity; coffee cultivation in India encompassed an area of over
409,690 ha and generated a yield of over 314,000 MT, in the year 2011-2012
(Coffee Board, 2012). More recent trends, based on the post-blossom estimates
released by the Coffee Board, show that India’s coffee output is likely to cross
325,300 MT in the year 2012-2013.
Chapter 2: Overview of Coffee Cultivation in Karnataka
Trends in coffee production
and rationale for study
Over
view
2
12

Traditional coffee growing regions in India constitute of the southern states of
Karnataka (229,658 ha), Kerala (84,948 ha) and Tamil Nadu (31,344 ha).
Together they represent over 84.5 per cent of total area under coffee cultivation
and produce 97.9 per cent of total coffee in India (ibid). Karnataka alone
accounts for over 56.1 per cent of total area under coffee cultivation and over
70.4 per cent of total coffee production in India – making it the most significant
coffee producing state of the country.
A global coffee supply deficit caused by frost in Brazil in the mid nineties caused
prices to shoot up abnormally and in turn prompted a surge in production that
substantially altered the industry production structure (Venkatachalam, L.,
2005); leading to a surge in growth of Indian coffee production, in the early part
of 2000. But, with production increasing at an average annual rate of 3.6 per
cent, compared to demand increasing only by 1.5 per cent; global coffee prices
fell substantially touching a 100-year low in 2004-2005 (ICO 2002). Stranded with
increased costs of production, many growers – especially small and medium
landholders – were heavily indebted, and many not having recovered were
forced to switch to other crops or sell their estates.
Bordering the Arabian Sea to its west, Karnataka covers an area of 191,976 sq.
km. or 5.83 per cent of total geographic area of the country; making it the
eighth largest state of India. Comprising of a population of over 61.13 million (in
2011) and having a literacy rate of 67 per cent; Karnataka is one of the high
economic growth states, with a Gross State Domestic Product (GSDP) growth of
8.9 per cent (at constant price) in the fiscal year 2010-2011 (CII, 2012). The
average GSDP growth rate between 2005-2006 and 2011-2012 is about 8.36 per cent
Composition of Karnataka’s Economy
Overview
2
13

(see Figure.2.1); with the Primary Sector contributing 17.24 per cent of total
GSDP for the year 2011-2012.
Source: Compiled from Central Statistical Organisation (CSO) (As on 01.03.2012)
Karnataka is the manufacturing hub for many of the largest public sector
industries in India, including Hindustan Aeronautics Limited, National Aerospace
Laboratories, Bharat Heavy Electricals Limited, etc. and houses various premier
science and technology research centres including Indian Space Research
Organization, Central Power Research Institute, Bharat Electronics Limited and the
Central Food Technological Research Institute. The state is well known for its
knowledge-based industries such as IT, biotechnology and engineering, with IT
and ITeS exports valued at US$ 16.3 billion, in 2008-09 (ibid).
Out of the 17.24 per cent contribution of the Primary Sector to state GSDP,
agriculture accounts for 13 per cent of the total GSDP (Government of Karnataka,
2011). Over 123,000 sq km of land is under cultivation; constituting 64.6 per cent
of the total geographical area of the state (Government of Karnataka, 2006). Since
2005, the agricultural sector has suffered from wide variations in annual growth
rate over the previous years, including negative growth in the year 2006-07
due to drought (see Figure.2.2). Despite such volatility, Karnataka is the largest
Figure.2.1. Karnataka GSDP and Growth Rate at 2004-2005 prices (in ` Crores)
0
50000
100000
150000
200000
250000
300000
350000
2004-05 2005-06 2006-07 2007-08 2008-09 2009-10 2010-11 2011-12
GSDP
10
12.6
7.1
5.2
8.9
6.4
Over
view
2
14

Coffee cultivation in India is said to have begun in the 16th century when the saint
Baba Budan planted the first seven beans in the Chandragiri hills of Karnataka.
Extensively incorporated in the local culture, traditional coffee growing practices
included a well-defined two-tier mixed shade canopy comprising of evergreen
leguminous and native trees. Traditional cultivators also grew a wide variety of
spices and fruit as auxiliary crops such as pepper, cardamom, vanilla, orange,
banana and areca nut intertwined in the shade canopy. The traditional coffee
agroforestry system developed and sustained by cultivators in Karnataka is one of
the most diverse production systems in the world; involving a unique cultivation
method utilising the shade of natural tree cover without negatively impacting the
local forest ecosystem. Coffee plantations under such agro forestry system sustain
biodiversity in the form of flora and fauna and in turn contribute to valuable
ecosystem services in terms of hydrological services and carbon sequestration
(CAFNET, 2011).
producer of coffee, raw silk and coarse cereals among Indian states, with
horticulture constituting over 40 per cent of income generated from agriculture in
the state (CII, 2012).
Coffee Cultivation Practices in Karnataka
Figure.2.2. Annual sectoral growth rate, Karnataka (2005-2011)
Source: Economic Survey of Karnataka 2010-2011
10
-2.6
11.9
0.5
4.3
5.9
8.6
17.6
10.6
-2.1
8.5
6.9
13.7
10.8
14.5
7.9
3.7
9.7
-5
0
5
10
15
20
2005-06 2006-07 2007-08 2008-09 2009-10 2010-11
Agriculture & Allied Industry Services
Gro
wth
Ra
te (in
%)
Overview
2
15

Coffee cultivation is a laborious and costly process. Beginning with the selection of
a site for a plantation, to choosing the right variety of coffee suitable to the
climatic and topographical features of the selected location, to preparation of the
land for cultivation and maintaining the soil properties ideal for coffee; there are
several requirements that must be fulfilled precisely in order to obtain a successful
harvest. In general, coffee plantations in Karnataka (and rest of India) are located
on gentle to moderately sloped land at an elevation of 1000-1500 meters above
mean sea level (MSL), with a cool equable climate of 15-20° C for Arabica and
500-1000 meters above MSL, with hot and humid climate of 20-30° C for Robusta.
The land is divided into blocks of convenient size by laying out footpaths and roads
in between and the bush undergrowth on the ground is cleared by uprooting and
in situ burning; while maintaining the top canopy of permanent shade trees and a
lower second and temporary canopy of trees such as Dadap (Erythrina
lithosperma) (Pradeepkumar, T., et al., 2008).
In 2011-2012, coffee plantations covered an area of 229,658 ha (109,128 ha of
Arabica cultivation and 120,530 ha of Robusta cultivation) in Karnataka (see
Figure.2.3); with a corresponding production of 221,000 MT of coffee (79,825 MT
of Arabica and 141,175 MT of Robusta). Overall, the state produces 70.4 per cent
of total coffee in India, including 25.4 per cent of Arabica and 45 per cent of
Robusta of the country (Coffee Board, 2012). According to estimates, the share of
coffee as a percentage of agricultural output in individual district’s GDP is quite
significant, with coffee cultivation accounting for 29.48 per cent of the agricultural
output of Chikmanglur; 45.36 per cent of agricultural output for Kodagu; and
12.65 per cent of agricultural output for Hassan.
With an expansion in coffee planting and bearing area, the traditional coffee
growing areas have reached a plateau and further expansion is mostly in
non-traditional areas; forcing traditional coffee growing regions like Karnataka to
Over
view
2
16

Figure.2.3. Total area under coffee in Karnataka
Source: Compiled from Coffee Database 2012, Coffee Board of India
The last few decades have witnessed a fundamental shift in the characteristic of
coffee holdings in Karnataka. As a result of easier management, better
pest-resistance and large scale development of irrigation systems most estates,
which previously cultivated Arabica coffee under a dense mixed cover of native
shade, are being converted into Robusta coffee, which requires sparse shade
(Garcia et al, 2009). However, in current scenarios where canopy cover is reduced
and the need for artificial interventions has increased, the advantage with
Robusta, is that it requires less pesticides relative to Arabica. Tree composition of
coffee agro forests are also being affected by changes in management practices
such as drip irrigation for stimulating mass flowering of coffee and increased use
increase productivity gains and economise on the cost (Venkatachalam, L., 2005).
With global commoditisation of coffee, traditional landscape systems such as rice
paddies with adjoining domestic forests are becoming less valuable, and over the
last 40 years many have been converted into coffee estates (Garcia et al., 2007).
225458
226900
227340
227550
229658
227750
0 50000 100000 150000 200000 250000
2007-08
2008-09
2009-10
2010-11
2011-12
2012-13
Total Coffee Cul�va�on
Robusta Cul�va�on
Arabica Cul�va�on
Overview
2
17

Summary
of pesticides and fertilisers in some cases. Due to the long gestation between
replanting of coffee saplings and production of cherries; many cultivators are
forced to supplement their income by harvesting timber from their estates.
Although the loss of native trees is being compensated by planting greater
number trees, including the fast-growing exotic Sliver Oak (Grevillea robusta); this
has resulted in a decrease in canopy cover and the population of native tree
species in some estates.
With the global coffee industry having undergone a transition in the latter half of
the preceding century, marked by an increase in coffee production at the cost of
the environment in major producing countries such as Brazil and Vietnam; the case
for eco-friendly practices and biodiversity conservation potential of Indian,
especially Karnataka’s, coffee agroforests is growing. With consumers across the
globe becoming increasingly conscious of the need to recognise conservation
efforts at a local level and willing to pay for such; there is a real opportunity for
Karnataka’s coffee growers to avail of economic benefits by capitalising on the
environmental and livelihood benefits of their traditional practices.
Over
view
2
18

19
Western Ghats comprise of over 160,000 sq km, of which 31,514 sq km are located in
Karnataka, and play a crucial role in the rainfall spell of Peninsular India by
intercepting the south-western monsoon winds. The birthplace of eastward flowing
rivers, such as the Cauvery, that sustain over 245 million people dependent on these
river systems in the region; the Western Ghats are home to 139 species of mammals,
508 species of birds and 179 species of amphibians (Rao, V.S., 2012).
Chapter 3: Status of Biodiversity and Ecosystem Services
in Coffee Plantations
Coffee cultivation in Karnataka is centred in the Western Ghats region
– one of the biodiversity hotspots of the world – by interspersing
coffee within the native forests.
The Western Ghats are amongst the oldest tropical forest landscapes existing even
today. Human activity in the Western Ghats, mostly in the form of hunting and
gathering, dates back over 12,000 years (Chandran, 1997), with agricultural
landscapes first making their appearance over 2000 years before present
(Ranganathan et al., 2008).
The Western Ghats are amongst the eight hottest biodiversity hotspots in the
world in terms of five factors; the number of endemic plants, endemic vertebrates,
endemic plant/area ratio, endemic vertebrate/area ratio and remaining primary
vegetation as per cent of original extent (Myers et al., 2000). Over a third of the
geographical area of the Western Ghats are covered by forests of various types –
from evergreen to semi-green forests, moist forests to deciduous forests – and are
home to several endangered species. Out of the 1073 vertebrate species found in
the region, 355 are endemic to the region; similarly out of 4780 plant species, 2180
are endemic to the region (ibid).
The Western Ghats – Global Biodiversity Hotspot
Stat
us o
f Bio
dive
rsity
and
Eco
syst
ems
3
20

Figure. 3.1. Western Ghats & major coffee growing districts in Karnataka
Source: Self generated from UNEP Grid
Deforestation and biodiversity in coffee agro forest systems
in the Western Ghats
Although clear felling and logging were stopped in the early 1980’s in the West-
ern Ghats with the enactment of the Forest Conservation Act of 1980; most of the
forest areas, including those in Protected Areas (PAs), continue to be under
various extractive and non-extractive uses by human communities living within
and close to the forests (Daniels et al., 1995; Karnath el al., 2006). Between 1920
and 1990, there was a 40 per cent decline in the forest cover in the Western Ghats,
with conversion of forest areas to open or cultivated lands accounting for 76 per
cent and conversion to coffee plantations accounting for 16 per cent of this loss
(Menon and Bawa, 1997). In addition to outright loss of forest cover, there has
been widespread degradation in the form of reduced forest canopies (less than
20 per cent canopy cover) as a result of extractive and non-extractive use of
forests (Jha et al., 2000).
Status of Biodiversity and Ecosystem
3
21
Moreover, recent years have seen a major shift in the shade canopy for one that
largely resembled traditional polycultures to monocultures of Silver Oak – primarily
for economic benefits derived from harvesting of timber (Damodaran, 2002).
Currently the Western Ghats consist of a protected area (PA) network of 13,595 sq.
km. (Critical Ecosystem Partnership Fund, 2007), with plantations of commodity
crops covering over 10,000 sq. km. – predominantly in the central and southern
regions – including coffee plantations of over 3000 sq. km. This highly fragmented
PA network is embedded with structurally complex human-modified landscapes
featuring greater habitat heterogeneity, such as coffee agro forests, which also act
as secondary wildlife habitats for foraging or as corridors enabling movement
between PAs. Such human-modified landscapes are characterised by a high degree
of endemism and species richness as a result of highly restricted distribution and
small scale species turnover across hill ranges or drainages (Pascal, 1988;
Vasudevan et al., 2006). Take for example the newly discovered frog species,
Philautus dubios, which is presently known to occur only at locations in
human-modified landscapes (Biju and Bossuyt, 2006). Given the predicted and
documented shift in species distribution in response to global climate change
(Parmesan and Yohe, 2003), landscapes between PAs take on increased
importance as potential paths for migration of flora and fauna (Donald and Evans,
2006); especially for key species such as elephants, tiger, leopard and gaur. In such
a scenario, intensification of coffee cultivation and rapid departure from
traditional land use practices may lead to a complete conversion of such
landscapes from multi species use to singular human use; resulting in irreversible
loss in biodiversity value in the region. Hence, the continuation of such practices by
Karnataka coffee growers in the face of economic disincentives, is a highly
commendable and extremely important service that must be recognised as such.
Ecosystem services provided by the Western Ghats
Although not much is known regarding the capacity of various coffee systems
within the Western Ghats to regulate water balance (infiltration, ground water
production), soil erosion, local climate, pollination, soil productivity, etc, but
the general view is that high tree cover with a variety of tree species increases
the capacity to generate these functions (cf. Steffan-Dewenter et al. 2007). For
example, in coffee agro ecosystems ants, birds and bats can control important
Stat
us o
f Bio
dive
rsity
and
Eco
syst
ems
3
22

Impact of climate change on coffee cultivation
The current changes in global climate are a repercussion of human activities over
the past two centuries; most notably the increasing use of fossil fuel and
mineralisation of organic matter as a result of land use and resource extraction.
The relationship between GHG emissions and increase in global temperature is
well documented by science; but what is of even more note is the impact that such
climatic changes will have on traditional sectors such as agriculture and the millions
of livelihoods dependent upon it. The International Coffee Organisation considers
climate change as the most important amongst several factors that may affect
global coffee production, with smallholders (who produce most of the world’s
coffee) being the most vulnerable group (International Trade Centre, 2010).
Coffee is noted for being a very difficult crop which requires very specific climatic
conditions – with temperature and rainfall conditions being the two main drivers
behind yield – and rising temperatures are expected to render certain existing
producing areas less suitable or even completely unsuitable for coffee cultivation;
resulting in shift in production to alternative crops. Although the complete impact
of climate change on coffee cultivation is difficult to predict, a few important long term
impacts as noted by the International Panel of Climate Change (IPCC) are as follows:
coffee pests (Borkhataria et al 2006; Philpott et al 2008) and pollinator activity
could increase close to natural forest fragments (Rickets 2004, Klein et al. 2008).
Such coffee agro forests cover a gradient of carbon storage, sequestration and
evapotranspiration levels depending on shade-practices and management. In
general, coffee agro forests are expected to have similar hydrologic functions
(green water and blue water flux) and carbon sequestration services relative to
native forest types they have replaced (Krishnaswamy et al 2009; Olchev et al,
2008; Kumar and Nair, 2006).
Biodiversity conservation has received considerable attention in the past decade,
with research indicating both human and non-human impacts as well as inter and
intra generational impacts of biodiversity loss. Although the benefits of biodiver-
sity conservation accrue to the local and global community at large, the costs are
most often borne by the local community who depend on forests for various
goods and services (Pearce and Moran, 1994; Shyamsundar and Kramer, 1996;
Shyamsundar and Kramer, 1997).
Status of Biodiversity and Ecosystem
3
23

Already extreme climatic events such as the El Nino have had a direct impact on
coffee production in Andean countries like Columbia – where during its
occurrence rainfall decreases while sun intensity and temperature increase –
causing production to fall in low-lying regions with low retention of moisture and
high exposure to sunlight, which receive less than 1500 mm rainfall per year. In
Nicaragua, climatic variations between El Nino and La Nina have contributed to
extreme variations in coffee production, with incomes of small farmers crashing
from US$ 2300 in one year to only US$ 600 in the next (Hagger, J., 2008). In Brazil,
dramatic changes in production and revenue have been predicted as a result of
increasing temperatures, with a conservative 1°C increase in temperature reducing
production by 80,829 tonnes and revenues by US$ 113,160,600; and a 5.8°C
increase in temperature reducing production by 334,165 tonnes and revenues by
US$ 467,831,000 (Pinto et al., 2007).
Changes in yield due to changes in seasonal climates,
including erratic rainfall
Changes in production potential in relation to factors such
as yield, land availability and longer/shorter growing seasons
Crop response to changes in atmospheric conditions
Changes in price and trade patterns due to climate change
Changes in food security and livelihood, i.e., number of people
at risk of hunger and poverty
Water run-off and related water stress
Stat
us o
f Bio
dive
rsity
and
Eco
syst
ems
3
24
Cha
incl
Cha
as y
Cro
ChaCha
Cha
at r
Cha
Wa
The fall in quality of coffee bean
Reductions in yield
Increase in incidence of pests and disease
Increase in irrigation, fertiliser and pesticide costs
The
RedRed
IncInc
IncInc
The four major impacts of climate change on coffee production in the short run are

Coffee agro forest systems in Karnataka play a vital role in maintaining the flow of
biodiversity and ecosystem services in the Western Ghats region, second only to
natural forests. Over the years, traditional coffee cultivation practices have
ensured that the biodiversity and ecosystems services value of such agro forests
remains intact. But with the rapid transformation of the market and production
systems, incentives for maintaining such values are fast eroding as farmers look
towards intensification to cover the increasing costs of cultivation. This in turn has
real negative impacts on biodiversity via loss in species richness and by exacerbat-
ing human-wildlife conflict in the region, as human activity transforms traditional
foraging and migratory habitats of native wildlife. Also, the impact of such intensi-
fication is evident in the degradation in soil quality via soil runoff and nutrient
depletion, which further increases fertiliser costs; and in the increase in incidence of
pests and disease and pesticide and maintenance costs associated with preventing
it. Coffee agroforests provide key regulating and supporting ecosystem services of
which they themselves are main beneficiaries – making them an ideal
self-sustaining ecosystem. Hence, it is only prudent that an effort be made to
ensure continuation of such services and for reversing any existing declining trends.
Summary
Status of Biodiversity and Ecosystem
3
25
In Karnataka, the main issues facing coffee growers are erratic and variable rainfall,
increasing temperature, degradation in soil quality and greater incidence of pest and
disease. This in turn has led to an exponential increase in cost of cultivation, with
farmers becoming more and more dependent on fertilisers, pesticides and irrigation.
Many of the small growers are unable to meet the rising production costs and
remain in debt – which further affects their capacity to manage coffee cultivation in
subsequent years.

Stat
us o
f Bio
dive
rsity
and
Eco
syst
ems
3
26
Currently conservation priorities in the Western Ghats are more about preventing
further loss of existing diversity than reintroducing diversity in agroforestry
systems (Garcia et al., 2009). In order to change this, farmers need to be given the
choice to join incentive schemes for conserving native habitat within the
agricultural matrix, which generates on a timely basis previously defined financial
rewards commensurate to opportunity costs incurred.

27

Chapter4: Coffee Cultivation in Karnataka – Analysis of Eight
Coffee Estates from 1999 to 2011
Coffee estates included in current study
The main motive of the authors is to understand and highlight the linkages
between coffee cultivation practices in Karnataka and the continuation of BES
services that coffee agroforestry systems provide; allowing for significant
economic benefits to both coffee cultivators as well as the population of the
region. Although the importance of biodiversity conservation in coffee
agroforestry systems has been a focus area for research – backed by substantial
amount of literature; the study revealed that there was a clear lack of the same on
the provisioning of ecosystem services (ES) in Karnataka. Hence this present
analysis is a purely indicative study that takes on the role of laying the foundations
for a detailed study in the future.
Bound by stringent time constraints and given a lack of exhaustive primary and
secondary data sources, our current study is focused on analyzing eight sample
coffee estates (each over 100 acres each) chosen randomly from across the districts
of Chikmanglur, Hassan and Coorg (Kodagu) (See Figure.4.1 and Table 4.1).
Figure.4.1. Map of coffee estates sites included in study
Source: Self generated from UNEP Grid
Anal
ysis
ofC
offe
e Es
tate
s fr
om 19
99- 2
0114
28
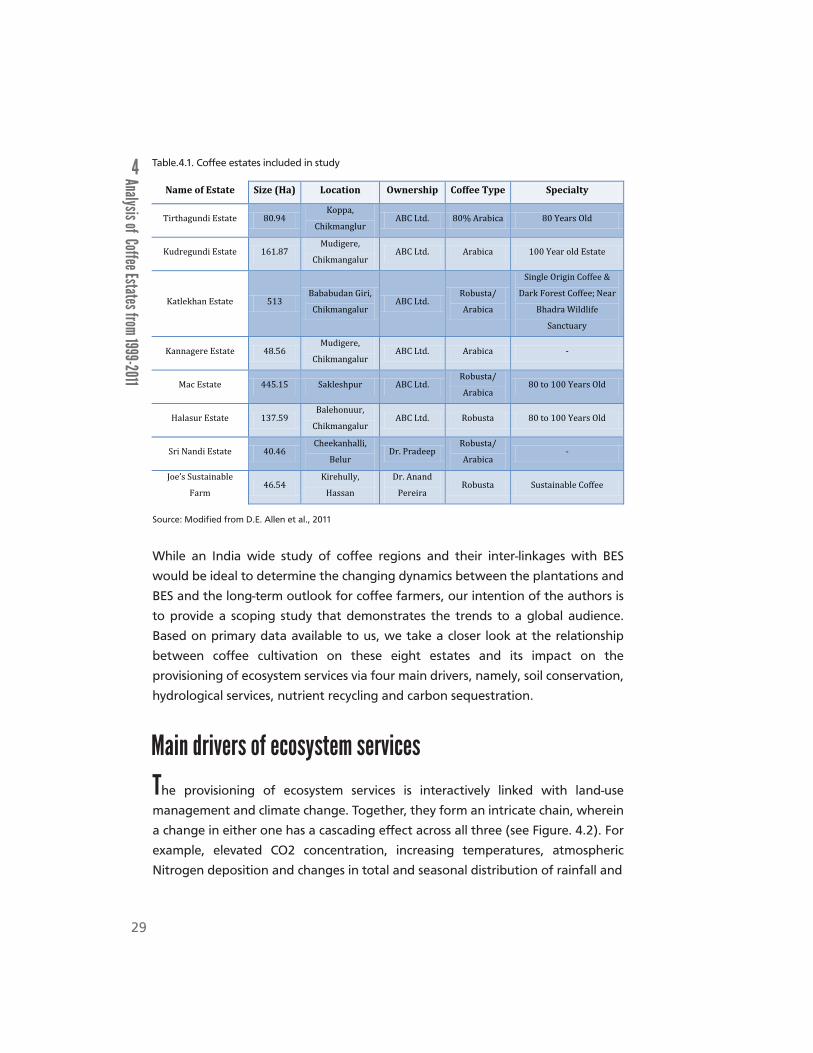
Table.4.1. Coffee estates included in study
While an India wide study of coffee regions and their inter-linkages with BES
would be ideal to determine the changing dynamics between the plantations and
BES and the long-term outlook for coffee farmers, our intention of the authors is
to provide a scoping study that demonstrates the trends to a global audience.
Based on primary data available to us, we take a closer look at the relationship
between coffee cultivation on these eight estates and its impact on the
provisioning of ecosystem services via four main drivers, namely, soil conservation,
hydrological services, nutrient recycling and carbon sequestration.
Main drivers of ecosystem services
The provisioning of ecosystem services is interactively linked with land-use
management and climate change. Together, they form an intricate chain, wherein
a change in either one has a cascading effect across all three (see Figure. 4.2). For
example, elevated CO2 concentration, increasing temperatures, atmospheric
Nitrogen deposition and changes in total and seasonal distribution of rainfall and
Source: Modified from D.E. Allen et al., 2011
Name of Estate Size (Ha) Location Ownership Coffee Type Specialty
Tirthagundi Estate 80.94 Koppa,
Chikmanglur ABC Ltd. 80% Arabica 80 Years Old
Kudregundi Estate 161.87 Mudigere,
Chikmangalur ABC Ltd. Arabica 100 Year old Estate
Katlekhan Estate 513 Bababudan Giri,
Chikmangalur ABC Ltd.
Robusta/
Arabica
Single Origin Coffee &
Dark Forest Coffee; Near
Bhadra Wildlife
Sanctuary
Kannagere Estate 48.56 Mudigere,
Chikmangalur ABC Ltd. Arabica -
Mac Estate 445.15 Sakleshpur ABC Ltd. Robusta/
Arabica 80 to 100 Years Old
Halasur Estate 137.59 Balehonuur,
Chikmangalur ABC Ltd. Robusta 80 to 100 Years Old
Sri Nandi Estate 40.46 Cheekanhalli,
Belur Dr. Pradeep
Robusta/
Arabica -
Joe’s Sustainable
Farm 46.54
Kirehully,
Hassan
Dr. Anand
Pereira Robusta Sustainable Coffee
Analysis of Coffee Estates from 1999-2011
4
29

Land-use Management
Climate ChangeEcosystem Services
• Increasing temperature
• Altered precipitation
• Increasing GHG
concentration
• Warmer & shorter winters
• Rising sea levels
• Increased gene transfer rate
• Virulent pathogens
• Altered yields
• Farming
• Public use
• Conservation
• Soil conservation
• Hydrological services
• Nutrient recycling
• Carbon sequestration
• Pollination & pest
control
• Increased genetic pool
& adaptability
extreme events such as droughts and floods will have an impact on soil biological
processes, C and N cycling, and consequently on soil structure and erosion events,
nutrient availability and plant diseases, and hence on ecosystem functionality and
agricultural productivity (D.E. Allen et al., 2011).
Figure.4.2. Interactive linkage between land-use management, climate change and
provisioning of ecosystem services
Source: Modified from D.E. Allen et al., 2011
Indicators are a composite set of measurable physical, chemical and biological
attributes, which relate to functional processes and can be used to evaluate
ecosystem services status, as affected by management and climate change drivers.
Soil health indicators can be categorised into three categories; biological, chemical
and physical (see Table.4.2.), which may be used as an indirect measure of soil
function, serving to assess soil quality or health and its direction of change with
time, by linking functional relationships among measurable attributes and
monitoring for sustainable land management, including environmental impacts
(Dalal et al. 2003; Doran 2002; Doran and Zeiss 2000).
Anal
ysis
ofC
offe
e Es
tate
s fr
om 19
99- 2
0114
30

Table.4.2. Soil health indicators and relations to processes and functions under projected climate
change scenarios
Source: Modified from D.E. Allen et al., 2011
Table.4.3. Tree diversity in coffee agro forestry systems in Kodagu and in similar
systems elsewhere in the world
Country Region Species Richness (%)a
Similarity (%)b Reference
India Kodagu 121 62 Bhagwat et al., 2005
Cameroon South-western 35-36 5-13 Bobo et al., 2006
Ecuador Western 53-81 21-47 Lozada et al., 2007
Mexico Veracruz 97 87 Villavencio & Valdes, 2003
a Values derived from published data reporting species richness in coffee agro forestry systems and in neighbouring forest reserves.
Values >100 suggest agro forestry systems with species richness higher than that of neighbourhood forests due to presence of non-forest species b Values derived from published data reporting species richness in coffee agro forestry systems and in neighbouring forest reserves. Differences in
methods among studies mean the numerical comparisons shown here should be seen as only a rough guide
Source: Garica et al., 2009
Soil Health Indicators Soil Processes AffectedLandscape scale (direct determination or estimated
from pedotransfer functions)
Relevance to assess climate
change impacts
Physical
Soil Structure Aggregate stability, organic matter turnoverAggregation, surface seal, indication of water and chemical
retention and transportationMedium
PorosityAir capacity, plant available water capacity,
relative �ield capacity
Soil crusting, reduced seed germination, aeration, water
entryHigh
In�iltration Soil water availability and movement Potential for leaching, productivity, erosion High
Bulk Density Soil structural condition; compaction Volumetric basis for soil reporting Low
Soil Depth & Rooting Plant available water capacity, subsoil salinityProductivity potential; uncertain whether trends can be
discerned over long time periodsMedium
Soil/Plant Available
Water & Distribution
Field capacity, permanent wilting point,
macropore �low, textureWater and chemical retention and transportation; yield High
Soil Protective CoverSoil water and nutrient movement, soil
stabilisation, C and N �ixation
Soil physical movement, organic matter input and
movementMedium
Chemical
pH Biological and chemical activity thresholdsSoil acidi�ication, salinisation, electrical conductivity, soil
structural stabilityMedium
EC Plant and microbial activity thresholds Soil structural decline; leachable salts Medium
Plant available N, P, K Plant available nutrients and potential for lossCapacity for crop growth and yield; environmental hazard
(e.g. algal blooms)Medium
Soil Organic Matter
• Light fraction
or macro-
organic matter
• Mineralisable C
and N
• Plant residue decomposition, organic
matter storage and quality,
macroaggregate formation
• Metabolic activity of soil organisms, net
inorganic N �lux from mineralisation and
immobilisation
• Loss of organic matter, soil aggregate formation, total
organic C, soil respiration rate, nutrient supply
• Microbial activity, nutrient supply
• High
• High
Biological
Soil total C & N C and N mass and balance Soil structure, nutrient supply High
Soil Respiration Microbial activity Microbial activity High
Microbial Biomass C
& NMicrobial activity Soil structure, nutrient supply, pesticide degradation High
Microbial Quotients Substrate use ef�iciency Substrate quality High
Microbial Diversity Nutrient cycling and availability Biochemical activity, nutrient supply High
Other Microbiological
Indicators, Enzyme
Activity
Soil structure, labile carbon, Km, Vmax, Ki, Q10 Biochemical activity, nutrient supply High
Analysis of Coffee Estates from 1999-2011
4
31

For this study, the authors were able to extract primary soil health data of eight
sample estates from soil testing reports of individual blocks and secondary data
from available literature. Indicators are extrapolated from aforementioned
primary and secondary sources and used in analysis of soil conservation on the
sample estates, including average yield, average soil organic content, average pH,
average electrical conductivity and average soil nutrients (NPK). Similarly, for
water balance the authors have extrapolated average rainfall and average water
recharge capacity; average carbon sequestration potential for climate change;
whereas biodiversity and livelihood values are represented by possible economic
benefits of pollinator activity and average labour employment per year and its
contribution to income earning respectively.
Although land-use management practices in coffee agro forests in Karnataka have
evolved over time, they still retain strong traditional roots. This has allowed coffee
agro forests in the state to maintain a composition of species richness and native
canopy cover, with a high degree of similarity to neighbourhood forest reserves. Tree
diversity in coffee agro forest systems in Kodagu is the highest amongst similar
systems elsewhere in the world (see Table.4.3); but recent global trends at the
landscape level clearly point toward increased intensification of the cultivation
system and a further loss of biodiversity, as in Central America (Somarriba et al.,
2004; Vaast et al., 2005; Harvey et al., 2008). Therefore, it is essential for us to
understand the drivers behind these trends in order to identify similar land-use
management changes and determine their impacts on provisioning of ecosystem
services in the Western Ghats region of Karnataka.
Analysis of Coffee Agroforestry Systems in Karnataka
Soil OC is one of the most complex and heterogeneous components of soils and is
considered an important attribute of soil quality (or soil health) due to the various
functions it provides and/or supports. These functions include its contribution to
the charge characteristics of soils; its role as sink for and source of carbon (C) and
nitrogen (N); its regulation, albeit to a variable extent, of phosphorus and sulphur
cycling; its ability to complex with multivalent ions and organic compounds;
Soil Organic Content (O.C.)
Anal
ysis
ofC
offe
e Es
tate
s fr
om 19
99- 2
0114
32

By plotting the trend of soil O.C. and the average yield data, for our eight sample
estates from the years 1999 to 2011, we obtained mean values of 1.64 per cent for
soil O.C. and 883.17 kg/ha for average yield. Corresponding standard deviations
were 273.95 and 0.28 for average yield and soil O.C. respectively. Between 1999 and
2011, soil O.C and average yield display polar trends. Soil O.C. declined from 2.51 per
cent in 1999 to 1.15 per cent in 2002 (see Figure.4.3), while average yield increased
from 800 kg/ha in 1999 to 1219.43 kg/ha in 2001. In 2003, average yield declined
further to 600 kg/ha, whereas soil O.C increased to 2.73 per cent in 2005. Post-2005
though, both soil O.C and yield trends show a general decline, before simultaneously
increasing to 2.7 per cent and 1428.72 kg/ha respectively, in 2011.
Soil O.C. and yield
Figure.4.3. Yield-Soil O.C. trend for sample estates (1999 to 2011)
the provision of microbial and faunal habitat and substrates; its affecting
aggregate stability, trafficability, water retention and hydraulic properties (Haynes
2008; Weil and Magdoff, 2004). For this study, the authors have calculated the
trend of soil OC on the eight sample estates alongside yield and rainfall.
0.00
0.50
1.00
1.50
2.00
2.50
3.00
0.00
200.00
400.00
600.00
800.00
1000.00
1200.00
1400.00
1600.00
Yiel
d (k
g/ha
)
Year
Yield (Kg /Ha)
Soil O.C. (%)
SoilO.C (%
)
Source: Compiled by the authors
Analysis of Coffee Estates from 1999-2011
4
33

Plotting the trends for average soil O.C and average rainfall (mean value of
3704.87 mm, with standard deviation of 44.29); we observe that a decline in soil
O.C. corresponds with a decline in average rainfall over the years (see Figure.4.4).
While average soil O.C declined from 2.51 per cent to 1.19 per cent between 1999
and 2001, average rainfall declined from 3395.47 mm to 1670.05 mm during the
same period. The year 2005 and 2007 marked an increase in both, with average
rainfall of 3666.15 mm and 4773.30 mm and soil O.C. of 2.23 per cent and 2.10 per
cent respectively, before declining to 2563.96 mm and 1.36 per cent, in 2010. In
contrast, 2011 has been marked by an increase in average soil O.C to 2.70 per cent
while average rainfall declined to 2109.39 mm.
Soil O.C. and rainfall
Soil OC has two main functions: a) it helps in the provisioning of ecosystem services
and b) it helps in increasing productivity. Although the exact degree of the positive
relationship between soil OC and yield was extremely difficult to predict for this
study given lack of data. Nevertheless, literature available on the subject confirms
that an increase in soil OC has in general a positive impact on agricultural produc-
tion. Hence the increase in average yield in coffee observed in the sample estates
can be attributed to the increasing trend in soil OC observed in most of the years,
among other things. The factors believed to have caused a decline in soil OC in
random years include less than average rainfall (see Figure.4.4) and increasing use
of pesticides and herbicides as berry borer infestation spread across the traditional
coffee growing states at an annual average spread of 6.5 per cent, from 2001 to
2009 (Coffee Board, 2012), among other things. Anal
ysis
ofC
offe
e Es
tate
s fr
om 19
99- 2
0114
343434344343444444443333333333333434

Rainfall has strong positive linkages with temperature, litter-fall and soil moisture;
and is essential for composting of leaf litter. Commenting on the importance of
organic matter input from tree pruning and litter-fall in maintaining or increasing
soil, Dulormne et al. (2003) reported a 15% increase in soil carbon to a 20 cm depth
after 10 years of silvopasture, with Gliricidia sepiumin the French Antilles. Similarly,
in Nigeria, Kang et al. (1999), found higher organic carbon concentrations (10.4
and 10.2 g kg-1 for Gliricidia and Leucaena, respectively) associated with addition
of pruning biomass as mulch (4.87 and 7.10 t ha-1 yr-1, respectively). According the
A. Youkhana and T. Idol (2009) study in Hawaii – which has similar sub-humid
tropical climatic conditions as in the Western Ghats – mulch additions significantly
increased soil carbon in the top 20 cm by 10.8 Mg ha-1. Since rainfall is a dominant
factor leading to litter-fall, temperature regulation and moisture availability; the
occurrence of strong fluctuations in average annual rainfall trends with an
apparent cycle of 12-14 years culminating in lower to very low levels of rainfall in
the years 2014 to 2016 (CAFNET, 2011), would have a negative impact on soil OC in
the absence of other factors.
Source: Compiled by the authors
Figure.4.4. Rainfall-Soil O.C. trend for sample estates (1999 to 2011)
0.00
0.50
1.00
1.50
2.00
2.50
3.00
0.00
1000.00
2000.00
3000.00
4000.00
5000.00
6000.00
Rai
nfal
l (m
m)
Year
Rainfall (mm)
Soil O.C. (%)
SoilO.C (%
)
Analysis of Coffee Estates from 1999-2011
4
35

Figure.4.5. Rainfall-Yield trend for sample estates (1999 to 2011)
Source: Self generated
There is a strong positive linkage between rainfall and coffee yield, with drought
years leading to a decline in production and years with above average rainfall
increasing production; significant differences may occur due to the timing of rainfall.
In 2009, heavy and unseasonal rainfall led to heavy losses in coffee production,
Climate variation in the form of erratic rainfall appears to be having an impact on
coffee production in Karnataka (see Figure.4.5). Volatility in trend of average
rainfall has increased in frequency, with 2001, 2003, 2008 and 2011 being low
rainfall years; while 2000, 2004, 2007 and 2009 received very high rainfall. These
fluctuations in rainfall coincide with fluctuations in coffee production to create
extreme highs and lows in coffee production, with 2001 and 2004 producing
around 1219.43 50-kg bags of coffee and 1356.18 50-kg bags of coffee respectively;
while in 2002 and 2003 production almost halved to 700 50-kg bags of coffee and
600 50-kg bags of coffee respectively. Post-2003, trends in average yield and
average rainfall have both declined. In 2011, average yield increased to 1428.72
50-kg bags of coffee despite a fall in average rainfall to 2109.39 mm, as a result of
productivity gains due to better soil quality and availability of subsurface water for
irrigation.
Rainfall and yield
0.00
200.00
400.00
600.00
800.00
1000.00
1200.00
1400.00
1600.00
0.00
1000.00
2000.00
3000.00
4000.00
5000.00
6000.00
Rai
nfal
l (m
m)
Year
Rainfall (mm)
Yield (Kg /Ha)
Yield (kg/ha)
Anal
ysis
ofC
offe
e Es
tate
s fr
om 19
99- 2
0114
36

Box.4.1. Case Study – More trees less loss: Nitrogen leeching losses decrease
with increasing biomass in coffee agroforests in Costa Rica (K.L. Tully et al.,
2012).
Study conducted on eight coffee agroforests, in Costa Rica’s Central Valley near Turrialba, based on
monthly N and P concentrations measured in soil water using tension lysimeters (at 15 and 100 cm)
between October 2008 and September 2009, and a water balance model – including effects of human
interventions (fertilizer type and quantity), biology (shade trees), and chemistry (soil properties) on
nutrient leaching losses – revealed that practices such as tree pruning and litter collection for mulch
application enabled significant increases in soil C and N in the top 20 cm, of up to 10.8 and 2.12 Mg ha-1
respectively.
Given the optimal ranges of soil N, P and K for coffee cultivation of 280-560 kg/ha,
9-22 kg/ha and 125-250 kg/ha respectively (Coffee Board, 2012); we can see that
there is an imbalance in soil nutrient, with average N content being less and P and
K being far greater than the recommended ranges. Nutrient cycling, especially N,
is intimately linked with soil OC cycling (Weil and Magdoff 2004). Moreover, N
losses decline with increasing shade tree biomass and density – as tree density
increases; so does plant N demand – which provides a sink for added N (K.L. Tully
et al., 2012). Systems with high species and functional diversity have an increased
Nutrient balance (N, P, K)
Nutrient balance for nitrogen (N), phosphorous (P) and potassium (K) content
was obtained from soil analysis data from across the sample estates on an annual
basis. Based on data, we obtained mean values of 158.26 kg/ha, 42.79 kg/ha and
315.72 kg/ha, with corresponding standard deviations of 2.61, 2.18 and 5.09 for N,
P and K respectively.
especially in Arabica production (Balaji, F., 2010). Similarly, in 2010, rainfall
occurring after the blossoming stage for Arabica coffee plants delayed the harvest
and lowered crop quality (U.S. Department of Agriculture, 2011). With the
occurrence of extreme rainfall events on the rise in Western India (Goswami et al.,
2006; Guhathakurta et al., 2010), the long-term trend of coffee production in
Karnataka is likely to face greater uncertainties.
Analysis of Coffee Estates from 1999-2011
4
37

The world’s soils contain a large stock of C, estimated at 2157–2293 Pg to a depth
of 1m, comprising 1462–1545 Pg in organic forms and 695–748 Pg as carbonate
(Batjes, 1996). Organic C in the surface 30 cm, which is most liable to change as a
result of management or climate change, is estimated at 684–724 Pg: about twice
the quantity of C currently in CO2 in the atmosphere (D.S. Powlson et al., 2011).
Given the contribution of coffee agroforestry systems in sequestering carbon (ICO,
2012), to obtain the average C sequestered in sample estates, carbon
sequestration values from the CAFNET study were used as a benchmark for carbon
stored in tree, coffee, soil and litter. Given soil OC (%) and soil structure; the
authors have extrapolated the average values of the carbon present in the tree,
coffee, soil and litter in the sample estates by taking percentage ratios from
CAFNET. The results (see Figure.4.6) show that average C sequestration capacity in
the estates has varied from year to year, with a maximum average C sequestration
of 20667.1 kg ha-1 in the year 2005 and a minimum average C sequestration of
8126.68 kg ha-1 in the year 2002.
Carbon Sequestration
capacity to retain nutrients due to greater number of opportunities to capture
nutrients (Tilman et al., 1996). Also, the presence of trees helps reduce the vertical
hydrological flux as the deep and extensive network of tree roots can utilize more
water (Seyfried and Rao, 1991). Hence, composition of shade trees has direct
relationship with soil nutrient balance and the declining trend of tree species
diversity in coffee agroforests is likely to have some bearing on the nutrient
imbalance observed in coffee estates in Karnataka.
Anal
ysis
ofC
offe
e Es
tate
s fr
om 19
99- 2
0114
38

Water Balance
Estimates for water balance are extrapolated from the primary subsurface water
data of the sample estates and secondary data, based on the assumption that the
average values of subsurface water from one estate are an indicative value for the
rest of the region. The results (see Figure.4.7) show that in 1999 rainfall and
subsurface water levels were 3395.47 mm and 15 ft respectively. In the year 2001,
Figure.4.6. Total C sequestered in sample estates (1999 to 2011)
Source: Self generated
0
5000
10000
15000
20000
25000
Carb
on (k
g/ha
)
Year
Average C Sequestered (kg/ha)
Coffee agroforestry systems can aid in increasing the C sequestration of agro
ecosystems via plant biomass and soil organic matter (Albrecht and Kandji, 2003),
since they have a higher input of organic material to the soil compared to single-
crop systems and they also increase recycling of nutrients within the system
(Oelbermann et al., 2006). Also, trees help stabilize soils against erosion and
reduce soil disturbance through modified management practices (Ataroff and
Monasterio, 1997). Furthermore, mulching has the capacity to reduce evaporation
from the soil surface and thus to conserve soil water over a long period (Sands et
al., 1999).Analysis of Coffee Estates from
1999-2011
4
39

Figure.4.7. Subsurface water level & average rainfall in Sri Nandi Estate (1999 to 2010)
Source: Compiled by the authors
following a deficit, the rainfall declined to 1670.05 mm and simultaneously
subsurface water level dropped to 30 ft. With a normalisation in rainfall from 2004
onwards, the subsurface water level has returned to 15 ft and remained constant
over the years.
0.00
5.00
10.00
15.00
20.00
25.00
30.00
35.00
0.00
1000.00
2000.00
3000.00
4000.00
5000.00
6000.00
Rai
nfal
l (m
m)
YearRainfall (mm)
Subsurface Water (ft)
Subsurface Water Level (ft)
Rainfall has a direct impact on subsurface water since coffee growers in Karnataka
are predominantly dependent on artificial water bodies like shallow tanks and
wells for their irrigation needs, which also act as groundwater recharging bodies.
Although, groundwater recharge depends on various factors other than rainfall,
such as evapotranspiration, soil moisture characteristics, etc.; infiltration capacity
has a positive correlation with soil porosity and organic matter present in coffee
agroforestry systems. The authors estimate that overall coffee agroforestry
systems in Karnataka have an average water recharging capacity of 8.582 million
m3 and generate an economic value of INR 20.59 million (2008) (USD 0.37 million,
the INR to USD conversion factor taken is 54.61, this being the six-month average
until early October 2012).
Anal
ysis
ofC
offe
e Es
tate
s fr
om 19
99- 2
0114
40

Rainfall, temperature and wind are the main climatic factors influencing soil
erosion. When the amount of rain water is in excess to the absorption capacity of
the soil, movement of water on soil surface causes run-off. According to the
Central Soil & Water Conservation Research Training Institute, Dehradun,
approximately 16 tonnes/ha of top soil is eroded annually in India – four times the
permissible limit of 4 tonnes/ha – affecting the nutrient balance, since eroded soil
particle carry away with them attached nutrients to streams and rivers. Thick
canopies, found in traditional polyculture agroforestry systems not only help in
reducing soil run-off by breaking the through-fall of rain (i.e. percentage of
rainwater that falls directly on the ground causing soil run-off), they also enable
retention of soil moisture content by covering soil with a thick mulch layer of
organic matter. Studies in Costa Rica show that runoff as a percentage of total
rainfall was lower in agroforestry system (5.4 per cent) than monoculture (8.4 per
cent) (P. Cannavo et al., 2011).
Coffee agroforests are characterised with good canopy, good undergrowth, leaf
litter and interception help prevent soil erosion – thereby preventing loss of major
nutrients like NPK and organic matter. The authors have used a replacement cost
method; replacing nitrogen lost due to soil erosion by urea (46% N); phosphate by
DAP; and potash by muriate of potash. According to estimates, coffee agroforests
in Karnataka help prevent soil loss of up to 1818.6 million kg (i.e., 8602.81 kg/ha).
The economic value of nutrient loss in soil erosion prevented by coffee agroforests
is estimated at INR 177.53 million. (USD 3.25 million) (2008). This number is of
some significance, given the increase in extreme rainfall events and decline in tree
density in coffee agroforests across the region in recent years.
Soil ErosionAnalysis of Coffee Estates from 1999-2011
4
41

Climate change has a direct impact on coffee production and management
practices of coffee agroforests in Karnataka. Intensification in monoculture
practices is slowly transforming the traditional agroforestry landscape by reducing
shade tree density and soil quality. Combined with continued increase in GHG
emission via burning of fossil fuel and deforestation; temperatures in Karnataka
and throughout India are projected to continue to rise during this century
(Christensen et al., 2007). IPCC’s mid-range scenario for future emissions of heat-
trapping gases projects a warming of about 2.5°C in Karnataka by 2100; leading to
a projected to increase in both annual rainfall totals and the number of extreme
rainfall events along with climate warming (Rupa Kumar et al., 2006). This is likely
to contribute to a 4–10 per cent decrease in overall crop production in South India
by the end of the century, even under a low–emissions scenario (Lal, M., 2011).
Summary
Anal
ysis
ofC
offe
e Es
tate
s fr
om 19
99- 2
0114
42

43

Livelihoods in coffee agroforestry systems
Chapter 5: Coffee Cultivation in Karnataka – Implications for
Livelihood and Biodiversity
Coffee agroforestry systems in Karnataka support a large population of mostly poor
and indigenous tribal communities. An analysis of the coffee growers shows that out
of the 67,181 coffee holdings in Karnataka in 2007-2008, 65,846 (or 98 per cent)
holdings belonged to small farmers with less than 10 ha of land holdings (accounting
for about 24.43 per cent of the total planted coffee area in the state) who depend
largely on coffee for their income.
The coffee agroforests of Karnataka comprise of a
fragmented landscape, with a high density of
remnant forest patches, protected areas and
wildlife sanctuaries dispersed side by side.
The coffee agroforests of Karnataka comprise of a fragmented landscape, with a
high density of remnant forest patches, protected areas and wildlife sanctuaries
dispersed side by side. This has led to the emergence of a unique mosaic for
biodiversity in a region that is already known for the high richness and endemic
nature of its flora and fauna. Several species, particularly elephants, although
primarily located within the PA habitat, use the coffee agroforests as a secondary
habitat for foraging and as corridors for movement across PAs – bringing them in
direct conflict with coffee cultivators, but also increasing the opportunity for access
to water, food and security that would not be present in non-coffee farms that tend
be more intensive in human presence, vehicle movement, etc.
Impl
icat
ions
for L
ivel
ihoo
ds a
nd B
iodi
vers
ity
5
44

Historically, coffee plantations in Karnataka depend upon and provide livelihood
to a large number of daily migrant workers, including women and indigenous
tribal communities settled in the surrounding forest areas. As per data released by
the Coffee Board of India, average daily number of workers employed on coffee
estates has increased from 423,451 in 2003-2004 to 479,453 in 2009-2010 (see
Figure.5.1).
Figure.5.1. Average daily workers employed in Coffee Plantations in Karnataka
Source: Compiled from Coffee Database 2012, Coffee Board of India
423451
434704
467227 468084
475688478459 479453
390000
400000
410000
420000
430000
440000
450000
460000
470000
480000
490000
2003-04 2004-05 2005-06 2006-07 2007-08 2008-09 2009-10
Average Daily Workers
No
. of W
ork
ers
Implications for Livelihoods and Biodiversity
5
45

Figure.5.2. Average number of workers employed in sample estates in 2012
Source: Compiled by the authors
Extrapolating data from the eight sample estates included in our study shows that
94,343 workers are employed daily in these estates (see Figure.5.2), at an average
of 64 workers per ha. Apart from income received as daily wages, workers
employed on the coffee estates also benefit from fuel-wood and other NTFP
available in the coffee agroforests; giving them access to resources and alternative
livelihood opportunities. Moreover, with over 60 per cent of the labour force
constituted of women; coffee agroforests also play a pivotal role in gender
empowerment. Loss in provisioning of ecosystem services essential for
continuation of coffee cultivation are major a threat to these livelihoods, since they
reduce profitability of cultivators by rendering existing producing areas unsuitable
for coffee cultivation, and in extreme cases can result in shift in production to
alternative crops requiring less labour.
There are several potential economic benefits accruing to coffee growers as a result
of interaction with wildlife in the coffee agroforests. Given the lack of primary data
of existing biodiversity within our sample estates, we take recourse in the existing
literature on the subject to draw parallels based on a benefits transfer approach.
Biodiversity in coffee agroforestry systems
5180
10360
32832
3108
28490
8806
2589
2979
0 5000 10000 15000 20000 25000 30000 35000
Tirthagundi Estate
Kudregundi Estate
Katlekhan Estate
Kannagere Estate
Mac Estate
Halasur Estate
Sri Nandi Estate
Joe’s Sustainable Farm Workers per Day
Number of Workers
Nam
e of Estate
Impl
icat
ions
for L
ivel
ihoo
ds a
nd B
iodi
vers
ity
5
46

Tropical forests, such as the Western Ghats, are home to forest-dwelling bees and
other pollinators who play a vital role in the pollination of Robusta (C. canephora)
coffee, since Robusta being a self-incompatible species is dependent on pollina-
tors for gene exchange between individuals (S. Krishnan et al., 2012). In Santa Fe,
Costa Rica, bee-pollination boosted the yield by 20 per cent, reduced the
incidence of pea-berries by 27 per cent and increased farm incomes by up to 7 per
cent; bringing in an extra US$60,000 annually for the coffee plantation (Ricketts
T. H et al., 2004). Also, the coffee plantations of Chikmagalur harbour a rich
assemblage of mammals, birds and butterflies including a number of rare and
endangered species unique to the Western Ghats; indicating that coffee planta-
tions have the potential to play a major part in wildlife conservation in the region
(A. Bali et al., 2007).
Traditional notions of a trade off between biodiversity and profitability in coffee
cultivation are a misnomer. Studies in Mexico demonstrate that high-biodiversity
coffee cultivation can be compatible with high profitability, and has significant
potential for conserving biodiversity in coffee-growing regions, but only as a
substitute for low biodiversity coffee cultivation, not forest (C. Gordon et al.,
2007). Moreover, biodiversity contributes to productivity, resilience in farming
systems, income generation, nutritional values, and food and livelihood security
for numerous societies; apart from providing ecosystem services on farms, such as
pollination, fertility and nutrient enhancement, insect and disease management,
and water retention. More bio diverse, lower input systems, particularly those
with non-coffee revenue generators, incur less economic risk, cushioning coffee
growers against coffee price dips. This economic advantage provides an
additional important conservation advantage.
The establishment costs of coffee cultivation are quite substantial and include cost
of renovation pits, contour drains, planting and cost of seedlings. In addition,
there are fixed costs by way of irrigation investments and fencing costs. Recurring
costs include material costs such as fertilizers, manure and pesticides and labour
costs for applying fertilizers, manure and pesticides, repairs and maintenance,
supervision, berry picking, etc.
Cost of coffee cultivation
Implications for Livelihoods and Biodiversity
5
47

Apart from the above mentioned costs, there are also significant external costs
incurred by coffee cultivators by way of wildlife damage costs and defensive costs
incurred in order to protect against wildlife damage. Recurrence of such costs, along
with intensification of agricultural practices, plays a significant role in the increasing
trend of human-wildlife conflict – the best example being human-elephant conflict
(HEC) in Karnataka (see Figure.5.3).
External costs of coffee cultivation and human-wildlife conflict
In 2011, the daily wages of coffee workers in Karnataka was approximately INR 247
per day, including wages and benefits (based on personal communication to
authors). This corresponds to an average cost of INR 15,808 per ha per day as
labour costs on our sample estates. Similarly, average daily capital expenditure of
INR 9,515 per ha per day is obtained by summing the average expenditure incurred
on diesel (required for tractors, irrigation and processing) of INR 6,426 per ha per
day and the average cost of maintenance of equipment and machinery of INR
3,089 per ha per day. Hence average total cost of coffee cultivation (capital cost +
labour cost) for our sample estates was INR 25,323 per ha per day, in 2011. Wage
rates of coffee workers have risen steadily over the years, increasing from INR 27
per day in 1994 to INR 140 per day in 2012 (Coffee Board, 2012). These numbers
are important as they demonstrate the extent of earnings of the local
communities and the livelihoods that would need to be compensated if climate
change affects the production capacity of the estates.
Impl
icat
ions
for L
ivel
ihoo
ds a
nd B
iodi
vers
ity
5
48

Source: P. Bal et al, (2011)
Figure.5.3. Temporal trend in annual number of crop damage incidents in Virajpet Division
from 1997 to 2008
Elephants cause 3–10 human casualties a year and cost the community INR
882,000 in crop-raiding compensations per year (Kulkarni et al. 2007; Bal et al.
2008). The main reasons behind the cause of HEC in Karnataka are the high
elephant density and major landscape changes due to degradation of natural
habitats. Although the intensity of HEC has increased over time and is exhibiting
new seasonal patterns (P. Bal, et al., 2011); based on the CAFNET study, for a
significant percentage of coffee growers (16 percent) HEC problem was only 5
years old – indicating that newer areas are becoming part of the conflict zone.
Implications for Livelihoods and Biodiversity
5
49

The increasing trend of elephant movement outside the forest and into nearby
coffee estates are a result of the decrease in the capacity of the forests to sustain
a growing elephant population due to degradation of original habitats, the
presence of artificial water bodies round the year, availability of better vegetation,
including preferred fruit trees on the estates and the evolving patterns of elephant
behaviour. This is evident in the fact that the regions of highest conflict are those
sharing boundaries with natural forests (CAFNET, 2011). In 1999-2000, the total
external costs for wildlife damage and defence were INR 803.1 per ha for coffee
holdings less than 2.5 ha in size, and INR 495 per ha for coffee holdings of 10 ha
and above sizes, in the Western Ghats region (K.N. Ninan, J. Sathyapalan, 2005).
Despite the growing trends of HEC and crop damage, there remains a wide
consensus among coffee growers on the importance of wildlife, especially for key
species such as elephants, in terms of their cultural, aesthetic and generational
values. According to an estimate, they are willing to spend 35.8 human days per
household for participatory elephant conservation amounting to over INR 6003
per household per annum in terms of foregone income (ibid); bearing testimony
to the positive attitude that local communities have towards biodiversity
conservation in general and for wildlife protection in particular.
In summary, biodiversity has been and continues to be an important part of coffee
agroforestry systems. It has the potential to provide multiple products and
services, facilitate organic production, and support the development of livelihoods
and eco-tourism enterprises. Maintaining and integrating trees and wildlife on
coffee farms is recommended to maintain and enhance the sustainability of coffee
production and the flow of benefits to the surrounding environment and society
at large.
Summary
Impl
icat
ions
for L
ivel
ihoo
ds a
nd B
iodi
vers
ity
5
50

It is evident that coffee estates have a clear link with aiding the preservation and
maintenance of ecosystem services such as soil OC, soil erosion and water
recharge. It is also apparent that rainfall patterns have an impact on coffee
productivity and that the estates of Southern Karnataka are then vulnerable to
rainfall variability with serious implications for livelihoods as climate change
creates erratic weather occurrences. While, the study is an indication of the trends
of the dynamics between the coffee estates and the ecosystem they inhabit, it is
also a preliminary analysis laying down the framework for a much needed in-depth
assessment of the suite of ecosystem services and biodiversity in coffee estates.
The economic value that coffee provides to the districts of Chigmangalur, Hassan
and Kodagu is evident based on the employment potential. It is also unmistakable
that the revenue generated by these coffee growing districts is a significant
portion of each district’s GDP. Unrecognised and overlooked in ‘business as usual’
scenarios this can lead to monetary loss for the economy of Karnataka and there-
fore, requires a more rigorous evaluation that can lead to more informed decisions
about how to enhance the positive correlation between coffee and BES.
This assessment would further be an opportunity for more guided global invest-
ments in conservation that can result in multiple benefits, where the acknowledge-
ment of the inter-linkages between BES and coffee farming provides economic
incentives for estate owners to have widespread adoption of sustainable practices.
It can also simultaneously deliver benefits for local communities and wildlife,
leading to a win-win scenario that is based upon the real challenges faced on the
ground.
ConclusionImplications for Livelihoods and Biodiversity
5
51

REFERENCES
Allen, D.E., Singh, B.P., and Dalal, R.C., (2011), Soil Health Indicators Under Climate Change: A Review of Current Knowledge. Springer-Verlag Berlin Heidelberg 2011, DOI 10.1007/978-3-642-20256-8_2
Somarriba, E., C. Harvey, M. Samper, F. Anthony, J. Gonzalez, C. Staver, and R. A. Rice., (2004), Biodiversity conservation in neotropical coffee (Coffea arabica) plantations. Pages 198–226 in G.
Schroth, G. A. B. da Fonseca, C. Harvey, C. Gascon, H. L. Vasconcelos, and A.-M. N. Izac, editors. Agroforestry and biodiversity conservation in tropical landscapes. Island Press, Washington, D.C.
Vaast, P., J. Beer, C. Harvey, and J. Harmand, (2005), Environmental services of coffee agrofor-estry systems in Central America: a promising potential to improve the livelihoods of coffee farmers’ communities. Pages 35–39 in CATIE, editor. Integrated management of environmental services in human-dominated tropical landscapes. Tropical Agriculture Research and Higher Education Center, Turrialba, Costa Rica.
Harvey, C. A., et al., (2008), Integrating agricultural landscapes with biodiversity conservation in the mesoamerican hotspot. Conservation Biology 22:8–15
Garica et al., (20090, Biodiversity Conservation in Agricultural Landscapes: Challenges and Opportunities of Coffee Agroforests in the Western Ghats, India. Conservation Biology, Vol. 24, No. 2, 479-488.
Dalal R.C., Eberhard R., Grantham T., Mayer D.G., (2003), application of sustainability indicators, soil organic matter and electrical conductivity, to resource management in the northern grains region. Aust J Exp Agric 43:253–259Doran 2002;
Doran J.W., Zeiss M.R., (2000), Soil health and sustainability: managing the biotic component of soil quality. Appl Soil Ecol 15:3–11
Batjes, N.H., 1996. Total carbon and nitrogen in the soils of the world. European Journal of Soil Science 47, 151–163.
CAFNET, (2011), CAFNET Final Report (January 2007 to September 2011), CAFNET India (UASB, CBI and FIP)
Powlson, D.S., et al., (2011), Soil management in relation to sustainable agriculture and ecosys-tem services. Food Policy 36 (2011), S72-S87
Tully, K.L., Lawrence, D., Scanlon, T.M., (2012), More trees less loss: Nitrogen leaching losses decrease with increasing biomass in coffee agroforests. Agriculture, Ecosystems and Environ-ment 161 (2012), 137-144
Albrecht, A., Kandji, S.T., (2003). Carbon sequestration in tropical agroforestry systems. Agricul-ture, Ecosystems & Environment 99, 15–27.
52

Oelbermann, M., Voroney, R.P., Kass, D.C.L., Schlonvoigt, A.M., (2006), Soil carbon and nitrogen dynamics using stable isotopes in 19- and 10-year-old tropical agroforestry systems. Geoderma 130 (3–4), 356–367
Ataroff, M., Monasterio, M., (1997), Soil erosion under different management of coffee planta-tions in the Venezuelan Andes. Soil Technology 11, 95–108.
Sands, P.J., Rawlins, W., Battaglia, M., (1999), Use of a simple plantation productivity model to study the profitability of irrigated (Eucalyptus globulus). Ecological Modelling 117, 125–141.
Balaji, F., (2010), Decline in Indian coffee productivity levels alarming: Upasi. Headlines India, September 14. U R L : h t t p : / / h e a d l i n e s i n d i a . m a p s o fi n d i a . c o m / b u s i n e s s -news/coffee/decline-in-indian-coffee-productivity-levels-alarming-upasi-63203.html.
U.S. Department of Agriculture, (2011), India coffee annual. GAIN report no. IN1147. Washington, DC.
Goswami, B.N., V. Venugopal, D. Sengupta, M.S. Madhusoodanan, and P.X. Xavier, (2006), Increasing trend of extreme rain events over India in a warming environment. Science 314:1442-1445
Guhathakurta, P., P. Menon, A.B. Mazumdar, and O.P. Sreejith, (2010), Changes in extreme rainfall events and flood risk in India during the last century. Research report no. 3/2010. Pune, India: National Climate Center, India Meteorological Department
Lal, M., (2011), Implications of climate change in sustained agricultural productivity in South Asia. Regional Environmental Change 11(Suppl.1):S79–S94
Christensen, J.H., B. Hewitson, A. Busuioc, A. Chen, X. Gao, I. Held, R. Jones, R.K. Kolli, W.–T. Kwon, R. Laprise, V. Magaña Rueda, L. Mearns, C.G. Menéndez, J. Räisänen, A. Rinke, A. Sarr and P. Whetton, (2007), Regional climate projections. In: Climate change 2007: The physical science basis. Contribution of Working Group I to the Fourth Assessment Report of the Intergovernmental Panel on Climate Change, edited by S. Solomon, D. Qin, M. Manning, Z. Chen, M. Marquis, K.B. Averyt, M. Tignor, and H.L. Miller. Cambridge, UK, and New York, NY, USA: Cambridge University Press
Rupa Kumar, K., A.K. Sahai, K. Krishna Kumar, S.K. Patwardhan, P.K. Mishra, J.V. Revadekar, K. Kamala, and G.B. Pant, (2006), High-resolution climate change scenarios for India for the 21st century. Current Science 90(3):334–345
Weil RR, Magdoff F., (2004), Significance of soil organic matter to soil quality and health. In: Weil RR, Magdoff F (eds) Soil organic matter in sustainable agriculture. CRC press, Florida, pp 1–43
P. Bal, C.D. Nath, K. M. Nanaya, C., G. Kushalappa, C. Garica, (2011), Elephants Also Like Coffee: Trends and Drivers of Human-Elephant Conflicts in Coffee Agroforestry Landscapes of Kodogu, Western Ghats, India. Environmental Management (2011) 48:263–275
Seyfried, M.S., Rao, P.S.C., 1991. Nutrient leaching from two contrasting cropping systems in the humid tropics. Trop. Agric. 68, 9–18.
53

P. Cannavoa, J. Sansouletb, J.M. Harmanda, P. Siles, E. Dreyerd, P. Vaast, (2011), Agroforestry associating coffee and Inga densiflora results in complementarity for water uptake and decreases deep drainage in Costa Rica. Agriculture, Ecosystems and Environment 140 (2011) 1–13
Ricketts T. H., Daily G. C. , Ehrlich P.R. & Michener C. D., (2004), PNAS Online Early Edition (2004)
Archana Bali, Jignasu Dolia, M.O. Anand, (2007), An assessment of biodiversity in coffee planta-tions: A report on a tri-taxa study in coffee plantations in Chikmagalur. Center for Wildlife Studies, Bangalore
Bhagwat, S.A., Kushalappa, C.G., Williams, P.H. and Brown, N.D. (2005) ‘Landscape Approach to Biodiversity Conservation of Sacred Groves in the Western Ghats of India’, Conservation Biology 19 (6): 1853-1862
Lange, B., Slade, B., Kwok, I., (2009), Strategic Report for Peet’s Coffee and Tea, Oasis Consulting. URL: http://economics-files.pomona.edu/jlikens/SeniorSeminars/oasis/reports/PEET.pdf
Taylor, (1965), N. Plant Drugs that Changed the World. New York, NY: Dodd, MeadMonaco, L. C., (1977), CONSEQUENCES OF THE INTRODUCTION OF COFFEE RUST INTO BRAZIL. Annals of the New York Academy of Sciences, 287: 57–71. doi: 10.1111/j.1749-6632.1977.tb34231.x
Neilson, J., (2008), Environmental Governance in the Coffee Forests of Kodagu, South India. Transforming Cultures eJournal, North America, 3, Feb. 2008. URL: http://epress.lib.uts.edu.au/journals/index.php/TfC/article/view/680/611
Kariappa, C.P., Dhunjeebhoy, H.D., Ramaswamy, V., and Datta, A. (2004), Planting Times, MacMillan and UPASI, Bangalore
Richter, G. (1870), Gazetteer of Coorg: Natural Features of the Country and the Social and Political Condition of its Inhabitants. Reprinted 2002, New Delhi: Low price Publications
Specialty Coffee Association of America, (2012), Coffee Facts and Statistics URL: http://www.scaaevent.org/PDF/Press%20Kit/2012/Facts%20and%20Figures.pdf
Coffee Board, (2010), 70th Annual Report: 2009-10 A Perspective View, Coffee Board of India. URL: http://www.indiacoffee.org/userfiles/70th%20Annual%20Report.pdf
Coffee Board, (2012), Database on Coffee: June 2012, Market Intelligence & Statistical Unit Coffee Board. URL: www.indiacoffee.org
Morris D.W. (1995) Earth's peeling veneer of life. Nature, 373, 25.
Garcia, C., Marie-Vivien, D., Kushalappa, C. G., Chengappa, P. G., and Nanaya, K.M. (2007) ‘Geographical Indications and Biodiversity in the Western Ghats: Can labelling benefit producers and the environment in a mountain agroforestry landscape?’ Mountain Research and Develop-ment, 27 (3), pp206-210
Ukers, W. H. (1935) All About Coffee. New York: The Tea and Coffee Trade Journal Company
54

Ninan, K.N., Jyothis, S., Babu, P., Ramakrishnappa, V., (2001), Economic Analysis of Biodiversity Conservation: the Case of Tropical Forests in the Western Ghats, India. ISEC, Bangalore
Caleb Gordon, Robert Manson, Jeffrey Sundberg, Andrea Cruz-Ango´, (2007), Biodiversity, profitability, and vegetation structure in a Mexican coffee agroecosystem. Agriculture, Ecosystems and Environment 118 (2007) 256–266
Coffee Board, (2012), Database on Coffee: June 2012, Market Intelligence & Statistical Unit Coffee Board. URL: www.indiacoffee.org
CII, (2012), Investment Climate: A Report on Southern States of India, CII-SR Economic Affairs and Governance Forum
Government of Karnataka, (2006), Karnataka Agricultural Policy 2006, Department of Agriculture, Government of Karnataka URL: http://raitamitra.kar.nic.in/Agri%20Policy%20Eng.pdf
Government of Karnataka, (2011), Economic Survey of Karnataka 2010-2011, Directorate of Econom-ics and Statistics, Government of Karnataka URL:http://planning.kar.nic.in/sites/planning.kar.nic.in/files/Economic_Survey/8State%20Income%20&%20Prices.pdf
Rao, Vidya S., (2012), Impact of Grevillea Robusta Composition on Bird Diversity in Coffee Plantations in Cauvery Watershed Area of Coorg District
Venkatachalam, Lakshmi (2005): Perspectives on sustainability and globalization and the challenges for the coffee sector, Ms. Lakshmi Venkatachalam, Former Chairperson, Coffee Board of India, presentation at the 2nd World Coffee Conference, Salvador, Bahia, Brazil - 23-25 September 2005
International Coffee Organisation, (2002), The Global Coffee Crisis: A Threat to Sustainable Develop-ment, URL: www.ico.org
Upendranath, C., (2010), Coffee Conundrum: Wither the Future of Small Growers in India?
Pradeepkumar, T., Suma, B., Jyothibhaskar and Satheesan, K.N., (2008), Management of Horticul-tural Crops: Vol 11 Horticulture Science Series: In 2 Parts, New India Publishing Agency
Hagger, Jeremy, (2008), Impact of Climate Change on Coffee Farming Households in Central America and Steps for Adaptation in the Future, Centre for Tropical Agricultural Research and Training (CATIE)URL: http://web.catie.ac.cr/congreso/jeremy/Paper_climate.pdf
Government of Karnataka, (2004), State of environment report and action plan 2003, Department of Forest, Ecology and Environment, Bangalore
Pierce, D. and Moran, D., (1994), The economic value of biodiversity, Earthscan, London
Shyamsundar, P. and Kramer, R.A., (1996), Tropical Forest Protection – an empirical analysis of the costs borne by local people, Journal of Environmental Economics and Management, 31 (2) (1996) (U.S.A.)
55

Shyamsundar, P. and Kramer, R.A., (1997), Biodiversity conservation—at what cost? A study of households in the vicinity of Madagascar's Mantadia National Park, Ambio, 26 (3) (1997), pp. 180–184 (May)
Borkhataria, R.R., Collazo, J.A. & Groom, M.J. (2006) Additive effects of vertebrate predators on insects in a Puerto Rican coffee plantation. Ecological Applications, 16, 696–703.
Philpott, S.M., Perfecto, I. & Vandermeer, J., (2008), Effects of predatory ants on lower trophic levels across a gradient of coffee management complexity. Journal of Animal Ecology 77: 505-511.
Klein, A.-M., Cunningham, S. A. Bos, Merijn, Steffan-Dewenter, I., (2008), Advances in pollination ecology from tropical plantation crops. Ecology 89: 935-943
Ricketts, T. H., (2004), Tropical forest fragments enhance pollinator activity in nearby coffee crops. Conservation Biology 18:1262–1271.
Steffan-Dewenter, I., et al., (2007), Tradeoffs between income, biodiversity, and ecosystem functioning during tropical rainforest conversion and agroforestry intensification. Proceedings of the National Academy of Sciences of the United States of America 104:4973-4978
Krishnaswamy, J., Bawa, K. S., Ganeshaiah, K. N., & Kiran, M. C., (2009), Quantifying and mapping biodiversity and ecosystem services: Utility of a multi-season NDVI based Mahalanobis distance surrogate. Remote Sensing of Environment, 113, 857−867
Kumar, B.M and P. K. R. Nair, (2006), Carbon sequestration potential of tropical homegardens in Tropical Homegardens: A Time-Tested Example of Sustainable Agroforestry., Springer Nether-lands, 2006. Pages: 185-204.
Olchev, A., et al., (2008), Effects of land-use changes on evapotranspiration of tropical rain forest margin area in Central Sulawesi (Indonesia): Modelling study with a regional SVAT model. Ecological Modelling Volume 212, Issues 1-2, 24. Pages 131-137
International Trade Centre, (2010), Climate Change and the Coffee Industry, Geneva, ITC, 2010, vi, 28 pages (Technical Paper)URL:http://www.intracen.org/uploadedFiles/intracenorg/Content/Exporters/Sectoral_Information/Agricultural_Products/Organic_Products/Climate-Coffee-Ch-13-MS-ID-3-2-2010ff_1.pdf
Pinto H.S. Assad E.D. Zullo J, Brunini O. (2007), Acqueimiento Global e a Agricultura
Critical Ecosystem Partnership Fund, (2007), Ecosystem Profile: Western Ghats and Sri Lanka Biodiversity Hotspot, Western Ghats Region. Ashoka Trust for Research in Ecology and Environ-ment, Banglaore
Daniels, R.J.R., Gadgil, M., Joshi, N.V., (1995), Impact of human extraction on tropical humid forests in the Western Ghats Uttara Kannada, South India. Journal of Applied Ecology 32, 866-874
Karnath, K.K., Curran, L.M., Reuning-Scherer, (2006), Village size and forest disturbance in Bhadra Wildlife Sanctuary, Western Ghats, India. Biological Conservation 128, 147-157
56

Menon, S., Bawa, K.S., (1997), Applications of geographic information systems, remote sensing and a landscape ecology approach to biodiversity conservation in the Western Ghats. Current Science 73, 134-145
Jha, C.S., Dutt, C.B.S, Bawa, K.S., (2000), Deforestation and land use changes in Western Ghats, India. Current Science 79, 231-238
Damodaran, A., (2002), Conflict of trade-facilitating environmental regulations with biodiversity concerns: the case of coffee-farming units in India. World Development 30, 1123-1135
Pascal, J.P., (1988). Wet evergreen forests of the Western Ghats of India: ecology, structure, floristic composition and succession. Institut Français de Pondichéry,Pondicherry.
Vasudevan, K., Kumar, A., Chellam, R., ( 2006), Species turnover: the case of stream amphibians of rainforests in the Western Ghats, southern India. Biodiversity and Conservation 15, 3515–3525
Biju, S.D., Bossuyt, F., (2006), Two new species of Philautus (Anura, Ranidae, Rhacophorinae) from the Western Ghats, India. Amphibia-Reptilia 27, 1–9.
Parmesan, C., Yohe, G., ( 2003), A globally coherent footprint of climate change impacts across natural ecosystems. Nature 421, 37–42.
Donald, P.F., Evans, A.D., (2006), Habitat connectivity and matrix restoration: the wider implica-tions of agri-environment schemes. Journal of Applied Ecology 43, 209–218.
57


For further information:
Centre for Social Markets (CSM)A-1 Hidden Nest, 16 Leonard Lane,
Richmond Town, Bangalore 560 025,
India
Tel: + 91 80 40918235
Email:[email protected]
Website: www.csmworld.org The printing of this report has been supported by
With most of India's unique shade-grown
-
sity hotspot of the Western Ghats, there is a
clear ecology-economy-equity link. What role
and protecting ecosystems and livelihoods in
India? Does the industry have a future? These
are some of the questioned examined in this
study.
highlights the interlinkages between shade-
areas of Karnataka and their contribution to
maintaining and enhancing ecosystem
services and local socio-economic develop-
ment.
Experts,donors, practitioners, policy makers
this report