Embed Size (px)
Citation preview

Coffee Annual Report 2018
RA Program
May 2019

Coffee Annual Report 2018 - RA Program
2
Introduction
The main goal of this report is to present the scope and scale of the Rainforest
Alliance coffee program in 2018 – calendar year. The report is written in order to
inform our stakeholders and is part of our commitment to transparency.
The report focuses on the key indicators related to:
• Market uptake: sales of Rainforest Alliance certified coffee
• Program reach: Rainforest Alliance certified coffee production and multi-certification of this production
This report is part of the Rainforest Alliance monitoring and evaluation system. Most of
the data in this report is collected via our online traceability system, Marketplace 2.0.
We do our best to make sure that all of the information in this report is accurate and
reliable, but as much of the data is collected by third parties, we are aware that
there may be some shortcomings.
We look forward to receiving your feedback. For more information, please contact
the Farm & Supply Chain Intelligence Department at [email protected]

Coffee Annual Report 2018 - RA Program
Reach RA coffee program
Global Sales
Estimated production
Supply and Demand ratio
Multi-certification

Coffee Annual Report 2018 - RA Program
Reach RA coffee program

Coffee Annual Report 2018 - RA Program
Geographical reach
AsiaIndia
Indonesia
Laos
Papua New Guinea
Sri Lanka
Vietnam
Latin AmericaBrazil
Colombia
Costa Rica
El Salvador
Guatemala
Honduras
Jamaica
Mexico
Nicaragua
Peru
AfricaBurundi
Ethiopia
Kenya
Malawi
Rwanda
Tanzania
Uganda
Zambia
The Rainforest Alliance Coffee program reached 25 countries.
USAHawaii

Coffee Annual Report 2018 - RA Program
6
Program reach
# of farmers
231,581 # of workers
(seasonal and
permanent)
369,087 Area (hectare)
470,817
12%Relative growth 2017-2018
13%Relative growth 2017-2018
# of certificate
holders
623
6%Relative growth 2017-2018

Coffee Annual Report 2018 - RA Program
7
# farmers
+12%
Area (ha)
Relative growth 2017-2018: +13%
Program Reach
# Certificate Holders
-6%
▪ # workers (seasonal & permanent)= 369,087 in 2018
▪ # of farmers represent the number of individual farms and individual farmers part of a group or multi-site certificates.
382,114 387,265411,519
470,817
2015 2016 2017 2018
209,946228,243
204,329
231,581
2015 2016 2017 2018
640668 662
623
2015 2016 2017 2018

Coffee Annual Report 2018 - RA Program
Global Sales

Coffee Annual Report 2018 - RA Program
9
Global Producer coffee salesThe Rainforest Alliance Coffee sales from Certificate Holders increased by
9% from 2017 to 2018
289,294
321,553
2017 2018
MT
Gre
en
Co
ffe
e E
qu
iva
len
t
Certificate Holders’ sales are all the approved sales from a certified farm or producer group to their first client.Years are calendar years.
+ 9%

Coffee Annual Report 2018 - RA Program
10
Global Producer coffee salesThe Rainforest Alliance Coffee sales from Certificate Holders increased by
9% from 2017 to 2018
289,294
321,553
2017 2018
MT
Gre
en
Co
ffe
e E
qu
iva
len
t
Certificate Holders’ sales are all the approved sales from a certified farm or producer group to their first client.Years are calendar years.

Coffee Annual Report 2018 - RA Program
11
Global Producer coffee sales per originMost Rainforest Alliance Coffee came from Brazil, Colombia and
Guatemala
Relative
growth
2017-2018:
134,370
48,623
23,531 20,915 20,205 16,620 13,135 10,0935,897 5,662 4,948 4,859 4,001 3,468 3,099 2,129
MT
Gre
en
Co
ffe
e e
qu
iva
len
t2017
2018
+7% +0% +19% +23% +23% +71% +5% +79% -17% -31% +28% -1% -13% +84% +66% +75%
Certificate Holders’ sales are all the approved sales from a certified farm or producer group to their first client. Years are calendar years.*’Others' includes: Uganda, Rwanda, Zambia. Papua New Guinea, Malawi, Laos, Burundi, Panama, Jamaica

Coffee Annual Report 2018 - RA Program
12
Global Producer coffee sales per origin
‘Global sales’ are all the confirmed sales from a certified producers’ group or estate to the first buyer. Years are calendar years.*’Other' includes : Uganda, Rwanda, Zambia. Papua New Guinea, Malawi, Laos, Burundi, Panama, Jamaica

Coffee Annual Report 2018 - RA Program
14
Market uptakeIn 2018, 426 new supply chain actors joined the Rainforest Alliance coffee program
‘Supply Chain Actors’ include traders, roasters and retailers, active as of December 31st of each year.
3411
3027
3417
3843
2015 2016 2017 2018
Number of active coffee supply chain actors

Coffee Annual Report 2018 - RA Program
15
Volumes exported by Year
Volumes are based on approved Transaction Certificates with a Shipment date in 2018.Volume exported also includes volumes processed within the country of origin
194.299
217.851229.564
261.604
2015 2016 2017 2018
MT
gre
en
co
ffe
e e
qu
iva
len
t+ 12%
+ 5%
+ 14%

Coffee Annual Report 2018 - RA Program
17
Volumes imported by region
Relative
growth 2017-
2018:+17% -10% +53% +15% -19%
147,760
56,663
22,957
1,997 187
173,145
50,801
35,209
2,298 151
Europe North America Australasia Latin America Africa
MT
Gre
en
Co
ffe
e E
qu
iva
len
t
2017
2018
Volume imported are based on the location of the importing company but does not necessarily reflect consumption region.

Coffee Annual Report 2018 - RA Program
Estimated Production

Coffee Annual Report 2018 - RA Program
21
Estimated production
Estimated production is based on certificate information from certificates valid on December 31st 2018
485,699508,631
557,911
655,280
2015 2016 2017 2018
MT
Gre
en
Co
ffe
e e
qu
iva
len
t+ 5%
+ 9%
+ 15%

Coffee Annual Report 2018 - RA Program
22
Estimated production
Estimated production is based on certificate information from certificates valid on December 31st 2018
485,699
508,631
557,911
655,280
2015 2016 2017 2018
MT
Gre
en
Co
ffe
e e
qu
iva
len
t
+ 5%
+ 9%
+ 15%

Coffee Annual Report 2018 - RA Program
23
Estimated production per origin
Estimated production is based on certificate information from certificates valid on December 31st 2018*Other includes: Papua New Guinea, Zambia, Indonesia, El Salvador, Mexico, Uganda, Tanzania, Rwanda, Malawi, Laos, United States, Burundi, Jamaica, Ecuador, Panama and China
Relative
growth 2017-
2018:
+18% +20% +34% -2% +1% +13% -2% +4% +33% -1% +17% +16%
235,214
101,313
39,05433,579 32,995 32,070 31,941 27,886 27,150 22,765
15,336
55,976
Mt
Gre
en
Co
ffe
e E
qu
iva
len
t
2016
2017
2018

Coffee Annual Report 2018 - RA Program
24
Estimated production per origin
Estimated production is based on certificate information from certificates valid on December 31st 2018*Other includes: Papua New Guinea, Zambia, Indonesia, El Salvador, Mexico, Uganda, Tanzania, Rwanda, Malawi, Laos, United States, Burundi, Jamaica, Ecuador, Panama and China

Coffee Annual Report 2018 - RA Program
Supply – Demand trend

Coffee Annual Report 2018 - RA Program
27
Supply & Demand trend
% of estimated production vs volume sold by producers
Volumes sold by producers represent, on average, 50% of the estimated
Rainforest Alliance Certified™ Coffee production.
Volumes sold are based on Approved Transaction Certificates..Estimated production is based on the Certification information as indicated by Certification Bodies for Certificates valid on December 31st 2018.This ratio indicates a trend but not an absolute number.
52%49%
2017 2018

Coffee Annual Report 2018 - RA Program
28
Supply & Demand trend – Market reach
43%41% 40%
2016 2017 2018
% of estimated production vs exported or processed at origin
Volumes exported represent, on average, 40% of the estimated Rainforest
Alliance Certified™ Coffee production.
Volumes are based on Approved Transaction Certificates. Volume exported also includes volumes processed at origin.Estimated production is based on the Certification information as indicated by Certification Bodies for Certificates valid on December 31st 2018.This ratio indicates a trend but not an absolute number.

Coffee Annual Report 2018 - RA Program
29
Supply & Demand trend per region – Market reach
% of estimated production vs Exported as RA per region in 2018
Volumes are based on Approved Transaction Certificates. Volume exported also includes volumes processed at origin.Estimated production is based on the Certification information as indicated by Certification Bodies for Certificates valid on December 31st 2018.This ratio indicates a trend but not an absolute number.

Coffee Annual Report 2018 - RA Program
Multi-certification
Coffee Annual Report 2018 - RA Program
33
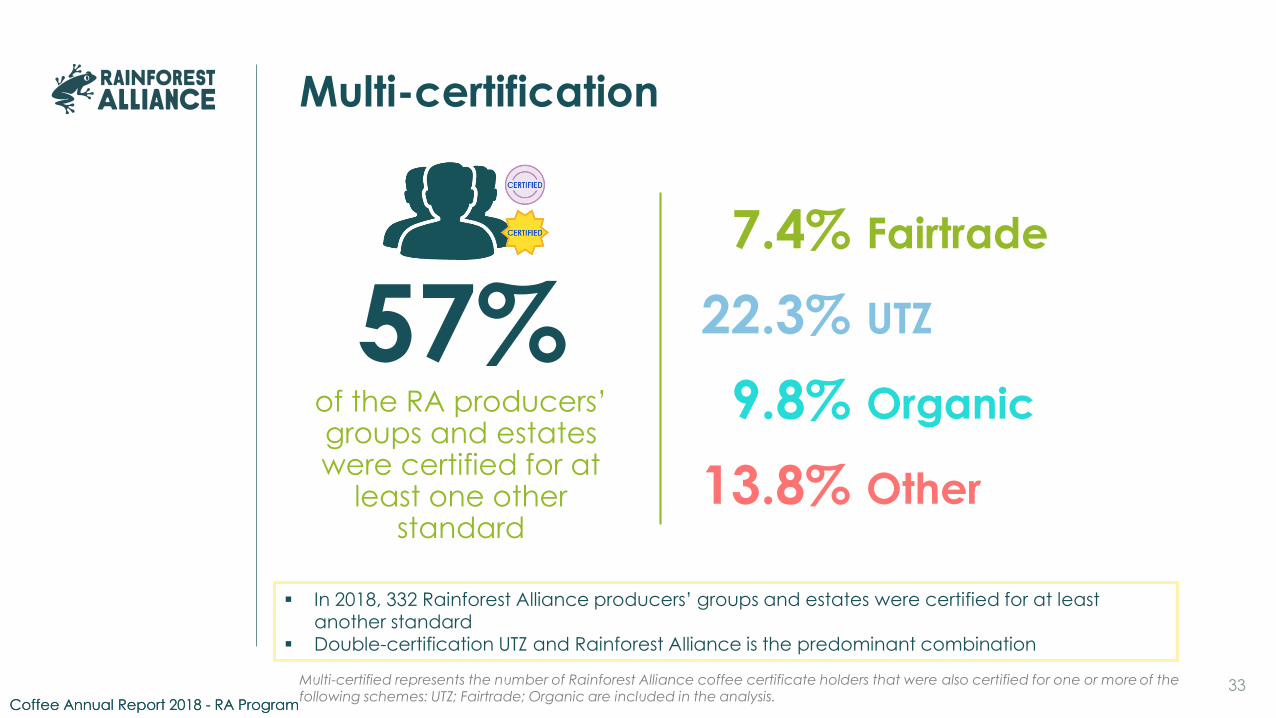
Multi-certification
Coffee Annual Report 2018 - RA Program
7.4% Fairtrade
22.3% UTZ
9.8% Organic
13.8% Other
of the RA producers’ groups and estates were certified for at
least one other standard
57%
Multi-certified represents the number of Rainforest Alliance coffee certificate holders that were also certified for one or more of the following schemes: UTZ; Fairtrade; Organic are included in the analysis.
▪ In 2018, 332 Rainforest Alliance producers’ groups and estates were certified for at least another standard
▪ Double-certification UTZ and Rainforest Alliance is the predominant combination

rainforest-alliance.orgDe Ruyterkade 6
1013 AA, Amsterdam,
The Netherlands
233 Broadway, 28th Floor
New York, NY 10279
USA