Embed Size (px)
Citation preview

1
Codigestion Case Studies Enhancing Energy Recovery From Sludge
Dale Gabel, PE, BCEE
MWRD PWO Seminar
May 23, 2012

2
What is Codigestion?
Direct addition of high-strength organic wastes to municipal wastewater anaerobic digesters Typical high-strength organic wastes • Fats, oils, and grease (FOG) • Restaurant food scraps • Food processing wastes • Off-spec cola syrups • Dairy wastes • Cheese Wastes • Brewery Wastes • Winery Wastes • Others

3
Advantages of Codigestion
Technical • Removes FOG from sewer collection systems • Removes FOG materials from headworks and
primary clarifiers • Removes organic loadings on liquid treatment train • Increases digester utilization
Economic • Produces more biogas for beneficial uses (CHP,
dryer, vehicles, etc.) • New revenue streams from tipping fees • Reduces O&M costs for headworks and liquid
treatment trains
Environmental • Reduces landfilling of high-strength wastes (HSW) • Reduces emission of greenhouse gases

4
Challenges of Codigestion
Possible need for digester upgrades Additional capital and O&M costs for FOG/HSW receiving and processing Additional paperwork for permitting, waste receipts, billings Debris removal and disposal Potential negative anaerobic digester performance impacts Potential anaerobic digester toxicity from HSW Potential increase in nutrient concentrations in sidestreams

5
Key Elements of an Effective FOG Waste/HSW Processing System
Material Delivery Control/Traceability Volume of Material and Storage Requirements FOG Waste/HSW Unloading Considerations Storage and Conditioning Odor Control Feed Strategies

6
Material Delivery Control and Traceability
Develop Application Process Collaborate with Haulers and WWTP Operators Train Drivers on Delivery/Unloading Procedures Sample Collection and Testing Record Keeping Security

7
Volume of Material and Storage Requirements
Research Market • Number of potential hauling companies • Estimate deliveries per day • Delivery truck capacities • Billing: Basis and Method
Develop Storage and Feed Strategy • Design for anticipated peak day loads • Develop acceptable delivery schedule • Continuous feed or single shift

8
FOG Waste/HSW Unloading Considerations
Access Control and Automation Unloading Method Debris/Sediment Removal Pumping Clean up

9
FOG Storage Tanks
Heat Exchangers
Digester Feed Pumps
Influent/Mixing Pumps
Odor Control
Key Components of a Receiving Station
Rock Trap/ Grinders

10
Codigestion Case Studies
Des Moines Metropolitan Wastewater Reclamation Authority, Iowa. • 136 mgd, various HSW
Douglas L. Smith Middle Basin WWTP, Johnson County, Kansas • 14.5 mgd, FOG/HSW
Gloversville-Johnstown Joint WWTF, New York • 13 mgd, yogurt/cheese whey

11
Des Moines Metropolitan Wastewater Reclamation Facility (DMMWRF) – 50 mgd (134 mgd Capacity)

12
HSW Processing System
Truck weigh stations (3) Rock traps (3) HSWs received and blended in HSW receiving tank HSW then blended in another tank with primary and waste activated sludge and fed sequentially to the digesters

13
Unloading into Underground HSW Receiving Tank
Up to Three Trucks Can Be Received Simultaneously

14
Foaming Control
Foaming events from selected HSW controlled by reducing accepted quantities of these wastes • corn oil and isopropyl alcohol (IPA)
Ongoing digesters upgrades expected to reduce foaming • Submerged-fixed covers • Internal draft tube mechanical mixers

15
Feed Volumes
Predominant load is due to HSW
PS (gal/day)
TWAS (gal/day)
HSW (gal/day) Est.
Digesters HRT
Based on Blended Sludge (days)
Average (Minimum-Maximum)
132,000 (42,000−180,000)
98,000 (0−204,000)
160,000 (93,000−297,000)
33 (22−49)
Volumetric Fraction 35% 26% 42%

16
Selected Data for Codigested Waste Streams
Brown Grease
Packing Plant DAF
Float
Biodiesel Production
Waste
Trucked Municipal Sludge
Tipping Fee, $/gal $0.0148 $0.026 $0.027 $0.0148 Wastes Accepted 24/7 24/5 24/7 24/5 Digester Feeding 24/7 24/7 24/7 24/7 Flow, gpd 16,700 33,300 32,300 20,100
pH(1) 4.7 (4.0−7.0)
5.7 (5.3−6.5)
5.8 (5.2−8.1)
5.1 (5.0−5.1)
COD(1), mg/L − − 40,000 (700−30,8000) −
TS(1), % solids 5.45 (2.04−9.24)
6.68 (0.91−12.77)
0.3 (0.08−0.68)
2.95 (1.49−4.11)
VS/TS(1), % 88.8 (75.8−95.7)
83.7 (64.9−92.8) − 76.3
(72.1−80.4)
(1)Average (Minimum−Maximum)

17
Cargill Financed Part of the Project and Purchases a Fraction of the Produced Biogas for Use in Its Boilers
Cargill
Digesters

18
Biogas Production and Utilization
Biogas, cfd Annual Total,
cf
Annual Distribution,
% Used in CHP(1) 524,000 174,000,000 35 Used in Boilers 94,000 50,000,000 10 Sold to Cargill 706,000 239,000,000 48 Flared 8,660 24,000,000 5 Total biogas 1,423,000 500,000,000 100
(1) About 8,800 MWh produced and 25,000 MWh purchased.

19
Financial Benefits
Capital Cost New HSW tank $1,750,000 WRA Investment in Cargill biogas utilization project $1,100,000 New submerged fixed concrete digester covers $6,000,000 New digester mixing systems $6,500,000
TOTAL = $15.4 million Annual Revenue
HSW tipping fees revenue $200,000-400,000
Biogas sold to Cargill $300,000-800,000
Annual power produced $370,000(1) TOTAL = $0.9-1.6 million
(1) Calculated as 8,800 MWh produced annually at $0.045/kWh; expected to increase significantly with planned CHP engines and expected power price increase

20
Johnson County, Kansas Middle Basin WWTP – 12.5 mgd (14.5 mgd Capacity)

21
Process Flow Diagram
FOG/HSW are blended sequentially with primary sludge and thickened WAS

22
FOG/HSW Receiving Facility

23
Daily Receipts Highly Variable
-
5,000
10,000
15,000
20,000
25,000
30,000
Volu
me
of W
aste
s Rec
eive
d, g
allo
ns
FOG/HSW Received

24
Foaming Overflow Events During Codigestion Startup
Were largely eliminated by reducing mixing energy
25
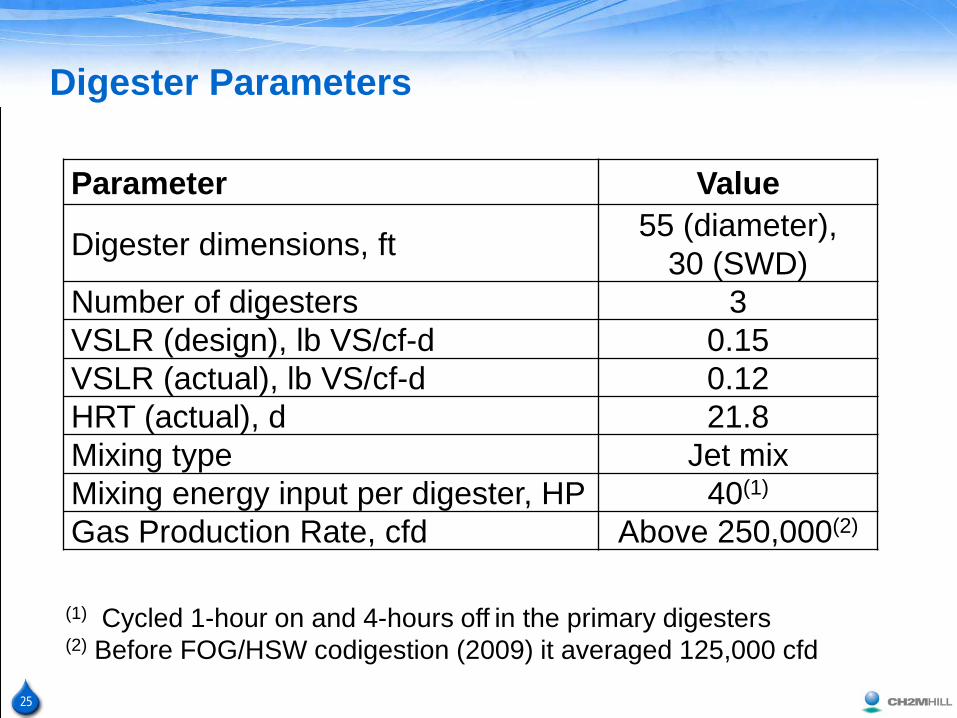
Digester Parameters
Parameter Value
Digester dimensions, ft 55 (diameter), 30 (SWD)
Number of digesters 3 VSLR (design), lb VS/cf-d 0.15 VSLR (actual), lb VS/cf-d 0.12 HRT (actual), d 21.8 Mixing type Jet mix Mixing energy input per digester, HP 40(1) Gas Production Rate, cfd Above 250,000(2)
(1) Cycled 1-hour on and 4-hours off in the primary digesters
(2) Before FOG/HSW codigestion (2009) it averaged 125,000 cfd

26
-
50,000
100,000
150,000
200,000
250,000
300,000
350,000
400,000
1/1/
2009
3/1/
2009
5/1/
2009
7/1/
2009
9/1/
2009
11/1
/200
9
1/1/
2010
3/1/
2010
5/1/
2010
7/1/
2010
9/1/
2010
11/1
/201
0
1/1/
2011
3/1/
2011
5/1/
2011
7/1/
2011
9/1/
2011
11/1
/201
1
1/1/
2012
3/1/
2012
Dig
este
r Gas
Pro
duce
d, c
ubic
feet
/day
Total Digester Gas 7 per. Mov. Avg. (Total Digester Gas)
Foaming Loss of HSW
Digester 4 Start-up
Start FOG
Addition
Digester Gas Production Increased with Addition of FOG Waste and Other High Strength Wastes

27
Digester Gas Cleaning, Storage and Utilization

28
Project Financials
Capital cost of codigestion and cogeneration Improvements $10,000,000
Annual FOG/HSW tipping fee revenue $300,000
Annual electrical power from biogas $400,000

29
Gloversville-Johnstown Joint WWTF, New York (GJJWWTF) - 6.7 mgd (13 mgd Capacity)

30
Codigestion Process Flow Diagram
Secondary Digester
Primary Digester
Whey Flow Equalization
Tanks
Dairy Washwater
Pumped from Industrial Park
Primary Sludge
WAS
BFP Dewatering
Cake to Landfill
Ferric
Thickened Dairy Waste (considering re-routing to
the whey equalization tanks)
Day Tank
Gravity Belt Thickening
Recuperative Thickening
Recycle
Trucked Cheese Whey
Yogurt Whey Pumped from Industrial Park
Blended Raw
Sludge
Sludge Blending
Microstrainingand DAFT
Pretreatment
Sludge blending/equalization Whey equalization Recuperative thickening

31
Yogurt Whey has the Lowest COD Concentration but Offers the Major Contribution to Loading and Gas Production
Source Flow (mgd)
COD (lbs/d)
TSS (lbs/d)
TKN (lbs/d)
Cappiello Whey (cheese) 0.012 10,010 270 110
FAGE Whey (yogurt) 0.056 23,600 3,020 470
Euphrates (cheese) 0.007 5,840 280 90
Yogurt whey COD ~ 30,000 mg/L and cheese whey COD ~ 100,000 mg/L

32
2002 vs. 2011 Performance Comparison
Parameter 2002 2011(1) VS Loading, lb/cf-d 0.06 0.21 Hydraulic Retention Time, days 34 − Solids Retention Time, days 34 − Volatile Solids Reduction, % 40 − Digester gas Generation, cfd 83,000 310,000
Digester Gas Production, cf/lb VSR 13 − Methane Content, % 68 − Annual Electrical Production, MWh 816 5,000
Cake TS, % solids 18−20 14 (1) Projected based on January 2011 data

33
Revenue from HSW Receiving
$0
$200,000
$400,000
$600,000
$800,000
$1,000,000 19
99
2000
2001
2002
2003
2004
2005
2006
2007
2008
2009
2010
2011
Trucked & Pumped Waste Revenue
$1,000,000 annual revenue for 6.5 mgd facility

34
Facility is Largely Energy Self-Sufficient
Remains connected to the power grid for reliability

35
Capital Cost
Total Project Cost $11,500,000
NYSEDRA Grant Funding $1,400,000
ARRA/NYSEFC Grant Funding $6,000,000
Total grand funding $9,600,000 Net Cost $1,900,000

36
Project is Highly Profitable
Incremental Cost Incremental chemical cost $100,000 Incremental dewatered solids landfill disposal cost
$300,000
Incremental CHP O&M due to increased CHP capacity
$100,000
Biogas drying $50,000 Revenue Power generated $640,000 Pumped-trucked waste receiving fees
$992,000
(1) Power @ $0.12/kWh Annual revenue significantly exceeds cost

37
Conclusions
The three analyzed facilities had different • Capacities • Codigested HSWs • Cost structure (tipping fees, unit power cost, biosolids disposal cost)
All three facilities realized significant increase in biogas production and electrical power savings Benefits included • Financial gains • Serving the local communities and industries • Environmentally sound utilization of the HSWs
An increasing number of HSW codigestion facilities are expected to continue being implemented

38
Acknowledgements
John Kabouris, PhD, PE, CH2M HILL Tim Shea, PhD, PE, BCEE, CH2M HILL Larry Hare, Des Moines Metropolitan Wastewater Reclamation Authority, Iowa; Doug Nolkemper, Douglas L. Smith Middle Basin WWTP, Johnson County, Kansas; Operations staff at Gloversville-Johnstown Joint WWTF, New York

39
Codigestion Case Studies Enhancing Energy Recovery From Sludge
Dale Gabel, PE, BCEE
MWRD PWO Seminar
May 23, 2012
Questions?