Embed Size (px)
Citation preview
Application ReportSPRA004 - October 2001
1
Code Composer Studio IDE v2 White PaperJohn Stevenson Texas Instruments Incorporated
ABSTRACT
Designed for the Texas Instruments (TI) high performance TMS320C6000 (C6000 ) andpower efficient TMS320C5000 (C5000 ) digital signal processor (DSP) platforms, theCode Composer Studio IDE is a development environment that tightly integrates the toolsneeded to create winning DSP applications.
Key components of the Code Composer Studio IDE include:
• Intelligent IDE including CodeMaestro technology• C/C++ Compiler, Assembly Optimizer and Linker (Code Generation Tools)• Real-Time Operating System (DSP/BIOS )• Real-Time Data Exchange between host and target (RTDX )• Update Advisor• Instruction Set Simulator• Advanced Event Triggering• Data Visualization
The Code Composer Studio IDE integrates all host and target tools in a unified environment.It also simplifies DSP system configuration and application design to help designers getstarted faster than ever before.
Supported Operating Systems:
Windows 98Windows 98 Second EditionWindows NT (service pack 4 or higher)Windows 2000 (service pack 1 or higher)
Contents
1 Introduction 3. . . . . . . . . . . . . . . . . . . . . . . . . . . . . . . . . . . . . . . . . . . . . . . . . . . . . . . . . . . . . . . . . . . . . . . . .
2 Development Flow 4. . . . . . . . . . . . . . . . . . . . . . . . . . . . . . . . . . . . . . . . . . . . . . . . . . . . . . . . . . . . . . . . . . .
3 Application Design 4. . . . . . . . . . . . . . . . . . . . . . . . . . . . . . . . . . . . . . . . . . . . . . . . . . . . . . . . . . . . . . . . . . 3.1 Code Composer Studio Setup 4. . . . . . . . . . . . . . . . . . . . . . . . . . . . . . . . . . . . . . . . . . . . . . . . . . . . . . 3.2 DSP/BIOS 6. . . . . . . . . . . . . . . . . . . . . . . . . . . . . . . . . . . . . . . . . . . . . . . . . . . . . . . . . . . . . . . . . . . . . . .
3.2.1 Real-time Operating System 6. . . . . . . . . . . . . . . . . . . . . . . . . . . . . . . . . . . . . . . . . . . . . . . . .
Trademarks are the property of their respective owners.
TMS320C6000, C6000, TMS320C5000, C5000, Code Composer Studio, CodeMaestro, DSP/BIOS and RTDX are trade-marks of Texas Instruments.

SPRA004
2 Code Composer Studio IDE v2 White Paper
3.2.2 Configuration 7. . . . . . . . . . . . . . . . . . . . . . . . . . . . . . . . . . . . . . . . . . . . . . . . . . . . . . . . . . . . . . 3.2.3 Chip Support Library (CSL) 7. . . . . . . . . . . . . . . . . . . . . . . . . . . . . . . . . . . . . . . . . . . . . . . . . .
3.3 TMS320 DSP Algorithm Standard 7. . . . . . . . . . . . . . . . . . . . . . . . . . . . . . . . . . . . . . . . . . . . . . . . . .
4 Code and Build 8. . . . . . . . . . . . . . . . . . . . . . . . . . . . . . . . . . . . . . . . . . . . . . . . . . . . . . . . . . . . . . . . . . . . . . 4.1 Source Code Editor 8. . . . . . . . . . . . . . . . . . . . . . . . . . . . . . . . . . . . . . . . . . . . . . . . . . . . . . . . . . . . . . .
4.1.1 External Editor Support 10. . . . . . . . . . . . . . . . . . . . . . . . . . . . . . . . . . . . . . . . . . . . . . . . . . . . 4.2 CodeMaestro Technology 11. . . . . . . . . . . . . . . . . . . . . . . . . . . . . . . . . . . . . . . . . . . . . . . . . . . . . . . . . 4.3 Project Manager 12. . . . . . . . . . . . . . . . . . . . . . . . . . . . . . . . . . . . . . . . . . . . . . . . . . . . . . . . . . . . . . . . .
4.3.1 Project Configurations 12. . . . . . . . . . . . . . . . . . . . . . . . . . . . . . . . . . . . . . . . . . . . . . . . . . . . . 4.3.2 Multiple Project Support 12. . . . . . . . . . . . . . . . . . . . . . . . . . . . . . . . . . . . . . . . . . . . . . . . . . . . 4.3.3 Source Control 13. . . . . . . . . . . . . . . . . . . . . . . . . . . . . . . . . . . . . . . . . . . . . . . . . . . . . . . . . . . 4.3.4 Building Libraries 13. . . . . . . . . . . . . . . . . . . . . . . . . . . . . . . . . . . . . . . . . . . . . . . . . . . . . . . . . 4.3.5 Custom Build Steps 13. . . . . . . . . . . . . . . . . . . . . . . . . . . . . . . . . . . . . . . . . . . . . . . . . . . . . . . 4.3.6 Using External Makefiles 14. . . . . . . . . . . . . . . . . . . . . . . . . . . . . . . . . . . . . . . . . . . . . . . . . . . 4.3.7 Exporting Makefiles 14. . . . . . . . . . . . . . . . . . . . . . . . . . . . . . . . . . . . . . . . . . . . . . . . . . . . . . . 4.3.8 Command-Line Build Utility (timake.exe) 14. . . . . . . . . . . . . . . . . . . . . . . . . . . . . . . . . . . . .
4.4 Code Generation Tools 15. . . . . . . . . . . . . . . . . . . . . . . . . . . . . . . . . . . . . . . . . . . . . . . . . . . . . . . . . . . 4.4.1 C6000 Code Generation Tools 15. . . . . . . . . . . . . . . . . . . . . . . . . . . . . . . . . . . . . . . . . . . . . . 4.4.2 C5000 Code Generation Tools 15. . . . . . . . . . . . . . . . . . . . . . . . . . . . . . . . . . . . . . . . . . . . . .
5 Debug 16. . . . . . . . . . . . . . . . . . . . . . . . . . . . . . . . . . . . . . . . . . . . . . . . . . . . . . . . . . . . . . . . . . . . . . . . . . . . . 5.1 Debugger 16. . . . . . . . . . . . . . . . . . . . . . . . . . . . . . . . . . . . . . . . . . . . . . . . . . . . . . . . . . . . . . . . . . . . . . .
5.1.1 Probe Points 17. . . . . . . . . . . . . . . . . . . . . . . . . . . . . . . . . . . . . . . . . . . . . . . . . . . . . . . . . . . . . 5.1.2 Parallel Debug Manager 17. . . . . . . . . . . . . . . . . . . . . . . . . . . . . . . . . . . . . . . . . . . . . . . . . . .
5.2 Real-Time Data Exchange (RTDX) 17. . . . . . . . . . . . . . . . . . . . . . . . . . . . . . . . . . . . . . . . . . . . . . . . . 5.3 Advanced Event Triggering (AET) 19. . . . . . . . . . . . . . . . . . . . . . . . . . . . . . . . . . . . . . . . . . . . . . . . .
6 Analyze and Tune 20. . . . . . . . . . . . . . . . . . . . . . . . . . . . . . . . . . . . . . . . . . . . . . . . . . . . . . . . . . . . . . . . . . . 6.1 Data Visualization 20. . . . . . . . . . . . . . . . . . . . . . . . . . . . . . . . . . . . . . . . . . . . . . . . . . . . . . . . . . . . . . . 6.2 Interactive Profiler 22. . . . . . . . . . . . . . . . . . . . . . . . . . . . . . . . . . . . . . . . . . . . . . . . . . . . . . . . . . . . . . . 6.3 Profile-Based Compilation (PBC) 23. . . . . . . . . . . . . . . . . . . . . . . . . . . . . . . . . . . . . . . . . . . . . . . . . .
6.3.1 PBC Tutorial and Demonstration 24. . . . . . . . . . . . . . . . . . . . . . . . . . . . . . . . . . . . . . . . . . . . 6.4 Visual Linker 24. . . . . . . . . . . . . . . . . . . . . . . . . . . . . . . . . . . . . . . . . . . . . . . . . . . . . . . . . . . . . . . . . . . . 6.5 Real-Time Analysis 26. . . . . . . . . . . . . . . . . . . . . . . . . . . . . . . . . . . . . . . . . . . . . . . . . . . . . . . . . . . . . . 6.6 General Extension Language (GEL) 27. . . . . . . . . . . . . . . . . . . . . . . . . . . . . . . . . . . . . . . . . . . . . . . 6.7 Open Plug-In Architecture 27. . . . . . . . . . . . . . . . . . . . . . . . . . . . . . . . . . . . . . . . . . . . . . . . . . . . . . . .
7 Summary 28. . . . . . . . . . . . . . . . . . . . . . . . . . . . . . . . . . . . . . . . . . . . . . . . . . . . . . . . . . . . . . . . . . . . . . . . . . .
List of Figures
Figure 1. Development Flow 4. . . . . . . . . . . . . . . . . . . . . . . . . . . . . . . . . . . . . . . . . . . . . . . . . . . . . . . . . . . . . . . Figure 2. Import Configuration Dialog Box 5. . . . . . . . . . . . . . . . . . . . . . . . . . . . . . . . . . . . . . . . . . . . . . . . . . . . Figure 3. Visually Configure Common Run-time Objects 7. . . . . . . . . . . . . . . . . . . . . . . . . . . . . . . . . . . . . . . Figure 4. Selection Margin 9. . . . . . . . . . . . . . . . . . . . . . . . . . . . . . . . . . . . . . . . . . . . . . . . . . . . . . . . . . . . . . . . . Figure 5. External Editor Settings 11. . . . . . . . . . . . . . . . . . . . . . . . . . . . . . . . . . . . . . . . . . . . . . . . . . . . . . . . . . Figure 6. FFT Waterfall 20. . . . . . . . . . . . . . . . . . . . . . . . . . . . . . . . . . . . . . . . . . . . . . . . . . . . . . . . . . . . . . . . . . . Figure 7. Constellation Plot 21. . . . . . . . . . . . . . . . . . . . . . . . . . . . . . . . . . . . . . . . . . . . . . . . . . . . . . . . . . . . . . . Figure 8. Eye Diagram 21. . . . . . . . . . . . . . . . . . . . . . . . . . . . . . . . . . . . . . . . . . . . . . . . . . . . . . . . . . . . . . . . . . . Figure 9. Image Display 22. . . . . . . . . . . . . . . . . . . . . . . . . . . . . . . . . . . . . . . . . . . . . . . . . . . . . . . . . . . . . . . . . .

SPRA004
3 Code Composer Studio IDE v2 White Paper
Figure 10. Profiler 22. . . . . . . . . . . . . . . . . . . . . . . . . . . . . . . . . . . . . . . . . . . . . . . . . . . . . . . . . . . . . . . . . . . . . . . . Figure 11. Trade-off: Code Size vs. Speed 24. . . . . . . . . . . . . . . . . . . . . . . . . . . . . . . . . . . . . . . . . . . . . . . . . . Figure 12. Visually Arranged Code Placement 25. . . . . . . . . . . . . . . . . . . . . . . . . . . . . . . . . . . . . . . . . . . . . . . Figure 13. Find and Fix Subtle Real-Time Problems 26. . . . . . . . . . . . . . . . . . . . . . . . . . . . . . . . . . . . . . . . . . Figure 14. GEL Controls 27. . . . . . . . . . . . . . . . . . . . . . . . . . . . . . . . . . . . . . . . . . . . . . . . . . . . . . . . . . . . . . . . . .
1 Introduction
With the emergence of new converging products that feature wireless communication, speechrecognition, multimedia, and Internet telephony all in the same device, designers are relying onDSPs to provide the computing horsepower necessary for crucial real-time performance.Programmable DSPs provide software engineers with the ability to reduce time-to-market whilestill providing an optimized solution for the application at hand. But effective software is requiredto fully harness the power of DSPs.
The size of development teams working on embedded projects is growing dramatically ascompanies drive to produce products that integrate several technologies. This, combined withtoday’s acquisition strategies, serves to produce development teams that may be spread acrossdifferent sites or even different continents.
In spite of these complications, developers often overlook the availability of sophisticated andeasy-to-use development tools when selecting of a processor for a real-time system. Such toolscan have a large impact on meeting time-to-market requirements. A development system thatoffers its users an expandable array of tools working seamlessly together empowers distributeddevelopment teams to focus on innovation, product differentiation, and time-to-market.

SPRA004
4 Code Composer Studio IDE v2 White Paper
2 Development Flow
The Code Composer Studio IDE, an integral component of TI’s software strategy, includes thefeatures necessary to take you through each step of the application development flow. All ofthese features are provided in an integrated product allowing developers to focus their energyon innovation.
Figure 1. Development Flow
3 Application Design
3.1 Code Composer Studio Setup
Code Composer Studio Setup is a utility that is used to define the target board or simulator youwill use with the Code Composer Studio IDE. This information is called the system configurationand consists of a device driver that handles communication with the target plus other informationand files that describe the characteristics of your target, such as the default memory map. TheCode Composer Studio IDE needs this information to establish communication with your targetsystem and to determine which tools are applicable for the given target.
With the exception of a DSP Starter Kit (DSK), which comes automatically configured for theDSK board, Code Composer Studio IDE will be configured for a simulator by default. You maywish to change the system configuration to match your environment prior to launching CodeComposer Studio IDE.
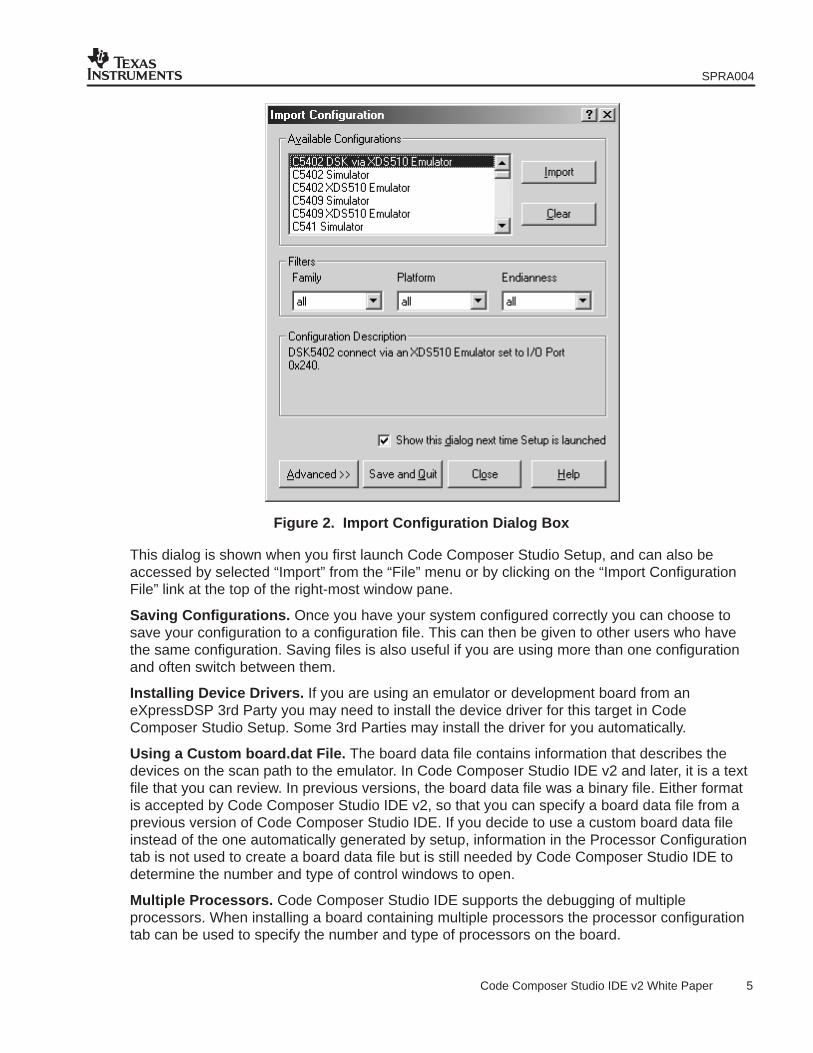
Supplied Configurations. A number of typical configurations are supplied in the form ofconfiguration files (*.ccs). All of these configurations are listed in the Import Configuration Dialog(Figure 2).
SPRA004
5 Code Composer Studio IDE v2 White Paper
Figure 2. Import Configuration Dialog Box
This dialog is shown when you first launch Code Composer Studio Setup, and can also beaccessed by selected “Import” from the “File” menu or by clicking on the “Import ConfigurationFile” link at the top of the right-most window pane.
Saving Configurations. Once you have your system configured correctly you can choose tosave your configuration to a configuration file. This can then be given to other users who havethe same configuration. Saving files is also useful if you are using more than one configurationand often switch between them.
Installing Device Drivers. If you are using an emulator or development board from aneXpressDSP 3rd Party you may need to install the device driver for this target in CodeComposer Studio Setup. Some 3rd Parties may install the driver for you automatically.
Using a Custom board.dat File. The board data file contains information that describes thedevices on the scan path to the emulator. In Code Composer Studio IDE v2 and later, it is a textfile that you can review. In previous versions, the board data file was a binary file. Either formatis accepted by Code Composer Studio IDE v2, so that you can specify a board data file from aprevious version of Code Composer Studio IDE. If you decide to use a custom board data fileinstead of the one automatically generated by setup, information in the Processor Configurationtab is not used to create a board data file but is still needed by Code Composer Studio IDE todetermine the number and type of control windows to open.
Multiple Processors. Code Composer Studio IDE supports the debugging of multipleprocessors. When installing a board containing multiple processors the processor configurationtab can be used to specify the number and type of processors on the board.

SPRA004
6 Code Composer Studio IDE v2 White Paper
The Code Composer Studio IDE also provides debug support for multiple processor cores ofdifferent ISAs (heterogeneous or co-emulation) connected on the same JTAG scan path. Theheterogeneous device driver provided with Code Composer Studio IDE v2 allow you to configurethe Code Composer Studio IDE to debug multiple CPUs of different ISAs located on the sameJTAG scan path. When the heterogeneous device driver is added to the Code Composer Studioconfiguration, heterogeneous co-emulation can be performed on any combination of CPU typesfor which an XDS510 device driver is installed.
GEL Startup Files. Startup files are used to configure the memory map of the debugger for thespecific processor that you are using.
3.2 DSP/BIOS
3.2.1 Real-time Operating System
As DSP applications become more complex, it is important to be able to structure them in anefficient, maintainable manner. This requires use of a real-time kernel that enables systemfunctions to be allocated to different threads. The DSP/BIOS kernel provides an efficient set ofkernel, real-time analysis, and peripheral configuration services, eliminating the need to developand maintain custom DSP operating systems. DSP/BIOS is an integral part of the CodeComposer Studio IDE. The kernel object browser displays the state of operating system objects,such as tasks and semaphores, and provides data on stack usage and stack overflow/underflow.As a result, developers can more easily debug their application and optimize use the operatingsystem and other system resources.
DSP/BIOS provides four major components that developers can use to get their applications upand running quickly. These consist of a real-time kernel, real-time analysis services, peripheralconfiguration libraries, and a graphical configuration tool.
DSP/BIOS provides a rich set of deterministic real-time kernel services, callable from C orassembler, which enable developers to create sophisticated applications without compromisingreal-time deadlines. To provide the fast response required by DSP applications, DSP/BIOSincludes Software Interrupts (SWIs) and Periodic Functions (PRDs), in addition to conventionaltasks. SWIs are lightweight preemptible threads that share a common stack, resulting in lowermemory overhead and faster context switch times. PRDs are time-triggered high-priority threadsthat can be easily set up to process samples of data arriving at fixed time intervals, simplifyingthe design of multi-rate systems. To facilitate the design of more complex applications,DSP/BIOS provides interrupt management, I/O mechanisms, and a rich set of inter-taskcommunication services, including semaphores, mailboxes, and queues.

SPRA004
7 Code Composer Studio IDE v2 White Paper
3.2.2 Configuration
The Code Composer Studio IDE provides a graphical host-based configuration tool that makes iteasy to for developers to configure all the services provided by DSP/BIOS. All DSP/BIOSobjects may be statically configured using this tool. Static configuration shrinks the targetmemory footprint by removing the code required to perform run-time creation of DSP/BIOSservices. It also enables many configuration errors to be detected at build time.
Figure 3. Visually Configure Common Run-time Objects
3.2.3 Chip Support Library (CSL)
For each supported processor, DSP/BIOS includes a set of peripheral management functionsand macros known as the Chip Support Library (CSL). The CSL supports on-chip peripherals forall TMS320C5000 and TMS320C6000 devices and is fully integrated into the DSP/BIOSConfiguration tool. Developer can use the CSL to shorten development time for device driverand initialization code. The CSL supports both graphical and programmatic peripheralconfiguration and control, eliminating the need to remember individual register flags settings orto painstakingly calculate bit maps.
3.3 TMS320 DSP Algorithm Standard
The TMS320 DSP Algorithm Standard is a set of coding conventions for algorithm writers thatreduces time-consuming system integration for anyone trying to put algorithms into their DSPsystem. This is achieved by defining common programming rules and guidelines with a set ofprogramming interfaces that are consistently used by algorithms across a wide variety ofapplications.
Content has been created to help both the creators and users of such standard algorithms. Thiscan be found in the TMS320 DSP Algorithm Standard Developer’s Kit. For the very first time,this developer’s kit has been fully integrated into the Code Composer Studio IDE, with therelease of CCStudio 2.0. There is no cost for this developer’s kit and no need to download anyadditional components. The Developer’s Kit breaks down into several distinctive areas:

SPRA004
8 Code Composer Studio IDE v2 White Paper
• The TMS320 DSP Algorithm Standard specification
• Application notes for both producers and users of algorithms
• Example code that will build on our common EVM (evaluation module) and DSK (starter kits)hardware platforms
• Tools that aid in the creation of standard header files
• A demonstration that illustrates the simplicity with which algorithms from different supplierscan be easily and quickly integrated into a single application.
By being fully integrated into the CCStudio IDE, the tools that are part of the developer’s kit areaccessible directly from the tools menu bar at the top of the Code Composer Studio window. Asignificant amount of online help has been made available to lead the user through, includingstep-by-step instructions on how to set up and run the demonstration. The demonstration can bestarted from the CCStudio menu bar.
There are an ever-growing number (350 at time of publication) of algorithms from TI’s third partynetwork that are compliant to the algorithm standard and can be easily integrated intoapplications that are under development using the Code Composer Studio IDE. For furtherinformation on the latest list of compliant algorithms visit www.dspvillage.com and select ThirdParty Compliant solutions.
4 Code and Build
4.1 Source Code Editor
The Code Composer Studio IDE includes fully integrated code editing environment tuned forwriting C, C++ and DSP assembly code. The editor provides standard editing features such as:keyword highlighting, printing, cut and paste, drag and drop, etc. The maximum number of linesper file is 2,147,483,648 and the maximum number of characters per line is 3500.
Floating toolbars support advanced operations such as finding the next matching brace andindenting text. The search and replace function makes it easy to change variable names. And toprovide users with the most customizable working environment possible, edit windows supporteither docking to, or floating outside, the parent window in any configuration. Fully integratedwith other facilities in the Code Composer Studio IDE like the debugger, the editor allowsdevelopers to easily edit code and see both source and disassembly at the same time.
Bookmarks. Use bookmarks to find and maintain key locations within your source files. Abookmark can be set on any line of any source file. Bookmarks are saved with a CodeComposer Studio workspace so that they can be recalled at any time.
The Bookmarks dialog box, as well as the bookmarks tab on the project view window, displaysthe complete list of bookmarks. Use the Bookmarks dialog box to manage all of your bookmarks.
Column Editing. Column editing is used when you want to select, cut, copy, paste, and deletecolumns of text. Then is very useful when manipulating data structures. To use column editingmode select Edit | Column Editing, or by pressing the keyboard sequence Ctrl + Shift + F8. Totoggle between column editing mode and regular mode hold the Alt key and highlight thecolumn. You can then cut, copy, paste, and delete the selected columns as desired.

SPRA004
9 Code Composer Studio IDE v2 White Paper
Selection Margin. By default, a Selection Margin is displayed on the left-hand side of integratededitor and Disassembly windows. Colored icons in the Selection Margin indicate that abreakpoint (red) or Probe Point (blue) is set at this location. A yellow arrow identifies the locationof the Program Counter (PC).
In the editor, the Selection Margin can be used to set or clear breakpoints. You can also displaythe line number and the marker points that are set for a given line. It is possible to turn off theselection margin using the Editor Properties tab in the Customize dialog box. The followingfigure (Figure 4) shows the editor with the Selection Margin on compared with one with it turnedoff.
Figure 4. Selection Margin
Mixed Mode. The source code editor supports mixed mode viewing of source. This displaymode interleaves the source code with the disassembled instructions that are on the targetprocessor. This mode is useful in determine the actual instructions that are being executed.
A program compiled with “Symbolic Debug” information has a limitation of 65535 lines. Whenviewing a source file in Mixed Mode, if the file contains more than 65535 lines, the disassemblyassociated with lines above 65535 is displayed incorrectly. For example, the disassembly for line65536 is displayed under line 1 of the source code. To work around this problem, compile yourprogram using “Dwarf Debug” information.
Cursor Mode. The editor provides two modes of selecting text and inserting spaces, Streammode and Virtual Whitespace mode. In Stream mode, the editor provides text selection andinsertion similar to most word processors. By default, Stream mode is selected. In VirtualWhitespace mode, the mouse or the arrow keys can be used to move the cursor to any locationwithin the document window. When you begin typing, any whitespace between the end of lineand the cursor is automatically filled with spaces. Similarly, when selecting text, any areasbeyond the end of line are automatically filled with spaces.
Custom Keywords. The integrated editor features keyword highlighting. Keywords, comments,strings, assembler directives, and GEL commands are highlighted in different colors. Keywordhighlighting is available for C, C++, Assembly, and GEL files. When a source file is opened orsaved, the editor recognizes the file extension (.c, .cpp, .asm, .gel) and the appropriate keywordhighlighting is automatically applied. In addition, new sets of keywords can be created, or thedefault keyword sets can be customized and saved in keyword files (*.kwd).

SPRA004
10 Code Composer Studio IDE v2 White Paper
Keyword highlighting can be customized according to the file type and the target processor.Keyword files are simple ASCII text files containing a set of keywords separated by carriagereturns. You can create a custom keyword file from scratch by using any text editor, or you maymake a copy of a default keyword file and then edit it as desired. Four default keyword files areprovided. If you installed the Code Composer Studio product in c:\ti, the default keyword filescan be found c:\ti\cc\bin\Editor\Keywords\Base. Custom keyword files should be created inc:\ti\cc\bin\Editor\Keywords\Custom. You can add to the list of file extensions that arehighlighted.
The Code Composer Studio file keyword.ini stores information about the installed keyword files.The keyword.ini file resides in the Editor folder. If CCStudio cannot find keyword.ini, it will promptyou to enable the default keyword highlighting feature.
4.1.1 External Editor Support
It is possible to use an external source code editor in conjunction with the Code ComposerStudio IDE. To configure an external editor you need to specify a number of command lineparameters that the editor uses to perform common tasks such as opening a file. Thecommands can be specified through the Editors Properties tab in the customize dialog. Providedwith the Code Composer Studio IDE installation are a number of configuration files that containthese parameters for a number of popular editors. These can be selected through the loadbutton and then look in the external editors directory. Once you have configured an editor youcan save the settings to a file to be shared with other members of your team.

SPRA004
11 Code Composer Studio IDE v2 White Paper
Figure 5. External Editor Settings
4.2 CodeMaestro Technology
Enable advanced editor features. Enable or disable all the options listed in this dialog. Changingthis setting causes all open document windows to be saved, closed, and then reopened.
Suggest Word: Automatically suggest words. The editor automatically tries to recognize theword you are typing. When enough characters have been typed to enable the editor to uniquelyidentify a word, the word is displayed in a pop-up window. To insert the suggested word, pressthe Tab key.
Complete words. Type the first couple of characters of a word, then press the Tab key todisplay a list of suggested word completions. To select a word from the list, type enoughcharacters to highlight the desired word.
Automatically display parameter info. When typing a function call, parameter information isautomatically displayed.
Type the function name or locate the cursor immediately after a function name. Now type theopen parenthesis to begin the parameter list. The editor displays the function declaration in apopup window that appears below the cursor. The first parameter in the list is highlighted. Typinga comma causes the next parameter to be highlighted.

SPRA004
12 Code Composer Studio IDE v2 White Paper
For overloaded functions, the function declarations of all overloaded functions are available. Tomove forward or backward through the list of function declarations, press Ctrl + Page Up or Ctrl+ Page Down.
To close the popup window, press the Escape key. To reopen the popup window, press Ctrl +Shift + Space. The popup window also closes when you complete the parameter list and typethe close parenthesis.
Automatically list members. A member function or variable is specified using the syntaxobject.member. A list of the members available for an object is displayed after you type theperiod that separates the object name and the member name. To select a member from the list,type enough characters to highlight the desired member.
Automatically correct case. When selected, the editor tries to identify the keyword that you aretyping. After typing the space following the end of the keyword, the editor automatically convertsthe word to the proper case.
4.3 Project Manager
The Project Management system has been broadened and improved to include multiproject/multi configuration support and source code control, as well as the ability to interface toexternal build processes. The new Project Manager can support projects containing thousandsof source files. These features were designed with large distributed development teams in mind.
The project manager organizes your files into folders for source, library, configuration, includeand generated files. This allows you to easily navigate through your source files. The projectmanager automatically scans dependencies removing the need to add dependent files to theproject. These files are shown in the include folder in the project view window.
Project File. The project file itself is a text file that can be edited manually. This is useful forbatch environments or for generating the project file via a script. The project file stores all of thebuild options for each configuration in the project.
4.3.1 Project Configurations
The Code Composer Studio Project Manager now supports multiple build configurations.Multiple build configurations allow, for example, a Debug Configuration and a ReleaseConfiguration of build options. Separate configurations for Debug and Release are helpfulbecause they allow for two independent builds without making any changes to the projectoptions. The compile/link options separate and independent folders are created to hold all theoutput files generated during the build process. The names of the folders match theconfiguration name so it is easy to track where the output files for a particular configuration are.Any build configuration that you want to capture and save can be stored and later retrieved forbit exact rebuilds.
4.3.2 Multiple Project Support
It is quite typical for a developer to have more than one project going at once. They may havesome maintenance work to do on an old project, another project that represents the next productrelease and perhaps some exploratory work as well. The Code Composer Studio ProjectManager allows you to have multiple projects open simultaneously and easily switch betweenthem. With larger applications it is likely that the work will be divided up into a series of librarieseach represented by a different project file. Code Composer Studio IDE allows you to easilybring these projects together.

SPRA004
13 Code Composer Studio IDE v2 White Paper
4.3.3 Source Control
Code Composer Studio IDE allows a developer the capability to interface a preferred sourcecode control software application directly through the Project Manager or pull-down menus. TheCode Composer Studio IDE supports any source control provider that correctly implements theMicrosoft SCC Interface. Some of the more popular source control systems that are compatiblewith CCStudio are Rational’s ClearCase, Microsoft’s SourceSafe, Starbase StarTeam PVCS orMKS. Once CCStudio is interfaced with the source code control application, the project willdisplay visually which files are checked in or out. Source code control is essential for softwaredevelopment projects of all sizes. It helps with revision control, branching and merging ofchanges, and backups.
The project view window will list all the source files that are in a particular project in the sourcefolder. Files that are ‘checked out’ to the source control system will have green checks to the leftof the name. If a file is checked out, it can be opened in an Editor window and modifiedaccordingly. Files that are ‘checked in’ to the source code control system will be indicated by redchecks to the left of the name. These ‘checked in’ files can be opened for viewing in an Editorwindow but they are read only so changes cannot be saved.
Once a source code control provider is selected, that provider’s tools are used whenever any ofthe source code control commands are invoked within the Code Composer Studio IDE. Thesource code control features are limited by the capabilities of the provider.
4.3.4 Building Libraries
Code Composer Studio IDE supports the creation of archives. When creating a new project youcan specify if the project is an executable or a library. When building a library project all the buildoptions are selectable as with any other project except the linker. Since there is no executableoutput the linker is not needed and this is replaced with the options for the archiver.
4.3.5 Custom Build Steps
Custom build steps are extremely helpful at automating steps that are done before and/or afterthe compiling/linking phase. An example of a post-build step would be converting the coff outputfile to hex format file. An example of a step that could be automated either pre- or post-build iscopying files from one location to another.
If file-specific custom build options are required they can be specified here in the file specificbuild options dialog box. You may want to exclude a particular file from a build while still keepingit in the project. These options are used to override the standard build tools and replace themwith user specific tools. Typically this is used in conjunction with external makefiles.
Exclude file from build. The selected file is excluded from the build process. By default, thisoption is turned off.
Use custom build step. Activate the Custom Build Setting fields. Choosing this option enablesyou to specify custom build commands. By default, this option is turned off.
Custom Build Setting. After selecting “Use custom build step”, you can specify custom buildcommands for the selected file.
Build Command. Enter the command line to be executed to complete a build.

SPRA004
14 Code Composer Studio IDE v2 White Paper
Outputs. Enter a path and filename for the executable file and any intermediate files generatedby the build command.
Clean Command. Enter the command line to be executed to remove any files generated by thebuild command.
Important: If any custom build step involves launching Texas Instruments code generation tools,you must execute the batch file DosRun.bat to set up the necessary PATH and environmentvariables (C_DIR, A_DIR…). It is recommended that you execute DosRun.bat as the first step ofthe initial build steps. If Code Composer Studio IDE is installed in the default location, the batchfile is located in the directory the main installation directory, which is usually c:\ti.
4.3.6 Using External Makefiles
This feature of the Project Manager allows the developer to use a makefile (*.mak) created for alegacy product development. If for instance you had an existing build process outside of CodeComposer Studio IDE and now you wanted to build within Code Composer Studio IDE, youwould use the “Use External Makefile” build option. The existing makefile will be called fromwithin Code Composer Studio IDE, giving the effect of a fully integrated build environment. It isnecessary to specify the commands used to launch the make process and how source files aredefined in the makefile so that the makefile can be parsed and the source files displayed in thesource folder of the Project View. The parsing is done using regular expressions.
A Code Composer Studio project is created that contains the external makefile. Now that aproject is associated with the makefile, the project and its contents can be displayed in theProject View window and the Project→Build and Project→Rebuild All commands can be used tobuild the project.
4.3.7 Exporting Makefiles
A Code Composer Studio project can be exported to a standard makefile, saving the user thetime of manually recreating the extensive build steps followed by Code Composer Studio IDE.The makefile is compatible with any make utility derived from the standard make utility. Codedevelopment projects can be developed using the Code Composer Studio IDE, while final buildsare done in some other environment., even be on another operating system. By using the Exportto a makefile utility a makefile is created for use in this environment. This may be necessary ifyour build environment is on a UNIX platform.
4.3.8 Command-Line Build Utility (timake.exe)
Code Composer Studio IDE provides an external build utility that allows projects (*.pjt) to be builtoutside of the IDE. This allows projects to be integrated into larger system builds. These systembuilds, for example, could include a host processor. Now the DSP and Host processor codebases can be built from one master makefile or batch file. The master makefile or batch file willcall the timake utility to build the DSP portion of the system. The timake.exe utility takes a *.pjtfile and other options and generates an output file specified by the options set in the *.pjt file.

SPRA004
15 Code Composer Studio IDE v2 White Paper
4.4 Code Generation Tools
In the past, developing high performance DSP code has required to developer to optimizeassembly code by hand and to have an intimate knowledge of the particular DSP architecture.Because time-to-market is becoming increasingly important, while the time and skill to optimallycode a DSP are increasingly hard to find, there is a need for a more robust code developmentenvironment. The Code Composer Studio compile tools address this need by shifting the burdenof optimization from hand-coded assembly to the C Compiler. With these tools it is possible toexploit the high performance of TI’s DSP platforms without ever writing hand-coded assembly.
4.4.1 C6000 Code Generation Tools
For the embedded software developer, TI’ s C6000 Compile Tools – co-developed with the DSParchitecture – offer best in class performance due to industry leading global view analysis andarchitecture specific optimizations including interactive profiling, tuning and feedback.
One of the major areas of focus for the C6000 compiler has been VLIW architecture specificoptimizations. Since the release 1.0 of the C6000 tools in Feb 1997, TI has continued to drive Cperformance improvements on key DSP MIPS intensive code. Software pipelining, data pathpartitioning, inner and nested loop optimization, unrolling, and predication form the basis of theC6000 specific enhancements included.
In addition to this core set of optimizations, TI offers something unique in the industry calledcompiler feedback, telling the developer exactly how the compiler did and what potential areascould be improved. This, used in conjunction with the compiler tutorial feedback solutions, canbe used to provide the developer valuable insight when tuning C code.
To fully understand what makes the C6000 Compile tools best in industry be sure to check outthe C6000 Compiler Optimization Tutorial, Assembly Optimizer and Profile Based Compilationas well.
4.4.2 C5000 Code Generation Tools
Code Composer Studio IDE v2 offers a 50% increase in C/C++ compiler performance on thenew TMS320C55x devices. In addition, this release extends upon industry leading controlcode size efficiency. Along with the C/C++ compiler, assembly language tools provide allow for afully compatible upgrade path from TMS320C54x assembly.
TMS320C55x and TMS320C54x are trademarks of Texas Instruments.

SPRA004
16 Code Composer Studio IDE v2 White Paper
5 Debug
5.1 Debugger
The Code Composer Studio debugger helps you find and fix errors in your real-time embeddedsoftware programs. Debugger commands enable you to control program execution. Debuggerwindows and dialogs allow you to view source code and track the values of program variables inmemory and registers. Breakpoints enable you to stop execution at a specified location andexamine the current state of the program.
Memory Window. The Memory window allows you to view the contents of memory starting at aspecified address. Options enable you to format the Memory window display. You can also editthe contents of a selected memory location.
Registers Window. The Register windows enable you to view and edit the contents of the CPUregisters and the Peripheral Registers.
Disassembly Window. The Disassembly window displays disassembled instructions andsymbolic information needed for debugging. Disassembly reverses the assembly process andallows the contents of memory to be displayed as assembly language code. Symbolicinformation consists of symbols and strings of alphanumeric characters that representaddresses or values on the target.
Call Stack. Use the Call Stack window to examine the function calls that led to the currentlocation in the program that you are debugging. The call stack only works with C programs.Calling functions are determined by walking through the linked list of frame pointers on theruntime stack. Your program must have a stack section and a main function; otherwise, the callstack displays following the message: C source is not available.
Symbol Browser. The Symbol Browser displays all of the associated files, functions, globalvariables, types, and labels of a loaded COFF output file (*.out). From the Symbol Browser youcan open the source code for a file or function in the text editor. You can also use the SymbolBrowser to create a profile area. When creating a C++ application the Symbol Browser willfunction as a C++ class browser.
Watch Window. When debugging a program, it is often helpful to understand how the value of avariable changes during program execution. The Watch window allows you to monitor the valuesof local and global variables and C/C++ expressions. The Watch Locals tab of the Watchwindow provides a special type of Watch window. In this window, the debugger automaticallydisplays the values of variables that are local to the currently executing function. You canchange the format used to display the value of a watch variable or expression. The defaultdisplay format is based on the type of the variable.
Command Window. The Command Window enables you to specify commands to the CodeComposer Studio debugger using the TI Debugger command syntax. Many of the commandsaccept C expressions as parameters. This allows the instruction set to be relatively small, yetpowerful. Because C expressions can have side effects (that is, the evaluation of some types ofexpressions can affect existing values) you can use the same command to display or change avalue.

SPRA004
17 Code Composer Studio IDE v2 White Paper
5.1.1 Probe Points
A Probe Point can be set at any point in your algorithm (similar to the way a breakpoint is set).When the execution of the program reaches a Probe Point, the connected object (whether it is afile, graph, or Memory window) is updated. Once the connected object is updated, executioncontinues. When Probe Points are set, you can enable or disable them just like breakpoints.
When a window is created, by default, it is updated at every breakpoint. However, you canchange this so the window is updated only when the program reaches the connected ProbePoint.
File I/O. The debugger allows you to stream, or transfer, data to or from the actual/simulatedtarget from a PC file. This is a great way to simulate your code using known sample values. TheFile I/O feature uses Probe Points , which allow you to extract/inject samples or take a snapshotof memory locations at a point you define (Probe Point). If you set a Probe Point at a specificpoint in your code and then connect a file to it, you can implement file I/O functionality. File I/Ocoupled with Probe Points are two excellent tools that can help developers automate test casesagainst a know set of resultant values.
5.1.2 Parallel Debug Manager
The Parallel Debug Manager (PDM) allows you to synchronize multiple processors. If you haveseveral processors and a device driver that supports them, the PDM is enabled when you startCode Composer Studio IDE. From the PDM menu bar, you can open individual parent windowsto control each processor or you can broadcast commands to a group of processors.
Synchronized Commands. All commands in the Parallel Debug Manager (PDM) are broadcastto all target processors in the current group. If the device driver supports synchronous operationthese commands are synchronized to start at the same time on each processor. The followingcommands are supported: Locked Step, StepOver, StepOut, Run, Halt and Animate.
5.2 Real-Time Data Exchange (RTDX)
The data visualization tools included with Code Composer Studio IDE (described in detail insection 6.1) are excellent for proving the correctness of DSP algorithms. Once algorithms areintegrated into applications, the real-time behavior of the system must be observed. Real-TimeData Exchange, or RTDX, provides significant benefits over alternative methods of systemvisualization. Until recently, developers were forced to stop their application with a breakpoint toexchange data ”snapshots” with the host computer, in a technique that’s called ”stop-modedebugging”. This intrusive method of debugging may yield misleading information because theisolated snapshot of a halted high-speed application does not present an accurate view of thesystem’s real-world operation.
RTDX is a technology that was invented by Texas Instruments, just as its foundation, JTAGemulation was. RTDX gives designers the industry’s first DSP system that provides real-time,continuous visibility into the way target applications operate in the real world. RTDX allowsdevelopers to transfer data between the host computer and DSP devices without stopping theirtarget application.
TMS320C6000, C6000, TMS320C5000, C5000, Code Composer Studio, CodeMaestro, DSP/BIOS and RTDX are trademarksof Texas Instruments.
SPRA004
18 Code Composer Studio IDE v2 White Paper
This important breakthrough shortens development time by giving developers a much morerealistic representation of the way their systems operate. Just as modern medical diagnosticequipment provides a real-time, ongoing analysis of the way a patient’s body is functioning,RTDX allows designers to continually monitor their systems and gain real-time insight into theirrunning applications.
RTDX runs asynchronously, in real-time, between the target and the host, and is alsomultiplexed. RTDX can transfer data bi-directionally, and thus allows the developer to eitheraccess data at a specific point in their application and visualize that data as it changes in realtime as the application executes, or to simulate data input down to the DSP from (for example) asensor.
RTDX is implemented with a small monitor (less than 2 Kilobytes) that is included as a part ofDSP/BIOS. The target application makes calls to RTDX functions as needed to log the databack to the host over the JTAG connection, and the data can then be logged in either continuousor snapshot modes.
When the RTDX data is received on the host, it is available from Code Composer Studio IDEthrough an industry standard Microsoft ActiveX API that allows separate applications tocommunicate with each other. This is a key capability, as it allows RTDX data to be streamedinto any other ActiveX-compliant application, including common desktop data visualizationsoftware such as Microsoft Excel, Visual Basic, Visual C++, and Visual J++, data acquisitionpackages such as National Instruments LabVIEW, and signal processing analysis systems suchas MATLAB from The Math Works. Developers can also easily create their own visualizationapplications, since they know best how to visualize or analyze the application data. To makethings run right out of the box, there is even a general-purpose display that is included with theproduct to help developers view their data in a standard format as well.
When displaying RTDX data, host applications can read either live or saved data, that is, datathat is being received in real-time from the executing application, or data that has already beenrecorded in a log file, and is being ”played back”. Multiple host applications can even be runsimultaneously, all reading or writing RTDX data at the same time.
With Code Composer Studio IDE v2 it is now possible to run RTDX with the instructionsimulator, allowing RTDX to be used before target hardware is available. This also makes itpossible to use DSP/BIOS Real-Time Analysis (RTA) with only the simulator, as RTDX is thedata transfer mechanism used for Real-Time Analysis. Another new RTDX capability in CodeComposer Studio IDE v2 is heterogeneous multiprocessor support, where RTDX can run onmultiple targets simultaneously. This support is available for the C6000, C5000, and TMS470ISA families. Heterogeneous multiprocessor RTDX can be used with multiple processors oneither the same or different scan paths. One advanced use of heterogeneous multiprocessorRTDX is to have multiple processors communicating with each other via RTDX, where there cantheoretically be any number of processors communicating with each other.
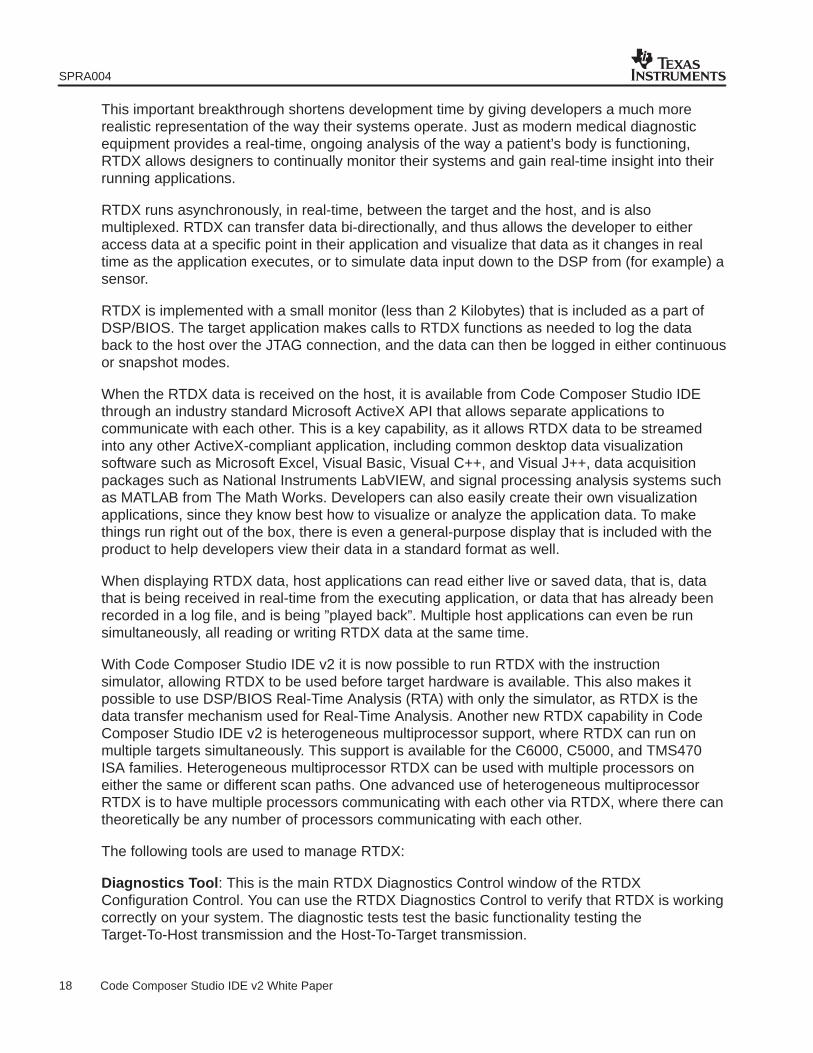
The following tools are used to manage RTDX:
Diagnostics Tool: This is the main RTDX Diagnostics Control window of the RTDXConfiguration Control. You can use the RTDX Diagnostics Control to verify that RTDX is workingcorrectly on your system. The diagnostic tests test the basic functionality testing theTarget-To-Host transmission and the Host-To-Target transmission.

SPRA004
19 Code Composer Studio IDE v2 White Paper
Configuration Tool: This is the main RTDX Configuration Control window. It allows you to viewthe current RTDX configuration settings, enable/disable RTDX and access the RTDXConfiguration Control Properties window for configuring the RTDX setup.
Channel Viewer: This is the main RTDX Channel Viewer Control window of the RTDXConfiguration Control. The RTDX Channel Viewer Control is an ActiveX control thatautomatically detects target-declared channels and adds them to the viewable list. The RTDXChannel Viewer Control also allows you to remove or re-add target-declared channels to theviewable list when desired, and enable or disable channels once they have been added to thelist.
5.3 Advanced Event Triggering (AET)
Advanced Event Triggering is designed to make hardware analysis much easier that in the past.AET is only available on new hardware targets that have the appropriate analysis interface.
Event Analysis. Event Analysis uses a simple interface to help you configure commonhardware debug tasks called jobs. Setting breakpoints, action points, and counters is easy witha right-click menu and drag-and-drop jobs. You can access Event Analysis from the tools menu,or by right clicking in a source file.
Event Sequencer. Event Sequencer allows you to look for conditions to occur in your targetprogram and cause actions to occur when those conditions are detected. While the CPU ishalted, you define the conditions and actions, and then run your target program. The sequenceprogram then looks for the condition and performs the action you requested.

SPRA004
20 Code Composer Studio IDE v2 White Paper
6 Analyze and Tune
6.1 Data Visualization
Code Composer Studio IDE incorporates an advanced signal analysis interface that enablesdevelopers to monitor signal data critically and thoroughly. The new features are useful indeveloping applications for communications, wireless, and image processing, as well as forgeneral DSP applications.
Time/frequency. You can use a time/frequency graph to view signals in either the time orfrequency domain. For frequency domain analysis, the display buffer is run through an FFTroutine to give a frequency domain analysis of the data. Frequency graphs include FFTMagnitude, FFT Waterfall, Complex FFT, and FFT Magnitude and Phase. In time domainanalysis, no preprocessing is done on the display data before it is graphed. Time domain graphscan be either single or dual time.
Figure 6. FFT Waterfall

SPRA004
21 Code Composer Studio IDE v2 White Paper
Constellation Plot. You can use a constellation graph to measure how effectively theinformation is extracted from the input signal. The input signal is separated into two componentsand the resulting data is plotted using the Cartesian coordinate system in time, by plotting onesignal versus the other (Y source versus X source, where Y is plotted on the Y axis and X on theX axis).
Figure 7. Constellation Plot
Eye Diagram. You can use an eye diagram to qualitatively examine signal fidelity. Incomingsignals are continuously superimposed upon each other within a specified display range and aredisplayed in an eye shape. The signal’s period is shown over time by plotting the signal seriallyand wrapping it back when 0 crossings are detected. These are reference points at which asignal (specified by the data source) can wrap back to the beginning of the window frame.
Figure 8. Eye Diagram
SPRA004
22 Code Composer Studio IDE v2 White Paper
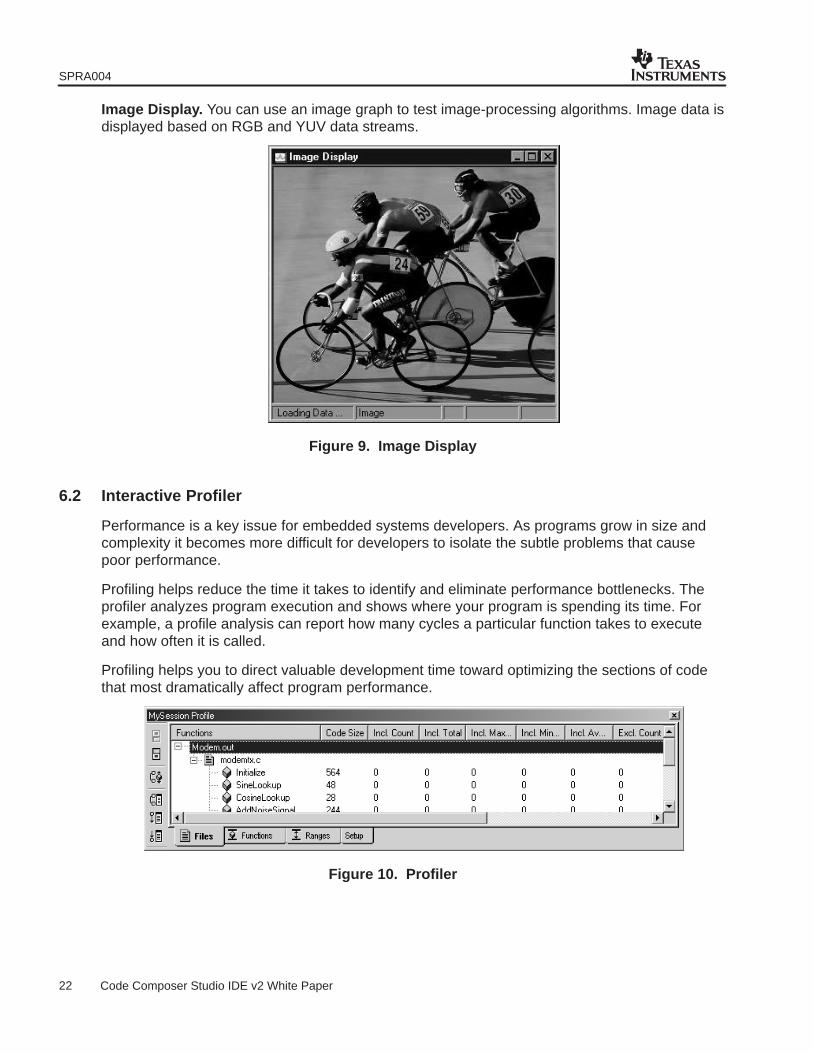
Image Display. You can use an image graph to test image-processing algorithms. Image data isdisplayed based on RGB and YUV data streams.
Figure 9. Image Display
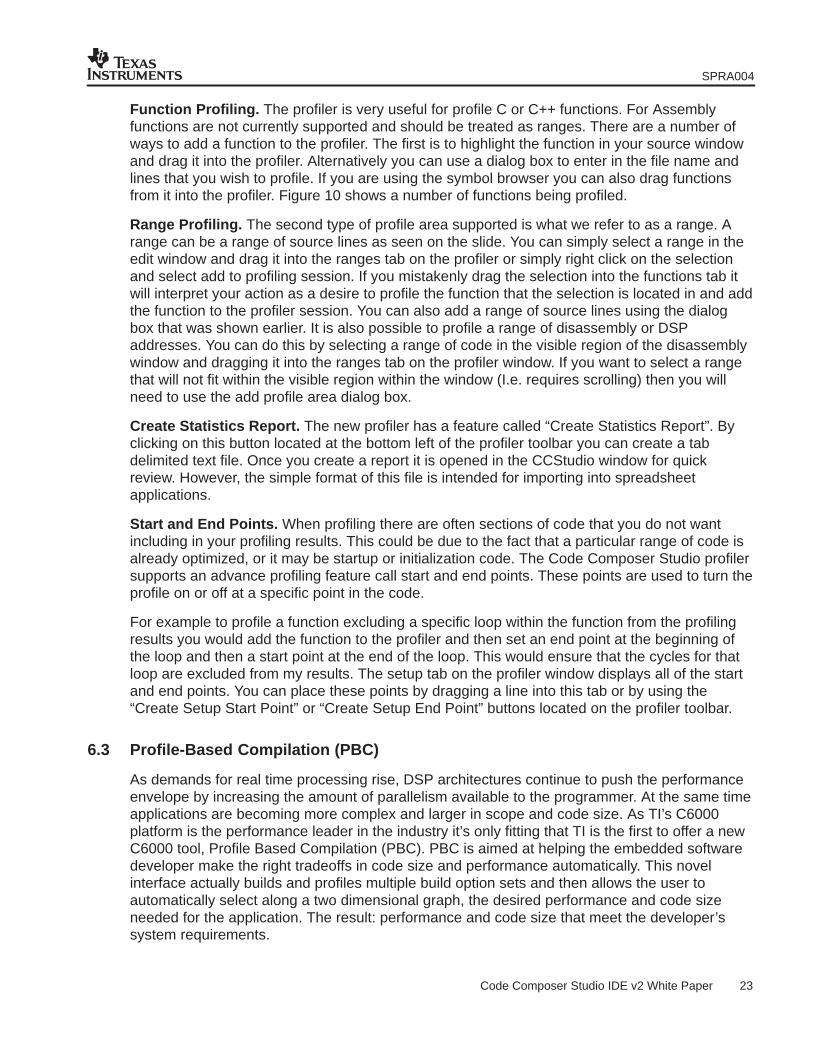
6.2 Interactive Profiler
Performance is a key issue for embedded systems developers. As programs grow in size andcomplexity it becomes more difficult for developers to isolate the subtle problems that causepoor performance.
Profiling helps reduce the time it takes to identify and eliminate performance bottlenecks. Theprofiler analyzes program execution and shows where your program is spending its time. Forexample, a profile analysis can report how many cycles a particular function takes to executeand how often it is called.
Profiling helps you to direct valuable development time toward optimizing the sections of codethat most dramatically affect program performance.
Figure 10. Profiler
SPRA004
23 Code Composer Studio IDE v2 White Paper
Function Profiling. The profiler is very useful for profile C or C++ functions. For Assemblyfunctions are not currently supported and should be treated as ranges. There are a number ofways to add a function to the profiler. The first is to highlight the function in your source windowand drag it into the profiler. Alternatively you can use a dialog box to enter in the file name andlines that you wish to profile. If you are using the symbol browser you can also drag functionsfrom it into the profiler. Figure 10 shows a number of functions being profiled.
Range Profiling. The second type of profile area supported is what we refer to as a range. Arange can be a range of source lines as seen on the slide. You can simply select a range in theedit window and drag it into the ranges tab on the profiler or simply right click on the selectionand select add to profiling session. If you mistakenly drag the selection into the functions tab itwill interpret your action as a desire to profile the function that the selection is located in and addthe function to the profiler session. You can also add a range of source lines using the dialogbox that was shown earlier. It is also possible to profile a range of disassembly or DSPaddresses. You can do this by selecting a range of code in the visible region of the disassemblywindow and dragging it into the ranges tab on the profiler window. If you want to select a rangethat will not fit within the visible region within the window (I.e. requires scrolling) then you willneed to use the add profile area dialog box.
Create Statistics Report. The new profiler has a feature called “Create Statistics Report”. Byclicking on this button located at the bottom left of the profiler toolbar you can create a tabdelimited text file. Once you create a report it is opened in the CCStudio window for quickreview. However, the simple format of this file is intended for importing into spreadsheetapplications.
Start and End Points. When profiling there are often sections of code that you do not wantincluding in your profiling results. This could be due to the fact that a particular range of code isalready optimized, or it may be startup or initialization code. The Code Composer Studio profilersupports an advance profiling feature call start and end points. These points are used to turn theprofile on or off at a specific point in the code.
For example to profile a function excluding a specific loop within the function from the profilingresults you would add the function to the profiler and then set an end point at the beginning ofthe loop and then a start point at the end of the loop. This would ensure that the cycles for thatloop are excluded from my results. The setup tab on the profiler window displays all of the startand end points. You can place these points by dragging a line into this tab or by using the“Create Setup Start Point” or “Create Setup End Point” buttons located on the profiler toolbar.
6.3 Profile-Based Compilation (PBC)
As demands for real time processing rise, DSP architectures continue to push the performanceenvelope by increasing the amount of parallelism available to the programmer. At the same timeapplications are becoming more complex and larger in scope and code size. As TI’s C6000platform is the performance leader in the industry it’s only fitting that TI is the first to offer a newC6000 tool, Profile Based Compilation (PBC). PBC is aimed at helping the embedded softwaredeveloper make the right tradeoffs in code size and performance automatically. This novelinterface actually builds and profiles multiple build option sets and then allows the user toautomatically select along a two dimensional graph, the desired performance and code sizeneeded for the application. The result: performance and code size that meet the developer’ssystem requirements.

SPRA004
24 Code Composer Studio IDE v2 White Paper
6.3.1 PBC Tutorial and Demonstration
A self-paced demo/tutorial begins automatically the first time you run PBC. Included with thedemo/tutorial is a code example ready to run. Simply follow the wizard as it walks you throughsix easy steps with the click of a mouse to make the right code size vs. performance tradeoff.
Once you select the performance and code size you want, the solution window displays everyfunction’s cycle count, code size, and option set in a window that can be sorted by each column.Once you are satisfied with the selected solution, simply click build and each function is builtwith the appropriate compiler option sets.
Figure 11. Trade-off: Code Size vs. Speed
6.4 Visual Linker
Linking is a process that is largely unnoticed or ignored in native development where the use ofvirtual memory makes it a non-issue. However, linking is a critical part of the applicationdevelopment process for real-time DSP applications. In embedded systems matching the partsof a DSP application with the correct types, speeds, and sizes of memory (on-chip, SRAM,DRAM, SARAM, DARAM, PROM, FLASH, etc.) means the difference between meeting andmissing real-time deadlines. The criticality of program and data placement to performance, theincreasing size of applications, and the increasing variety of types of memory has driven theneed for a more graphical, interactive linking environment for embedded system developers.
The new Visual Linker for the C5000 and C6000 DSP platforms dramatically simplifies linking,reduces time-to-market, decreases application size, and helps boost performance. Utilizing aWindows Explorer like interface, the Visual Linker provides the ability to: drag-and-drop programcomponents into multiple and different memory types and areas; choose from a library ofstandard memory maps; uncover opportunities for optimization using immediate visual feedbackon memory allocation; and reduce application size with fine-grained automatic elimination ofunused code and data.

SPRA004
25 Code Composer Studio IDE v2 White Paper
Figure 12. Visually Arranged Code Placement

SPRA004
26 Code Composer Studio IDE v2 White Paper
6.5 Real-Time Analysis
To properly assess the performance of a system, developers must be able to view both the dataoutput and the timing relationships between tasks in the system. In years past, developers hadto implement their own instrumentation as they progressed through testing and evaluation. Theincreasing complexity of today’s systems with high throughput, multiple data channels, andmultiple tasks, demands a new approach.
Real-time analysis tools are required to act as a visualization aid allowing developers to see thetime-related interactions between code sections. This can bring to light subtle real-time problemsthat might otherwise go undetected. Developers need tools that provide the capability to analyzedata acquired during the real-time execution of software – i.e. a software logic analyzer. In orderfor these tools to function it is necessary for there to exist a real-time link and awarenessbetween the host development environment and the DSP target. By addressing and meetingthese needs, Code Composer Studio IDE allows developers to probe, trace and monitor a DSPapplication while it runs. Even after the program has halted, information already capturedthrough real-time analysis tools can provide invaluable insight into the sequence of events thatled up to the current point of execution. As real-time system developers say, ‘If a problem can befound then it can be fixed’.
Figure 13. Find and Fix Subtle Real-Time Problems
Debug and analysis is essentially a double-edged sword. Early in development users areconcerned with the algorithm returning the correct data values. Later in development, asdevelopers try to achieve maximum integration and functionality, they need to see the subtletiming relationships between threads. The intrinsic diagnostic features of Code Composer StudioIDE’s API’s on the target give developers low overhead statistics and control. The CPU loadgraph illustrates the level of processor loading against program execution, enabling developersto determine areas where CPU resources are being stretched or where there is headroom toadd more functions.

SPRA004
27 Code Composer Studio IDE v2 White Paper
Real-time analysis tools are used when transitioning from the debug phase to the run-timephase of development. At this time, the tools can show subtle problems arising fromtime-dependent interaction of program components. These tools are the software counterpart ofthe ubiquitous hardware logic analyzer. In addition, the real-time logging/analysis capabilitiesprovided by DSP/BIOS and RTDX technology are the foundation paving the way for a newgeneration of manufacturing and field diagnostic tools that can analyze and troubleshoot in thefield.
6.6 General Extension Language (GEL)
The General Extension Language (GEL) is an interpretive language similar to C that lets youcreate functions to extend Code Composer Studio IDE’s usefulness. You create your GELfunctions using the GEL grammar and then load them into Code Composer Studio IDE. WithGEL, you can access actual/simulated target memory locations and add options to CodeComposer Studio IDE’s GEL menu. GEL is particularly useful for automated testing. You can callGEL functions from anywhere that you can enter an expression. You can also add GELfunctions to the Watch window so they execute at every breakpoint.
Keywords are used to add GEL functions to the GEL menu of Code Composer Studio IDE. Themenuitem keyword is used to create a new drop-down list of items in the GEL menu. You canthen use the keywords hotmenu, dialog, or slider to add new menu items. When you select auser defined menu item (under the GEL menu), a dialog box or slider object appears. Thehotmenu keyword adds a GEL function to the GEL menu and when selected, it immediatelyexecutes that specific function. The dialog keyword creates a GUI dialog window for parameterentry. Once the appropriate parameters are entered, hit the execute button to call the function.The slider keyword creates an adjustable controller that can vary the value of a singleparameter.
Figure 14. GEL Controls
6.7 Open Plug-In Architecture
Today’s highly complex system designs often require hardware and software tools with morecapabilities than those previously available. Code Composer Studio IDE’s open plug-inarchitecture allows developers to easily extend the IDE to match their growing needs. Byleveraging DSP’s most extensive third-party network, designers can select third-party tools toplug into the Code Composer Studio development environment. Not only is this a betteralternative to buying separate applications to meet new requirements, it also helps reduce therisk to developers. By allocating fewer resources to developing individual utilities, developerscan spend more time testing the end product, resulting in increasing an application’s robustness.

SPRA004
28 Code Composer Studio IDE v2 White Paper
7 Summary
Code Composer Studio IDE v2.0 represents the evolution of the DSP development environment.It contains all of the functionality needed by today’s larger, distributed, global project teams. Theintelligent IDE can help save valuable development time by making developers more productiveenabling them to focus their energies on innovation instead of repetitive tasks and tooldevelopment.

IMPORTANT NOTICE
Texas Instruments Incorporated and its subsidiaries (TI) reserve the right to make corrections, modifications,enhancements, improvements, and other changes to its products and services at any time and to discontinueany product or service without notice. Customers should obtain the latest relevant information before placingorders and should verify that such information is current and complete. All products are sold subject to TI’s termsand conditions of sale supplied at the time of order acknowledgment.
TI warrants performance of its hardware products to the specifications applicable at the time of sale inaccordance with TI’s standard warranty. Testing and other quality control techniques are used to the extent TIdeems necessary to support this warranty. Except where mandated by government requirements, testing of allparameters of each product is not necessarily performed.
TI assumes no liability for applications assistance or customer product design. Customers are responsible fortheir products and applications using TI components. To minimize the risks associated with customer productsand applications, customers should provide adequate design and operating safeguards.
TI does not warrant or represent that any license, either express or implied, is granted under any TI patent right,copyright, mask work right, or other TI intellectual property right relating to any combination, machine, or processin which TI products or services are used. Information published by TI regarding third–party products or servicesdoes not constitute a license from TI to use such products or services or a warranty or endorsement thereof.Use of such information may require a license from a third party under the patents or other intellectual propertyof the third party, or a license from TI under the patents or other intellectual property of TI.
Reproduction of information in TI data books or data sheets is permissible only if reproduction is withoutalteration and is accompanied by all associated warranties, conditions, limitations, and notices. Reproductionof this information with alteration is an unfair and deceptive business practice. TI is not responsible or liable forsuch altered documentation.
Resale of TI products or services with statements different from or beyond the parameters stated by TI for thatproduct or service voids all express and any implied warranties for the associated TI product or service andis an unfair and deceptive business practice. TI is not responsible or liable for any such statements.
Mailing Address:
Texas InstrumentsPost Office Box 655303Dallas, Texas 75265
Copyright 2002, Texas Instruments Incorporated