Embed Size (px)
Citation preview

V I E W P O I N T
Code as Cartography
Michael Bostock1 and Jason Davies2
1The New York Times, USA.2 Freelance Programmer, UK.
Email: [email protected]; [email protected]
Keywords: dynamic cartography, programming, web standards, vector graphics, map projections, data formats
It is now common practice to distribute maps not as staticimages, but as source code that renders in a web browser(Figure 1). This trend reflects the expansion of computer-assisted cartography over the last several decades; ascomputers and web standards have become more capable,it is not merely feasible to realize maps as small, interpretedsoftware programs, but often the most convenient methodof development and deployment.
Furthermore, in a world awash with data and withpowerful computers that fit in the palm of your hand, thedemand for relevant information displays has never beengreater. Relevance may dictate the construction of highly-personalized maps (e.g. the viewer’s immediate vicinity) orshowing real-time information in geographic context (e.g.air traffic control); when needed views cannot be antici-pated, dynamic mapping is the only solution. Even for usecases that are readily satisfied by a static map, interactivitycan add value by allowing the viewer to zoom, filter andretrieve details on demand (Shneiderman, 1996).
Yet to talk of dynamic cartography on the web as a singletechnique is misleading, it takes diverse forms, each evolvedto suit a particular need. The tile quadtree approach tomapping popularized by Google is well known (GoogleMaps, 2013). New specialized typefaces allow iconicgeography to be embedded directly into text: Alaska ,California , Hawaii and so on (ProPublicaStateFace,2013). Of course, tiling precomputed raster imagery andglyphs are but limited forms of mapping. Substantially,greater expressiveness (not to mention escaping webMercator) can be achieved by rendering vector geometryon the client. This article gives a brief overview of some newtechniques, and related considerations, in web cartography.
DATA
There can be no map without data; every cartographicendeavour, regardless of medium, first requires finding dataand transforming it into an appropriate representation. Webmaps present further challenges because vector data must betransmitted over the wire and deserialized by a web browser(preferably without requiring a plugin) before rendering.
Discovery and manipulation
Finding relevant data persists as a huge challenge for non-domain experts. Despite recent positive examples of user-friendly data releases (The National Atlas of the UnitedStates of America, 2013; NASA Visible Earth, 2013) andincreased awareness of the importance of usability in datareleases, much critical data remains hard to find and use.Cryptically-named files and broken links to documentation– or failing that, commented FORTRAN – often lend afeeling of archeology to data discovery.
Fortunately, the collaborative nature of web developmenthas given rise to secondary sources that provide moreconvenient access. Figure 2 is a simple and intuitiveinterface for downloading digital elevation data from theShuttle Radar Topography Mission. The Natural Earthproject (Natural Earth, 2013) provides high-quality globalvector and raster data available for free. The authors likewisepublish scripts (US Atlas TopoJSON, 2013; World AtlasTopoJSON, 2013) for retrieving cartographic boundariesfrom the US Census Bureau and other sources, building ontop of free open-source tools (GDAL, 2013) for manip-ulating and transforming geospatial data.
Data releases that expose a simple application program-ming interface encourage the development of diverse userinterfaces, and ultimately better satisfy the varied needs ofdata consumers. Interoperability and hyperlinking is, afterall, the ethos of the web.
Serialisation and deserialisation
For geometric data to be used by a web browser, raw bytesmust first be decoded into representative geometric objects,a process known as deserialisation. Since this code, too,must run in a browser, web developers favour formats thatcan be easily deserialized. The current format of choice isGeoJSON (Butler et al., 2013), a subset of JavaScriptObject Notation (JSON). Since JSON is supported nativelyby browsers, deserializing GeoJSON is trivially executed asJSON.parse. GeoJSON offers additional convenience fornovice cartographers in that it can be edited in a basic texteditor, enabling the removal of features or modification ofproperties without specialized software.
The Cartographic Journal Vol. 50 No. 2 pp. 129–135 50th Anniversary Special Issue, May 2013# The British Cartographic Society 2013
DOI: 10.1179/0008704113Z.00000000078

Binary formats, despite their ubiquity in desktopgeographic information systems and government datareleases, are almost never used directly on the web.Conversion to web-friendly formats would be a majorhurdle, save for free tools developed by the open-sourcecommunity (OSGeo, 2013). Still, this is inconvenient;wider adoption of open standards when releasing datawould be greatly welcomed and ease integration of datafrom multiple sources.
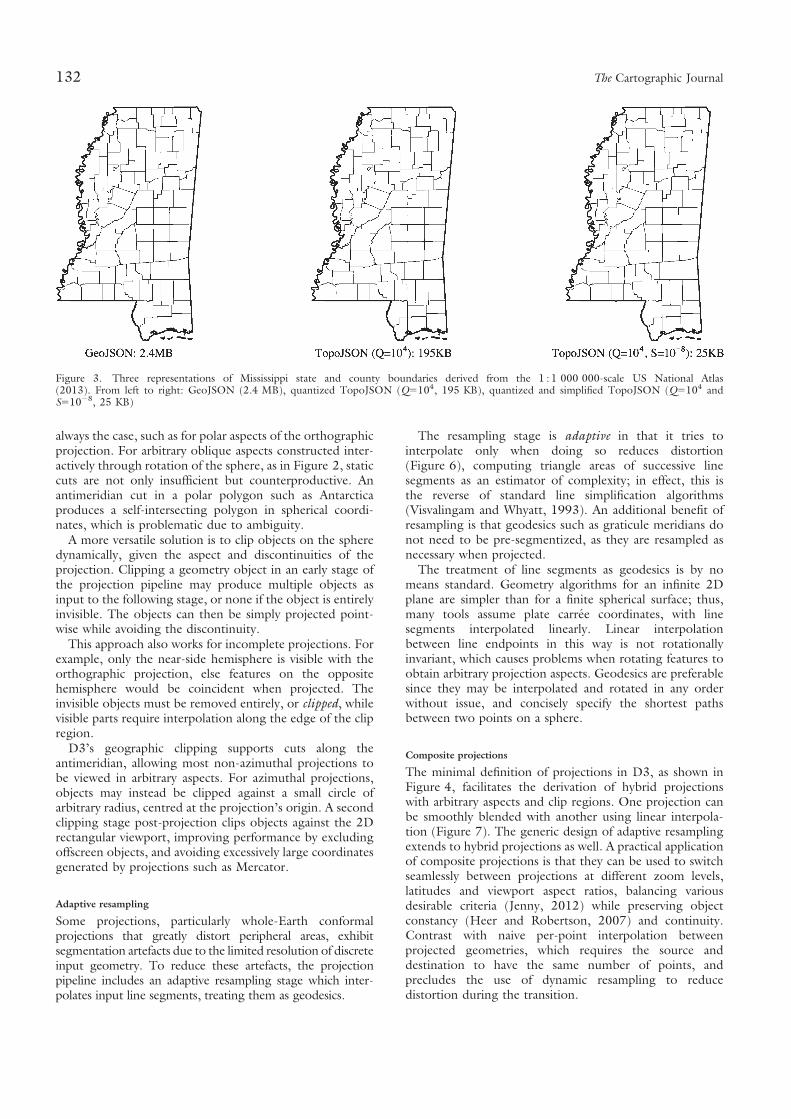
File size and geometric complexity are crucial for webcartography. Cartographic boundaries in the tens orhundreds of megabytes are frequently used in desktopsystems, but cause noticeable lag when downloaded by aweb browser. Simplifying geometry to the displayedresolution is necessary not only to hasten file transfers butto achieve interactive framerates. GeoJSON’s simplicity,though convenient, fails to represent geometry compactly;GeoJSON also lacks topological information needed forapplications such as geometry simplification (Bloch, 2007),colouring and cartograms (Dorling, 1996).
To address these issues, the authors have proposed arelated format: TopoJSON (2013). Rather than represent-ing geometries discretely, geometries in TopoJSON arestitched together from shared line segments called arcs.Combined with fixed-precision encoding for coordinates,
or quantisation, TopoJSON files are often 80% smaller ormore than their GeoJSON equivalents. Figure 3 shows acomparison of file sizes, with and without simplification.
PROJECTION PIPELINE
A dynamic map may involve changing geometries, changingprojections, or both. A fast projection system is paramount,particularly as the performance characteristics of targetdevices and web browsers vary widely.
As part of the D3 visualisation library (Bostock et al.,2011), the authors have developed a general mappingframework in JavaScript, the native language of the web.D3’s projection pipeline executes serial geometric transforma-tions to render vector data. To minimize the creation oftemporary objects, input geometry is converted to a streamof events represented by procedural function calls; each stagein the pipeline can then transform events before passing themto the next stage. The output of the pipeline is expressible asScalable Vector Graphics (SVG) (Ferraiolo et al., 2003), adeclarative standard supported by modern browsers, orrendered immediately onto HTML5 Canvas (Cabanier et al.,2012). The modular nature of the pipeline allows webcartographers to compose geometric operations as needed.
Figure 1. Bartholomew’s regional projection (Bartholomew, 1958), rendered in a web browser using D3. The equidistant conic projection isused for latitudes above the Tropic of Cancer (22.5uN), and an interrupted Bonne elsewhere. 1 : 50 000 000-scale geographic boundaries fromNatural Earth (Natural Earth, 2013)
130 The Cartographic Journal

Arbitrary aspects
To enable arbitrary aspects, the pipeline includes a stage torotate geometry objects about the three orthogonal axes ofthe sphere. Rotation angles are specified in order corre-sponding to the projection’s origin (l,Q) and azimuthalrotation (c). Projections formulated for the sphere can thusassume a single aspect with (0u, 0u) at its centre, simplifyingimplementation and improving performance when rotationis not desired.
Cutting and clipping
Projecting individual geographic points to 2D Cartesiancoordinates is a straightforward application of the projec-tion’s mathematical definition. Implementations of a
wide range of projections are readily available (PROJ.4,2013).
Yet vector geometry also comprises lines and polygons,introducing significant additional challenges (Figure 5).Planar projections of the sphere are necessarily discontin-uous; geometry objects that span a discontinuity are splitinto disparate pieces. For example, most non-azimuthalprojections in their normal aspect have a discontinuity alongthe antimeridian at longitudes ¡180u, causing a linecrossing the antimeridian to become two lines whenprojected.
This issue is traditionally circumvented by inserting staticcuts in the data for objects that cross the antimeridian.However, this approach presumes that the projection has itsdiscontinuity exactly along the antimeridian, which is not
Figure 2. Derek Watkin’s SRTM Tile Grabber (Watkins, 2013), an alternative interface to downloading digital elevation data. Implementedusing D3’s orthographic projection and radial gradients to simulate directional lighting, the globe can be freely rotated. Clicking on a red tiledownloads the corresponding SRTM data for that region
Code as Cartography 131
always the case, such as for polar aspects of the orthographicprojection. For arbitrary oblique aspects constructed inter-actively through rotation of the sphere, as in Figure 2, staticcuts are not only insufficient but counterproductive. Anantimeridian cut in a polar polygon such as Antarcticaproduces a self-intersecting polygon in spherical coordi-nates, which is problematic due to ambiguity.
A more versatile solution is to clip objects on the spheredynamically, given the aspect and discontinuities of theprojection. Clipping a geometry object in an early stage ofthe projection pipeline may produce multiple objects asinput to the following stage, or none if the object is entirelyinvisible. The objects can then be simply projected point-wise while avoiding the discontinuity.
This approach also works for incomplete projections. Forexample, only the near-side hemisphere is visible with theorthographic projection, else features on the oppositehemisphere would be coincident when projected. Theinvisible objects must be removed entirely, or clipped, whilevisible parts require interpolation along the edge of the clipregion.
D3’s geographic clipping supports cuts along theantimeridian, allowing most non-azimuthal projections tobe viewed in arbitrary aspects. For azimuthal projections,objects may instead be clipped against a small circle ofarbitrary radius, centred at the projection’s origin. A secondclipping stage post-projection clips objects against the 2Drectangular viewport, improving performance by excludingoffscreen objects, and avoiding excessively large coordinatesgenerated by projections such as Mercator.
Adaptive resampling
Some projections, particularly whole-Earth conformalprojections that greatly distort peripheral areas, exhibitsegmentation artefacts due to the limited resolution of discreteinput geometry. To reduce these artefacts, the projectionpipeline includes an adaptive resampling stage which inter-polates input line segments, treating them as geodesics.
The resampling stage is adaptive in that it tries tointerpolate only when doing so reduces distortion(Figure 6), computing triangle areas of successive linesegments as an estimator of complexity; in effect, this isthe reverse of standard line simplification algorithms(Visvalingam and Whyatt, 1993). An additional benefit ofresampling is that geodesics such as graticule meridians donot need to be pre-segmentized, as they are resampled asnecessary when projected.
The treatment of line segments as geodesics is by nomeans standard. Geometry algorithms for an infinite 2Dplane are simpler than for a finite spherical surface; thus,many tools assume plate carree coordinates, with linesegments interpolated linearly. Linear interpolationbetween line endpoints in this way is not rotationallyinvariant, which causes problems when rotating features toobtain arbitrary projection aspects. Geodesics are preferablesince they may be interpolated and rotated in any orderwithout issue, and concisely specify the shortest pathsbetween two points on a sphere.
Composite projections
The minimal definition of projections in D3, as shown inFigure 4, facilitates the derivation of hybrid projectionswith arbitrary aspects and clip regions. One projection canbe smoothly blended with another using linear interpola-tion (Figure 7). The generic design of adaptive resamplingextends to hybrid projections as well. A practical applicationof composite projections is that they can be used to switchseamlessly between projections at different zoom levels,latitudes and viewport aspect ratios, balancing variousdesirable criteria (Jenny, 2012) while preserving objectconstancy (Heer and Robertson, 2007) and continuity.Contrast with naive per-point interpolation betweenprojected geometries, which requires the source anddestination to have the same number of points, andprecludes the use of dynamic resampling to reducedistortion during the transition.
Figure 3. Three representations of Mississippi state and county boundaries derived from the 1 : 1 000 000-scale US National Atlas(2013). From left to right: GeoJSON (2.4 MB), quantized TopoJSON (Q5104, 195 KB), quantized and simplified TopoJSON (Q5104 andS51028, 25 KB)
132 The Cartographic Journal

Inverse projections
For interaction, inverse projections are needed to convertthe mouse or touch position from screen coordinates backto geographic coordinates. A projection without an inversemay therefore be unusable for interactive web cartography.Many popular projections include formulae or proceduresfor inverse transformation. The more esoteric projectionsmay not have published inverse transformations, but in
most cases such a transformation can be computedefficiently using Newton–Raphson (Ipbuker and Bildirici,2012).
CREATION VERSUS CONFIGURATION
The tools we employ influence the artefacts we produce bymaking certain tasks easier or harder. It is tempting toempower a wide audience of web cartographers by simplyenumerating common map types in a point-and-clickinterface or as parameterized components. Yet an exhaus-tive typology of maps, as with charts in informationvisualisation (Wilkinson and Wills, 2005), is impossible.Such an approach may satisfy common needs but ignoresthe long tail of diverse applications.
Simply put, there is no substitute for writing code. Thecreation of maps through code affords the composition oftechniques and interfaces in ways wholly unanticipated bythe toolmaker, greatly increasing the cartographer’s abilityfor self-expression. A sample of the diverse possibilities isshown in Figure 8. This is not to suggest that every map
Figure 4. D3’s spherical Mercator projection, and its inverse. Thisraw projection is typically composed with D3’s other projection fea-tures, including three-axis rotation, adaptive resampling, antimeri-dian cutting and viewport clipping
Figure 5. Several examples of clipping an arbitrary aspect of Albers’ equal-area conic projection
Figure 6. A comparison of resampling methods, shown with a 10u graticule on the Cassini projection. From left to right: no resampling, uni-form resampling, and adaptive resampling. The adaptive method concentrates samples in areas of high curvature, improving the appearance ofdiscrete geometry without penalizing performance
Code as Cartography 133

should be built from scratch. While not appropriate forevery application, the authors have tried to produce a toolthat balances efficiency (the effort required to specify avisualisation) with expressiveness (the diversity of possiblevisualisations).
BIOGRAPHICAL NOTES
Mike Bostock is a graphicseditor for The New YorkTimes. He is also the creatorof D3.js, an open-sourcelibrary for visualizing datausing web standards. BeforeThe New York Times, Mikewas a visualisation scientistfor Square and a computerscience PhD student atStanford University. Mikereceived the BSE degree incomputer science in 2000from Princeton University.
Jason Davies is a free-lance programmer. Hiswork and interests involvecombining visualisation withmathematics, data structuresand algorithms. He is a co-author of D3.js, an open-source visualisation library.Jason graduated with a BAdegree in Computer Sciencefrom the University of Cam-bridge in 2005.
REFERENCES
Bartholomew, J. (1958). The Times Atlas of the World, Vol. 1,Times, London.
Bloch, M. (2007). Mapshaper: A Web Application for GeneralizingMap Lines, University of Wisconsin-Madison, Madison, WI.
Bostock, M., Ogievetsky, V. and Heer, J. (2011). ‘D3: data-drivendocuments’, IEEE Transactions on Visualization and ComputerGraphics, 17, pp. 2301–2309.
Butler, H., Daly, M., Doyle, A., Gillies, S., Schaub, T. and Schmidt, C.(2008). The GeoJSON Format Specification, http://geojson.org/geojson-spec.html
Figure 7. Continuous interpolation from plate carree (t50) to Wagner VII (t51)
Figure 8. A sample of geovisualisations built with D3. From leftto right: a bivariate hexplot of approximately 3000 Walmart loca-tions; a non-contiguous cartogram (Olson, 1976) of obesity rates;and a Voronoi diagram of US airports
134 The Cartographic Journal

Cabanier, R., Graff, E., Munro, J. and Wiltzius, T. (2012). HTMLCanvas 2D Context, Level 2, http://w3.org/TR/2dcontext2/
Dorling, D. (1996). ‘Area cartograms: their use and creation’,Concepts and Techniques in Modern Geography, (59).
Ferraiolo, J., Jun, F. and Jackson, D. (2003). Scalable vector graphics(SVG) 1.1 Specification, http://w3.org/TR/SVG11
GDAL – Geospatial Data Abstraction Library. (2013). http://gdal.orgGoogle Maps. (2013). http://maps.google.comHeer, J. and Robertson, G. G. (2007). ‘Animated transitions in
statistical data graphics’, IEEE Transactions on Visualization andComputer Graphics, 13, pp. 1240–1247.
Ipbuker, C. and Bildirici, I. O. (2002). ‘A General Algorithm for theInverse Transformation of Map Projections Using JacobianMatrices’, in The Third International Symposium onMathematical and Computational Applications, pp. 175–182,Konya, Sep 4–6.
Jenny, B. (2012). ‘Adaptive composite map projections’, IEEETransactions on Visualization and Computer Graphics, 18,2575–2582.
NASA Visible Earth. (2013). http://visibleearth.nasa.gov
Natural Earth. (2013). http://naturalearthdata.comOlson, J. M. (1976). ‘Noncontiguous area cartograms’, The
Professional Geographer, 28, pp. 371–380.OSGeo (2013). Your Open Source Compass, http://osgeo.orgPROJ.4 – Cartographic Projections Library. (2013). http://trac.
osgeo.org/proj/ProPublicaStateFace. (2013). http://propublica.github.com/stateface/Shneiderman, B. (1996). ‘The Eyes Have It: A Task by Data Type
Taxonomy for Information Visualization’, in IEEE Symposium onVisual Languages, pp. 336–343, Boulder, CO, Sep 3–6.
The National Atlas of the United States of America. (2013). http://nationalatlas.gov.
TopoJSON. (2013). https://github.com/mbostock/topojsonUS Atlas TopoJSON. (2013). https://github.com/mbostock/us-atlasVisvalingam, M. and Whyatt, J. D. (1993). ‘Line generalisation by repeated
elimination of points’, The Cartographic Journal, 30, pp. 46–51.Watkins, D. (2013). SRTM Tile Grabber, http://dwtkns.com/srtm/Wilkinson, L. and Wills, G. (2005). The Grammar of Graphics
(Statistics and Computing), Springer-Verlag, New York.World Atlas TopoJSON. (2013). https://github.com/mbostock/world-atlas
Code as Cartography 135

Copyright of Cartographic Journal is the property of Maney Publishing and its content maynot be copied or emailed to multiple sites or posted to a listserv without the copyright holder'sexpress written permission. However, users may print, download, or email articles forindividual use.