Embed Size (px)
Citation preview

Edition Number : CDA_2016_003
Edition Validity Date : Use pop-up to enter value.
CODA DIGEST Q3 2016
All-Causes Delay and Cancellations to Air Transport in Europe – Q3 2016
15/12/2016
Edition Validity Date: Use pop-up to enter value. Edition: CDA_2016_003 Status: Proposed Issue i
DOCUMENT CHARACTERISTICS
Document Title Document Subtitle
(optional) Edition Number Edition Validity Date
CODA DIGEST Q3 2016 CDA_2016_003 Use pop-up to enter
value.
Abstract
Author(s)
Contact Person(s) Tel/email Unit
C. Walker +32 2 472 3391 NMD/PFR/FNI
STATUS AND ACCESSIBILITY
Status Accessible via
Working Draft Intranet
Draft Extranet
Proposed Issue Internet (www.eurocontrol.int)
Released Issue
TLP STATUS
Intended for Detail
Red Highly sensitive, non-disclosable information
Amber Sensitive information with limited disclosure
Green Normal business information
White Public information
©2016 The European Organisation for the Safety of Air Navigation (EUROCONTROL). This document is published by EUROCONTROL for information purposes. It may be copied in whole or in part, provided that EUROCONTROL is mentioned as the source and the extent justified by the non-commercial use (not for sale). The information in this document may not be modified without prior written permission from EUROCONTROL.

Network Manager
CODA DIGEST Q3 2016
Edition Validity Date: Edition: CDA_2016_003 Status: Proposed Issue ii
EXECUTIVE SUMMARY
Operational data received directly from airlines by CODA describing delays from all-causes for Q3 2016 illustrated a story of poorer on-time performance in July, continuing from industrial action and weather issues at the end of the previous quarter, followed by improvements in punctuality during August and September when compared to 2015. This translated to a quarterly average all-cause departure delay of 12.5 minutes per flight, an increase of 0.2 minutes per flight, alongside an increase in daily flights of 2.7% in ECAC and for the network which experienced its busiest ever day on Friday 9 September. Quarterly airline arrival punctuality stabilised, with 79% of flights arriving within 15 minutes or earlier than their scheduled arrival time (STA) with the better performance of August and September being cancelled out by July’s higher delays. Delays due to airline operations remained the main cause of primary delay, contributing 3.5 minutes to average delay per flight for the quarter. Airline reported en-route ATFCM delays increased to 1 minute per flight, with ATC industrial action in France contributing to this increase. Airport operations delay including ATFCM, remained at 0.9 minutes per flight and the third highest cause in the share of primary delay. Istanbul’s Sabiha Gökçen airport continued to suffer heavy delay with the airport experiencing capacity delays on arrival throughout the quarter. In contrast to recent months, Istanbul Ataturk saw a decrease in delay and fell from the top 20 delay affected airports. Reactionary (knock-on) delay remained stable contributing 5.7 minutes to the 12.3 minute average delay per flight, a 46% share of delay minutes. For every 1 minute of primary delay there were 54 seconds of reactionary delay generated. Operational cancellations increased to 1.4% of planned flights, compared to 1.3% in Q3 2015. Cancellations remained low for the quarter in comparison with earlier months in the year where large scale ATC industrial actions were observed. Despite this lower rate industrial action by French ATC, Air France pilots as well as Alitalia pilots and cabin crew did occur during the quarter.
Figure 1 . Breakdown of the Average Delay per Delay Q3 2015 vs. Q3 2016

Network Manager
CODA DIGEST Q3 2016
Edition Validity Date: Edition: CDA_2016_003 Status: Proposed Issue iii
DOCUMENT APPROVAL
Edition History
The following table records the complete history of the successive editions of the present document.
Edition History
Edition No. Edition
Validity Date Author Reason
CDA_2016_003 08/12/2016 C. Walker Final Draft
CDA_2016_003 12/12/2016 C. Walker Proposed Issue
CDA_2016_003 15/12/2016 C. Walker Released Issue

Network Manager
CODA DIGEST Q3 2016
Edition Validity Date: Edition: CDA_2016_003 Status: Proposed Issue iv
Table of Contents
DOCUMENT CHARACTERISTICS ........................................................................................................................................................ I
EXECUTIVE SUMMARY ...................................................................................................................................................................... II
DOCUMENT APPROVAL .................................................................................................................................................................... III
EDITION HISTORY .............................................................................................................................................................................. III
TABLE OF CONTENTS .......................................................................................................................................................................IV
1 TRAFFIC AND AVERAGE DELAY PER FLIGHT OVERVIEW ....................................................................................V
2 Q3 2016 MONTHLY SUMMARY ................................................................................................................................VII
3 AVERAGE DELAY PER DELAYED FLIGHT (DEPARTURE) ...................................................................................... 1
4 AVERAGE DELAY PER DELAYED FLIGHT (ARRIVAL) ............................................................................................ 2
5 NM VERSUS AIRCRAFT OPERATOR EXPERIENCE OF DELAY .............................................................................. 3
6 DISTRIBUTION OF ALL FLIGHTS BY LENGTH OF DELAY (PUNCTUALITY) .......................................................... 4
7 CODA OPERATIONAL FLIGHT CANCELLATION ANALYSIS ................................................................................... 6
8 CODA SCHEDULING INDICATORS ........................................................................................................................... 8
9 CODA REACTIONARY DELAY ANALYSIS ................................................................................................................ 9
10 AVERAGE DELAY PER FLIGHT BY HOUR ............................................................................................................. 10
11 AVERAGE DELAY PER DELAYED FLIGHT VS PERCENTAGE OF DELAYED FLIGHTS ...................................... 11
12 TOP 20 DELAY AFFECTED DEPARTURE AIRPORTS ............................................................................................ 12
13 TOP 20 DELAY AFFECTED ARRIVAL AIRPORTS .................................................................................................. 13
14 TOP 20 DELAY AFFECTED CITY PAIRS ................................................................................................................. 14
15 YEAR ON YEAR TRENDS IN ALL-CAUSES INDICATORS ...................................................................................... 15
16 CODA DELAY GROUPINGS ..................................................................................................................................... 17
17 CORRELATION BETWEEN IATA DELAY CODES AND THE NM REGULATION CODES ...................................... 18
18 STANDARD IATA DELAY CODES ........................................................................................................................... 19
19 STANDARD IATA DELAY CODE SUB-CODES (AHM731) ....................................................................................... 21
20 CODA COVERAGE OF COMMERCIAL FLIGHTS IN ECAC REGION Q3 2016 ........................................................ 23

Network Manager
CODA DIGEST Q3 2016
Edition Validity Date: Edition: CDA_2016_003 Status: Proposed Issue v
1 Traffic and Average Delay per Flight Overview
Figure 2. Total Departures per Day in ECAC
In Q3 2016 there were 2.7% more daily flights in ECAC. Traffic increased throughout the quarter with monthly growth of 2.3%, 2.6% and 3.2% respectively. The network also experienced its busiest ever day on Friday 9 September. Further information regarding traffic and forecasts can be found on the STATFOR website and via the STATFOR Interactive Dashboard (SID).
Figure 3. Breakdown of the Average Delay per Delay Q3 2015 vs. Q3 2016
Q3 2016 saw an average departure delay per flight of 12.5 minutes for all-causes delay, an increase of 1.6% in comparison to Q3 2015. Analysis of the delay reasons shows that reactionary delays contributed the most to the average with 5.7 minutes per flight. Airline-related delays fell slightly by 0.1 minutes per flight. ATFCM en-route delay had the third highest contribution with 1 minute per flight up by 0.3 minutes per flight compared to 2015.

Network Manager
CODA DIGEST Q3 2016
Edition Validity Date: Edition: CDA_2016_003 Status: Proposed Issue vi
Figure 4. Primary Delay Causes Q3 2015 vs.Q3 2016
Total ATFCM reported by airlines delay increased to 1.9 minutes per flight with en-route restrictions mainly contributing to the overall increase, as airline and airport delays remained stable, the share of weather fell slightly in the quarter.
Figure 5. Long Departure Delays >60 Minutes
Longer delays (those greater than 60 mins in orange) increased compared to Q3 2015, mainly driven by the higher delays in July 2016 where delays above 60 minutes increased to 5.5%. August and September showed lower and more stable numbers.

Network Manager
CODA DIGEST Q3 2016
Edition Validity Date: Edition: CDA_2016_003 Status: Proposed Issue vii
2 Q3 2016 Monthly Summary
As indicated in the executive summary all-causes delay illustrated deterioration in delay performance during July, however the delay situation in August and September improved in comparison to Q3 2015. Section 2 provides a month-by-month view, highlighting the particular causes and locations of all-causes delay in further detail. July 2016. Operational data from airlines describing all-causes delay showed that the average delay per delayed flight (ADD) increased by 2 minutes to 30 minutes, the highest ADD observed in 2016 so far. The percentage of delayed flights (>=5 minutes) also increased, this by 5 percentage points to 53% when compared to the same month in 2015. The ATC industrial actions in France on the 4 and 6 July generated airport ATFM delay and en-route ATFM delays. Industrial actions by Air France pilots on 27 July and Alitalia pilots and cabin crew on the 5 July resulted in 1400 and 142 flights being cancelled respectively. Aerodrome capacity generated delays at Istanbul Sabiha Gökçen, Istanbul Ataturk, Barcelona, Paris Orly, Amsterdam Schiphol and Zurich airports. Seasonal weather impacted operations particularly at London Heathrow, Amsterdam Schiphol, Barcelona and Zurich airports. August 2016. Airline data from airlines describing all-causes delay showed that the average delay per delayed flight (ADD) decreased by 2 minute to 26 minutes. The percentage of delayed flights (>=5 minutes) fell to 46% when compared August 2015. In comparison to July the delay situation in August 2016 improved with no industrial action being observed, this improvement also came in conjunction with an increase of 2.2% in the number of flights per day. Airlines in turn saw reductions in reactionary and airline related delays, however these causes remained high contributors to airline delay performance with 73% share of the average delay per flight experienced by airlines. Brest ACC recorded en-route ATFM delays during the month, alongside Maastricht UAC and Barcelona ACC. Aerodrome capacity ATFM delays continued at Istanbul Sabiha Gökçen with Istanbul Ataturk, Paris Orly, Amsterdam Schiphol and Zurich airports also suffering ATFM arrival delays. A security alert at Frankfurt airport on 31 August generated delays and resulted in over 100 flights being cancelled. Paris Orly conducted runway works with high delays being experienced, Brussels airport also closed a runway during August for resurfacing with low levels of delay. September 2016. Data from airlines describing all-causes delay showed that the average delay per delayed flight (ADD) was 25 minutes compared to 26 in September 2015. The percentage of delayed flights (>=5 minutes) remained stable at 42%. Analysing the average delay per flight, airline and reactionary delays fell however ATFM en-route delay increased. Friday 9 September saw the highest number of daily flights in ESRA08 with 34.010 flights recorded. The French ATC industrial action between 14 and 15 September generated airport and en-route ATFM delays. The most affected airports were Marseille and Paris Orly. NM estimated there were 900 fewer flights during the action. An emergency landing at London Heathrow on 9 September and a frequency failure in Brussels ACC on 15 September generated ATFM delays at these airports. Seasonal weather affected Maastricht, Karlsruhe, Marseille, Bordeaux, Barcelona and Scottish ACCs; thunderstorms, heavy rain and/or low visibility impacted London Heathrow, Palma de Mallorca and to a lesser extent, Istanbul Sabiha Gökçen, Istanbul Ataturk, London Gatwick, Barcelona and Zürich airports.

Network Manager
CODA DIGEST Q3 2016
Edition Validity Date: Edition: CDA_2016_003 Status: Proposed Issue 1
3 Average Delay per Delayed Flight (Departure)
The percentage of flights delayed on departure (>=5 minutes) increased to 47%. Regarding the average delay per flight in Figure 5, the higher delays in July can be observed. Putting these three months together the average delay per delayed (ADD) flight was 27.2 minutes, despite a slight increase the ADD level remained stable in comparison to the last 3 years.
Figure 6. Average Delay per Flight (All-Causes) for Departures
Figure 7. Average Delay per Delayed Flight (All-Causes) for Departures
Figure 8. Percentage of Delayed Flights (All-Causes) for Departures

Network Manager
CODA DIGEST Q3 2016
Edition Validity Date: Edition: CDA_2016_003 Status: Proposed Issue 2
4 Average Delay per Delayed Flight (Arrival)
The average delay per delayed flight on arrival from all-causes was 29.1 minutes per flight in Q3 2016 remaining at the same level as Q3 2016. The percentage of delayed arrivals increased by 0.9 percentage points to 40% in comparison to Q3 2015, the highest observed in the last 5 years.
Figure 9. Average Delay per Flight (All-Causes) for Arrivals
Figure 10. Average Delay per delayed Flight (All-Causes) for Arrivals
Figure 11. Percentage of Delayed Flight (All-Causes) for Arrivals

Network Manager
CODA DIGEST Q3 2016
Edition Validity Date: Edition: CDA_2016_003 Status: Proposed Issue 3
5 NM Versus Aircraft Operator Experience of Delay
Figure 12. Breakdown of Average Delay per Flight Q3 2016 vs. Q3 2015 (Network Manager vs. Aircraft
Operator)
This section presents the air transport delay situation as seen from the airline and passenger viewpoint (the difference between the scheduled time of departure and the actual time of departure from the gate). Data coverage is 67% of commercial flights in the ECAC region for Q3 2016. ATFCM delays reported by airlines are lower than the NM-calculated ATFCM delays due to difference in methods: ATFM delays calculated by NM are the (flight) planned “delays” based on restrictions applied; the airlines report the “actual” experienced ATFCM delay on departure. For instance, a flight with an ATFM restriction may also have a handling delay absorbed within the ATFM restriction. For the airline, a part of this delay is the ATFM delay and the rest is the handling delay. Further analysis of airline data shows that the average en-route ATFCM delay from all-causes was 1.0 minutes per flight, this was the same as the NM recorded average en-route ATFM delay per flight for the quarter.
As reported by the airlines, primary delays (e.g. passenger and ramp handling delays) counted for 54% (6.8 min/flt) of which (1.0 min/flt) was attributed to en-route ATFCM restrictions, with reactionary delays representing the remaining share of 46% of (5.7 min/flt), resulting in an average departure delay per flight of 12.5 minutes per flight as reported in previous sections.

Network Manager
CODA DIGEST Q3 2016
Edition Validity Date: Edition: CDA_2016_003 Status: Proposed Issue 4
6 Distribution of All Flights by Length of Delay (Punctuality)
In Q3 2016 overall departure punctuality levels fell, with 39% of flights departing within the 5 minute threshold before or after the scheduled departure time (STD) when compared to Q3 2015. Flights delayed >30 minutes from all-causes increased by 0.5 percentage points during the quarter.
Airline arrival punctuality reduced slightly by 0.6 percentage points with 78.7% of flights arriving within 15 minutes or earlier than their scheduled arrival time (STA), compared to 79.3% in Q3 2015.
Figure 13. All-Causes Departure and Arrival Punctuality Q3 2015 vs.Q3 2016
Flights arriving >15 minutes ahead of schedule fell by 0.1 percentage points to 8.3%. This high share may affect airport (stand availability) and air traffic flow management operations (demand shifts) in the event of aircraft frequently arriving excessively ahead of their schedule.
Network Manager
CODA DIGEST Q3 2016
Edition Validity Date: Edition: CDA_2016_003 Status: Proposed Issue 5
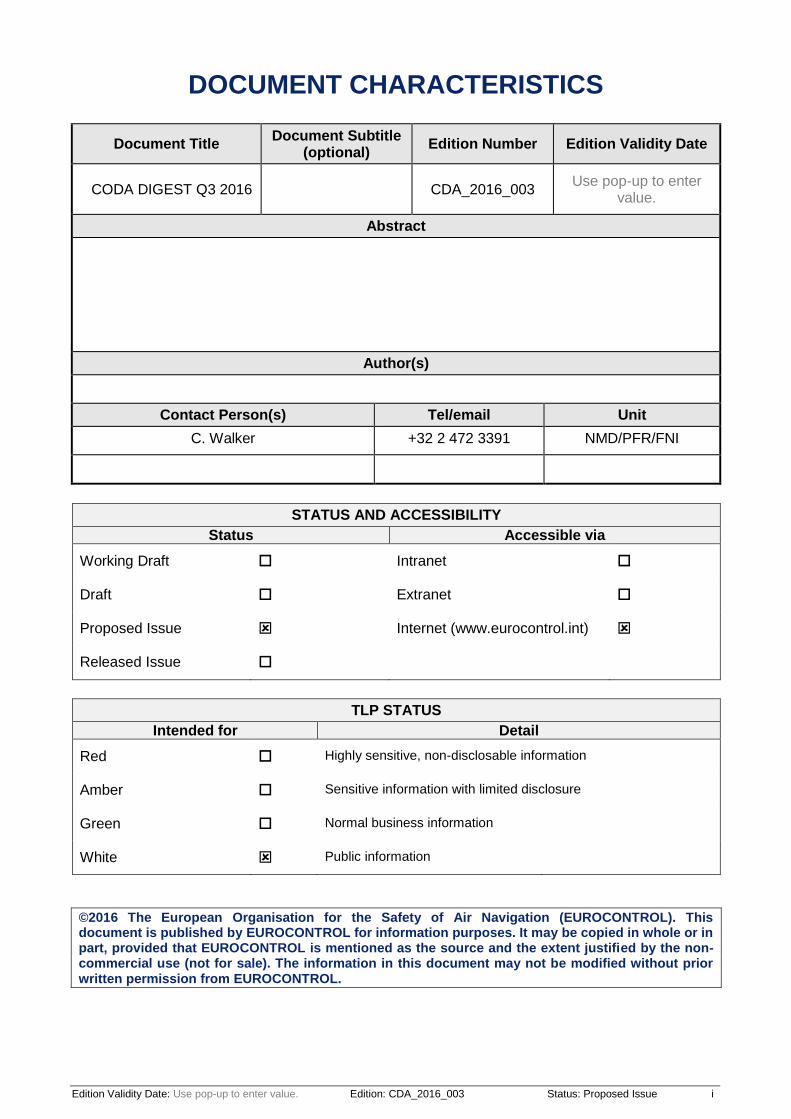
Figure 14. Top 50* Airlines by Arrival On-Time Performance Q3 2016
*The top 50 airlines reporting to CODA by number of flights. Arrival punctuality is calculated as the share of flights arriving within 15 minutes of the scheduled time (time of arrival at gate)
Figure 15. Top 50* Airlines by Arrival On-Time Performance Q3 2015
During the quarter fewer airlines were able to maintain 15 minute arrival punctuality above 85%. A total of 12 airlines saw more than 85% of their flights arrive within 15 minutes of the scheduled time of arrival vs. 17 airlines in Q3 2015.

Network Manager
CODA DIGEST Q3 2016
Edition Validity Date: Edition: CDA_2016_003 Status: Proposed Issue 6
7 CODA Operational Flight Cancellation Analysis
These results are based on operational cancellation data supplied by 30 of the 50 European coordinated airports reporting to CODA under EC Regulation N° 390/2013. Albeit based on data supplied by a restricted list (see the conditions below) of major European airports, these results already give a good indication of trends and effects of Network events like industrial actions or extreme weather. The IFR flight coverage at the individual airports included in this analysis reaches 100%. Those airports currently unable to report operational cancellations in the required data format or those not meeting all of the criteria for operational cancellations were excluded from the analysis.
According to Annex IV of EC Regulation N°390/2013 an ‘Operational Cancellation’ means an arrival or departure scheduled flight to which the following conditions apply:
The flight received an airport slot, and
The flight was confirmed by the air carrier the day before operations and/or it was contained in the daily list of flight schedules produced by the airport operator the day before of operations, but
The actual landing or take-off never occurred.
Therefore this section of the CODA Digest reports on monthly and daily shares of operational cancellations of the total planned flights at day -1. Like delays, operational cancellations provide an insight into the impact of network events and associated disruption; e.g. industrial action or extreme weather events.
Figure 16. Monthly Rate of Operational Cancellations 2015 – Q3 2016

Network Manager
CODA DIGEST Q3 2016
Edition Validity Date: Edition: CDA_2016_003 Status: Proposed Issue 7
Figure 17. Average Daily Cancellation 2015 – Q3 2016
Figure 11 shows the monthly rate of operational cancellations and Figure 12 provides the detail of cancellations by day from July 2015 to the end of September 2016. It should be noted that initial cancellations count as ‘operational cancellations’ under the terms of the regulation. In Q3 2016 an operational cancellation rate of 1.4% was observed (see figure 11), compared to 1.3% in Q3 2015. Cancellations remained low for the quarter, in comparison with earlier months in the year where large scale ATC industrial actions were observed. There were a few smaller events during the quarter, with French ATC industrial action occurred on 4 and 6 July. There was industrial action by Alitalia pilots and cabin crew on the 5 July which saw 140 flights cancellations. Air France pilots also conducted strike action on 27 July. A security alert at Frankfurt airport on the 31 August saw over 100 flights cancelled. In September French ATC industrial action occurred on 14 and 15 of the month. However the overall the daily rates of cancellation remained low for the quarter.
Further historical details regarding operational cancellations in 2015 and 2016 can be found in the CODA Annual Digest 2015.

Network Manager
CODA DIGEST Q3 2016
Edition Validity Date: Edition: CDA_2016_003 Status: Proposed Issue 8
8 CODA Scheduling Indicators
Scheduling correctly is a difficult art: if too long a time is blocked for a flight, the airline will not be able to make best use of resources - staff, airframes, infrastructure. But too short a time can arguably be worse as late flights generate rotational delay with late incoming aircraft and passengers from previous flights having to be accommodated. When flights leave on time but arrive after the scheduled time of arrival they cause reactionary delays. Schedule padding is essential for air carriers in order to find schedules which work with the typical patterns of delay, so that they can deliver passengers on time, and get maximum use out of their aircraft. Consequently when delays decrease it takes one or two (IATA) seasons for the airline to adapt its schedule accordingly. The Performance Review Report 2015 also shows the cost of tactical and strategic delay to airlines. Two CODA scheduling indicators help airline schedulers determine the optimal schedule based on historical flight data: The Delay Difference Indicator - Flight (DDI-F) or the difference between departure and arrival punctuality expressed in minutes. This can be indicated as a positive or negative figure, for example a flight departing with 20 minutes delay and arriving with 30 minutes arrival delay will have a DDI-F of +10 minutes. The European DDI-F in Q3 2016 was -4.4 minutes, this was an increase of 0.4 minutes schedule buffering per flight when compared to Q3 2015. The Block Time Overshoot (BTO) is the percentage of flights with an actual block time which exceeds the scheduled block time. The European BTO in Q3 2016 was 26%, this was slight reduction compared to Q3 2015 where the BTO was 27%, indicating that fewer flights had an actual block time exceeding their scheduled block time during the quarter.
Figure 18. Block Time Overshoot (BTO) and Delay Difference Indicator - Flight (DDI-F) 2015 –2016

Network Manager
CODA DIGEST Q3 2016
Edition Validity Date: Edition: CDA_2016_003 Status: Proposed Issue 9
9 CODA Reactionary Delay Analysis
In Q3 2016 the share of reactionary delay (IATA delay codes 91-96) was 46% of delay minutes contributing 5.7 minutes per flight. Reactionary delays are generated as a result of an aircraft’s late arrival from a previous flight which in turn affects the punctuality of its next flight with the same aircraft, as well as potentially delaying connecting passengers. See IATA Standard Delay Codes section for an overview of the IATA reactionary delay codes. Subsequently there are two types of reactionary delays: firstly as a result of the same aircraft being delayed on its next flight (rotational delay) and secondly when another aircraft is delayed as a result of another aircraft typically through passengers, crew and load connection (non-rotational delays).
This section concentrates on IATA delay code 93 rotational delays, as these have a significant share of overall reactionary delays (approximately 90%) and the largest effect on network performance and passenger experience. In Figure 14 analysis shows that the median number of scheduled flights per sequence for an aircraft in Q3 2016 was 4. The changes to the IATA seasons can be observed in the graph where the median fell to 3 in November then falling to 2 in February, as fewer flights may be scheduled during this period. This also highlights that with the shorter sequences of reactionary delay in winter as the network is naturally more resilient in the winter season. The percentage share of rotational delay (IATA delay code 93 only) in Q3 2016 was 43%, a decrease of 1 percentage points in comparison to Q3 2015.
Figure 19. Median Scheduled Flight Sequence Depth and Share of Reactionary Departure Delay on Intra
European Flights: July 2015 – Sept 2016.

Network Manager
CODA DIGEST Q3 2016
Edition Validity Date: Edition: CDA_2016_003 Status: Proposed Issue 10
10 Average Delay per Flight by Hour
Figure 20. Breakdown of the Average Delay per Flight by Hour of the Day Q3 2016 (top) vs. Q3 2015
(bottom)
During the first rotation phase (between 0300 and 0900 UTC) Figure 15 shows a higher share of airport ATFM related delay when compared to Q3 2015 with its share above 10% during the first rotation phase at 0600 UTC. This in turn has pushed reactionary delay minutes to over 60% share by the end of the operational day (2100UTC). Figure 15 also illustrates how airline delay share remained stable during the quarter.

Network Manager
CODA DIGEST Q3 2016
Edition Validity Date: Edition: CDA_2016_003 Status: Proposed Issue 11
11 Average Delay per Delayed Flight vs Percentage of Delayed Flights
Figure 21. ADD vs. PDF on Departure
Figure 22. ADD vs. PDF on Arrival
The percentage of flights delayed on departure (>=5 minutes) increased to 47% with an average delay per delayed (ADD) flight of 27.2 minutes. The poorer delay performance seen in July 2016 can be observed in both figure 16 and 17.
Regarding arrivals, the average delay per delayed arrival in Q2 2016 was 29.1 minutes (compared to 29.1 minutes per flight in Q3 2015). The percentage of delayed flights on arrival increased to 40% compared to 39.2% in Q3 2015.

Network Manager
CODA DIGEST Q3 2016
Edition Validity Date: Edition: CDA_2016_003 Status: Proposed Issue 12
12 Top 20 Delay Affected Departure Airports
Figure 23. All-Causes Delay. Top 20 Affected Departure Airports Q3 2016
Flight departing from London Gatwick saw an average delay per departure of 24.1 minutes with flights suffering predominantly from airline and reactionary delays. Flights at London Luton suffered from airline and en-route ATFM delay affecting airlines. Airlines operating from Spanish airports also recorded reactionary delays predominantly from flights being affected by airline delays as well as industrial action.
Figure 24. Main Delay Causes at the Top 10 Affected Departure Airports
Rank Departure Airport ICAO Code Average delay per departure
(mins)
Average Delay per
Flight Percentage
Change
Average Delay per Delayed
Departure
Percentage of Delayed Departures
1 LONDON/GATWICK EGKK 24.1 19% 33.4 72.2%
2 LONDON/LUTON EGGW 21.1 27% 31.7 66.4%
3 BARCELONA LEBL 20.1 23% 34.3 58.6%
4 ROME FIUMICINO LIRF 18.7 -31% 28.0 66.8%
5 IBIZA LEIB 18.6 1% 36.0 51.6%
6 TEL AVIV/BEN GURION LLBG 18.5 . 31.5 58.8%
7 PALMA DE MALLORCA LEPA 17.3 -1% 31.3 55.2%
8 MALAGA LEMG 16.8 12% 30.2 55.5%
9 MILAN MALPENSA LIMC 16.7 20% 35.3 47.3%
10 ISTANBUL/SABIHA LTFJ 16.4 -34% 30.3 54.0%
11 VENICE TESSERA LIPZ 16.2 4% 31.2 52.0%
12 PORTO LPPR 16.1 18% 30.6 52.6%
13 ALICANTE LEAL 15.9 21% 30.0 53.2%
14 PRAGUE LKPR 15.7 54% 30.8 51.1%
15 MANCHESTER EGCC 15.7 -0% 27.6 57.0%
16 PARIS ORLY LFPO 15.7 58% 27.4 57.4%
17 CATANIA FONTANAROSSA LICC 15.7 . 29.0 54.1%
18 EDINBURGH EGPH 15.7 32% 29.7 52.7%
19 LISBON LPPT 15.6 30% 26.7 58.3%
20 PARIS CH DE GAULLE LFPG 15.2 15% 26.4 57.3%

Network Manager
CODA DIGEST Q3 2016
Edition Validity Date: Edition: CDA_2016_003 Status: Proposed Issue 13
13 Top 20 Delay Affected Arrival Airports
Figure 25. All-Causes Delay. Top 20 Affected Arrival Airports Q3 2016
The delay situation in Istanbul can be seen in Figure 23, with Istanbul Sabiha Gökçen airport experiencing airport capacity and high reactionary delays, however the airport did experience a reduction in delay. In a contrast to recent months, Istanbul Ataturk saw a decrease in delay and fell from the top 20. Flights arriving in Tel Aviv were affected by airport capacity related delay. Arrivals at London Gatwick mainly suffered from reactionary delays from the ATC industrial action in France.
Figure 26. Main Delay Causes at the Top 10 Affected Arrival Airports
Rank Arrival Airport ICAO Code Average delay per
Flight (mins)
Average Delay per
Flight Percentage
Change
Average Delay per
Delayed Arrival
Percentage of Delayed
Arrivals
1 ISTANBUL/SABIHA LTFJ 26.1 -21% 37.5 69.6%
2 TEL AVIV/BEN GURION LLBG 24.5 44% 34.3 71.4%
3 LONDON/GATWICK EGKK 24.0 13% 39.9 60.3%
4 BARCELONA LEBL 21.4 24% 40.4 53.0%
5 LONDON/LUTON EGGW 16.9 12% 35.4 47.7%
6 MILAN MALPENSA LIMC 15.5 20% 37.4 41.3%
7 PORTO LPPR 15.4 23% 32.7 47.2%
8 IBIZA LEIB 15.4 -2% 35.1 43.8%
9 EDINBURGH EGPH 14.9 35% 30.5 48.8%
10 GLASGOW EGPF 14.6 13% 31.9 45.6%
11 LISBOA LPPT 14.3 15% 29.1 49.1%
12 MANCHESTER EGCC 14.3 3% 31.7 45.0%
13 PRAGUE LKPR 14.0 51% 31.8 44.2%
14 MALAGA LEMG 13.4 9% 30.5 44.0%
15 BRISTOL EGGD 13.0 16% 31.4 41.3%
16 PALMA DE MALLORCA LEPA 12.9 -7% 30.9 41.8%
17 KOLN-BONN EDDK 12.9 19% 32.0 40.2%
18 DUBLIN EIDW 12.9 -2% 27.1 47.5%
19 VENICE TESSERA LIPZ 12.8 -13% 29.4 43.5%
20 LONDON/STANSTED EGSS 12.7 25% 32.4 39.2%

Network Manager
CODA DIGEST Q3 2016
Edition Validity Date: Edition: CDA_2016_003 Status: Proposed Issue 14
14 Top 20 Delay Affected City Pairs
Figure 27. All-Causes Delay Situation for the 20 Most Delayed Airport Pairs Q3 2016
Rank Departure Airport Arrival Airport Average Delay Per Departure
Change since
Previous Period
Average Delay Per Delayed Departure
Percentage Delayed Departures
1 LONDON/GATWICK BARCELONA 31.1 13% 41.2 75.5%
2 IBIZA BARCELONA 30.8 28% 45.4 67.9%
3 MALAGA LONDON/GATWICK 30.8 22% 41.8 73.6%
4 BARCELONA LONDON/GATWICK 27.9 10% 40.0 69.7%
5 SCHIPHOL AMSTERDAM
LONDON/GATWICK 27.6 12% 36.9 74.9%
6 MILAS/BODRUM ISTANBUL/SABIHA 26.6 -20% 36.5 72.9%
7 ROME FIUMICINO BARCELONA 26.6 -25% 36.0 73.8%
8 LONDON/GATWICK MALAGA 25.5 29% 35.2 72.5%
9 PARIS CH DE GAULLE BARCELONA 25.4 58% 34.0 74.6%
10 LONDON/GATWICK SCHIPHOL AMSTERDAM 25.0 20% 33.8 73.9%
11 NEW YORK LONDON/HEATHROW 23.6 136% 49.4 47.9%
12 ROME FIUMICINO PALERMO 23.6 -27% 32.7 72.2%
13 SCHIPHOL AMSTERDAM
BARCELONA 23.1 51% 35.9 64.2%
14 PALMA DE MALLORCA
BARCELONA 22.9 33% 40.6 56.3%
15 LONDON/GATWICK DUBLIN 22.8 18% 31.2 72.9%
16 ROME FIUMICINO LONDON/HEATHROW 22.7 -4% 31.7 71.6%
17 BARCELONA PALMA DE MALLORCA 21.7 21% 37.6 57.8%
18 MAHON/MENORCA BARCELONA 21.7 36% 36.3 59.8%
19 PALMA DE MALLORCA
DUSSELDORF 21.6 -10% 30.2 71.7%
20 JERSEY LONDON/GATWICK 21.3 23% 41.3 51.4%
Analysis of the Top 20 delayed city pairs show that flights between London Gatwick and Barcelona saw increases in delay following the ATC industrial action in France, as well as individual airlines suffering from delays.

Network Manager
CODA DIGEST Q3 2016
Edition Validity Date: Edition: CDA_2016_003 Status: Proposed Issue 15
15 Year on Year Trends in All-Causes Indicators
This section summarises the year-on-year trends in the main indicators of delay from all-causes. A flight is considered delayed from 5 minutes. This is based on CODA data covering 67% of commercial flights in the ECAC region in Q3 2016.
Figure 28 Average all-causes delay/delayed flight (departures top, arrivals bottom)
Figure 29. Percentage of flights delayed for all-causes delay (departures top, arrivals bottom)

Network Manager
CODA DIGEST Q3 2016
Edition Validity Date: Edition: CDA_2016_003 Status: Proposed Issue 16
Figure 30. Percentage of flights delayed >15mins for all-causes (departures top, arrivals bottom)

Network Manager
CODA DIGEST Q3 2016
Edition Validity Date: Edition: CDA_2016_003 Status: Proposed Issue 17
16 CODA Delay Groupings
CODA CAUSE Description
IATA Code
Prim
ary
De
lay C
au
ses
Airline
Passenger and Baggage 11-19
Cargo and Mail 21-29
Aircraft and Ramp Handling 31-39
Technical and Aircraft Equipment 41-48
Damage to Aircraft & EDP/Automated Equipment Failure 51-58
Flight Operations and Crewing 61-69
Other Airline Related Causes Others
Airport
ATFM due to Restriction at Destination Airport 83
Airport Facilities 87
Restrictions at Airport of Destination 88
Restrictions at Airport of Departure 89
En-Route ATFM due to ATC En-Route Demand / Capacity 81
ATFM due to ATC Staff / Equipment En-Route 82
Governmental Security and Immigration 85-86
Weather Weather (other than ATFM) 71-77
ATFM due to Weather at Destination 84
Miscellaneous Miscellaneous 98-99
Reactionary Late Arrival of Aircraft, Crew, Passengers or Load 91-96

Network Manager
CODA DIGEST Q3 2016
Edition Validity Date: Edition: CDA_2016_003 Status: Proposed Issue 18
17 Correlation between IATA Delay Codes and the NM Regulation Codes
Note: updated version published in the ATFCM Users Manual 20.1.11
1 http://www.eurocontrol.int/sites/default/files/content/documents/nm/network-operations/HANDBOOK/atfcm-users-
manual-current.pdf

Network Manager
CODA DIGEST Q3 2016
Edition Validity Date: Edition: CDA_2016_003 Status: Proposed Issue 19
18 Standard IATA Delay Codes
Others
00-05 AIRLINE INTERNAL CODES 06 (OA) NO GATE/STAND AVAILABILITY DUE TO OWN AIRLINE ACTIVITY Including Early Arrivals 09 (SG) SCHEDULED GROUND TIME LESS THAN DECLARED MINIMUM GROUND TIME
Passenger and Baggage
11 (PD) LATE CHECK-IN, acceptance after deadline 12 (PL) LATE CHECK-IN, congestions in check-in area 13 (PE) CHECK-IN ERROR, passenger and baggage 14 (PO) OVERSALES, booking errors 15 (PH) BOARDING, discrepancies and paging, missing checked-in passenger 16 (PS) COMMERCIAL PUBLICITY/PASSENGER CONVENIENCE, VIP, press, ground meals and missing
personal items 17 (PC) CATERING ORDER, late or incorrect order given to supplier 18 (PB) BAGGAGE PROCESSING, sorting etc. 19 (PW) REDUCED MOBILITY, boarding / deboarding of passengers with reduced mobility.
Cargo and Mail
21 (CD) DOCUMENTATION, errors etc. 22 (CP) LATE POSITIONING 23 (CC) LATE ACCEPTANCE 24 (CI) INADEQUATE PACKING 25 (CO) OVERSALES, booking errors 26 (CU) LATE PREPARATION IN WAREHOUSE 27 (CE) DOCUMENTATION, PACKING etc (Mail Only) 28 (CL) LATE POSITIONING (Mail Only) 29 (CA) LATE ACCEPTANCE (Mail Only)
Aircraft and Ramp Handling
31 (GD) AIRCRAFT DOCUMENTATION LATE/INACCURATE, weight and balance, general declaration, pax manifest, etc.
32 (GL) LOADING/UNLOADING, bulky, special load, cabin load, lack of loading staff 33 (GE) LOADING EQUIPMENT, lack of or breakdown, e.g. container pallet loader, lack of staff 34 (GS) SERVICING EQUIPMENT, lack of or breakdown, lack of staff, e.g. steps 35 (GC) AIRCRAFT CLEANING 36 (GF) FUELLING/DEFUELLING, fuel supplier 37 (GB) CATERING, late delivery or loading 38 (GU) ULD, lack of or serviceability 39 (GT) TECHNICAL EQUIPMENT, lack of or breakdown, lack of staff, e.g. pushback
Technical and Aircraft Equipment
41 (TD) AIRCRAFT DEFECTS. 42 (TM) SCHEDULED MAINTENANCE, late release. 43 (TN) NON-SCHEDULED MAINTENANCE, special checks and/or additional works beyond normal
maintenance schedule. 44 (TS) SPARES AND MAINTENANCE EQUIPMENT, lack of or breakdown. 45 (TA) AOG SPARES, to be carried to another station. 46 (TC) AIRCRAFT CHANGE, for technical reasons. 47 (TL) STAND-BY AIRCRAFT, lack of planned stand-by aircraft for technical reasons. 48 (TV) SCHEDULED CABIN CONFIGURATION/VERSION ADJUSTMENTS.
Damage to Aircraft & EDP/Automated Equipment Failure
51 (DF) DAMAGE DURING FLIGHT OPERATIONS, bird or lightning strike, turbulence, heavy or overweight landing, collision during taxiing
52 (DG) DAMAGE DURING GROUND OPERATIONS, collisions (other than during taxiing), loading/off-loading damage, contamination, towing, extreme weather conditions
55 (ED) DEPARTURE CONTROL 56 (EC) CARGO PREPARATION/DOCUMENTATION 57 (EF) FLIGHT PLANS 58 (EO) OTHER AUTOMATED SYSTEM
Flight Operations and Crewing
61 (FP) FLIGHT PLAN, late completion or change of, flight documentation 62 (FF) OPERATIONAL REQUIREMENTS, fuel, load alteration

Network Manager
CODA DIGEST Q3 2016
Edition Validity Date: Edition: CDA_2016_003 Status: Proposed Issue 20
63 (FT) LATE CREW BOARDING OR DEPARTURE PROCEDURES, other than connection and standby (flight deck or entire crew)
64 (FS) FLIGHT DECK CREW SHORTAGE, sickness, awaiting standby, flight time limitations, crew meals, valid visa, health documents, etc.
65 (FR) FLIGHT DECK CREW SPECIAL REQUEST, not within operational requirements 66 (FL) LATE CABIN CREW BOARDING OR DEPARTURE PROCEDURES, other than connection and
standby 67 (FC) CABIN CREW SHORTAGE, sickness, awaiting standby, flight time limitations, crew meals, valid visa,
health documents, etc. 68 (FA) CABIN CREW ERROR OR SPECIAL REQUEST, not within operational requirements 69 (FB) CAPTAIN REQUEST FOR SECURITY CHECK, extraordinary
Weather
71 (WO) DEPARTURE STATION 72 (WT) DESTINATION STATION 73 (WR) EN ROUTE OR ALTERNATE 75 (WI) DE-ICING OF AIRCRAFT, removal of ice and/or snow, frost prevention excluding unserviceability of
equipment 76 (WS) REMOVAL OF SNOW, ICE, WATER AND SAND FROM AIRPORT 77 (WG) GROUND HANDLING IMPAIRED BY ADVERSE WEATHER CONDITIONS
Air Traffic Flow Management Restrictions
81 (AT) ATFM due to ATC EN-ROUTE DEMAND/CAPACITY, standard demand/capacity problems 82 (AX) ATFM due to ATC STAFF/EQUIPMENT EN-ROUTE, reduced capacity caused by industrial action or
staff shortage, equipment failure, military exercise or extraordinary demand due to capacity reduction in neighbouring area
83 (AE) ATFM due to RESTRICTION AT DESTINATION AIRPORT, airport and/or runway closed due to obstruction, industrial action, staff shortage, political unrest, noise abatement, night curfew, special flights
84 (AW) ATFM due to WEATHER AT DESTINATION
Airport and Government Authorities
85 (AS) MANDATORY SECURITY 86 (AG) IMMIGRATION, CUSTOMS, HEALTH 87 (AF) AIRPORT FACILITIES, parking stands, ramp congestion, lighting, buildings, gate limitations, etc. 88 (AD) RESTRICTIONS AT AIRPORT OF DESTINATION, airport and/or runway closed due to obstruction,
industrial action, staff shortage, political unrest, noise abatement, night curfew, special flights 89 (AM) RESTRICTIONS AT AIRPORT OF DEPARTURE WITH OR WITHOUT ATFM RESTRICTIONS,
including Air Traffic Services, start-up and pushback, airport and/or runway closed due to obstruction
or weather2, industrial action, staff shortage, political unrest, noise abatement, night curfew, special
flights
Reactionary
91 (RL) LOAD CONNECTION, awaiting load from another flight 92 (RT) THROUGH CHECK-IN ERROR, passenger and baggage 93 (RA) AIRCRAFT ROTATION, late arrival of aircraft from another flight or previous sector 94 (RS) CABIN CREW ROTATION, awaiting cabin crew from another flight 95 (RC) CREW ROTATION, awaiting crew from another flight (flight deck or entire crew) 96 (RO) OPERATIONS CONTROL, re-routing, diversion, consolidation, aircraft change for reasons other than
technical
Miscellaneous
97 (MI) INDUSTRIAL ACTION WITH OWN AIRLINE 98 (MO) INDUSTRIAL ACTION OUTSIDE OWN AIRLINE, excluding ATS 99 (MX) OTHER REASON, not matching any code above
SOURCE: IATA – Airport Handling Manual (730 & 731)
2 Restriction due to weather in case of ATFM regulation only, else refer to code 71 (WO)

Network Manager
CODA DIGEST Q3 2016
Edition Validity Date: Edition: CDA_2016_003 Status: Proposed Issue 21
19 Standard IATA Delay Code Sub-Codes (AHM731)
73 (WR) WEATHER: EN ROUTE OR ALTERNATE Z OUTSIDE AIRCRAFT LIMITS Y OUTSIDE CREW LIMITS X ETOPS
81 (AT) ATFM DUE TO ATC EN-ROUTE DEMAND/CAPACITY, standard demand/capacity problems Z ATC ROUTEING Y HIGH DEMAND OR CAPACITY X ENVIRONMENTAL W WEATHER G OTHER
82 (AX) ATFM DUE TO ATC STAFF/EQUIPMENT EN-ROUTE, reduced capacity caused by industrial
action or shortage or equipment failure, extraordinary demand due to capacity reduction in neighbouring area
Z INDUSTRIAL ACTION Y EQUIPMENT FAILURE X STAFF SHORTAGE W MILITARY ACTIVITY V SPECIAL EVENT
83 (AE) ATFM DUE TO RESTRICTION AT DESTINATION AIRPORT, airport and/or runway closed due
to obstruction, industrial action, staff shortage, political unrest, noise abatement, night curfew, special flights
Z HIGH DEMAND / ATC CAPACITY Y INDUSTRIAL ACTION X EQUIPMENT FAILURE W STAFF SHORTAGE V ACCIDENT / INCIDENT U MILITARY ACTIVITY T SPECIAL EVENT S NOISE ABATEMENT/NIGHT CURFEW P HIGH DEMAND/AIRPORT FACILTIES
85 (AS) MANDATORY SECURITY Z MANDATORY SECURITY CHECK
Y SECURITY CONTROL CHECKPOINTS
X BAGGAGE/AVI SECURITY W BAGGAGE IDENTIFICATION/UNLOADING/INTENDED V AIRPORT/TERMINAL SECURITY
U AIRLINE/AIRCRAFT SECURITY CHECK T EXTRAORDINARY SECURITY EVENTS G OTHER 86 (AG) IMMIGRATION, CUSTOMS, HEALTH Z IMMIGRATION/EMMIGRATION Y CUSTOMS X HEALTH
G OTHER
87 (AF) AIRPORT FACILITIES, parking stands, ramp congestion, lighting, buildings, gate limitations,
etc. Z PARKING STANDS LIMITATION/NO PARKING STANDS AVAILABLE, EXCLUDING EARLY ARRIVALS Y RAMP CONGESTION, ABNORMAL STAND ACCESS LIMITATION (NON-ATC) X BUILDINGS W GATE LIMITATION / NO GATE AVAILABLE EXCLUDING EARLY ARRIVALS V BAGGAGE SORTING SYSTEM DOWN / SLOW U NO PUSH BACK CLEARANCE DUE TO INFRASTRUCTURE (NON-ATC) T JET BRIDGE INOPERATIVE S LACK OF CHECK IN COUNTERS R AIRFIELD ELECTRICAL SYSTEM FAILURE P PASSENGER TRANSPORT SYSTEM FAILURE N PUBLIC ADDRESS/FLIGHT INFORMATION DISPLAY SYSTEM FAILURE M INSUFFICIENT FIRE COVER J LATE POSITIONING OF AIRCRAFT (WHEN RESPONSIBILITY OF AIRPORT) I SERVICE ROAD RESTRICTION H LATE ARRIVAL OR LACK OF FOLLOW ME VEHICLE G ANY OF THE ABOVE AT THE DESTINATION AIRPORT

Network Manager
CODA DIGEST Q3 2016
Edition Validity Date: Edition: CDA_2016_003 Status: Proposed Issue 22
89 (AM) RESTRICTIONS AT AIRPORT OF DEPARTURE WITH OR WITHOUT ATFM RESTRICTIONS, including Air Traffic Services, start-up and pushback, airport and/or runway closed due to obstruction or weather.
Z ATC CAPACITY Y ATC INDUSTRIAL ACTION X ATC STAFFING W ATC EQUIPMENT V ATC ACCIDENT/INCIDENT U MILITARY ACTIVITY/SPECIAL FLIGHTS/VIP T ATC SPECIAL EVENT S ATC WEATHER O ENVIRONMENTAL BENEFIT, DELAYED START-UP/PUSHBACK DUE TO USE OF REDUCED STANDARD
TAXI TIMES R ATC RESTRICTIONS DUE TO CURFEW P ATC POLITICAL UNREST N ATC ENVIRONMENTAL M AIRPORT CLOSURE L RUNWAY CLOSURE K MISCELLANEOUS START-UP DELAY (LOCAL ATC) J LOST FLIGHT PLAN BY ATC I LATE PUSHBACK GIVEN DUE TO OTHER REASONS THAN INFRASTRUCTURE H CONSTRUCTION WORK/MAINTENENCE G OTHER 93 (RA) AIRCRAFT ROTATION, late arrival of aircraft from another flight Z LATE ARRIVAL DUE DEPARTURE DELAY AT PREVIOUS STATION Y LATE ARRIVAL DUE ENROUTE DELAY X LATE ARRIVAL DUE DELAY AFTER LANDING W LATE ARRIVAL DUE TO HIGH DEMAND FOR DESTINATION STATION V LATE ARRIVAL DUE TO WEATHER AT DESTINATION U LATE ARRIVAL DUE TO TECHNICAL REASONS

Network Manager
CODA DIGEST Q3 2016
Edition Validity Date: Edition: CDA_2016_003 Status: Proposed Issue 23
20 CODA Coverage of Commercial Flights in ECAC Region Q3 2016
Canary
Isla
nds
Network Manager
CODA DIGEST Q3 2016
Edition Validity Date: Edition: CDA_2016_003 Status: Proposed Issue 24
DOCUMENT FINAL PAGE