Embed Size (px)
DESCRIPTION
An overview of the Coconut Grove Real Estate Market for the second quarter of 2015.
Citation preview

COCONUT GROVE JOURNAL OF REAL ESTATESECOND QUARTER 2015ALBA BIONDI / 305 323 2595ISABELLE ANDREWS / 305 546 5421
GROVEEXPERTS.COM

As Alba and I compile Coconut Grove market sales performances, median prices and available inventory statistics, we see the transformation of our neighborhood. The value trends for homes and condos show that Coconut Grove real estate will soon be similar to the largest international cities in the world. During the second quarter of 2015, the single-family home market had a record total sales volume of $95,378,484. Comparably, the first quarter of 2013 only had a sales volume of $42,670,923: a 123% increase over the past two years.
In south Coconut Grove, 50% of the single-family homes sold for over $1,000,000. In North Grove, 62% sold over a $1,000,000.
Waterfront single-family homes represented 38% of total sales volume, totaling $36,287,500 in sales.
The West Grove market is also very active: 8 single-family homes soldbetween $62,500 and $543,000. The median sale price of $350,000represents a record high since 2013.
38% of all the sale transactions were paid in cash. Such a high percentage of cash transactions demonstrates a strong demand for homes in the Coconut Grove market. Our properties are perceived as solid investments.
The inventory of homes for sale versus those sold is still skewed inthe $2 million+ market segment. In South Grove, this market segmentrepresents 25% of the total homes for sale while only 8% of homes sold are at this price point. In North Grove, 37% of homes for sale are in this market but only represent 9% of homes sold.
During the second quarter of 2015, the number of condos sold in there-sale market was up 40% when compared with last quarter but was down 11% versus last year. This shows a rebounding market after a slight slow-down at the start of this year. At 56 condos, this is the highest number of condos sold since the 2nd quarter of 2014. The total sales volume increase is even more impressive with a 90% growth versus last quarter’s $41,201,919 versus $21,650,887 and 18% versus last year which generated $34,865,394 in sales.
High-end sales had a big impact on the 2nd Q condo market sales volume. 3 significant sales totaled 37% of the $41,201,919 total sales volume of the quarter.
The condo inventory is at its lowest point since October 2014 with only 88 condos for sale as of mid-July. This represents 5.1 months of inventory. This is a notable difference with other Miami areas where the number of condos available may represent up to 20 months of inventory. The sold price per square foot surpassed the $1,000 mark in certain buildings. These two factors demonstrate a great momentum for owners who are waiting to put their properties on the market.
Call us today for a confidential valuation of your house or condo. We would love to guide and represent you in the sale of your property.
Hello Grovites and the Rest of the World
Pour la version de ce texte en français, contactez-nous

3
A medida que Alba y yo recopilamos las ventas inmobiliarias de Coconut Grove, el precio medio y el inventario disponible para la venta, vemos la transformación de nuestro barrio. Los precios están empezando a ser similares a los de grandes ciudades internacionales.
En el segundo trimestre de 2015, el mercado de casas unifamiliares tuvo un volumen total récord de $ 95.378.484 en ventas en comparación con el primer trimestre de 2013, que tuvo un volumen de ventas de $ 42, 670, 923: un incremento del 123%.
En South Coconut Grove, el 50% de las viviendas unifamiliares se vendieron por más de $ 1.000.000. En North Grove, el 62% se vendieron por más de un $ 1.000.000.
Las casas unifamiliares frente al mar con un volumen de ventas de $ 36.287.500 representaron el 38% del volumen total de ventas.
El mercado de West Grove es también un mercado activo, donde 8 viviendas unifamiliares se vendieron por entre $ 62.500 y $ 543.000. El precio de venta promedio tiene un récord de $ 350.000 desde el año 2013.
El 38% de todas las operaciones de venta se pagaron en efectivo. Un porcentaje tan alto de operaciones en efectivo demuestra una fuerte demanda por propiedades en Coconut Grove. Las propiedades son percibidas como una inversión solida.
El inventario de casas a la venta comparado al vendido sigue siendo desigual en el mercado de + $ 2 millones. En el South Grove este mercado representa el 25% de las viviendas totales en venta y sólo el 8% se venden por encima de ese precio. En el North Grove, el 37% frente al 9%.
Durante el segundo trimestre de 2015, el número de apartamentos vendidos en el mercado de reventa subió un 40% en comparación con el último trimestre y bajo un 11% en comparación con el año pasado. Esto demuestra un mercado emergente luego de un pequeño periodo estancamiento al final del año pasado. Con 56 apartamentos, este es el mayor número de apartamentos vendidos desde el segundo trimestre de 2014. El aumento total del volumen de ventas es aún más impresionante, con un crecimiento del 90% frente al trimestre pasado, $ 41.201.919 versus $ 21.650.887 y un 18% frente al año pasado, que generó $ 34.865.394 en ventas. Las ventas de alta gama tuvieron un gran impacto en el volumen de ventas de condominios del segundo trimestre. 3 ventas importantes representaron el 37% de los $ 41.201.919 de volumen total de ventas del trimestre.
El inventario de apartamentos se encuentra en su punto más bajo desde octubre de 2014, con sólo 88 apartamentos a la venta a mediados de julio. Esto representa 5,1 meses de inventario. Esta es una diferencia notable con otras áreas de Miami, donde el número de apartamentos disponibles representa hasta 20 meses de inventario. El precio de venta por metro cuadrado superó $ 1.000 por metro cuadrado en algunos edificios. Estos dos factores crean un gran impulso para los propietarios que estaban esperando el momento apropiado para poner sus propiedades en el mercado.
Llámenos hoy para una valoración confidencial de su casa o apartamento. Nos encantaría guiarle y representarle para vender su propiedad.
Hola Grovites y el Resto del Mundo

$148,084,544 is the total sales volume during the first 6 months of 2015, compared with $137,012,795 sold in 2014. Waterfront homes are driving this performance, $50,387,500 sold during the first 6 months of 2015 versus $15,525,000 sold in 2014.
Most homes sold are under the $2 million price point: 91% in North Grove and 92% in South Grove
Single-Family HomeRecord Sales Volumes
A Skewed Inventory
200
9
$250,000,000
$200,000,000
$150,000,000
$100,000,000
$50,000,000
0
2010
2011
2012
2013
2014
North Grove Sold 2Q 2015
South Grove Sold 2Q 2015
North Grove for Sale
South Grove for Sale
9%$ 2 M-$ 3 M
8%$ 2 M-$ 3 M
10%> $ 3 M
24%$ 1.5 M-$ 2 M
19%$ 1.5 M-$ 2 M
27%$ 2 M-$ 3 M
38%< $ 1 M
50%< $ 1 M
27%< $ 1 M
29%$ 1 M-$ 1.5 M
23%$ 1 M-$ 1.5 M
9%$ 1.5 M-$ 2 M
27%$ 1 M-$ 1.5 M
19%> $ 3 M
6%$ 2 M-$ 3 M
15%$ 1.5 -$ 2 M
24%$ 1 M-$ 1.5 M
36%< $ 1 M
5
12 34 5
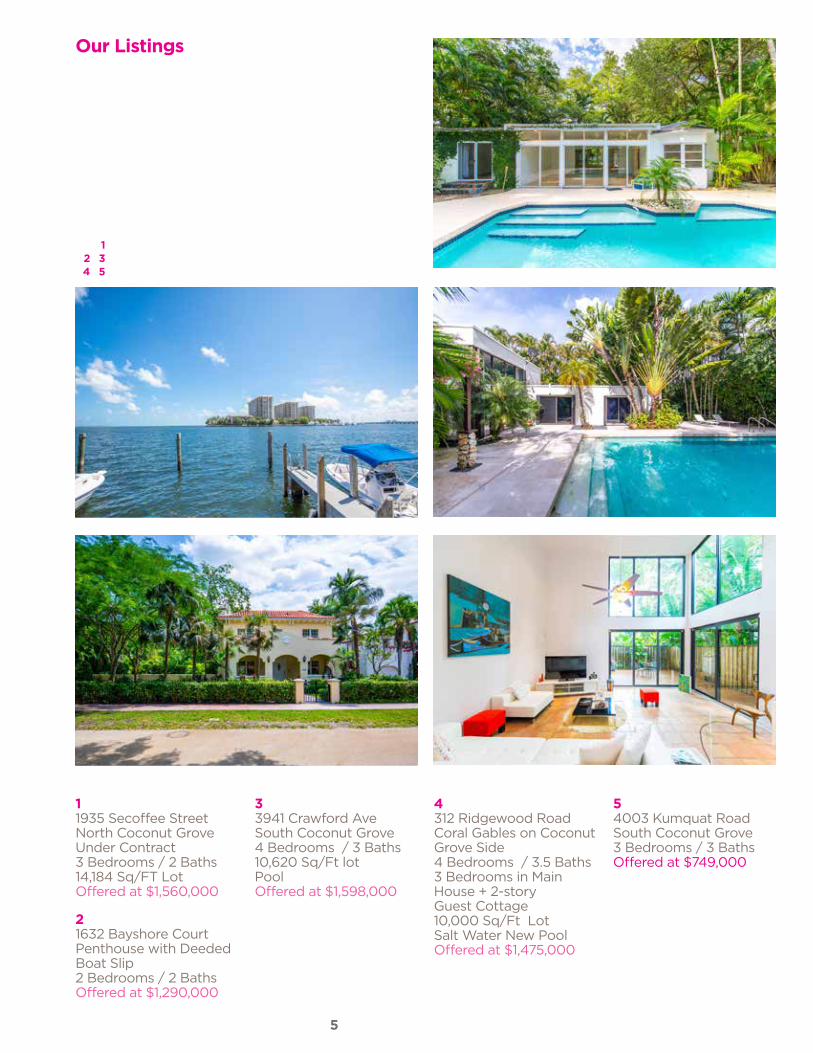
33941 Crawford Ave South Coconut Grove4 Bedrooms / 3 Baths10,620 Sq/Ft lot PoolOffered at $1,598,000
4312 Ridgewood Road Coral Gables on Coconut Grove Side 4 Bedrooms / 3.5 Baths 3 Bedrooms in Main House + 2-story Guest Cottage 10,000 Sq/Ft LotSalt Water New PoolOffered at $1,475,000
54003 Kumquat RoadSouth Coconut Grove3 Bedrooms / 3 Baths Offered at $749,000
11935 Secoffee StreetNorth Coconut GroveUnder Contract3 Bedrooms / 2 Baths 14,184 Sq/FT LotOffered at $1,560,000
21632 Bayshore Court Penthouse with Deeded Boat Slip 2 Bedrooms / 2 Baths Offered at $1,290,000
Our Listings

Condos For Sale Versus Condos Sold Per Market Segment
2 M
+2
M +
2 M
+2
M +
2 M
+2
M +
2 M
+
500
K -
1 M
500
K -
1 M
500
K -
1 M
500
K -
1 M
500
K -
1 M
500
K -
1 M
500
K -
1 M
UN
DE
R 5
00
KU
ND
ER
50
0K
UN
DE
R 5
00
KU
ND
ER
50
0K
UN
DE
R 5
00
KU
ND
ER
50
0K
UN
DE
R 5
00
K
1.5 M
- 2
M1.5
M -
2 M
1.5 M
- 2
M1.5
M -
2 M
1.5 M
- 2
M1.5
M -
2 M
1.5 M
- 2
M
1 M -
1.5
M1 M
- 1.
5 M
1 M -
1.5
M1 M
- 1.
5 M
1 M -
1.5
M1 M
- 1.
5 M
1 M -
1.5
M
25
25
20
20
15
15
35
45
Sold 1st Q2014
Sold 1st Q2015
Sold 2nd Q2014
Sold 2nd Q2015
Sold 3rd Q2014
For Sale MidJuly 2015
Sold 4th Q2014
35
10
10
30
40
30
5
5
0
0
The Coconut Grove condo market showed a 90% increase in total sales over the first quarter of 2015 and a corresponding decrease in available inventory. The “Under $500k” market segment has the smallest inventory. As of mid-July there were only 29 properties in this market segment, representing a 17% decrease when compared with last quarter.
These statistics demonstrate a strong sellers market.
Total Number ofCondos for Sale
Mid Jan 2014
Mid Apr 2014
Mid Jul 2014
10/3 2014
Mid Jan 2015
Mid Apr 2015
Mid Jul 2015
Total # Condos For Sale 104 100107 97 9788 88

7
Worldwide Square Meter Prices in US$Urban Apartments - 120 sq. meters (1,291 sq. ft.)
Coconut Grove enjoys a very solid re-sale condo market with less than 6 months of available inventory
As Grovites, we may wonder when the upward trends will soften. Let’s not forget that Miami is still a very underpriced city compared to the rest of the world. The beauty of the Grove, its location, our gorgeous bay and the tropical easy way of life make our neighborhood a prime destination to invest.
City US$/Sq. Meter
US$/Sq. Foot
London, UK
Hong Kong
New York, USA
Paris, France
Moscow, Russia
Tokyo, Japan
Toronto, Canada
Miami Beach, USA
Miami, USA
31,731
25,089
21,784
15,375
13,377
10,784
8,288
8,181
5,113
2,948
2,331
2,024
1,428
1,243
1,002
770
760
475
Sources www.globalpropertyguide.com, Southeast Florida Regional MLSData based on: 2013 and 2014 average per square meter (sq. m.) prices in US$ of 120-sq.m. apartments located in the centre of the most important city of each country, either the: Administrative capital and/or Financial capital and/or the centre of the rental market.
Currency exchange rates as of June 11, 2015
Condos For Sale Mid-July 2014
Condos For Sale Mid-July 2015
Condos Sold 2nd Q 2014
Condos Sold 2nd Q 2015
Total Volume Sold 2nd Q 2014
Total Volume Sold 2nd Q 2015
Grove Isle
Grovenor House
Ritz Carlton
Yacht Harbour
15
11
7
1
7
5
10
8
6
3
5
0
6
3
4
2
$ 4,617,800
$ 9,795,000
$ 3,904,000
$ 0
$ 5,936,000
$ 12,120,000
$ 3,896,000
$ 1,510,000
All material herein is intended for information purposes only and has been compiled from sources deemed reliable. Though information is believed to be correct, data sources are subject to errors, omissions, changes or withdrawal without notice. This not intended to solicit property already listed. Equal Housing Opportunity practice.
“WE BELIEVE COCONUT GROVE IS EXTRAORDINARY”
Alba Biondi305 323 2595
Isabelle Andrews305 546 5421
Our purpose is to introduce Coconut Grove to the world as the ultimate neighborhood for people in search of beauty, tropical elegance and a high quality of life.


