Embed Size (px)
Citation preview

TFO - Private Sector Partnerships in International
Trade Development Projects - November 14, 2012
Cocoa Livelihoods Program
WorldCocoa.org

People
Healthy and thriving
cocoa-farming house-
holds and communities
A one-of-a-kind nonprofit organization
promoting a sustainable cocoa economy
through economic and social development
and environmental stewardship in cocoa-
growing communities.
Planet
Responsible, sound
environmental practices
Profit
Improved and more
equitable economic
returns for farmers
WCF: Improving Cocoa Sustainability

100+ Members

Our Approach
Peace Corps Deutsche
Gesellschaft für Internationale
Zusammenarbeit (GIZ)
International Finance
Corporation
World Education
WCF Bill & Melinda
Gates Foundation
USAID
USDA
Swiss-
contact
Partnerships that ensure accountability,
measurable impact and scale

Cocoa Sector Overview
Cocoa grows in the equatorial band: Latin America (13%), West Africa (70%), and Southeast Asia (17%)
90% of cocoa comes from independent, smallholder farms (2-5 hectares)
5-6 million farmers, few organized farmer groups <15%
Tree crop: 5-6 yrs to produce
On average, low productivity & labor intensive crop
Publicly traded commodity, $100 Billion Chocolate/Cocoa Market
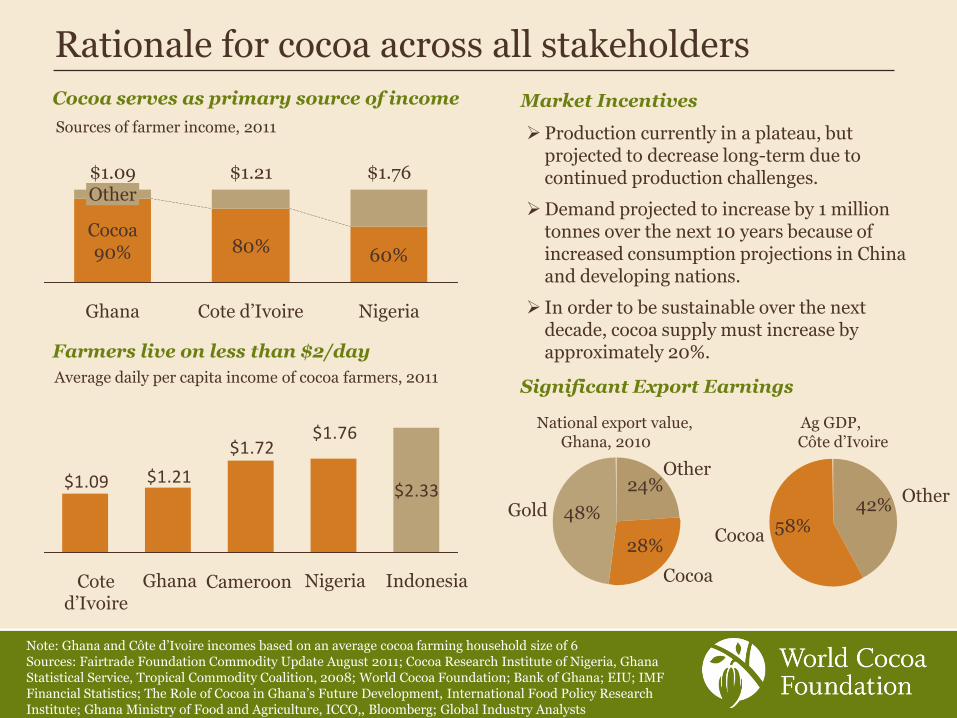
Note: Ghana and Côte d’Ivoire incomes based on an average cocoa farming household size of 6 Sources: Fairtrade Foundation Commodity Update August 2011; Cocoa Research Institute of Nigeria, Ghana Statistical Service, Tropical Commodity Coalition, 2008; World Cocoa Foundation; Bank of Ghana; EIU; IMF Financial Statistics; The Role of Cocoa in Ghana’s Future Development, International Food Policy Research Institute; Ghana Ministry of Food and Agriculture, ICCO,, Bloomberg; Global Industry Analysts
Rationale for cocoa across all stakeholders
Farmers live on less than $2/day
$2.33
$1.76$1.72
$1.21$1.09
Indonesia Nigeria Ghana Cote d’Ivoire
Average daily per capita income of cocoa farmers, 2011
Market Incentives
80% 60%
Ghana Nigeria
$1.76
Cote d’Ivoire
$1.21 $1.09
Cocoa 90%
Other
Sources of farmer income, 2011
Cocoa serves as primary source of income
Production currently in a plateau, but projected to decrease long-term due to continued production challenges.
Demand projected to increase by 1 million tonnes over the next 10 years because of increased consumption projections in China and developing nations.
In order to be sustainable over the next decade, cocoa supply must increase by approximately 20%.
Significant Export Earnings
National export value, Ghana, 2010
Other
Gold 48%
Cocoa
28%
24%
Ag GDP, Côte d’Ivoire
Cocoa 58%
Other 42%
Cameroon

Marketing Production Farmer
Resilience
• Farmers receive 40-70% of farm gate price
• Lack of price information and leverage w/ buyers
• Inefficient service
delivery to farmers
• Aging tree populations
• Plant diseases
• Decrease soil fertility
• Outdated cocoa practices Farmers abandoning cocoa for other crops
• Climate change shrinking areas suitable for cocoa growth
• Farmer vulnerability to climate change
• Cocoa price fluctuations
• Dependency on one income source
Cocoa Sustainability Challenges

Goal: Double the income of 200,000 farming
households over 10 years (Phase I: 2009-13)
Objectives:
Marketing Efficiency
- Farmer Aggregation
- FO Professionalization
Production Efficiency
- Training in GAP
- Increase access to credit and agri-inputs
- Rehabilitating old cocoa farms
Farmer Competitiveness
- Training in farm management
- Diversification of income sources
Cocoa Livelihoods Program Model Type: Coalition
- BMGF
- 16 Industry partners
- 4 Governments
- IDH & BMZ
• Extension: 5 Implementing
partners national extension
services & Matching Grants
• Total Project Budget: $40M
• Locations: Cote d’Ivoire, Ghana,
Nigeria, Cameroon
• Governance: PMU, Steering
Committee, technical committee

Opportunities realized through CLP
BMGF (donor)
Government
WCF CLP
Industry
Cocoa value chain as channel for donor agenda to reduce global poverty Knowledge network across agriculture
(& health) projects Innovative strategies Improving the productivity gap and
market access Financial incentive
Direct relationships with farmers Vested interest in improving
quality and productivity gap Efficient service delivery –
leverage distribution network Development of reliable source CSR Technical expertise
Enabling environment Vested interest in improving quality and productivity gap Strengthening national institutions and infrastructure Workforce and local market economic development
Catalyst & Knowledge
Ownership & Infrastructure
Market Presence & Investment

CLP Key Accomplishments to Date - 36 FOs (12,500 farmers) training in professionalization
- 151,000 farmers trained in GAP, Farm Management, Correct use of inputs
- Development of Growth Fund – Working capital and Input credit
- Transition of extension service to National Agencies
- 80% of program funds remain in program countries
- Growing collaboration amongst industry partners
Innovation Model: Industry Led Development through Matching Grants
- 5 Matching Grants awarded in 2011 to 7 CLP companies
- Projects focused on CLP Objectives: Marketing efficiency, Production, Farmer
competiveness
- Reach an additional 35,000 farmers

Original Structure
Core Led Program
• Implementation by 5 core
partners
• 90% funding towards core
activities
• Industry primary role on
Steering Committee and some
technical participation
Evolution of CLP structure
New Structure
Industry Led Program
• Implementation through
industry led Matching Grants
• Core activities focused on M&E,
Knowledge management,
innovation testing, coordination
& support
• 90% funding towards matching
grants
• Training institutionalized
through national extension
services

CLP Attributes and Lessons Learned Key Attributes Lessons Learned for Success
Multi-stakeholder approach creates stronger program and improves long term sustainability
• Establishing platforms for knowledge sharing and group decision making – i.e. Steering Committee Meeting, task force, web-based knowledge management
• Need to maintain consistent participation of members • Develop knowledge sharing requirement for participation
Embed activities with public and private sector
• Recognize capacity of partners • Support and train partners early in process • Develop appropriate and standardized M&E and reporting
platform and materials
Governance structure enables strategic dialogue and adaptability
• Maintain open, consistent communication • Develop platform for participation • Harness both public and private sector expertise • Know your partners & interests

www.worldcocoa.org


![[35th Annual Cocoa Beach Preliminary Program REV#11/Jan13 ...advancedceramics.org/clientuploads/2011CocoaBeach... · [35th Annual Cocoa Beach Preliminary Program REV#11/Jan13,2011-8:30am]](https://img.dokumen.tips/doc/110x75/5f05b1307e708231d4143975/35th-annual-cocoa-beach-preliminary-program-rev11jan13-35th-annual-cocoa.jpg)