Embed Size (px)
Citation preview

24th ABCM International Congress of Mechanical Engineering December 3-8, 2017, Curitiba, PR, Brazil
COBEM-2017-1954
COMPLEX FLUID FLOW THROUGH A CONSTRICTED
MICROCHANNEL
José Angel Florián Gutiérrez,
Maria Moura,
Marcio Carvalho
Pontifícia Universidade Católica do Rio de Janeiro (PUC) – Department of Mechanical Engineering
Rua Mârques de São Vicente, 225, Gávea – Rio de Janeiro, CEP 22451-900, RJ - Brasil
[email protected]; [email protected]; [email protected]
Abstract. This work presents a study of the flow of a viscoelastic solution of PEO (0.1 wt% Polyethylene Oxide
solution) through a constricted glass microchannel, used as model for a pore-throat geometry of a porous media.
Pressure drop measurements are performed and flow velocity fields are obtained using the micro particle image
velocimetry (micro-PIV) technique. Experiments with a viscous solution of glycerin (61 wt% glycerin in water), of
similar shear viscosity to the PEO solution, were also performed to investigate elastic effects of the PEO solution.
Non-linear pressure drop behavior due to extensional effects of the PEO solution were observed. The velocity fields of
the glycerin solution showed a permanent regime for the entire flow rate range explored, while the PEO solution
shows changes in the direction of the flow and velocity fluctuations over time for high flow rates. In addition, the
presence and growth of vortices (upstream of the constriction) were observed for the PEO solution. This study
provides important information on how viscoelastic polymer solutions behave in a porous media and can impact their
use in Enhanced Oil Recovery.
Keywords: Microfluidics, Viscoelasticity, Elastic turbulence, PEO Polymeric solution, Micro-PIV
1. INTRODUCTION
Polymeric solutions are used to modify flow in various applications, the most common being enhanced oil recovery.
The sweep efficient of water injection in an oil reservoir (secondary oil recovery) is limited due to a high mobility ratio
between the water and oil. This promotes a non-ideal displacement behavior called fingering. Polymeric solutions are
used to improve oil recovery due to their higher viscosity when compared to water. Viscoelastic properties of the
polymeric solutions may also change the pore-scale flow behavior and reduce the residual oil saturation. However,
polymer injections are still not well understood. Microfluidic devices can be used to represent porous media and study
the effects of viscoelasticity at the micro-scale.
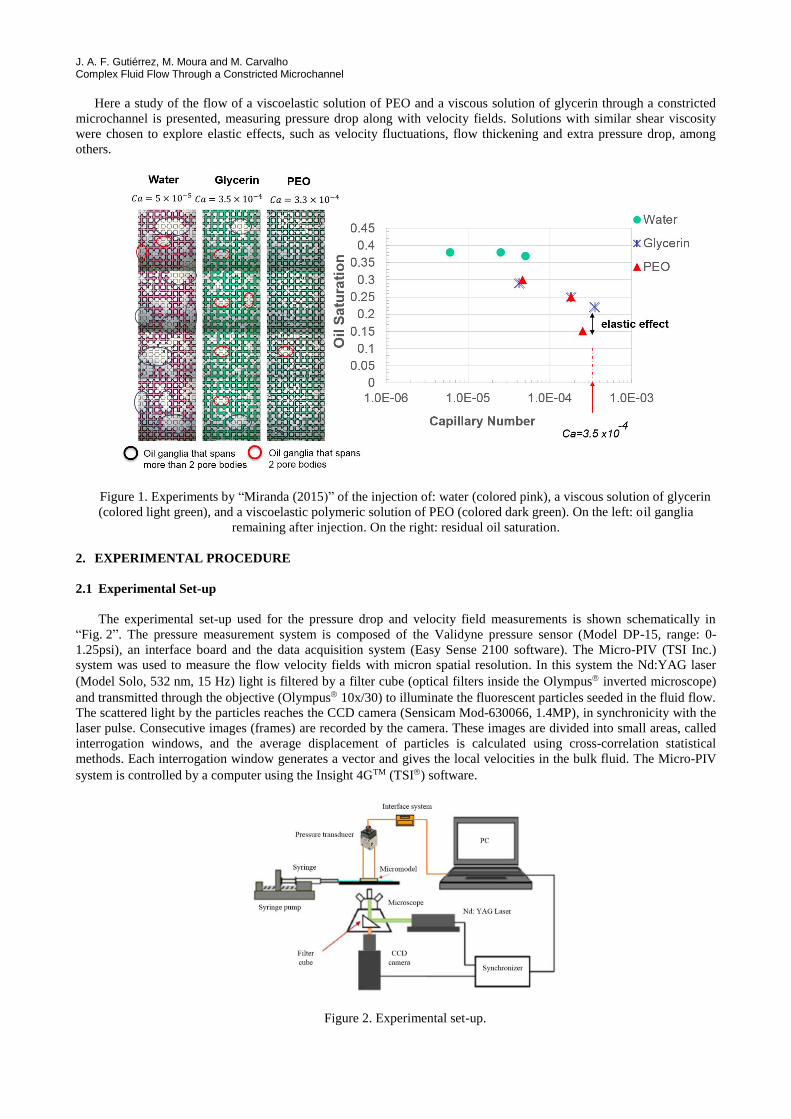
“Recently, Miranda (2015)” performed injection tests of three different fluids - water, a viscous solution of glycerin,
and a viscoelastic polymeric solution of PEO - in an oil saturated glass microfluidic device (pore network and
channels). They observed that the PEO injection produced a greater displacement of oil ganglia and a lower residual oil
saturation than the glycerin and the water injections, as shown in “Fig. 1”. The higher mobilization of oil ganglia
observed with the injection of the PEO solution was associated with the lower water mobility at the pore scale and the
extensional behavior of the PEO solution. As a consequence, a lower residual oil saturation was obtained.
Recent studies have shown pressure drop increase in the flow of viscoelastic liquids through constrictions. “Clarke,
et al., 2015” used particle tracking velocimetry (PTV) to visualize the injection of HPAM viscoelastic solutions in a
microfluidic device (pore network and channels) and observed velocity fluctuations associated to pressure drop
increase. “Boek, et al., 2006” analysed the behavior of EHAC polymeric solutions flowing through a microchannel with
expansion-contraction geometry using micro-PIV. They showed that the water flow is stable, but the EHAC solution
exhibits velocity fluctuations in the contraction region. These velocity fluctuations were linked to the phenomena called
elastic turbulence (transition from steady laminar flow to a strongly fluctuating flow).
J. A. F. Gutiérrez, M. Moura and M. Carvalho Complex Fluid Flow Through a Constricted Microchannel
Here a study of the flow of a viscoelastic solution of PEO and a viscous solution of glycerin through a constricted
microchannel is presented, measuring pressure drop along with velocity fields. Solutions with similar shear viscosity
were chosen to explore elastic effects, such as velocity fluctuations, flow thickening and extra pressure drop, among
others.
Figure 1. Experiments by “Miranda (2015)” of the injection of: water (colored pink), a viscous solution of glycerin
(colored light green), and a viscoelastic polymeric solution of PEO (colored dark green). On the left: oil ganglia
remaining after injection. On the right: residual oil saturation.
2. EXPERIMENTAL PROCEDURE
2.1 Experimental Set-up
The experimental set-up used for the pressure drop and velocity field measurements is shown schematically in
“Fig. 2”. The pressure measurement system is composed of the Validyne pressure sensor (Model DP-15, range: 0-
1.25psi), an interface board and the data acquisition system (Easy Sense 2100 software). The Micro-PIV (TSI Inc.)
system was used to measure the flow velocity fields with micron spatial resolution. In this system the Nd:YAG laser
(Model Solo, 532 nm, 15 Hz) light is filtered by a filter cube (optical filters inside the Olympus inverted microscope)
and transmitted through the objective (Olympus 10x/30) to illuminate the fluorescent particles seeded in the fluid flow.
The scattered light by the particles reaches the CCD camera (Sensicam Mod-630066, 1.4MP), in synchronicity with the
laser pulse. Consecutive images (frames) are recorded by the camera. These images are divided into small areas, called
interrogation windows, and the average displacement of particles is calculated using cross-correlation statistical
methods. Each interrogation window generates a vector and gives the local velocities in the bulk fluid. The Micro-PIV
system is controlled by a computer using the Insight 4GTM (TSI) software.
Figure 2. Experimental set-up.

24th ABCM International Congress of Mechanical Engineering December 3-8, 2017, Curitiba, PR, Brazil
2.2 Working fluids
The viscoelastic solution used was composed of polyethylene oxide (PEO, Mw=8x10⁶ g/mol) at concentration of
0.1% by weight. The viscoelastic solution (PEO in deionized water) was mixed using a digital mechanical stirrer
(Model RW-20, IKA) at 200 rpm for 24h. It was then characterized rheologically using the rotation rheometer
(Physica MCR 301-Anton Paar). The solution showed a shear thinning behavior (the viscosity decreases with
increasing shear rate). The range of shear viscosity was 3 to 5 cP at 23°C (shear rates used in the experiments).
The viscous solution used was composed of glycerin (C3H8O3, Mw=92.09 g/mol) at concentration of 61% by
weight. The viscous solution (glycerin in deionized water) was homogenized using a digital magnetic stirrer (Model
Corning PC-240) at 500 rpm for 1h. It was then characterized rheologically using the rotation rheometer. The shear
viscosity of the solution was of 4.0 cP at 23°C, close to the PEO solution viscosity.
2.3 Methodology
“Figure 3” shows: a) the glass micromodel (Dolomite Microfluidics Center Ltd.) used as pore space model, and b)
the geometry of the elliptical cross section and details of the constriction.
For each experiment, the solution was loaded into the glass syringe (Hamilton Gastight, 2.5 ml) and pumped
through the micromodel using the syringe pump (Harvard Apparatus Elite 11). The solution enters in the opening 2 of
the glass micromodel and exits through 3 (see Fig. 3). The openings 1, 6, and 7 are closed during the experiments.
To measure the pressure drop of the solutions across the constriction the openings 4 and 5 were connected to the
chamber of the pressure transducer. The data acquisition was performed every 0.25 seconds for a total time interval of
10 minutes, using the Easy Sense 2100 software.
To measure the velocity field near the constriction, each solution was seeded with polystyrene microspheres
(1.0 µm, orange fluorescent, Thermo Fisher Scientific) to follow the flow, without interfering with it. The images were
processed using the Insight 4GTM software to obtain the velocity vectors.
Figure 3. Micromodel, cross-section, and constriction geometry.
3. RESULTS AND DISCUSSION
3.1 Measurements of pressure drop
Pressure drop measurements across the constriction were performed for the PEO solution and for the glycerin
solution. The goal of performing measurements with a viscoelastic fluid and a viscous fluid with similar shear viscosity
was to explore extensional thickening of the PEO solution that can lead to additional pressure drop.
“Figure 4” shows the pressure drop as a function of the flow rate for the glycerin solution and for the PEO solution.
The contraction ratio is 2.5 (110 µm/46 µm). The glycerin solution presented a linear behavior (Newtonian fluid)
for the entire flow rate range explored. The PEO solution exhibited a linear response up to a critical flow rate of
Qc~0.08 ml/h. Above this critical flow rate the pressure drop showed a non-Newtonian behavior. This occurs due to
elastic effects of the polymer.
To show the pressure increase associated with the elastic effects a plot of the ratio of the pressure drop of the PEO
solution to the pressure drop of the glycerin solution is presented in “Fig. 5”. In the Newtonian region, flow rates up to
~0.08 ml/h, the ratio is close to 1, therefore no extensional effect are observed. In the non-Newtonian region the ratio
increases with the flow rate (elastic effects). For the flow rate of 0.18 ml/h the ratio is 4 and for 0.28 ml/h the ratio is
6.7.

J. A. F. Gutiérrez, M. Moura and M. Carvalho Complex Fluid Flow Through a Constricted Microchannel
Figure 4. Pressure drop of the viscoelastic solution of PEO and the viscous solution of glycerin vs. flow rate.
Figure 5. Ratio of the pressure drop of the PEO solution to the pressure drop of the glycerin solution as a function of
the flow rate.
3.2 Measurements of velocity field
Micro Particle Image Velocimetry (micro-PIV) was used to study the different flow patterns in the region of the
constriction (pore-throat model). Flow experiments were carried out for the viscous solution of glycerin (Newtonian
fluid) and for the viscoelastic solution of PEO. The velocity fields studied for the different flow rates are shown in
Tab. 1.

24th ABCM International Congress of Mechanical Engineering December 3-8, 2017, Curitiba, PR, Brazil
Table 1. Scheme of the velocity field study performed.
Solution Flow rate (ml/h) Average velocity field Standard deviation velocity field
Glycerin
0.06
0.18
0.28
PEO
0.06
0.18
0.28
The average velocity field consists of creating a field vector from the sample mean of several instantaneous fields.
This process minimizes problems of insufficient number of particles inside each interrogation area, reduces the
percentage error due to Brownian motion of the particles, and increases the signal to noise ratio in the correlation peak.
The spatial resolution used was 32x16 pixel2 (1 pixel = 0.32 µm). To determine the velocity fields 500 consecutives
image pairs obtained at a frequency of 4.83 Hz were used.
The results for the viscous solution of glycerin are shown in “Fig. 6”. As expected for a Newtonian fluid, the flow
field is symmetric and the Poiseuille profiles can be seen along the microchannel.

J. A. F. Gutiérrez, M. Moura and M. Carvalho Complex Fluid Flow Through a Constricted Microchannel
Figure 6. Glycerin solution - average velocity field for the flow rates of: 0.06, 0.18, and 0.28 ml/h, respectively.

24th ABCM International Congress of Mechanical Engineering December 3-8, 2017, Curitiba, PR, Brazil
The results for the viscoelastic solution of PEO are shown in “Fig. 7”. A significant change in the velocity profiles is
observed with the increase of the flow rate. The streamlines showed the presence of vortices. The size of the vortices
increased with the flow rate.
Figure 7. PEO solution - average velocity field for the flow rates of: 0.06, 0.18, and 0.28 ml/h, respectively.

J. A. F. Gutiérrez, M. Moura and M. Carvalho Complex Fluid Flow Through a Constricted Microchannel
Instantaneous velocity fields (single image pair) of the PEO solution showed changes in the direction of the flow
and velocity fluctuations over time for high flow rates. To quantify this effect standard deviation velocity fields were
produced. The spatial resolution used in this case was 64x32 pixel2, higher than the previous case to minimize statistical
noise.
The results for glycerin solution are shown in “Fig. 8”. As expected the standard deviation velocity field is
approximately zero for the entire region (no associated elasticity). The standard deviation variation close to the channel
walls and to the center of the constriction is just an artifact due to low particle statistics.
Figure 8. Glycerin solution – Standard deviation for the flow rates of: 0.06, 0.18, and 0.28 ml/h, respectively.

24th ABCM International Congress of Mechanical Engineering December 3-8, 2017, Curitiba, PR, Brazil
The results for the PEO solution are shown in “Fig. 9”. The linear response region, low flow rates (Q=0.06 ml/h),
showed a steady flow over time. In this case, inertial stresses were more important than elastic stresses, i.e., the polymer
relaxes faster than it is being unraveled. However, for the non-Newtonian region (Q=0.28 ml/h) large fluctuations were
observed in the region of the constriction (the local velocities varied strongly with time). In this case elastic stresses
were dominant compared to inertial stresses, which is related to the number Reynolds of Re=0.26. These velocity
fluctuations are known as elastic turbulence (changes in the stability of the laminar flow), “Boek, et al., 2006”.
Figure 9. PEO solution – Standard deviation for the flow rates of: 0.06, 0.18, and 0.28 ml/h, respectively.

J. A. F. Gutiérrez, M. Moura and M. Carvalho Complex Fluid Flow Through a Constricted Microchannel
4. CONCLUSIONS
The flow of a viscoelastic polymeric solution of PEO (0.1 wt%) through a constricted glass microchannel
(contraction ratio of 2.5) was studied here through measurements of pressure drop along with micro-PIV velocity
fields. To identify elasticity effects, experiments with a viscous solution of glycerin (61 wt%), of similar shear viscosity
to the PEO solution, were also performed.
The pressure drop measurements showed that the PEO solution presented a non-Newtonian behavior above a critical
flow rate (Qc~0.8 ml/h). For flow rates above Qc, it was observed that the pressure drop difference between the PEO
solution and the Newtonian glycerin solution increases as the flow rate increases. This enhanced pressure drop is due to
the elastic response of the PEO solution when passing through the constriction (polymer chain resistance to extension).
The PEO solution velocity fields showed velocity fluctuations over time (elastic turbulence), coinciding with the
onset of the extra pressure drop (non-Newtonian behavior). In addition, vortices´ growth was observed with the increase
of the flow rate. For the entire flow rate range explored in this work (0-0.36 ml/h), symmetric and Poiseuille profiles
were obtained for the glycerin solution. This confirms that the effects observed with the PEO solution are due to the
elasticity of the polymer.
This work helps the fundamental understanding of the behaviour of polymer solutions flowing through pore-throat
geometries and can be used to improve oil recovery.
5. ACKNOWLEDGMENTS
The authors acknowledge the support from CNPq by granting a PhD fellowship.
6. REFERENCES
Boek, E. S., Padding, J. T., and Anderson, V. J., 2006. Flow of entangled workmlike micellar fluids: Mesoscopic
simulations rheology and µ-PIV experiments. Journal of Non-Newtonian Fluid Mechanics, UK.
Clarke, A., Howe M. and Mitchell J., 2015. Mechanism of anomalously increased oil displacement with aqueous
viscoelastic polymer solution. Journal The Royal Society of Chemistry, UK.
Miranda, N., 2015. Pore-scale analysis of oil displacement by polymer solution. MSc. Dissertation, Pontifical Catholic
University of Rio de Janeiro, Brazil.
7. RESPONSIBILITY NOTICE
The author(s) is (are) the only responsible for the printed material included in this paper.