Embed Size (px)
Citation preview
Cobb County Water SystemCobb County Water System Engineering and Records DivisionEngineering and Records Division
Cobb County Water System Cobb County Water System –– From the CustomerFrom the Customer’’s Views View
WHATWHAT’’S ENGINEERING S ENGINEERING GOT TO DO WITH IT?GOT TO DO WITH IT?
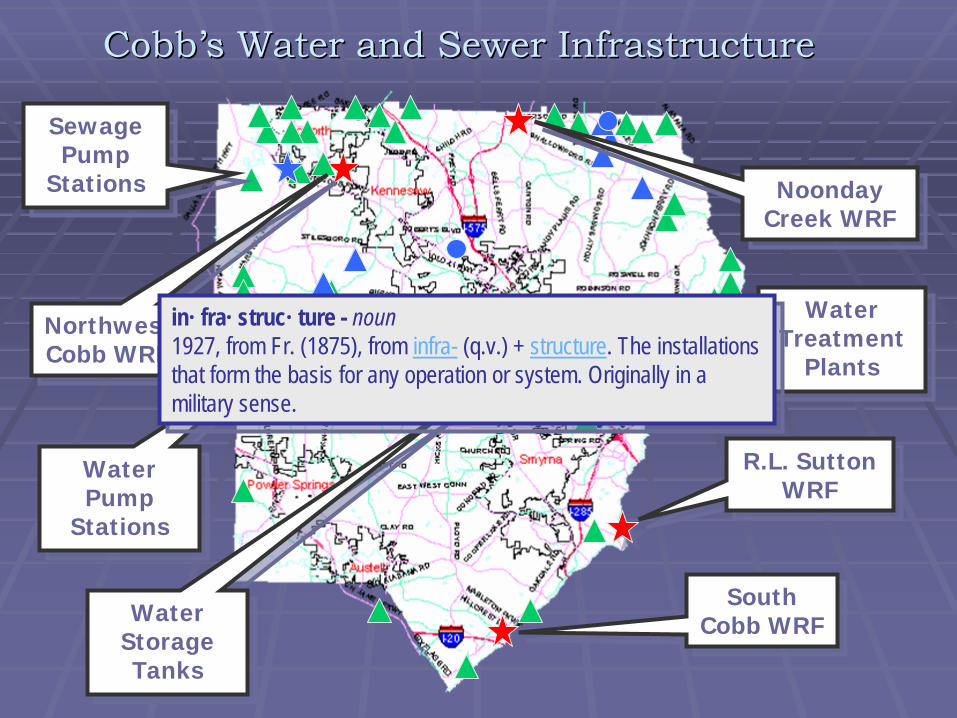
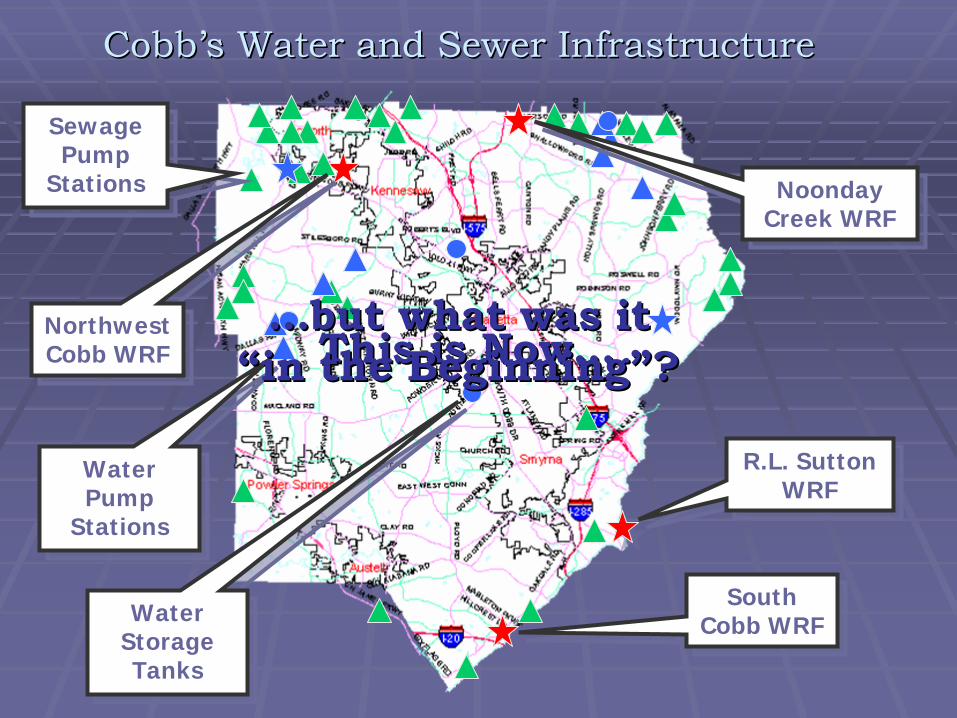
CobbCobb’’s Water and Sewer Infrastructures Water and Sewer Infrastructure
R.L. Sutton WRF
R.L. Sutton WRF
South Cobb WRF
South Cobb WRF
Northwest Cobb WRF
Northwest Cobb WRF
Sewage Pump
Stations
Sewage Pump
Stations Noonday Creek WRF Noonday
Creek WRF
WaterPump
Stations
WaterPump
Stations
Water Treatment
Plants
Water Treatment
Plants
WaterStorage Tanks
WaterStorage Tanks
in· fra· struc· ture - noun 1927, from Fr. (1875), from infra- (q.v.) + structure. The installations that form the basis for any operation or system. Originally in a military sense.
in· fra· struc· ture - noun 1927, from Fr. (1875), from infra- (q.v.) + structure. The installations that form the basis for any operation or system. Originally in a military sense.
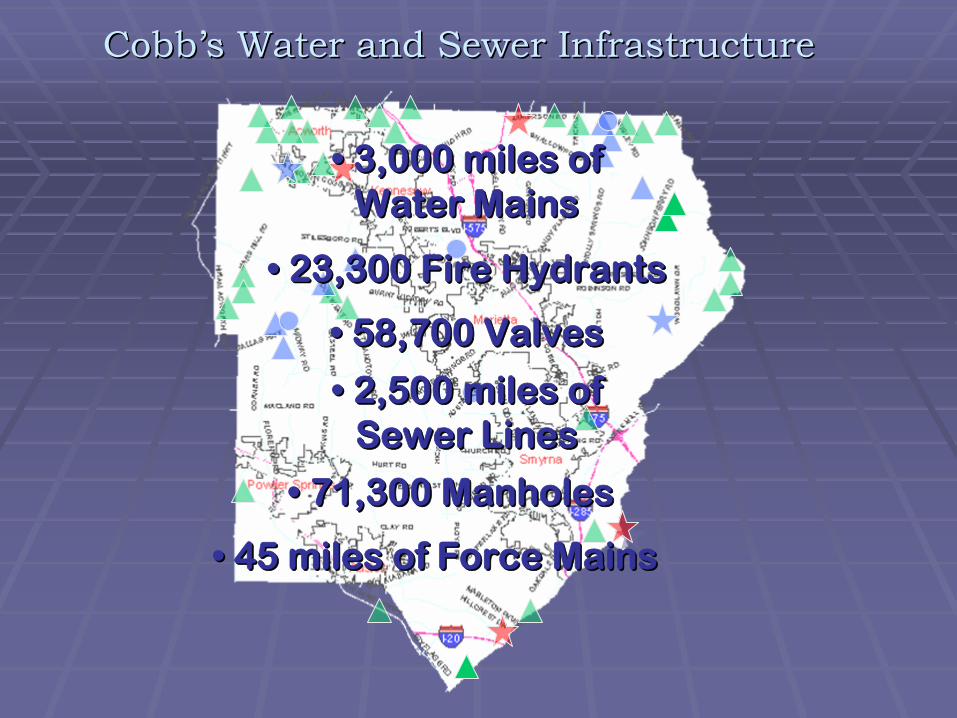
CobbCobb’’s Water and Sewer Infrastructures Water and Sewer Infrastructure
•• 3,000 miles of 3,000 miles of Water MainsWater Mains
•• 23,300 Fire Hydrants23,300 Fire Hydrants
•• 58,700 Valves58,700 Valves
•• 2,500 miles of 2,500 miles of Sewer LinesSewer Lines
•• 45 miles of Force Mains45 miles of Force Mains
•• 71,300 Manholes71,300 Manholes
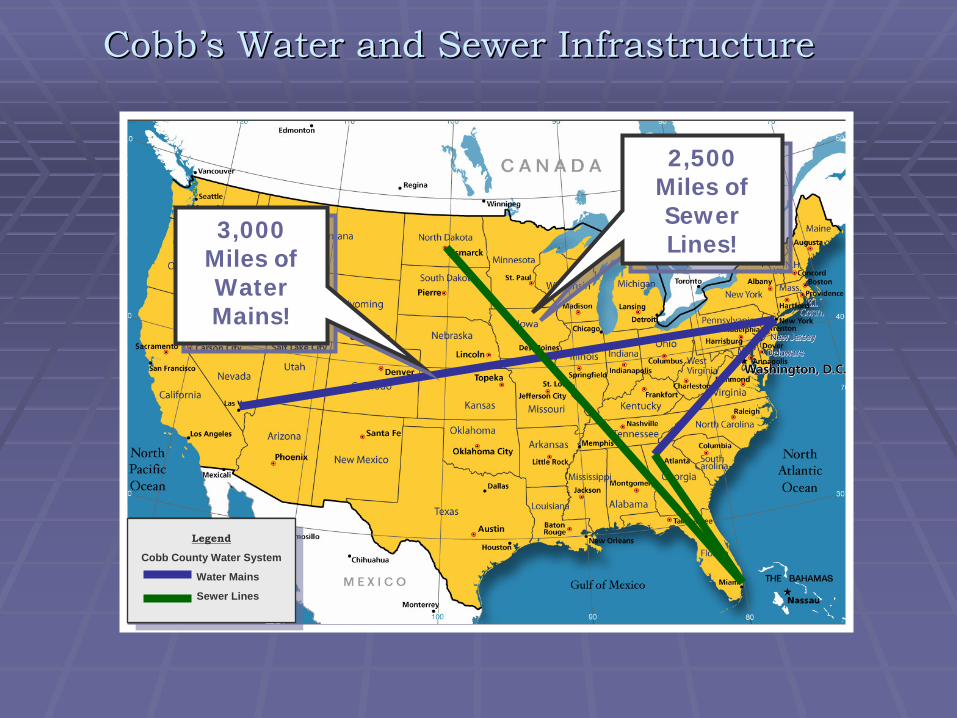
Legend
Cobb County Water System
Water Mains
Sewer Lines
CobbCobb’’s Water and Sewer Infrastructures Water and Sewer Infrastructure
3,000 Miles of Water Mains!
3,000 Miles of Water Mains!
2,500 Miles of Sewer Lines!
2,500 Miles of Sewer Lines!
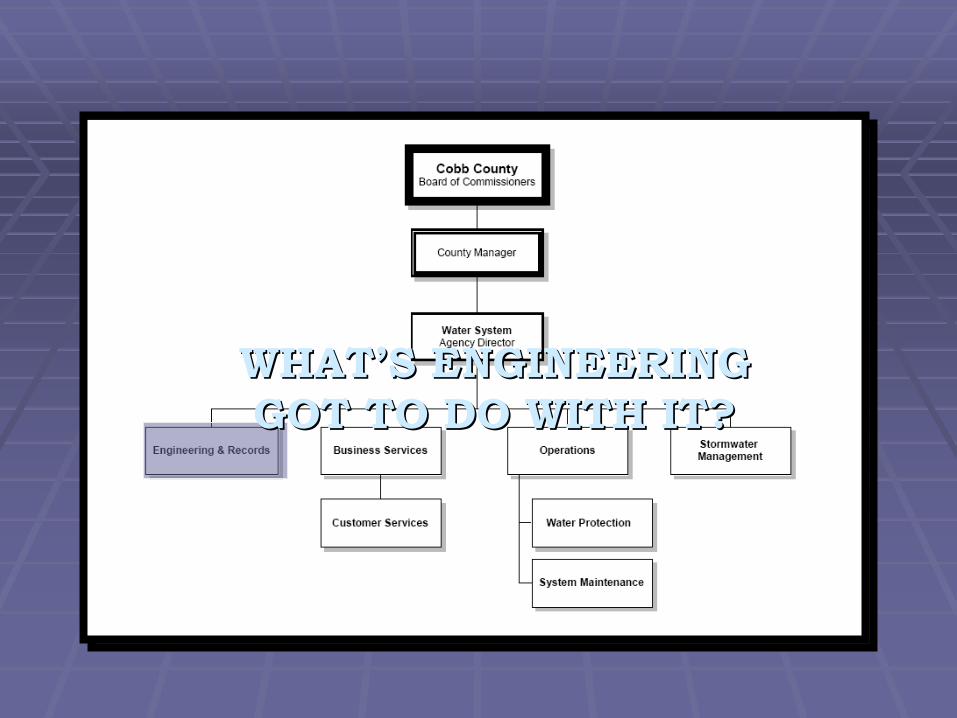
WHATWHAT’’S ENGINEERING S ENGINEERING GOT TO DO WITH IT?GOT TO DO WITH IT?
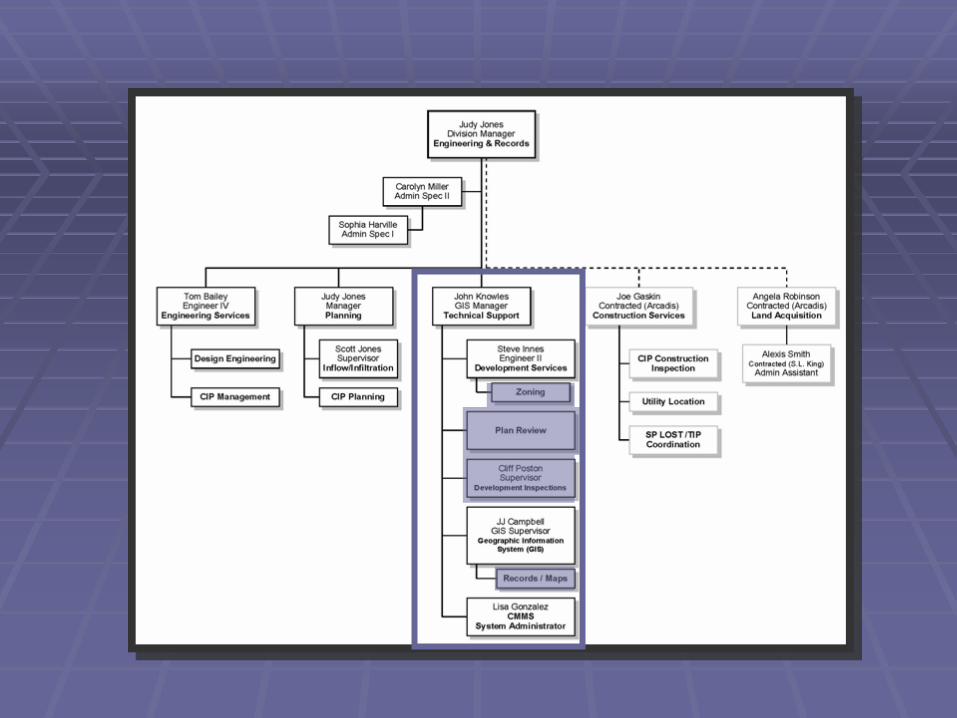
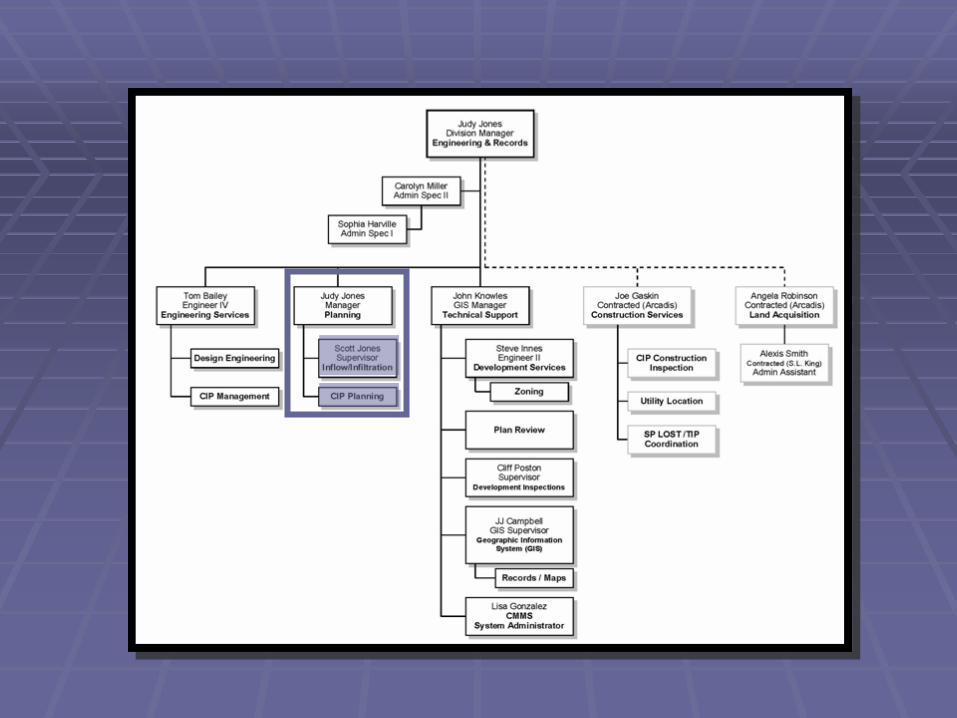
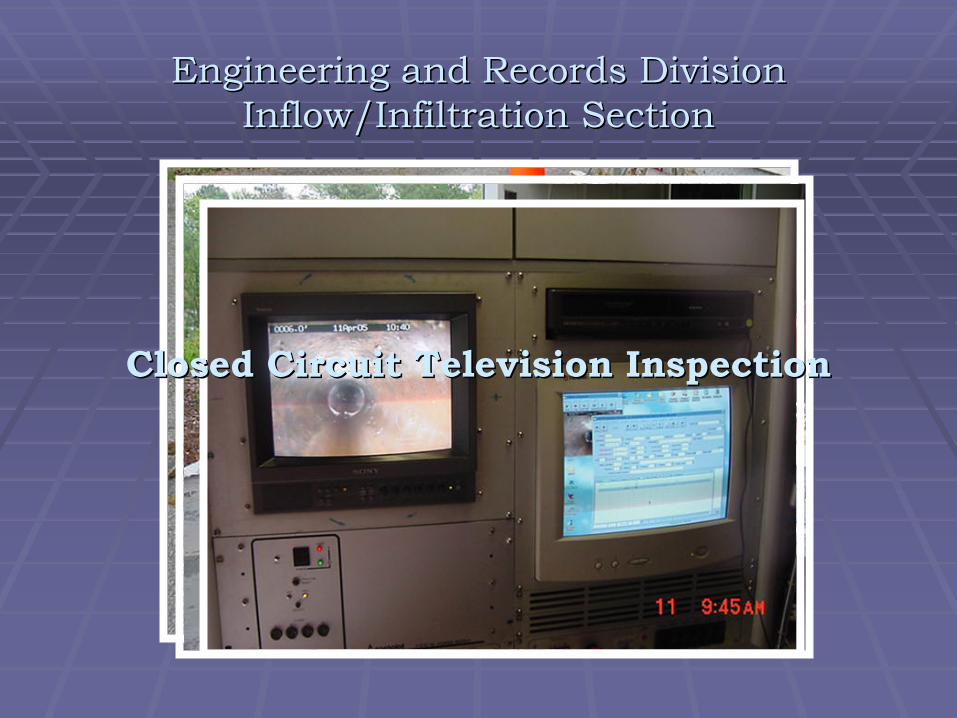
Engineering and Records Division Engineering and Records Division Inflow/Infiltration SectionInflow/Infiltration Section
Closed Circuit Television InspectionClosed Circuit Television Inspection
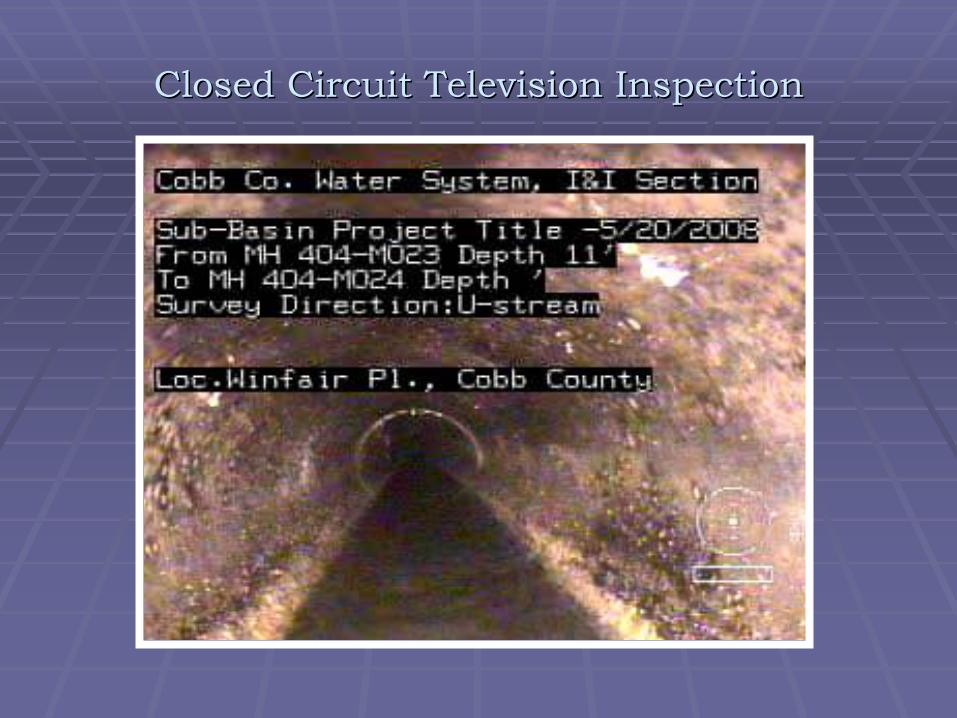
Closed Circuit Television InspectionClosed Circuit Television Inspection
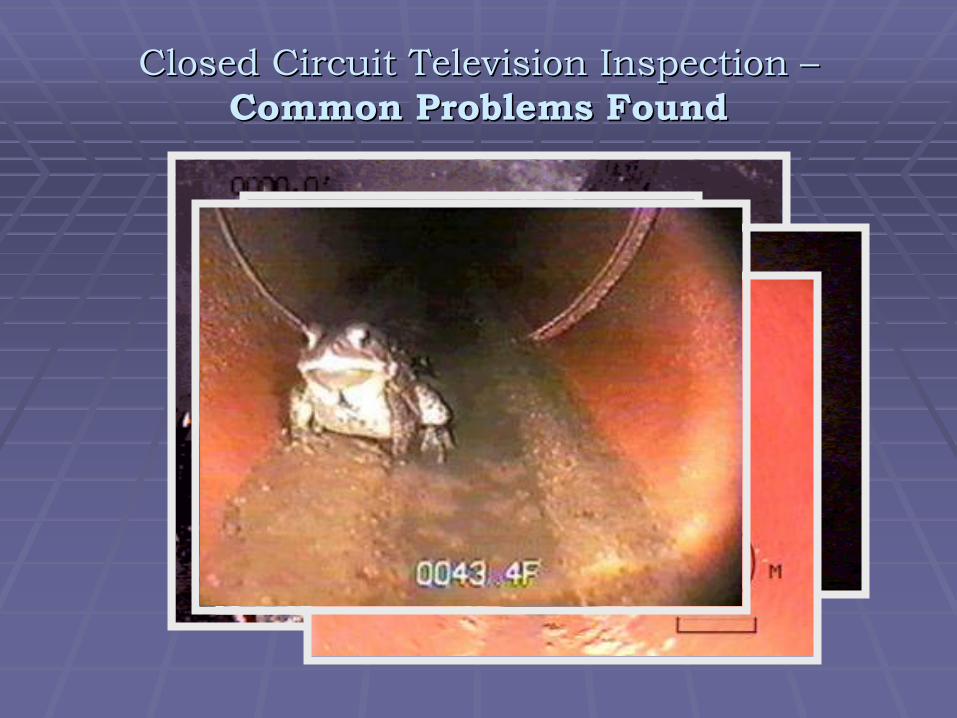
Closed Circuit Television Inspection Closed Circuit Television Inspection –– Common Problems FoundCommon Problems Found

Capital Improvement Program ProjectsCapital Improvement Program Projects

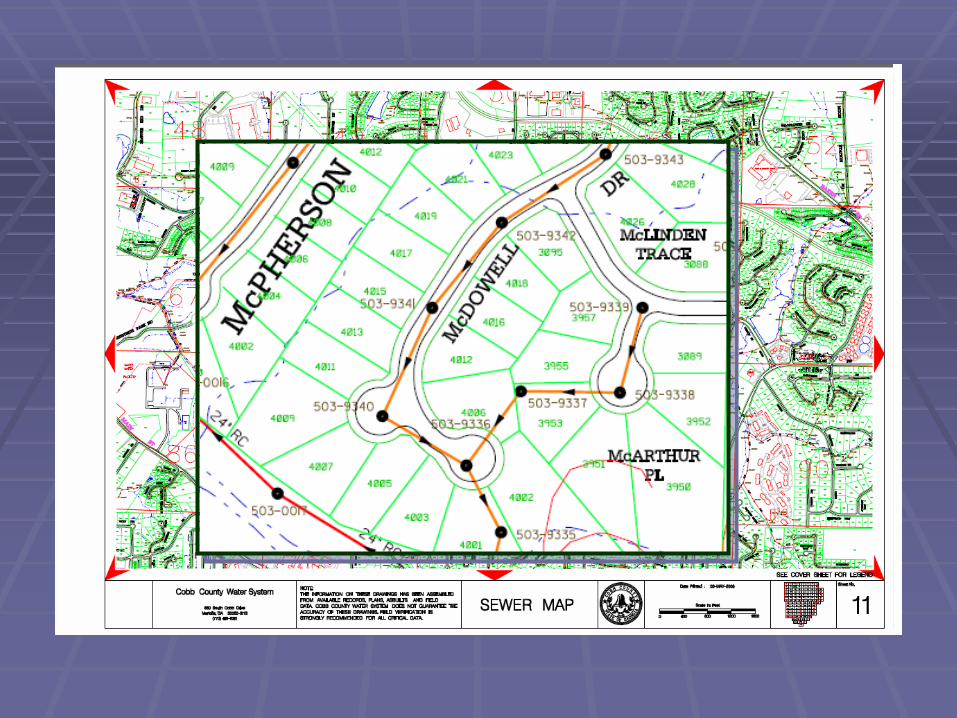
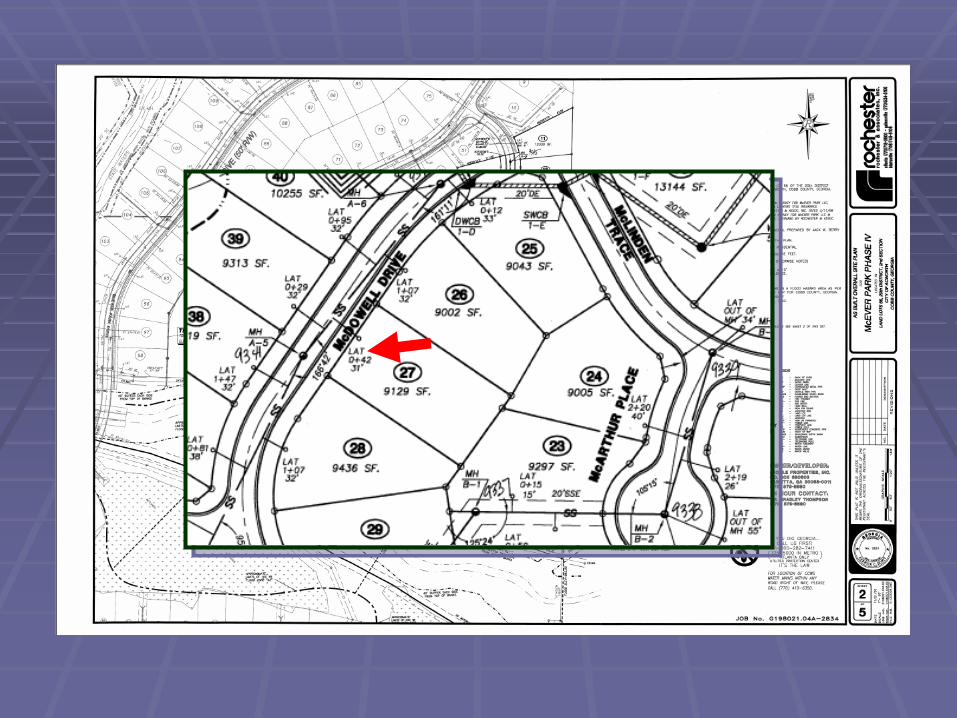
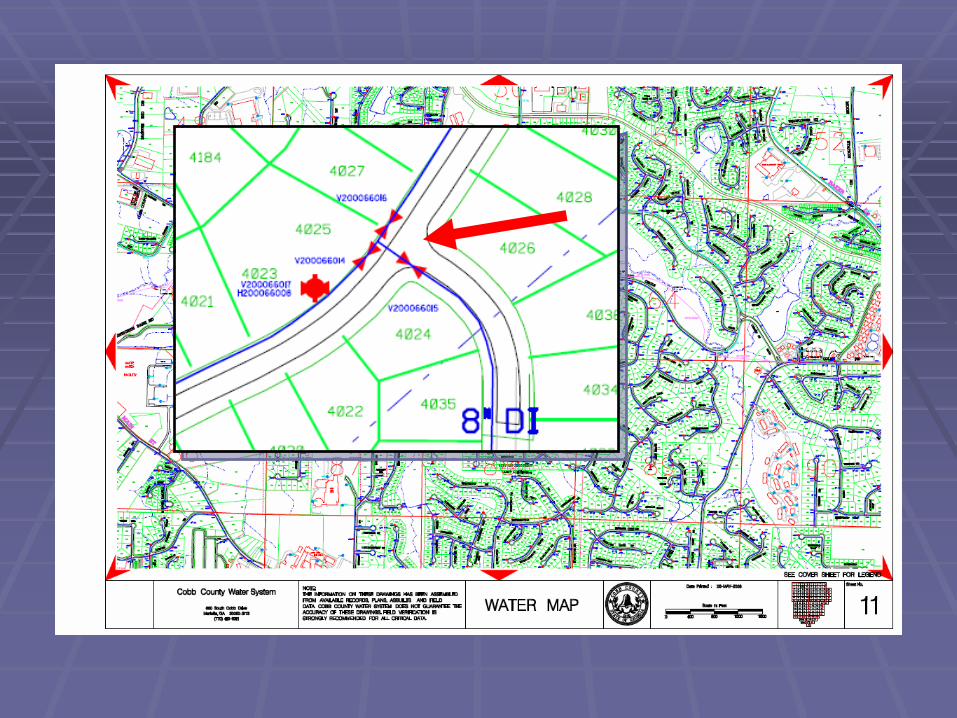
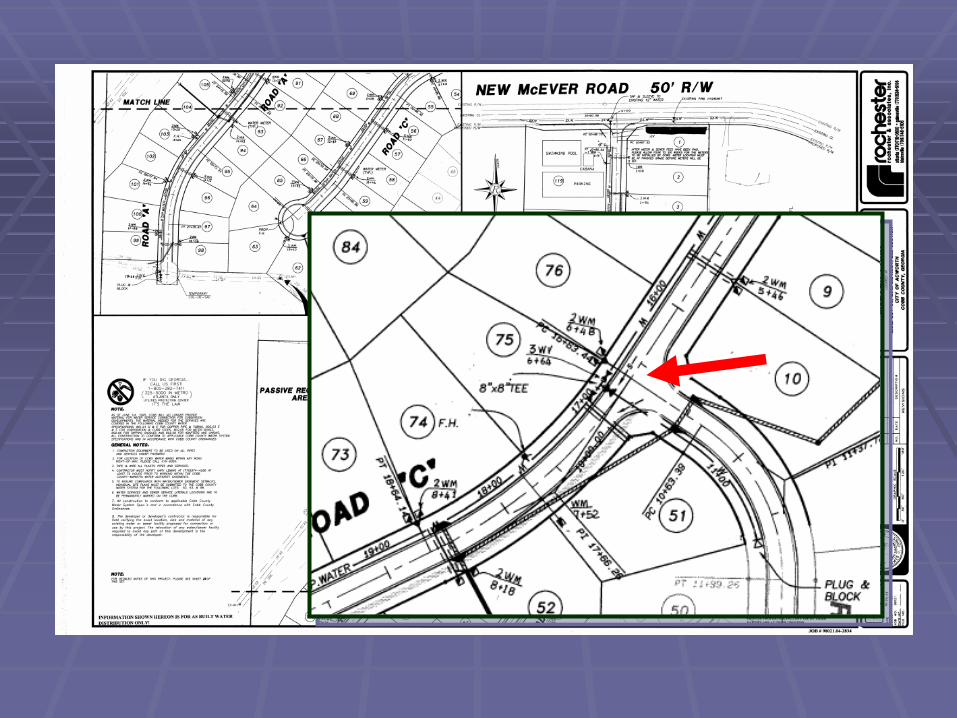
Utility Locate ServicesUtility Locate Services
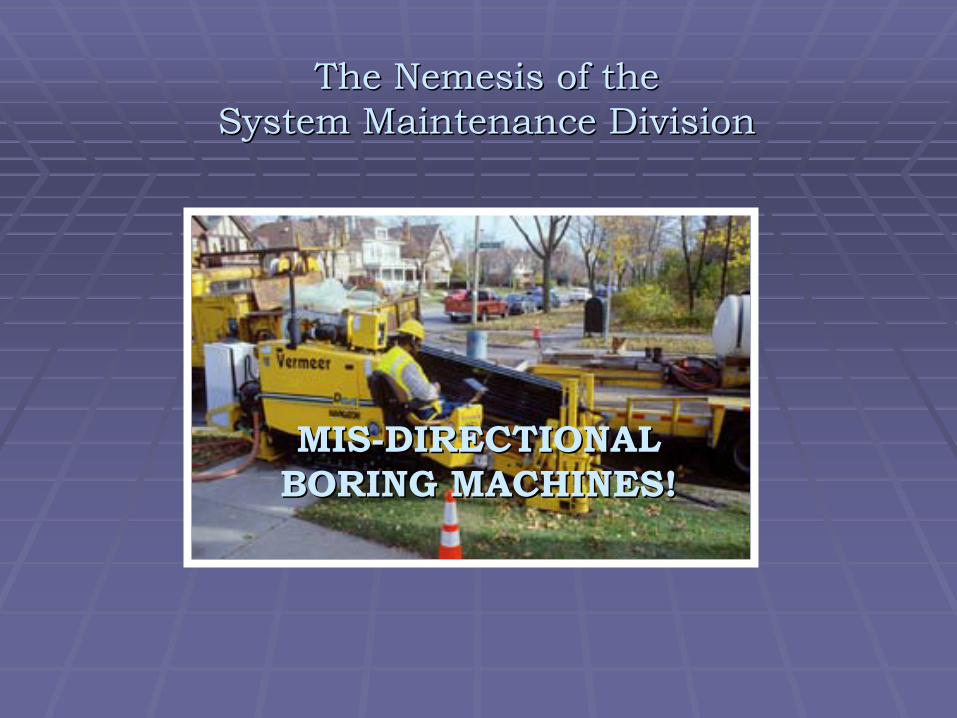
The Nemesis of theThe Nemesis of the System Maintenance DivisionSystem Maintenance Division
MISMIS--DIRECTIONAL DIRECTIONAL BORING MACHINES!BORING MACHINES!
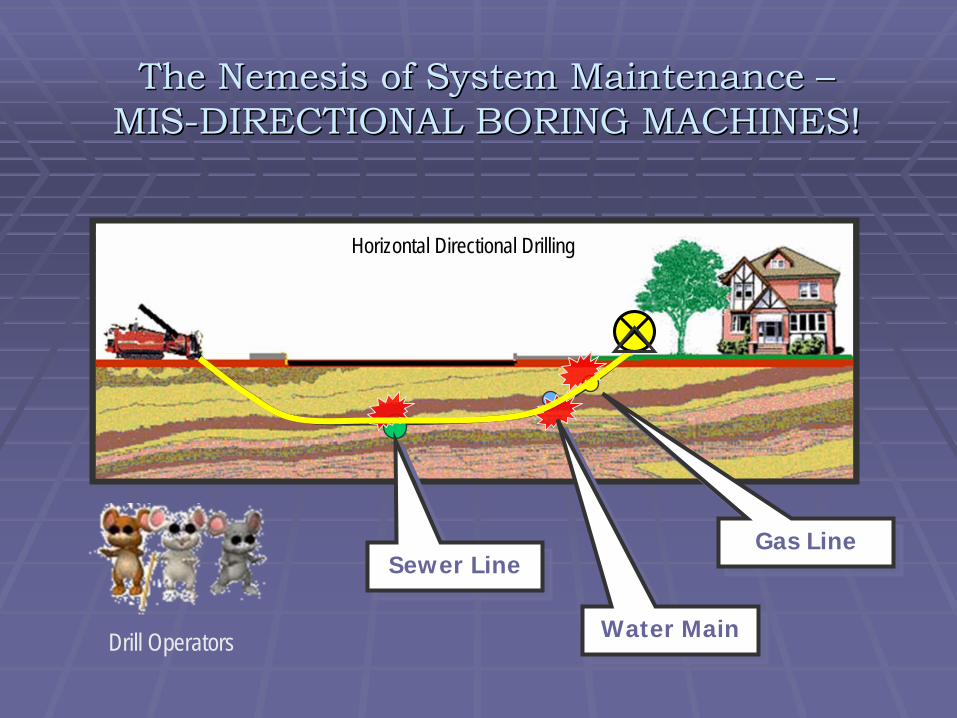
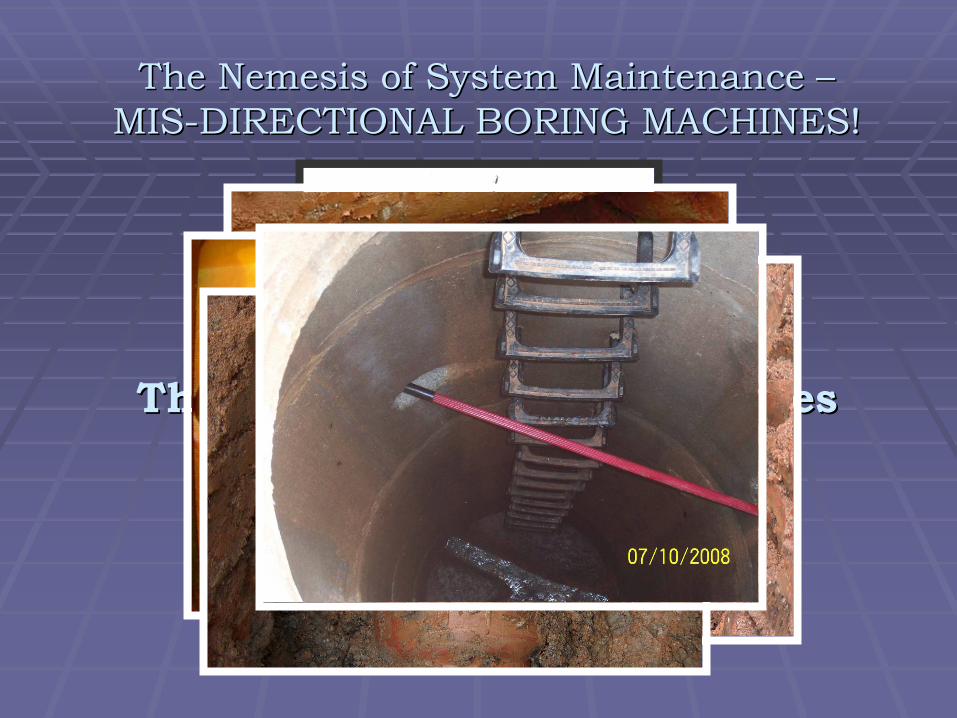
The Nemesis of System Maintenance The Nemesis of System Maintenance –– MISMIS--DIRECTIONAL BORING MACHINES!DIRECTIONAL BORING MACHINES!
Sewer LineSewer Line
Water MainWater Main
Gas LineGas Line
Horizontal Directional DrillingHorizontal Directional Drilling
Drill Operators
The Crusade and the CasualtiesThe Crusade and the Casualties
The Nemesis of System Maintenance The Nemesis of System Maintenance –– MISMIS--DIRECTIONAL BORING MACHINES!DIRECTIONAL BORING MACHINES!
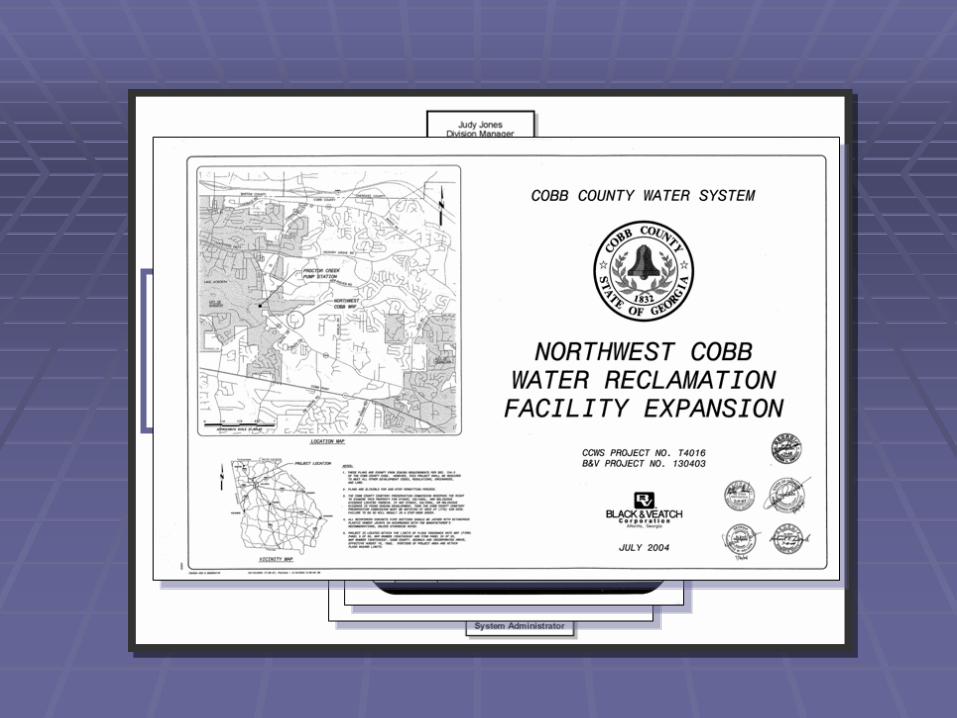
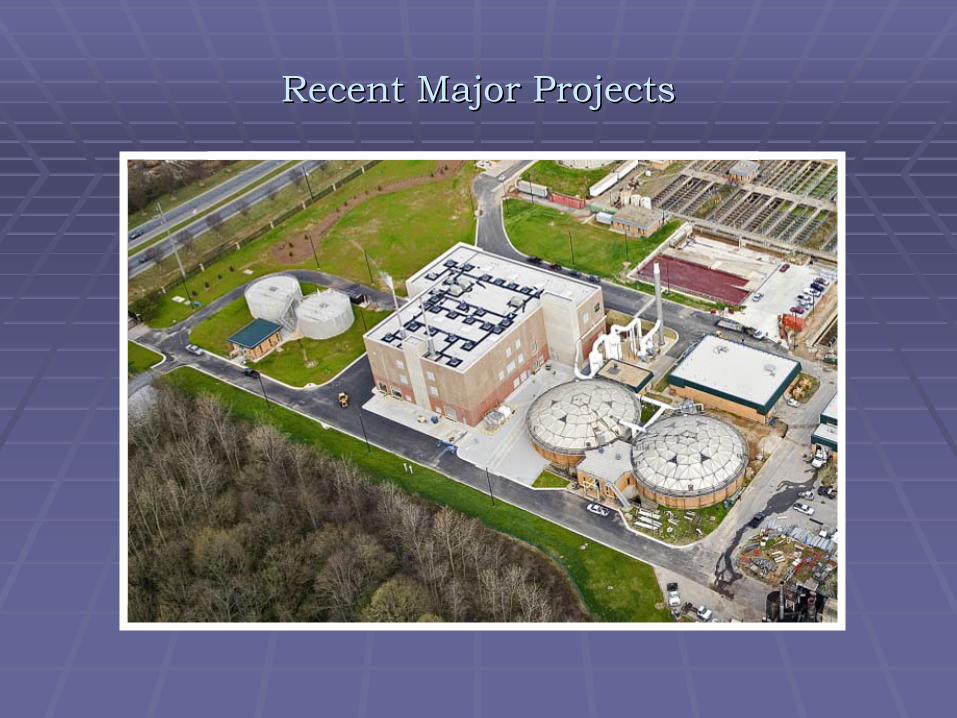
Recent Major ProjectsRecent Major Projects
South Cobb WRF!!South Cobb WRF!!South Cobb WRF!!
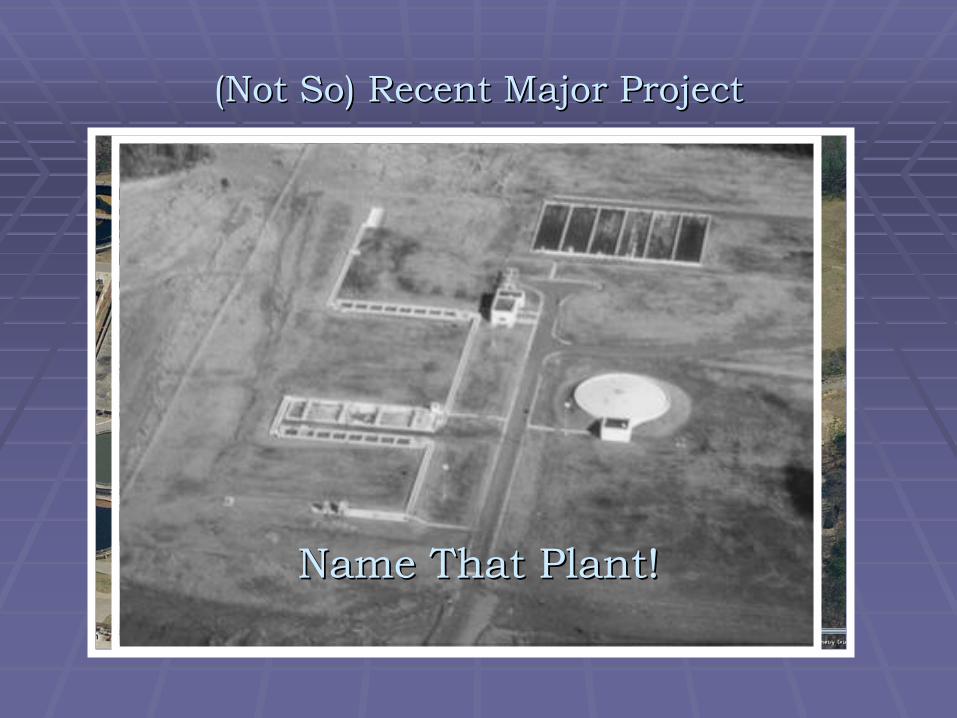
(Not So) Recent Major Project(Not So) Recent Major Project
Name That Plant!Name That Plant!
CobbCobb’’s Water and Sewer Infrastructures Water and Sewer Infrastructure
R.L. Sutton WRF
R.L. Sutton WRF
South Cobb WRF
South Cobb WRF
Northwest Cobb WRF
Northwest Cobb WRF
Sewage Pump
Stations
Sewage Pump
Stations Noonday Creek WRF Noonday
Creek WRF
WaterPump
Stations
WaterPump
Stations
WaterStorage Tanks
WaterStorage Tanks
This is NowThis is Now…………but what was it but what was it
““in the Beginningin the Beginning””??

-
20,000
40,000
60,000
80,000
100,000
120,000
140,000
160,000
180,000
200,000
1900 1910 1920 1930 1940 1950 1960 1970
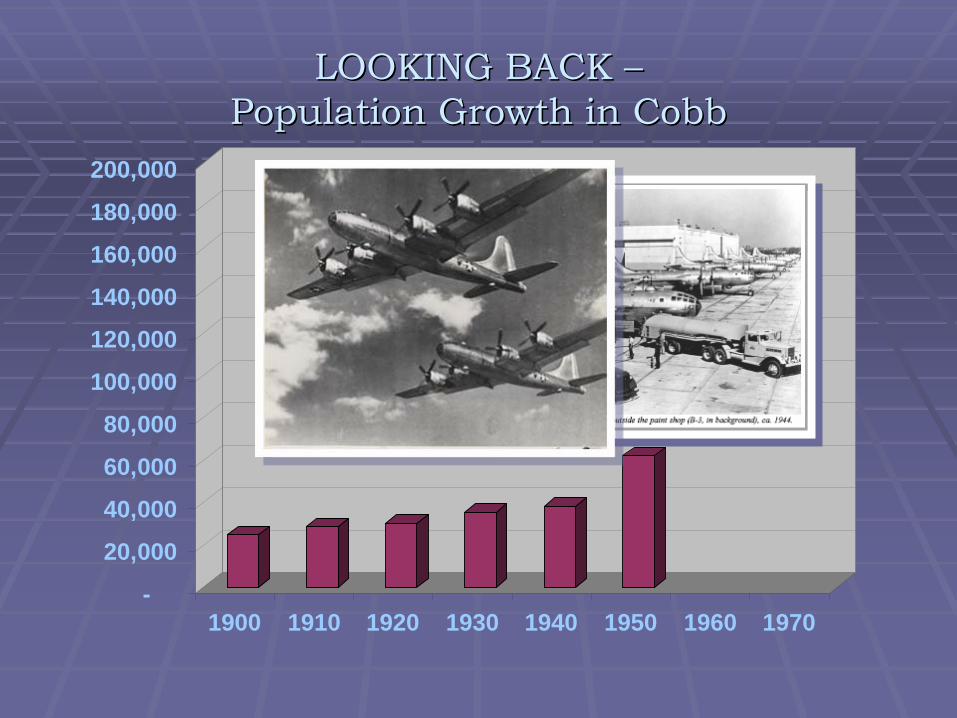
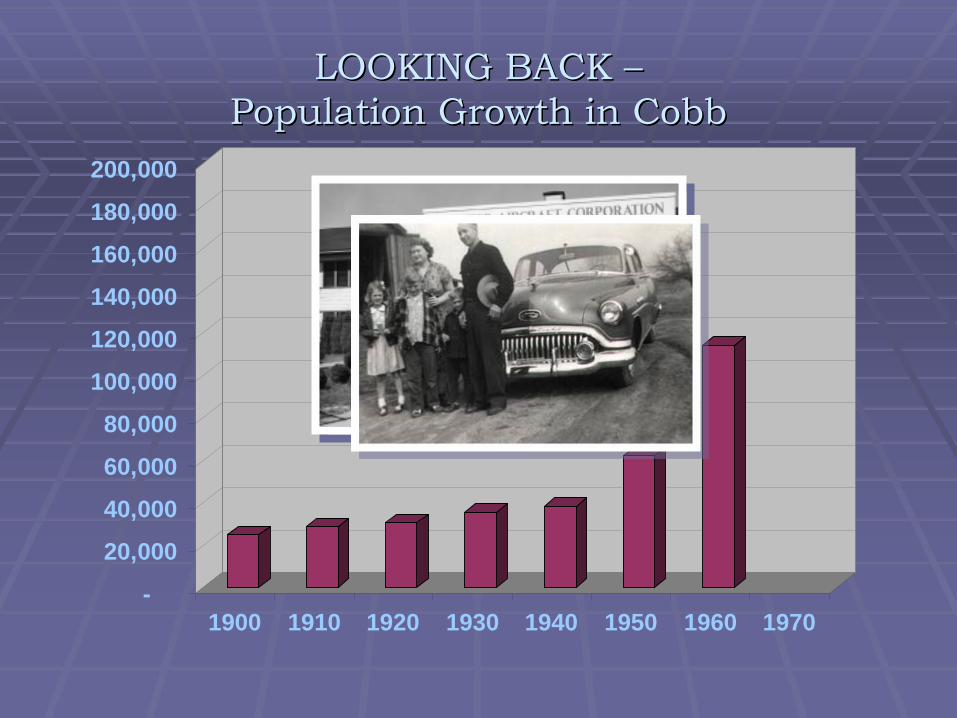
LOOKING BACK LOOKING BACK –– Population Growth in CobbPopulation Growth in Cobb
1900 to 1940Population Increase of 13,600 Persons
1900 to 19401900 to 1940Population Increase Population Increase of 13,600 Personsof 13,600 Persons
-
20,000
40,000
60,000
80,000
100,000
120,000
140,000
160,000
180,000
200,000
1900 1910 1920 1930 1940 1950 1960 1970
LOOKING BACK LOOKING BACK –– Population Growth in CobbPopulation Growth in Cobb
-
20,000
40,000
60,000
80,000
100,000
120,000
140,000
160,000
180,000
200,000
1900 1910 1920 1930 1940 1950 1960 1970
LOOKING BACK LOOKING BACK –– Population Growth in CobbPopulation Growth in Cobb

-
20,000
40,000
60,000
80,000
100,000
120,000
140,000
160,000
180,000
200,000
1900 1910 1920 1930 1940 1950 1960 1970
LOOKING BACK LOOKING BACK –– Population Growth in CobbPopulation Growth in Cobb
1970 Census –Cobb Population
at 196,800!
1970 Census 1970 Census ––Cobb PopulationCobb Population
at 196,800!at 196,800!
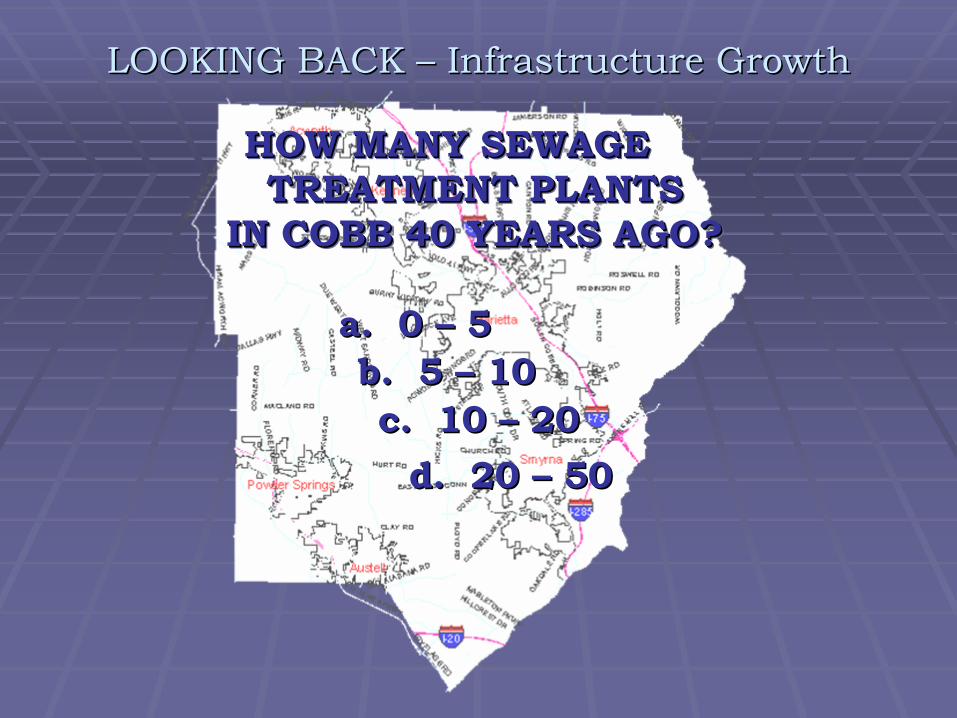
HOW MANY SEWAGE TREATMENT PLANTS
IN COBB 40 YEARS AGO?
HOW MANY SEWAGEHOW MANY SEWAGE TREATMENT PLANTSTREATMENT PLANTS
IN COBB 40 YEARS AGO?IN COBB 40 YEARS AGO?
a. 0 a. 0 ––
55b. 5 b. 5 ––
1010
c. 10 c. 10 ––
2020d. 20 d. 20 ––
5050
LOOKING BACK LOOKING BACK ––
Infrastructure GrowthInfrastructure Growth
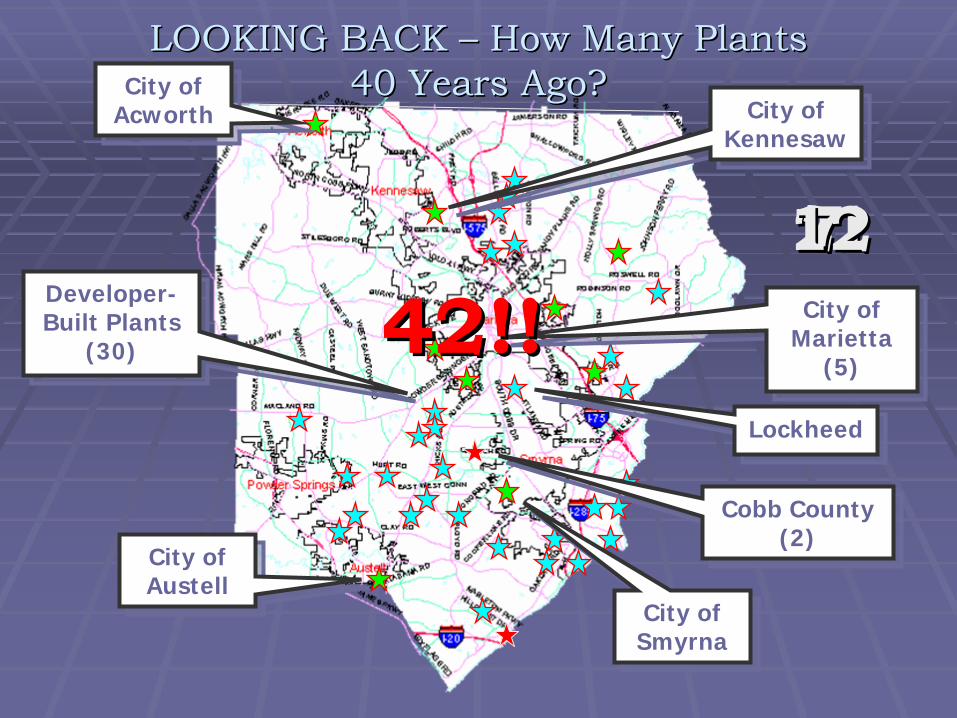
City of Smyrna City of Smyrna
City of Marietta
(5)
City of Marietta
(5)
City of Acworth City of
Acworth City of Kennesaw
City of Kennesaw
City of Austell City of Austell
Developer- Built Plants
(30)
Developer- Built Plants
(30)
2277111142!!42!!
Cobb County(2)
Cobb County(2)
LOOKING BACK LOOKING BACK ––
How Many PlantsHow Many Plants 40 Years Ago?40 Years Ago?
LockheedLockheed
1212
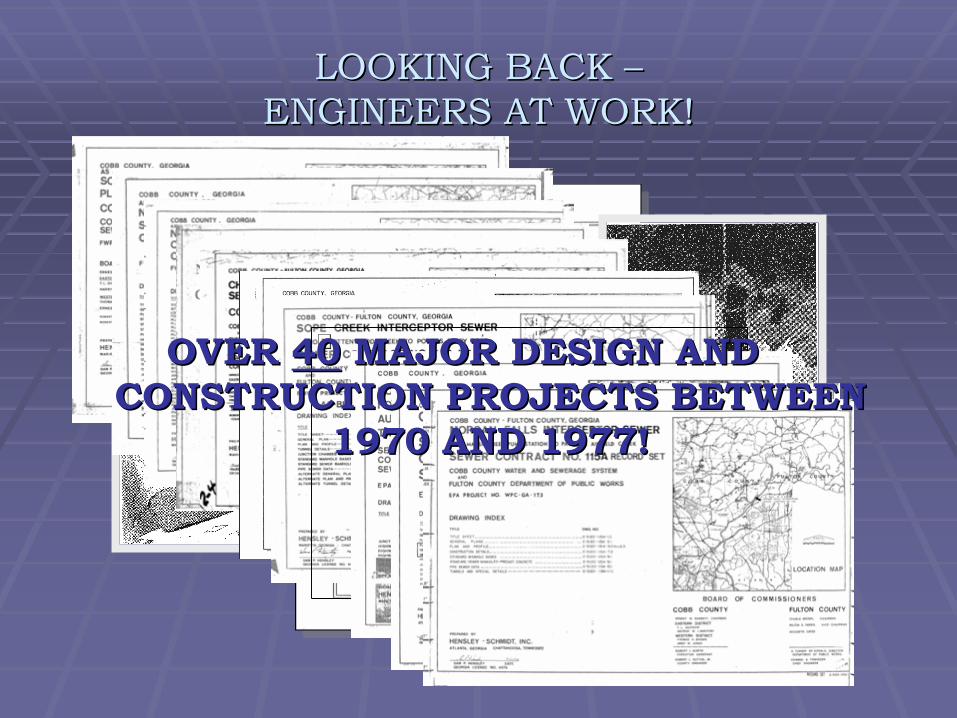
LOOKING BACK LOOKING BACK –– ENGINEERS AT WORK!ENGINEERS AT WORK!
OVER OVER 4040
MAJOR DESIGN AND MAJOR DESIGN AND CONSTRUCTION PROJECTS BETWEEN CONSTRUCTION PROJECTS BETWEEN
1970 AND 1977!1970 AND 1977!
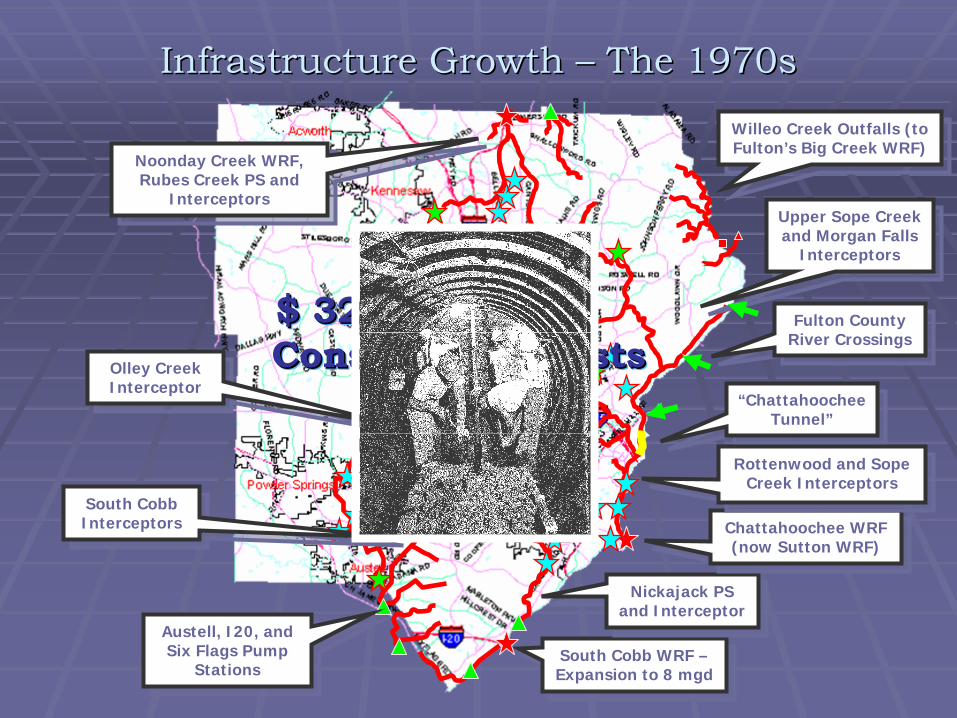
South Cobb WRF – Expansion to 8 mgd
South Cobb WRF – Expansion to 8 mgd
Nickajack PS and Interceptor
Nickajack PS and Interceptor
Chattahoochee WRF (now Sutton WRF)
Chattahoochee WRF (now Sutton WRF)
“Chattahoochee Tunnel”
“Chattahoochee Tunnel”
Rottenwood and Sope Creek Interceptors
Rottenwood and Sope Creek Interceptors
Upper Sope Creek and Morgan Falls
Interceptors
Upper Sope Creek and Morgan Falls
Interceptors
Willeo Creek Outfalls (to Fulton’s Big Creek WRF)
Willeo Creek Outfalls (to Fulton’s Big Creek WRF)
Noonday Creek WRF, Rubes Creek PS and
Interceptors
Noonday Creek WRF, Rubes Creek PS and
Interceptors
Austell, I20, and Six Flags Pump
Stations
Austell, I20, and Six Flags Pump
Stations
Olley Creek Interceptor
Olley Creek Interceptor
South Cobb Interceptors
South Cobb Interceptors
Fulton County River Crossings
Fulton County River Crossings
Infrastructure Growth Infrastructure Growth ––
The 1970sThe 1970s
$ 32,000,000 in Construction Costs
$ 32,000,000 in$ 32,000,000 in Construction CostsConstruction Costs

-
20,000
40,000
60,000
80,000
100,000
120,000
140,000
160,000
180,000
200,000
1900 1910 1920 1930 1940 1950 1960 1970-
50,000100,000150,000200,000250,000300,000350,000400,000450,000500,000550,000600,000650,000700,000750,000
1900 1910 1920 1930 1940 1950 1960 1970 1980 1990 2000 2010
Population Growth in Cobb Population Growth in Cobb –– The Upward Trend ContinuesThe Upward Trend Continues
1970 Population = 196,800
1970 Population = 1970 Population = 196,800196,800

-50,000
100,000150,000200,000250,000300,000350,000400,000450,000500,000550,000600,000650,000700,000750,000
1900 1910 1920 1930 1940 1950 1960 1970 1980 1990 2000 2010
Population Growth in Cobb Population Growth in Cobb –– The Upward Trend ContinuesThe Upward Trend Continues
Population more than doubles to
447,800!
Population more Population more than doubles to than doubles to
447,800!447,800!
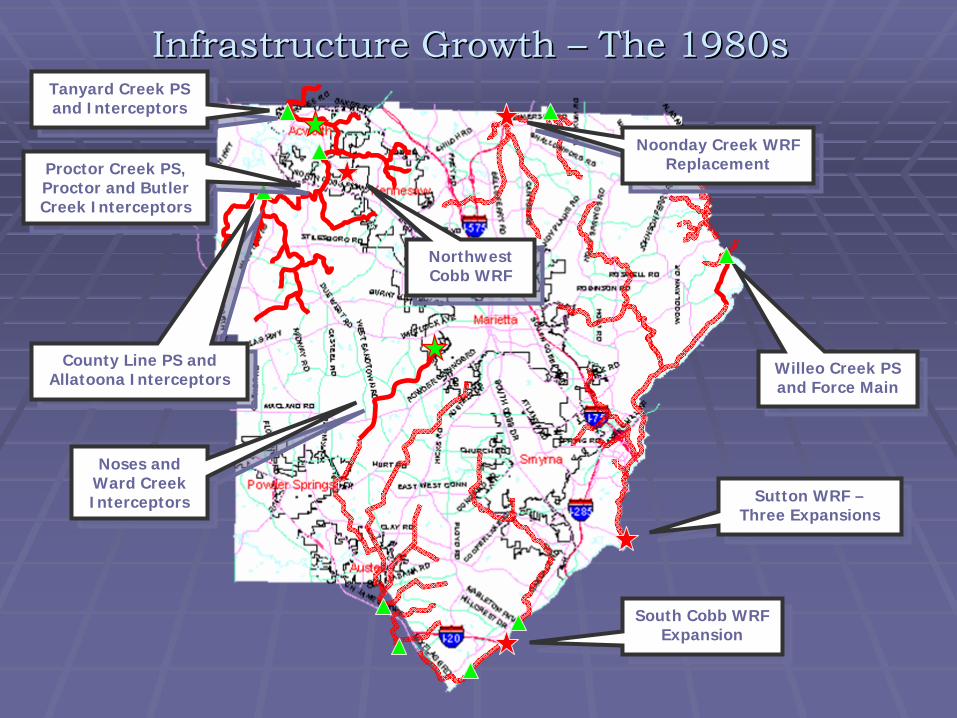
Willeo Creek PS and Force Main
Willeo Creek PS and Force Main
Noses and Ward Creek Interceptors
Noses and Ward Creek Interceptors
Infrastructure Growth Infrastructure Growth ––
The 1980s The 1980s
County Line PS and Allatoona Interceptors
County Line PS and Allatoona Interceptors
Proctor Creek PS, Proctor and Butler Creek Interceptors
Proctor Creek PS, Proctor and Butler Creek Interceptors
Northwest Cobb WRF
Northwest Cobb WRF
Tanyard Creek PS and Interceptors
Tanyard Creek PS and Interceptors
South Cobb WRF Expansion
South Cobb WRF Expansion
Sutton WRF – Three Expansions
Sutton WRF – Three Expansions
Noonday Creek WRF Replacement
Noonday Creek WRF Replacement
-50,000
100,000150,000200,000250,000300,000350,000400,000450,000500,000550,000600,000650,000700,000750,000800,000850,000900,000
1900 1910 1920 1930 1940 1950 1960 1970 1980 1990 2000 2010 2020 2030
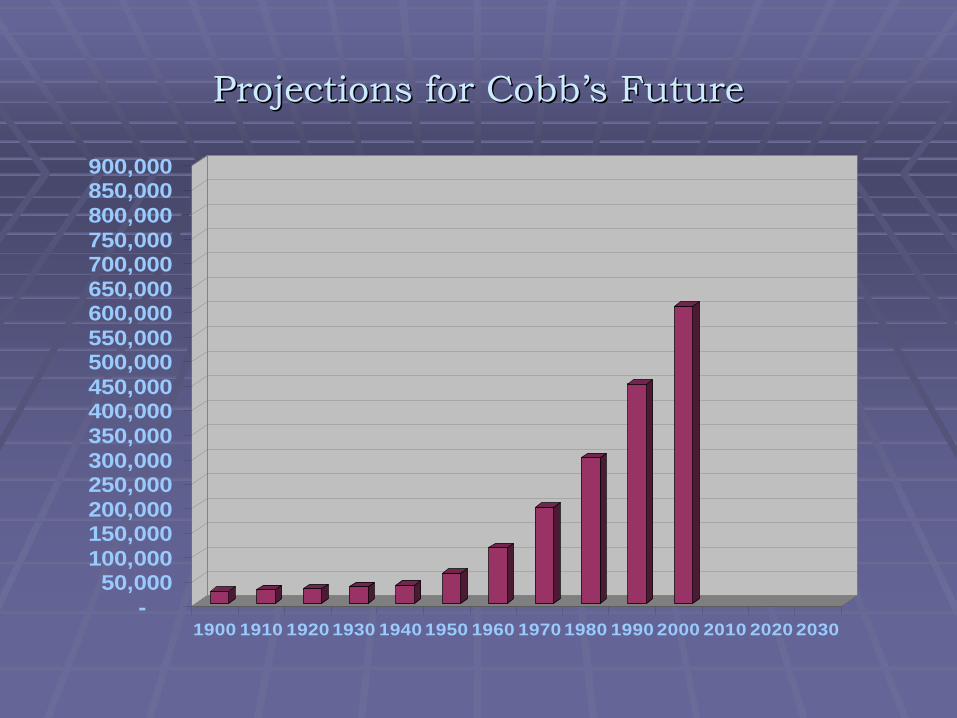
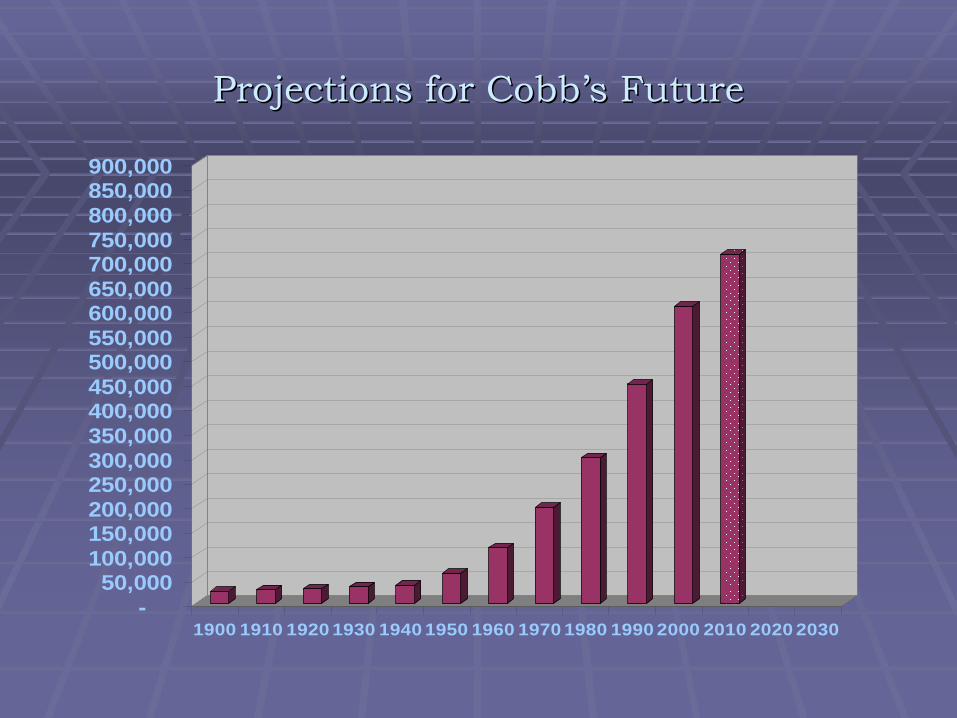
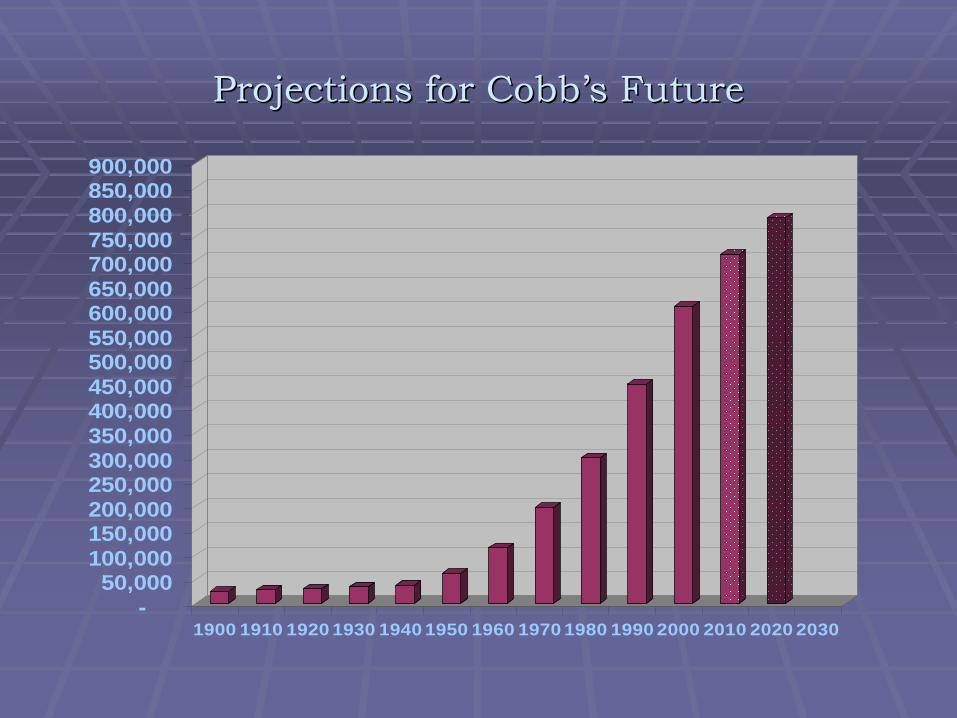
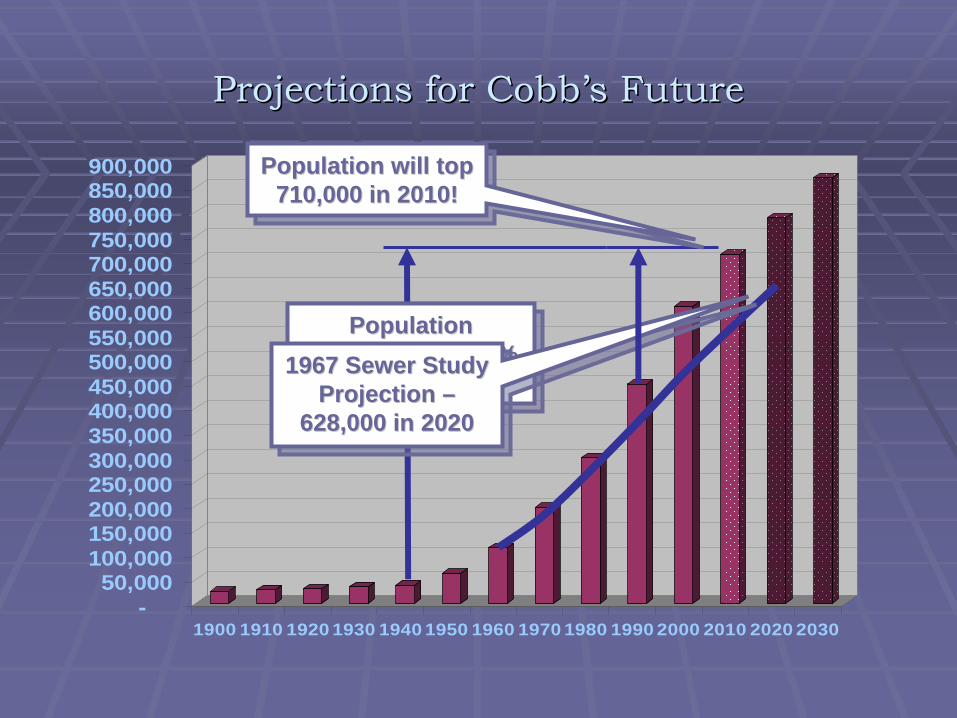
Projections for CobbProjections for Cobb’’s Futures Future
-50,000
100,000150,000200,000250,000300,000350,000400,000450,000500,000550,000600,000650,000700,000750,000800,000850,000900,000
1900 1910 1920 1930 1940 1950 1960 1970 1980 1990 2000 2010 2020 2030
Projections for CobbProjections for Cobb’’s Futures Future
-50,000
100,000150,000200,000250,000300,000350,000400,000450,000500,000550,000600,000650,000700,000750,000800,000850,000900,000
1900 1910 1920 1930 1940 1950 1960 1970 1980 1990 2000 2010 2020 2030
Projections for CobbProjections for Cobb’’s Futures Future
Projections for CobbProjections for Cobb’’s Futures Future
-50,000
100,000150,000200,000250,000300,000350,000400,000450,000500,000550,000600,000650,000700,000750,000800,000850,000900,000
1900 1910 1920 1930 1940 1950 1960 1970 1980 1990 2000 2010 2020 2030
Population will top 710,000 in 2010!
Population will top Population will top 710,000 in 2010!710,000 in 2010!
Population Increase of 1,860%
since 1940!
Population Population Increase of 1,860% Increase of 1,860%
since 1940!since 1940!1967 Sewer Study Projection –
628,000 in 2020
1967 Sewer Study 1967 Sewer Study Projection Projection ––
628,000 in 2020628,000 in 2020
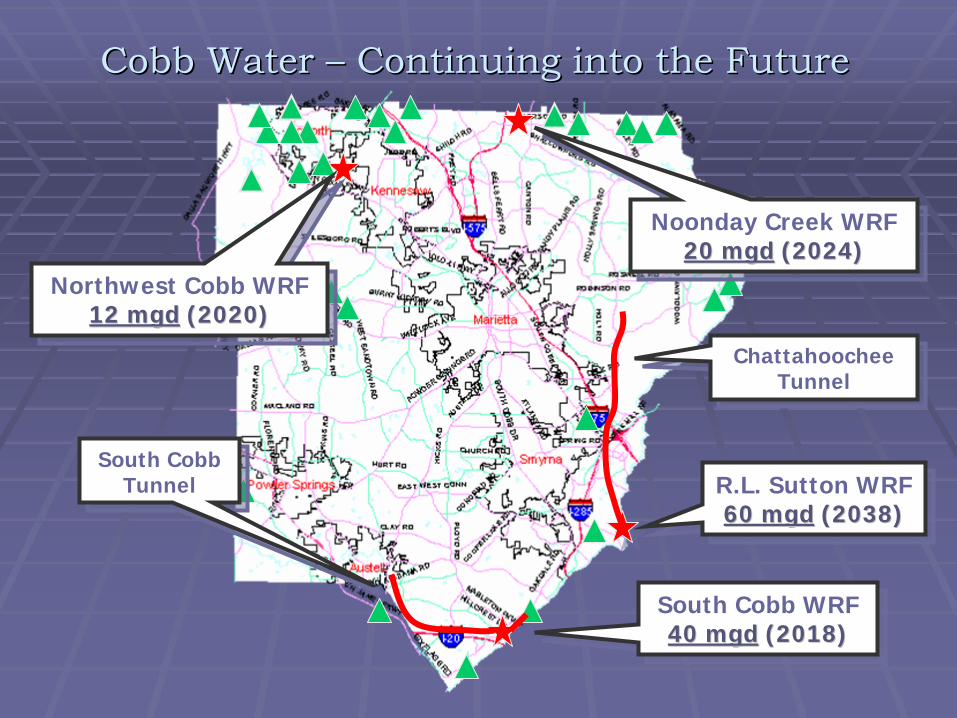
Cobb Water Cobb Water ––
Continuing into the FutureContinuing into the Future
R.L. Sutton WRF60 mgd (2038)
R.L. Sutton WRF60 60 mgdmgd (2038)(2038)
South Cobb WRF40 mgd (2018)
South Cobb WRF40 40 mgdmgd (2018)(2018)
Noonday Creek WRF20 mgd (2024)
Noonday Creek WRF20 20 mgdmgd (2024)(2024)
Northwest Cobb WRF12 mgd (2020)
Northwest Cobb WRF12 12 mgdmgd (2020)(2020)
South Cobb Tunnel
South Cobb Tunnel
Chattahoochee Tunnel
Chattahoochee Tunnel
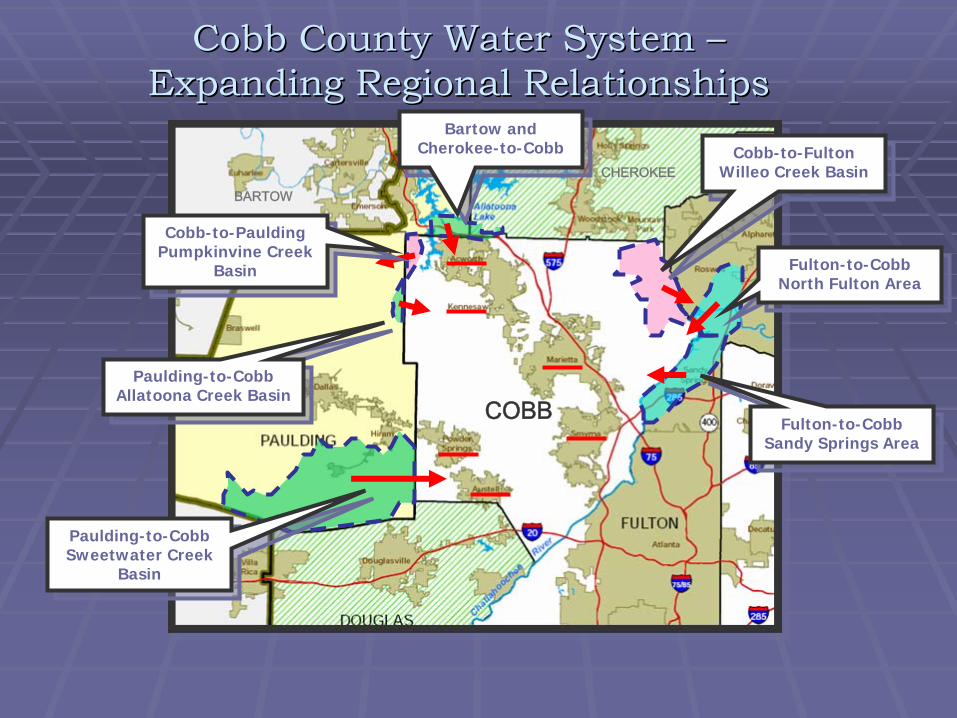
Cobb County Water System Cobb County Water System –– Expanding Regional RelationshipsExpanding Regional Relationships
BARTOW
CHEROKEE
COBB
Cobb-to-FultonWilleo Creek Basin
Cobb-to-FultonWilleo Creek Basin
Fulton-to-CobbSandy Springs Area
Fulton-to-CobbSandy Springs Area
Bartow and Cherokee-to-Cobb
Bartow and Cherokee-to-Cobb
Cobb-to-PauldingPumpkinvine Creek
Basin
Cobb-to-PauldingPumpkinvine Creek
Basin
Paulding-to-CobbAllatoona Creek Basin
Paulding-to-CobbAllatoona Creek Basin
Paulding-to-CobbSweetwater Creek
Basin
Paulding-to-CobbSweetwater Creek
Basin
Fulton-to-CobbNorth Fulton Area
Fulton-to-CobbNorth Fulton Area
Cobb County Water SystemCobb County Water System Engineering and Records DivisionEngineering and Records Division