Embed Size (px)
Citation preview
51
Appendices
APPENDIX 1.
COASTAL CLASSIFICATION AND MAPPING SCHEME
APPENDIX 2.
TABLE OF DATA SETS USED AND HABITAT CATEGORIES MAPPED
APPENDIX 3.
BIOGENIC HABITAT FORMING TAXA
APPENDIX 4.
AREA (KM2) OF HABITATS IN EACH BIOREGION
APPENDIX 5.
PERCENTAGE AREA OF HABITATS IN EACH BIOREGION
APPENDIX 6.
NUMBER OF HABITATS IN EACH BIOREGION
APPENDIX 7.
MAPS (1:400,000 SCALE) OF MARINE MANAGEMENT TOOLS
APPENDIX 8.
MAPS (1:400,000 SCALE) OF COASTAL MARINE HABITATS

APPENDIX 1. COASTAL CLASSIFICATION AND MAPPING SCHEME (MHWS -200 METRE DEPTH)
(MINISTRY OF FISHERIES AND DEPARTMENT OF CONSERVATION 2008)
52
53
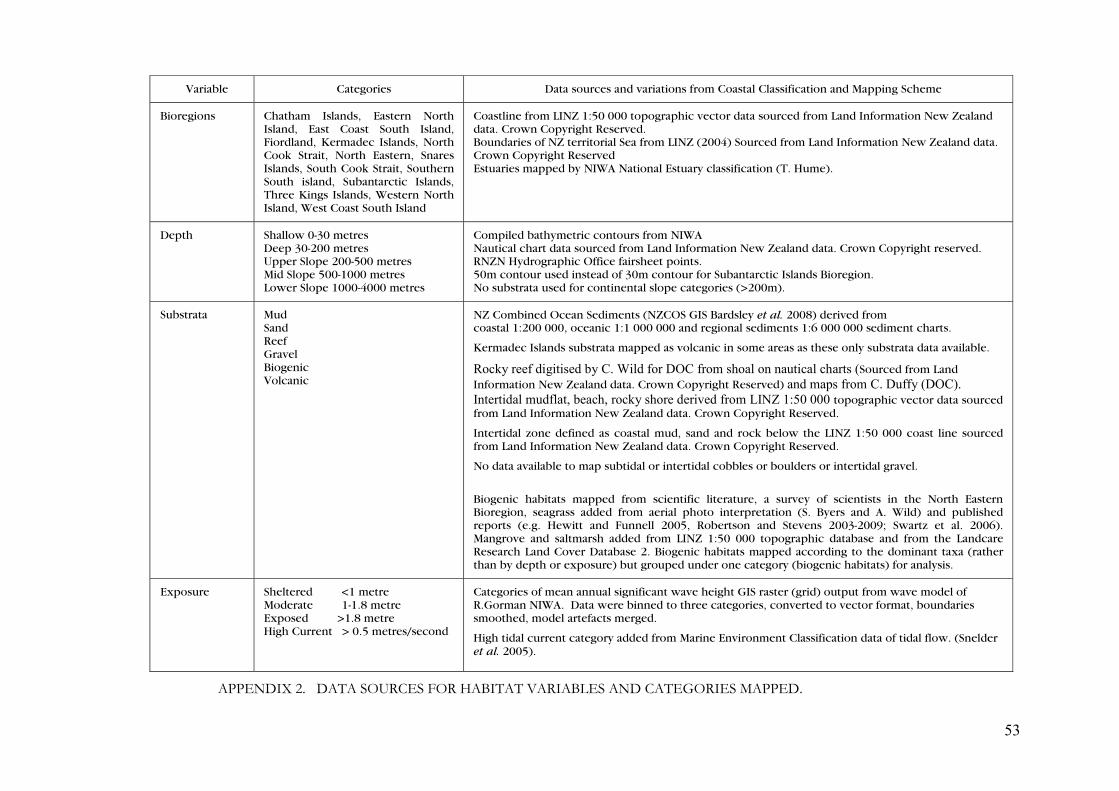
Variable Categories Data sources and variations from Coastal Classification and Mapping Scheme
Bioregions
Chatham Islands, Eastern North Island, East Coast South Island, Fiordland, Kermadec Islands, North Cook Strait, North Eastern, Snares Islands, South Cook Strait, Southern South island, Subantarctic Islands, Three Kings Islands, Western North Island, West Coast South Island
Coastline from LINZ 1:50 000 topographic vector data sourced from Land Information New Zealand data. Crown Copyright Reserved. Boundaries of NZ territorial Sea from LINZ (2004) Sourced from Land Information New Zealand data. Crown Copyright Reserved Estuaries mapped by NIWA National Estuary classification (T. Hume).
Depth Shallow 0-30 metres Deep 30-200 metres Upper Slope 200-500 metres Mid Slope 500-1000 metres Lower Slope 1000-4000 metres
Compiled bathymetric contours from NIWA Nautical chart data sourced from Land Information New Zealand data. Crown Copyright reserved. RNZN Hydrographic Office fairsheet points. 50m contour used instead of 30m contour for Subantarctic Islands Bioregion. No substrata used for continental slope categories (>200m).
Substrata Mud Sand Reef Gravel Biogenic Volcanic
NZ Combined Ocean Sediments (NZCOS GIS Bardsley et al. 2008) derived from coastal 1:200 000, oceanic 1:1 000 000 and regional sediments 1:6 000 000 sediment charts.
Kermadec Islands substrata mapped as volcanic in some areas as these only substrata data available.
Rocky reef digitised by C. Wild for DOC from shoal on nautical charts (Sourced from Land Information New Zealand data. Crown Copyright Reserved) and maps from C. Duffy (DOC). Intertidal mudflat, beach, rocky shore derived from LINZ 1:50 000 topographic vector data sourced from Land Information New Zealand data. Crown Copyright Reserved.
Intertidal zone defined as coastal mud, sand and rock below the LINZ 1:50 000 coast line sourced from Land Information New Zealand data. Crown Copyright Reserved.
No data available to map subtidal or intertidal cobbles or boulders or intertidal gravel.
Biogenic habitats mapped from scientific literature, a survey of scientists in the North Eastern Bioregion, seagrass added from aerial photo interpretation (S. Byers and A. Wild) and published reports (e.g. Hewitt and Funnell 2005, Robertson and Stevens 2003-2009; Swartz et al. 2006). Mangrove and saltmarsh added from LINZ 1:50 000 topographic database and from the Landcare Research Land Cover Database 2. Biogenic habitats mapped according to the dominant taxa (rather than by depth or exposure) but grouped under one category (biogenic habitats) for analysis.
Exposure Sheltered <1 metre Moderate 1-1.8 metre Exposed >1.8 metre High Current > 0.5 metres/second
Categories of mean annual significant wave height GIS raster (grid) output from wave model of R.Gorman NIWA. Data were binned to three categories, converted to vector format, boundaries smoothed, model artefacts merged.
High tidal current category added from Marine Environment Classification data of tidal flow. (Snelder et al. 2005).
APPENDIX 2. DATA SOURCES FOR HABITAT VARIABLES AND CATEGORIES MAPPED.

APPENDIX 3. TAXA THAT MAY BE RESPONSIBLE (IN WHOLE OR IN PART) FOR THE FORMATION OF AREAS OF BIOGENIC HABITAT WITHIN THE NEW ZEALAND TERRITORIAL SEA: Phylum Porifera: Class Calcarea Class Demospongiae Class Hexactinella Phylum Bryozoa Phylum Cnidaria: Class Anthozoa: Order Gorgonacea: Family Primnoidae Order Alyconacea: Family Alcyoniidae Order Antipatharia: Family Antipathidae Order Scleractinia Class Hydrozoa: Order Anthoathecata: Family Stylasteridae Order Leptothecata: Family Sertularidae Family Haleciidae Family Plumularidae Phylum Mollusca: Class Bivalvia Class Gastropda: Phylum Annelida Class Polychaeta: Order Spionida: Family Chaetopteridae Order Canalipalpata: Family Sabellidae Family Sabellaridae Family Serpulidae Order Scolecida: Family Maldanidae Order Terebellida: Family Cirratulidae Phylum Chordata
Subphylum Urochordata Class Ascidiacea
Plantae Phylum Heterokontophyta Class Phaeophyceae Order Laminariales Order Fucales Division Rhodophyceae Class Florideophyceae Order Corallinales: Family Corallinaceae Family Hapalidiaceae Family Sporolithaceae Division Magnoliophyta Class Equisetopsida Order Alismatales Family Zosteraceae Order Lamiales Family Acanthaceae Genus Avicennia Order Caryophyllales Family Amaranthaceae Genus Sarcocornia Order Caryophyllales Family Chenopodiaceae Genus Suaeda Family Caryophyllaceae Genus Spergularia Order Alismatales Family Juncaginaceae Genus Triglochin Order Ericales Family Samolaceae Genus Samolus Order Poales Family Cyperaceae Genus Schoenoplectus Family Juncaceae Genus Juncus Family Poaceae Genus Puccinellia Order Caryophyllales Family Chenopodiaceae Genus Salicornia
54

APPENDIX 4.1 AREA (KM 2) OF HABITATS IN MARINE PROTECTED AREAS IN EACH COASTAL MARINE BIOREGION.
Chatham Islandskm2
Typ
e I Marin
e Reserve
Typ
e II MP
A N
o-take
Marin
e Park
Typ
e II MP
A C
able o
r P
ipelin
e Zo
ne
Typ
e II MP
A N
o traw
l, d
anish
seine, d
redge o
r setn
et
Typ
e II MP
A N
o traw
l, d
anish
seine, d
redge
To
tal Typ
e II MP
A
To
tal no
take
To
tal MP
A
To
tal hab
itat in b
ioregio
n
Deep Mud 4,811.0Deep Gravel 3,844.4Upper Slope 1,325.8Moderate Shallow Gravel 630.5Exposed Shallow Gravel 422.8Exposed Shallow Reef 416.2Deep Reef 258.8Moderate Shallow Reef 191.2Mid Slope 153.6Estuarine Gravel 117.7Mudflat 72.0Shallow Mud 32.3Estuarine 16.8Exposed Rocky Shore 10.3Moderate Rocky Shore 5.9Estuarine Beach 3.4Moderate Beach 3.4Exposed Beach 2.0Estuarine Rocky Shore 0.5
DRAFT ONLY 52

APPENDIX 4.1 AREA (KM 2) OF HABITATS IN MARINE PROTECTED AREAS IN EACH COASTAL MARINE BIOREGION.
East Coast South Islandkm2
Typ
e I Marin
e Reserve
No
-take Marin
e Park
Cab
le or P
ipelin
e Zo
ne
No
trawl, d
anish
seine,
dred
ge or setn
et
No
trawl, d
anish
seine,
dred
ge
To
tal Typ
e II MP
A
To
tal no
take
To
tal MP
A
To
tal hab
itat in b
ioregio
n
Deep Sand 2,121.5Deep Mud 2,017.8Moderate Shallow Sand 1,231.0Shallow Mud 723.3High Current Deep Sand 699.6Exposed Shallow Sand 0.33 0.33 0.33 646.1Moderate Shallow Gravel 527.0Deep Gravel 511.7Mid Slope 456.5Sheltered Shallow Sand 448.0Upper Slope 331.2Lower Slope 326.9High Current Deep Mud 309.4Estuarine 188.6Moderate Beach 180.7Moderate Shallow Reef 121.1High Current Shallow Sand 88.9Estuarine Mud 73.1Exposed Shallow Gravel 61.3High Current Deep Gravel 42.7Exposed Shallow Reef 1.14 1.14 1.14 31.9Sheltered Shallow Reef 26.6Estuarine Sand 0.61 0.61 0.61 22.8Mudflat 0.01 0.006 0.01 21.6Deep Reef 20.2Sheltered Shallow Gravel 13.4Biogenic 12.8Estuarine Reef 0.07 0.07 0.07 12.5High Current Shallow Reef 7.5Moderate Rocky Shore 3.6High Current Shallow Mud 2.3Sheltered Beach 1.7Exposed Beach 1.4Estuarine Beach 1.3High Current Deep Reef 0.8Estuarine Rocky Shore 0.4Exposed Rocky Shore 0.2High Current Rocky Shore 0.02
DRAFT ONLY 53

APPENDIX 4.1 AREA (KM 2) OF HABITATS IN MARINE PROTECTED AREAS IN EACH COASTAL MARINE BIOREGION.
Eastern North Islandkm2
Typ
e I Marin
e Reserve
No
-take Marin
e Park
Cab
le or P
ipelin
e Zo
ne
No
trawl, d
anish
seine,
dred
ge or setn
et
No
trawl, d
anish
seine,
dred
ge
To
tal Typ
e II MP
A
To
tal no
take
To
tal MP
A
To
tal hab
itat in b
ioregio
n
Deep Mud 1.30 1.30 1.30 7,025.7Deep Sand 5.21 5.21 5.21 951.7Moderate Shallow Sand 1.30 1.30 1.30 834.5Shallow Mud 0.78 0.78 0.78 599.9Upper Slope 587.7Moderate Shallow Reef 2.39 2.39 2.39 284.8Moderate Shallow Gravel 219.0High Current Deep Mud 217.8Mid Slope 175.0Exposed Shallow Reef 9.30 9.30 9.30 174.1Deep Gravel 172.0Deep Reef 2.91 2.91 2.91 110.3Sheltered Shallow Sand 103.2Exposed Shallow Sand 2.32 2.32 2.32 50.8Lower Slope 30.7High Current Shallow Reef 22.3Estuarine 0.001 0.001 0.001 16.6Moderate Rocky Shore 0.37 0.37 0.37 12.4Exposed Rocky Shore 0.74 0.74 0.74 8.8High Current Shallow Mud 8.6Moderate Beach 0.22 0.22 0.22 7.5Sheltered Shallow Reef 6.5Sheltered Shallow Gravel 3.4High Current Shallow Sand 2.4High Current Deep Reef 1.9Estuarine Beach 0.002 0.002 0.002 1.7Exposed Beach 0.12 0.12 0.12 1.6Mudflat 1.3Sheltered Shingle 1.1High Current Deep Sand 0.8Sheltered Beach 0.8Sheltered Rocky Shore 0.6Biogenic 0.6High Current Rocky Shore 0.3Estuarine Mud 0.3Estuarine Sand 0.1High Current Beach 0.1Estuarine Reef 0.1
DRAFT ONLY 54

APPENDIX 4.1 AREA (KM 2) OF HABITATS IN MARINE PROTECTED AREAS IN EACH COASTAL MARINE BIOREGION.
Fiordlandkm2
Typ
e I Marin
e Reserve
No
-take Marin
e Park
Cab
le or P
ipelin
e Zo
ne
No
trawl, d
anish
seine,
dred
ge or setn
et
No
trawl, d
anish
seine,
dred
ge
To
tal Typ
e II MP
A
To
tal no
take
To
tal MP
A
To
tal hab
itat in b
ioregio
n
Lower Slope 3,449.9Deep Sand 1,724.4Upper Slope 1,639.9Mid Slope 1,392.8Deep Mud 0.10 0.10 0.10 462.3Estuarine Mud 55.07 275.30 275.30 55.07 330.36 458.4Exposed Shallow Reef 0.04 0.04 0.04 279.3High Current Deep Sand 200.6Estuarine Reef 16.98 58.69 58.69 16.98 75.66 171.7Estuarine Sand 29.78 41.18 41.18 29.78 70.95 151.6Deep Reef 0.005 0.00 0.005 126.2Exposed Shallow Sand 60.5Shallow Mud 0.06 0.06 0.06 52.5Deep Gravel 24.3Exposed Rocky Shore 0.001 0.00 0.001 20.6Estuarine 0.10 0.01 0.01 0.10 0.11 10.4Estuarine Beach 0.64 2.87 2.87 0.64 3.52 4.4Estuarine Rocky Shore 0.12 0.15 0.15 0.12 0.27 3.5High Current Shallow Reef 2.6High Current Deep Mud 1.3Exposed Beach 1.2High Current Deep Reef 1.1Mudflat 0.74 0.27 0.27 0.74 1.00 1.0High Current Shallow Sand 0.4Sheltered Shallow Reef 0.03 0.03 0.03 0.1Rocky Shore 0.1High Current Rocky Shore 0.03
DRAFT ONLY 55

APPENDIX 4.1 AREA (KM 2) OF HABITATS IN MARINE PROTECTED AREAS IN EACH COASTAL MARINE BIOREGION.
Kermadec Islandskm2
Typ
e I Marin
e Reserve
No
-take Marin
e Park
Cab
le or P
ipelin
e Zo
ne
No
trawl, d
anish
seine,
dred
ge or setn
et
No
trawl, d
anish
seine,
dred
ge
To
tal Typ
e II MP
A
To
tal no
take
To
tal MP
A
To
tal hab
itat in b
ioregio
n
Mid Slope 3002.27 3,002.3 3002.27 3,002.3Lower Slope 2777.75 2,777.8 2777.75 2,777.8Upper Slope 950.34 950.34 950.34 950.3Deep Volcanic 345.82 345.82 345.82 345.8Exposed Shallow Volcanic 30.09 30.09 30.09 30.1Moderate Shallow Volcanic 26.11 26.11 26.11 26.1Deep Reef 23.10 23.10 23.10 23.1Exposed Shallow Reef 16.60 16.60 16.60 16.6Moderate Shallow Reef 5.67 5.67 5.67 5.7Exposed Rocky Shore 0.87 0.87 0.87 0.9Moderate Rocky Shore 0.65 0.65 0.65 0.6
DRAFT ONLY 56

APPENDIX 4.1 AREA (KM 2) OF HABITATS IN MARINE PROTECTED AREAS IN EACH COASTAL MARINE BIOREGION.
North Cook Straitkm2
Typ
e I Marin
e Reserve
No
-take Marin
e Park
Cab
le or P
ipelin
e Zo
ne
No
trawl, d
anish
seine,
dred
ge or setn
et
No
trawl, d
anish
seine,
dred
ge
To
tal Typ
e II MP
A
To
tal no
take
To
tal MP
A
To
tal hab
itat in b
ioregio
n
Deep Mud 82.16 82.16 82.16 82.16 3,265.2Deep Sand 1.16 13.89 13.89 15.05 15.05 2,026.2High Current Deep Sand 15.71 12.07 12.07 27.78 27.78 1,474.7Upper Slope 30.16 30.16 30.16 30.16 1,248.8Mid Slope 1,093.0Lower Slope 755.6Moderate Shallow Sand 1.42 0.76 0.76 2.18 2.18 707.3Sheltered Shallow Sand 0.12 0.12 0.123 0.123 516.5High Current Shallow Sand 3.39 1.20 1.20 4.58 4.58 499.1High Current Deep Gravel 50.61 50.61 50.61 50.61 432.3Shallow Mud 0.15 0.15 0.15 0.15 413.9Exposed Shallow Sand 0.03 0.03 0.03 0.03 167.6Moderate Shallow Reef 2.95 1.10 0.32 1.42 4.05 4.37 166.0High Current Deep Mud 3.63 3.63 3.63 152.4Deep Gravel 24.28 24.28 24.28 24.28 149.7Exposed Shallow Reef 6.06 6.06 6.06 6.06 119.9High Current Shallow Gravel 109.0High Current Shallow Reef 3.40 0.39 0.01 0.39 3.79 3.80 53.0Estuarine 50.7Exposed Shallow Gravel 14.25 14.25 14.25 14.25 50.1Deep Reef 0.07 0.07 0.07 42.5Moderate Shallow Gravel 39.5Estuarine Mud 36.0Sheltered Shallow Reef 1.41 1.41 1.41 1.41 19.8Sheltered Shallow Gravel 11.7Estuarine Sand 11.5Estuarine Reef 10.6High Current Deep Reef 0.37 0.54 0.54 0.91 0.91 8.9Moderate Beach 8.2Sheltered Beach 0.02 0.02 0.02 0.02 8.0Moderate Rocky Shore 0.09 0.02 0.09 0.12 0.12 0.21 6.4Exposed Rocky Shore 0.72 0.72 0.72 0.72 6.3Exposed Beach 0.21 0.21 0.21 0.21 2.5Sheltered Rocky Shore 0.50 0.50 0.50 0.50 1.9Biogenic 1.8High Current Rocky Shore 0.18 0.00 0.18 0.18 1.5Estuarine Beach 0.9Estuarine Rocky Shore 0.00 0.8High Current Beach 0.05 0.00 0.05 0.05 0.7Mudflat 0.3
DRAFT ONLY 57

APPENDIX 4.1 AREA (KM 2) OF HABITATS IN MARINE PROTECTED AREAS IN EACH COASTAL MARINE BIOREGION.
North Easternkm2
Typ
e I Marin
e Reserve
No
-take Marin
e Park
Cab
le or P
ipelin
e Zo
ne
No
trawl, d
anish
seine,
dred
ge or setn
et
No
trawl, d
anish
seine,
dred
ge
To
tal Typ
e II MP
A
To
tal no
take
To
tal MP
A
To
tal hab
itat in b
ioregio
n
Deep Sand 13.39 0.01 447.69 0.47 448.17 461.09 461.56 13,054.6Deep Mud 2.63 342.87 0.34 343.21 345.50 345.84 8,841.8Upper Slope 7.16 7.16 7.16 3,502.1Mid Slope 2,247.7Moderate Shallow Sand 7.36 2.49 2.79 0.95 6.23 12.64 13.59 1,894.5High Current Deep Sand 1,865.2Shallow Mud 5.45 53.00 4.37 57.37 58.45 62.82 1,364.1Sheltered Shallow Sand 5.29 0.82 0.51 1.33 6.11 6.62 697.2Lower Slope 664.4Moderate Shallow Reef 9.28 0.69 1.89 8.02 10.59 11.85 19.87 494.0Biogenic 3.59 0.14 11.85 0.53 12.51 15.58 16.10 488.3High Current Shallow Mud 1.57 1.57 1.57 1.57 324.9Estuarine Sand 2.99 2.99 2.99 318.5Deep Reef 15.12 4.26 4.26 19.38 19.38 275.7High Current Deep Mud 271.8Mudflat 5.01 0.00 5.01 5.01 252.2Exposed Shallow Sand 231.1High Current Shallow Sand 0.16 1.11 0.44 1.55 1.27 1.71 229.7Deep Gravel 8.21 8.21 8.21 8.21 220.7High Current Deep Gravel 151.2Estuarine Beach 0.03 0.08 0.08 0.03 0.11 117.9Sheltered Shallow Reef 1.03 0.25 0.17 0.42 1.27 1.45 111.0High Current Shallow Gravel 96.5High Current Beach 0.02 0.02 0.02 41.1High Current Shallow Reef 0.07 0.08 0.15 0.07 0.15 41.0Estuarine Reef 0.06 2.28 2.28 0.06 2.34 34.0Moderate Beach 0.05 0.12 0.12 0.18 0.42 0.29 0.46 33.5Estuarine Mud 1.46 1.46 1.46 33.2Sheltered Shallow Gravel 30.8Moderate Shallow Gravel 2.59 2.59 2.59 2.59 27.4Moderate Rocky Shore 0.38 0.12 0.02 0.32 0.47 0.52 0.84 26.4Estuarine 19.8Sheltered Rocky Shore 0.16 0.09 0.001 0.09 0.25 0.25 17.0Exposed Shallow Gravel 14.8High Current Deep Reef 10.4Sheltered Beach 0.03 0.05 0.06 0.11 0.08 0.14 9.2Exposed Shallow Reef 6.2Exposed Beach 6.0Estuarine Rocky Shore 0.11 0.11 0.11 4.5High Current Rocky Shore 0.03 0.03 0.03 2.1Exposed Rocky Shore 0.4Estuarine Gravel 0.2
DRAFT ONLY 58

APPENDIX 4.1 AREA (KM 2) OF HABITATS IN MARINE PROTECTED AREAS IN EACH COASTAL MARINE BIOREGION.
Snares Islandskm2
Typ
e I Marin
e Reserve
No
-take Marin
e Park
Cab
le or P
ipelin
e Zo
ne
No
trawl, d
anish
seine,
dred
ge or setn
et
No
trawl, d
anish
seine,
dred
ge
To
tal Typ
e II MP
A
To
tal no
take
To
tal MP
A
To
tal hab
itat in b
ioregio
n
Deep Gravel 1,439.9Upper Slope 629.4Mid Slope 79.1Exposed Shallow Reef 2.4Exposed Shallow Gravel 1.5Moderate Shallow Reef 0.7Deep Reef 0.6Moderate Shallow Gravel 0.5Exposed Rocky Shore 0.4Moderate Rocky Shore 0.01
DRAFT ONLY 59

APPENDIX 4.1 AREA (KM 2) OF HABITATS IN MARINE PROTECTED AREAS IN EACH COASTAL MARINE BIOREGION.
South Cook Straitkm2
Typ
e I Marin
e Reserve
No
-take Marin
e Park
Cab
le or P
ipelin
e Zo
ne
No
trawl, d
anish
seine,
dred
ge or setn
et
No
trawl, d
anish
seine,
dred
ge
To
tal Typ
e II MP
A
To
tal no
take
To
tal MP
A
To
tal hab
itat in b
ioregio
n
High Current Deep Sand 0.54 45.83 45.83 46.38 46.38 3,208.6Deep Mud 1.02 1.02 1.02 2,167.7Deep Sand 2.32 0.02 2.34 2.32 2.34 2,092.1Shallow Mud 21.29 21.29 21.29 1,177.4High Current Deep Gravel 85.03 85.03 85.03 85.03 545.3Deep Gravel 468.1Estuarine Mud 0.71 0.71 0.71 333.9High Current Deep Mud 0.21 0.21 0.21 307.9Sheltered Shallow Sand 0.04 2.83 0.13 2.96 2.87 3.00 306.5Estuarine Sand 3.66 3.66 3.66 288.0High Current Shallow Sand 0.23 0.27 0.01 0.28 0.49 0.51 264.2Upper Slope 0.06 0.06 0.06 0.06 162.0Mudflat 4.35 4.35 4.35 159.6Biogenic 0.15 0.00 0.00 0.15 0.15 108.8High Current Shallow Mud 106.5Estuarine Reef 1.45 1.45 1.45 99.9Exposed Shallow Sand 95.8Moderate Shallow Sand 94.5Sheltered Shallow Reef 4.16 0.59 1.06 1.65 4.76 5.81 61.5High Current Shallow Reef 0.13 0.07 0.07 0.14 0.19 0.26 38.0High Current Deep Reef 0.01 0.06 0.06 0.07 0.07 29.0Exposed Shallow Reef 24.0Deep Reef 0.04 0.004 0.04 0.04 0.04 17.9Estuarine 15.7Estuarine Beach 0.02 0.00 0.02 0.02 14.7Moderate Shallow Reef 13.5High Current Shallow Gravel 13.1Sheltered Beach 0.07 0.07 0.07 10.9Exposed Shallow Gravel 4.3Sheltered Rocky Shore 0.32 0.10 0.17 0.27 0.43 0.60 3.6Exposed Beach 2.6Exposed Rocky Shore 2.0High Current Beach 1.1Estuarine Rocky Shore 0.8Sheltered Shallow Gravel 0.7High Current Rocky Shore 0.2Estuarine Gravel 0.1Moderate Beach 0.1Moderate Rocky Shore 0.1
DRAFT ONLY 60

APPENDIX 4.1 AREA (KM 2) OF HABITATS IN MARINE PROTECTED AREAS IN EACH COASTAL MARINE BIOREGION.
Southern South Islandkm2
Typ
e I Marin
e Reserve
No
-take Marin
e Park
Cab
le or P
ipelin
e Zo
ne
No
trawl, d
anish
seine,
dred
ge or setn
et
No
trawl, d
anish
seine,
dred
ge
To
tal Typ
e II MP
A
To
tal no
take
To
tal MP
A
To
tal hab
itat in b
ioregio
n
Deep Sand 7,899.5High Current Deep Sand 0.07 0.23 0.23 0.07 0.31 2,593.2Upper Slope 2,194.9Deep Gravel 1,259.8Exposed Shallow Sand 1,221.3High Current Deep Gravel 0.002 0.18 0.18 0.002 0.18 1,161.8Moderate Shallow Gravel 1,031.4Moderate Shallow Sand 700.6Deep Mud 528.0High Current Shallow Sand 1.00 5.22 5.22 1.00 6.22 459.2High Current Shallow Gravel 0.16 0.74 0.74 0.16 0.91 454.0Exposed Shallow Reef 214.9Shallow Mud 172.9Biogenic 4.08 4.08 4.08 157.0High Current Shallow Reef 0.94 1.02 1.02 0.94 1.96 144.3Exposed Shallow Gravel 141.7Moderate Shallow Reef 123.1Mudflat 6.85 6.85 6.85 99.2Estuarine Sand 3.84 12.11 12.11 3.84 15.95 75.7Deep Reef 69.2Estuarine 0.000 0.00 0.00 44.5Estuarine Reef 1.56 15.00 15.00 1.56 16.57 44.3Estuarine Gravel 0.69 19.51 19.51 0.69 20.20 38.7High Current Deep Reef 31.3Estuarine Mud 2.45 23.17 23.17 2.45 25.63 26.3Sheltered Shallow Sand 24.8High Current Beach 24.3Exposed Beach 12.8Moderate Beach 11.4Exposed Rocky Shore 9.4Sheltered Shallow Reef 5.8Estuarine Beach 0.02 0.53 0.53 0.02 0.55 3.4Moderate Rocky Shore 3.3High Current Rocky Shore 1.7Sheltered Shallow Gravel 1.0Sheltered Beach 0.5Estuarine Rocky Shore 0.01 0.06 0.06 0.01 0.07 0.4Sheltered Rocky Shore 0.1
DRAFT ONLY 61

APPENDIX 4.1 AREA (KM 2) OF HABITATS IN MARINE PROTECTED AREAS IN EACH COASTAL MARINE BIOREGION.
Subantarctic Islandskm2
Typ
e I Marin
e Reserve
No
-take Marin
e Park
Cab
le or P
ipelin
e Zo
ne
No
trawl, d
anish
seine,
dred
ge or setn
et
No
trawl, d
anish
seine,
dred
ge
To
tal Typ
e II MP
A
To
tal no
take
To
tal MP
A
To
tal hab
itat in b
ioregio
n
Deep Gravel 2,298 2,297.71 2297.71 5,776.5Upper Slope 738.18 738.18 738.18 1,676.7Lower Slope 412.04 412.04 412.04 1,493.2Mid Slope 495.06 495.06 495.06 1,274.0Deep Mud 552.17 552.17 552.17 553.7Deep Sand 497.7Exposed Shallow Gravel 301.35 302.42 301.35 358.4Moderate Shallow Gravel 88.34 88.60 88.34 106.5Estuarine Gravel 74.09 74.16 74.09 78.9Estuarine Reef 34.72 35.01 34.72 40.8Moderate Shallow Reef 28.19 28.27 28.19 30.7Exposed Shallow Reef 27.23 27.33 27.23 29.5Deep Reef 3.06 3.06 3.06 9.6Exposed Shallow Sand 4.1Exposed Rocky Shore 2.02 2.02 2.02 2.9Estuarine Rocky Shore 1.53 1.53 1.53 1.5Moderate Rocky Shore 1.27 1.27 1.27 1.4Moderate Beach 0.11 0.11 0.11 0.1Estuarine 0.01 0.01 0.01 0.01Estuarine Beach 0.01 0.01 0.01 0.01
DRAFT ONLY 62

APPENDIX 4.1 AREA (KM 2) OF HABITATS IN MARINE PROTECTED AREAS IN EACH COASTAL MARINE BIOREGION.
Three Kingskm2
Typ
e I Marin
e Reserve
No
-take Marin
e Park
Cab
le or P
ipelin
e Zo
ne
No
trawl, d
anish
seine,
dred
ge or setn
et
No
trawl, d
anish
seine,
dred
ge
To
tal Typ
e II MP
A
To
tal no
take
To
tal MP
A
To
tal hab
itat in b
ioregio
n
Upper Slope 925.6High Current Deep Sand 796.7Mid Slope 470.4High Current Deep Reef 14.0High Current Deep Gravel 8.8Deep Sand 6.3High Current Shallow Reef 4.8High Current Rocky Shore 0.01
DRAFT ONLY 63

APPENDIX 4.1 AREA (KM 2) OF HABITATS IN MARINE PROTECTED AREAS IN EACH COASTAL MARINE BIOREGION.
West Coast South Islandkm2
Typ
e I Marin
e Reserve
No
-take Marin
e Park
Cab
le or P
ipelin
e Zo
ne
No
trawl, d
anish
seine,
dred
ge or setn
et
No
trawl, d
anish
seine,
dred
ge
To
tal Typ
e II MP
A
To
tal no
take
To
tal MP
A
To
tal hab
itat in b
ioregio
n
Deep Mud 6,027.3Deep Sand 2,042.7Exposed Shallow Sand 1,651.9Mid Slope 858.8Lower Slope 773.4Upper Slope 584.8Shallow Mud 492.5Moderate Shallow Sand 419.7Exposed Shallow Reef 123.7Deep Reef 74.5Estuarine 40.8Deep Gravel 21.2Exposed Beach 12.3Moderate Shallow Reef 11.4Exposed Rocky Shore 5.7Estuarine Beach 5.5Biogenic 4.4Moderate Beach 3.7Mudflat 1.2Estuarine Sand 1.0Exposed Shallow Gravel 1.0Moderate Rocky Shore 0.7
DRAFT ONLY 64

APPENDIX 4.1 AREA (KM 2) OF HABITATS IN MARINE PROTECTED AREAS IN EACH COASTAL MARINE BIOREGION.
Western North Islandkm2
Typ
e I Marin
e Reserve
No
-take Marin
e Park
Cab
le or P
ipelin
e Zo
ne
No
trawl, d
anish
seine,
dred
ge or setn
et
No
trawl, d
anish
seine,
dred
ge
To
tal Typ
e II MP
A
To
tal no
take
To
tal MP
A
To
tal hab
itat in b
ioregio
n
Deep Sand 0.36 264.23 0.11 264.34 264.59 264.70 9,026.1Exposed Shallow Sand 0.02 53.89 0.44 54.33 53.91 54.34 1,858.5Deep Mud 1,180.0Moderate Shallow Sand 24.79 6.79 1.34 8.13 31.58 32.92 639.6Estuarine Sand 530.4Mudflat 508.8High Current Shallow Sand 203.1Upper Slope 185.7Biogenic 165.2Exposed Shallow Reef 0.002 0.00 0.002 0.002 62.9Moderate Shallow Reef 6.44 1.41 1.41 6.44 7.85 51.0Exposed Beach 0.97 0.97 0.97 0.97 36.4Estuarine 26.2Exposed Shallow Gravel 22.7Deep Gravel 18.8Estuarine Beach 16.0Shallow Mud 0.15 0.92 0.92 0.15 1.07 10.9Deep Reef 9.8Sheltered Shallow Sand 7.9Exposed Rocky Shore 0.48 0.48 0.48 0.48 6.7High Current Deep Sand 5.3Moderate Beach 0.12 0.09 0.03 0.12 0.21 0.24 4.9Moderate Rocky Shore 0.42 0.42 0.42 3.3High Current Shallow Reef 2.0Estuarine Mud 1.9Estuarine Rocky Shore 1.4Sheltered Shallow Reef 1.3Estuarine Reef 0.8Sheltered Beach 0.6High Current Rocky Shore 0.5High Current Beach 0.4Moderate Shallow Gravel 0.4Sheltered Rocky Shore 0.1
DRAFT ONLY 65

APPENDIX 4.2 AREA (KM 2) OF HABITATS IN MANAGEMENT TOOLS THAT DO NOT MEET THE MPA PROTECTION STANDARD IN EACH BIOREGION.
Chatham Islands
km2
Mataitai
Taiap
ure
Natu
re Reserve
Scientific R
eserve
Other D
OC reserve
Tem
porary clo
sure
No traw
l, danish
seine o
r commercial d
redge (am
ateur
dred
ge allowed)
Two of traw
l, danish
seine o
r commercial d
redge
prohibited
One o
f trawl, d
anish
seine o
r commercial d
redge
prohibited
Total h
abitat in
bioregio
n
Deep Mud 15.30 4,811.0Deep Gravel 536.44 3,844.4Upper Slope 1,325.8Moderate Shallow Gravel 0.41 485.04 630.5Exposed Shallow Gravel 0.11 309.09 422.8Exposed Shallow Reef 0.50 309.31 416.2Deep Reef 30.13 258.8Moderate Shallow Reef 0.64 155.65 191.2Mid Slope 153.6Estuarine Gravel 0.16 6.15 117.7Mudflat 72.0Shallow Mud 0.79 32.3Estuarine 0.40 16.8Exposed Rocky Shore 0.14 0.13 9.68 10.3Moderate Rocky Shore 0.07 0.24 5.60 5.9Estuarine Beach 0.02 0.06 3.4Moderate Beach 0.07 3.30 3.4Exposed Beach 0.012 1.98 2.0Estuarine Rocky Shore 0.02 0.48 0.5
DRAFT ONLY 66

APPENDIX 4.2 AREA (KM 2) OF HABITATS IN MANAGEMENT TOOLS THAT DO NOT MEET THE MPA PROTECTION STANDARD IN EACH BIOREGION.
East Coast South Island
km2
Mataitai
Taiap
ure
Natu
re Reserve
Scientific R
eserve
Other D
OC reserve
Tem
porary clo
sure
No traw
l, danish
seine o
r commercial d
redge
(amateu
r dred
ge allowed)
Two of traw
l, danish
seine
or co
mmercial d
redge
prohibited
One o
f trawl, d
anish
seine
or co
mmercial d
redge
prohibited
Total h
abitat in
bioregio
n
Deep Sand 0.26 0.81 2,121.5Deep Mud 13.88 2,017.8Moderate Shallow Sand 1.31 0.03 0.40 1,231.0Shallow Mud 0.07 0.08 723.3High Current Deep Sand 699.6Exposed Shallow Sand 1.21 0.30 646.1Moderate Shallow Gravel 527.0Deep Gravel 511.7Mid Slope 456.5Sheltered Shallow Sand 448.0Upper Slope 331.2Lower Slope 326.9High Current Deep Mud 309.4Estuarine 0.27 188.6Moderate Beach 0.14 180.7Moderate Shallow Reef 0.33 121.1High Current Shallow Sand 1.76 2.44 88.9Estuarine Mud 7.22 22.57 24.29 7.77 73.1Exposed Shallow Gravel 61.3High Current Deep Gravel 42.7Exposed Shallow Reef 1.26 0.12 31.9Sheltered Shallow Reef 0.02 0.02 26.6Estuarine Sand 7.87 0.18 12.05 22.8Mudflat 0.14 1.27 0.68 1.37 0.15 21.6Deep Reef 0.04 20.2Sheltered Shallow Gravel 13.4Biogenic 0.014 12.8Estuarine Reef 0.45 3.09 4.25 0.48 12.5High Current Shallow Reef 0.25 0.31 7.5Moderate Rocky Shore 0.04 0.02 3.6High Current Shallow Mud 2.3Sheltered Beach 1.7Exposed Beach 1.4Estuarine Beach 0.01 0.02 0.08 0.16 0.011 1.3High Current Deep Reef 0.8Estuarine Rocky Shore 0.011 0.4Exposed Rocky Shore 0.2High Current Rocky Shore 0.02
DRAFT ONLY 67

APPENDIX 4.2 AREA (KM 2) OF HABITATS IN MANAGEMENT TOOLS THAT DO NOT MEET THE MPA PROTECTION STANDARD IN EACH BIOREGION.
Eastern North Island
km2
Mataitai
Taiap
ure
Natu
re Reserve
Scientific R
eserve
Other D
OC reserve
Tem
porary clo
sure
No traw
l, danish
seine o
r commercial d
redge
(amateu
r dred
ge allowed)
Two of traw
l, danish
seine
or co
mmercial d
redge
prohibited
One o
f trawl, d
anish
seine
or co
mmercial d
redge
prohibited
Total h
abitat in
bioregio
n
Deep Mud 12.34 7.07 621.29 7,025.7Deep Sand 74.81 274.12 951.7Moderate Shallow Sand 2.64 16.81 59.84 104.19 511.33 834.5Shallow Mud 2.70 9.08 0.56 70.95 11.72 335.43 599.9Upper Slope 587.7Moderate Shallow Reef 8.18 30.16 29.10 2.91 250.43 284.8Moderate Shallow Gravel 140.51 53.95 219.0High Current Deep Mud 0.01 22.61 217.8Mid Slope 175.0Exposed Shallow Reef 48.35 109.35 174.1Deep Gravel 42.28 172.0Deep Reef 11.63 21.18 110.3Sheltered Shallow Sand 0.33 15.55 10.74 76.76 103.2Exposed Shallow Sand 14.74 33.67 50.8Lower Slope 30.7High Current Shallow Reef 0.19 22.09 22.3Estuarine 2.06 4.42 0.58 0.23 16.6Moderate Rocky Shore 0.15 0.51 3.31 0.04 8.67 12.4Exposed Rocky Shore 3.45 4.59 8.8High Current Shallow Mud 0.26 8.38 8.6Moderate Beach 0.15 0.75 0.04 0.92 0.82 5.50 7.5Sheltered Shallow Reef 0.50 3.35 0.46 2.63 6.5Sheltered Shallow Gravel 3.40 3.4High Current Shallow Sand 1.60 0.85 2.4High Current Deep Reef 1.93 1.9Estuarine Beach 0.06 0.001 1.7Exposed Beach 0.08 1.43 1.6Mudflat 0.09 0.08 0.25 1.3Sheltered Shingle 0.59 0.51 1.1High Current Deep Sand 0.13 0.68 0.8Sheltered Beach 0.07 0.20 0.55 0.8Sheltered Rocky Shore 0.64 0.6Biogenic 0.13 0.33 0.03 0.0003 0.6High Current Rocky Shore 0.31 0.3Estuarine Mud 0.26 0.3Estuarine Sand 0.11 0.1High Current Beach 0.06 0.1Estuarine Reef 0.05 0.1
DRAFT ONLY 68

APPENDIX 4.2 AREA (KM 2) OF HABITATS IN MANAGEMENT TOOLS THAT DO NOT MEET THE MPA PROTECTION STANDARD IN EACH BIOREGION.
Fiordland
km2
Mataitai
Taiap
ure
Natu
re Reserve
Scientific R
eserve
Other D
OC reserve
Tem
porary clo
sure
No traw
l, danish
seine o
r commercial d
redge
(amateu
r dred
ge allowed)
Two of traw
l, danish
seine
or co
mmercial d
redge
prohibited
One o
f trawl, d
anish
seine
or co
mmercial d
redge
prohibited
Total h
abitat in
bioregio
n
Lower Slope 3,449.9Deep Sand 4.54 1,724.4Upper Slope 1,639.9Mid Slope 1,392.8Deep Mud 1.01 462.3Estuarine Mud 99.44 458.4Exposed Shallow Reef 8.01 279.3High Current Deep Sand 2.91 200.6Estuarine Reef 79.60 171.7Estuarine Sand 80.59 151.6Deep Reef 3.64 126.2Exposed Shallow Sand 0.56 60.5Shallow Mud 0.001 52.5Deep Gravel 24.3Exposed Rocky Shore 0.91 20.6Estuarine 0.000 10.4Estuarine Beach 0.41 4.4Estuarine Rocky Shore 2.73 3.5High Current Shallow Reef 1.12 2.6High Current Deep Mud 1.3Exposed Beach 1.2High Current Deep Reef 0.30 1.1Mudflat 1.0High Current Shallow Sand 0.04 0.4Sheltered Shallow Reef 0.1Rocky Shore 0.1High Current Rocky Shore 0.03 0.03
DRAFT ONLY 69

APPENDIX 4.2 AREA (KM 2) OF HABITATS IN MANAGEMENT TOOLS THAT DO NOT MEET THE MPA PROTECTION STANDARD IN EACH BIOREGION.
Kermadec Islands
km2
Mataitai
Taiap
ure
Natu
re Reserve
Scientific R
eserve
Other D
OC reserve
Tem
porary clo
sure
No traw
l, danish
seine o
r commercial d
redge
(amateu
r dred
ge allowed)
Two of traw
l, danish
seine
or co
mmercial d
redge
prohibited
One o
f trawl, d
anish
seine
or co
mmercial d
redge
prohibited
Total h
abitat in
bioregio
n
Mid Slope 3,002.3Lower Slope 2,777.8Upper Slope 950.3Deep Volcanic 345.8Exposed Shallow Volcanic 30.1Moderate Shallow Volcanic 26.1Deep Reef 23.1Exposed Shallow Reef 16.6Moderate Shallow Reef 5.7Exposed Rocky Shore 0.9Moderate Rocky Shore 0.6
DRAFT ONLY 70

APPENDIX 4.2 AREA (KM 2) OF HABITATS IN MANAGEMENT TOOLS THAT DO NOT MEET THE MPA PROTECTION STANDARD IN EACH BIOREGION.
North Cook Strait
km2
Mataitai
Taiap
ure
Natu
re Reserve
Scientific R
eserve
Other D
OC reserve
Tem
porary clo
sure
No traw
l, danish
seine o
r commercial d
redge
(amateu
r dred
ge allowed)
Two of traw
l, danish
seine
or co
mmercial d
redge
prohibited
One o
f trawl, d
anish
seine
or co
mmercial d
redge
prohibited
Total h
abitat in
bioregio
n
Deep Mud 563.90 3,265.2Deep Sand 227.96 2,026.2High Current Deep Sand 210.12 1,474.7Upper Slope 47.95 1,248.8Mid Slope 8.61 1,093.0Lower Slope 755.6Moderate Shallow Sand 0.23 424.51 707.3Sheltered Shallow Sand 0.003 0.66 2.39 436.85 516.5High Current Shallow Sand 0.02 0.10 160.31 499.1High Current Deep Gravel 53.70 432.3Shallow Mud 0.85 408.97 413.9Exposed Shallow Sand 56.22 167.6Moderate Shallow Reef 2.16 0.26 0.000 155.61 166.0High Current Deep Mud 86.52 152.4Deep Gravel 78.99 149.7Exposed Shallow Reef 112.50 119.9High Current Shallow Gravel 4.78 109.0High Current Shallow Reef 0.04 0.003 26.70 53.0Estuarine 0.001 35.27 0.01 50.7Exposed Shallow Gravel 35.87 50.1Deep Reef 18.27 42.5Moderate Shallow Gravel 27.67 39.5Estuarine Mud 35.91 0.13 36.0Sheltered Shallow Reef 0.03 0.80 12.02 19.8Sheltered Shallow Gravel 3.86 11.7Estuarine Sand 0.83 9.47 2.02 11.5Estuarine Reef 0.000 9.37 1.24 10.6High Current Deep Reef 2.56 8.9Moderate Beach 0.013 0.00 0.000 8.23 8.2Sheltered Beach 0.02 0.0004 0.04 0.04 7.91 8.0Moderate Rocky Shore 0.02 0.03 6.21 6.4Exposed Rocky Shore 5.62 6.3Exposed Beach 2.34 2.5Sheltered Rocky Shore 0.04 0.33 1.07 1.9Biogenic 0.70 1.76 1.8High Current Rocky Shore 0.38 0.40 0.44 1.5Estuarine Beach 0.12 0.25 0.9Estuarine Rocky Shore 0.06 0.69 0.05 0.8High Current Beach 0.17 0.001 0.45 0.7Mudflat 0.05 0.28 0.3
DRAFT ONLY 71

APPENDIX 4.2 AREA (KM 2) OF HABITATS IN MANAGEMENT TOOLS THAT DO NOT MEET THE MPA PROTECTION STANDARD IN EACH BIOREGION.
North Eastern
km2
Mataitai
Taiap
ure
Natu
re Reserve
Scientific R
eserve
Other D
OC reserve
Tem
porary clo
sure
No traw
l, danish
seine o
r commercial d
redge
(amateu
r dred
ge allowed)
Two of traw
l, danish
seine
or co
mmercial d
redge
prohibited
One o
f trawl, d
anish
seine
or co
mmercial d
redge
prohibited
Total h
abitat in
bioregio
n
Deep Sand 5.81 0.01 61.99 716.56 14.50 13,054.6Deep Mud 0.45 74.25 535.17 203.68 8,841.8Upper Slope 3,502.1Mid Slope 2,247.7Moderate Shallow Sand 4.20 28.08 0.03 215.63 748.52 39.16 1,894.5High Current Deep Sand 200.51 103.95 1,865.2Shallow Mud 12.07 10.16 0.05 705.70 215.93 69.60 1,364.1Sheltered Shallow Sand 0.01 351.79 295.85 5.38 697.2Lower Slope 664.4Moderate Shallow Reef 4.63 5.96 0.87 49.50 98.41 36.12 494.0Biogenic 5.81 3.95 0.21 0.61 297.48 78.20 7.55 488.3High Current Shallow Mud 0.16 299.90 13.88 7.98 324.9Estuarine Sand 11.49 0.39 281.49 19.99 7.15 318.5Deep Reef 0.00 0.82 20.61 11.02 275.7High Current Deep Mud 0.37 6.51 22.57 271.8Mudflat 2.44 15.20 3.60 0.05 195.07 27.96 1.59 252.2Exposed Shallow Sand 113.03 231.1High Current Shallow Sand 1.15 54.92 73.45 229.7Deep Gravel 0.87 8.02 220.7High Current Deep Gravel 0.15 0.62 151.2Estuarine Beach 1.86 23.50 88.99 1.53 117.9Sheltered Shallow Reef 0.02 65.07 16.95 0.61 111.0High Current Shallow Gravel 0.001 57.00 0.28 96.5High Current Beach 1.61 0.56 40.33 41.1High Current Shallow Reef 0.31 0.01 12.38 0.66 7.01 41.0Estuarine Reef 0.07 0.03 17.89 0.12 2.76 34.0Moderate Beach 0.33 1.39 5.61 13.90 1.41 33.5Estuarine Mud 1.84 0.000 0.01 14.10 8.47 3.66 33.2Sheltered Shallow Gravel 30.84 30.8Moderate Shallow Gravel 5.87 0.64 27.4Moderate Rocky Shore 0.15 0.17 0.81 5.09 5.43 4.46 26.4Estuarine 0.01 0.04 0.12 0.01 0.000 19.8Sheltered Rocky Shore 13.57 1.52 0.21 17.0Exposed Shallow Gravel 14.8High Current Deep Reef 0.09 0.21 10.4Sheltered Beach 0.001 4.33 2.08 0.03 9.2Exposed Shallow Reef 0.58 2.18 6.2Exposed Beach 5.50 0.09 6.0Estuarine Rocky Shore 2.85 0.06 0.28 4.5High Current Rocky Shore 1.86 2.1Exposed Rocky Shore 0.05 0.07 0.4Estuarine Gravel 0.18 0.2
DRAFT ONLY 72

APPENDIX 4.2 AREA (KM 2) OF HABITATS IN MANAGEMENT TOOLS THAT DO NOT MEET THE MPA PROTECTION STANDARD IN EACH BIOREGION.
Snares Islands
km2
Mataitai
Taiap
ure
Natu
re Reserve
Scientific R
eserve
Other D
OC reserve
Tem
porary clo
sure
No traw
l, danish
seine o
r commercial d
redge
(amateu
r dred
ge allowed)
Two of traw
l, danish
seine
or co
mmercial d
redge
prohibited
One o
f trawl, d
anish
seine
or co
mmercial d
redge
prohibited
Total h
abitat in
bioregio
n
Deep Gravel 1,439.9Upper Slope 629.4Mid Slope 79.1Exposed Shallow Reef 2.4Exposed Shallow Gravel 1.5Moderate Shallow Reef 0.7Deep Reef 0.6Moderate Shallow Gravel 0.5Exposed Rocky Shore 0.37 0.4Moderate Rocky Shore 0.01 0.01
DRAFT ONLY 73

APPENDIX 4.2 AREA (KM 2) OF HABITATS IN MANAGEMENT TOOLS THAT DO NOT MEET THE MPA PROTECTION STANDARD IN EACH BIOREGION.
South Cook Strait
km2
Mataitai
Taiap
ure
Natu
re Reserve
Scientific R
eserve
Other D
OC reserve
Tem
porary clo
sure
No traw
l, danish
seine o
r commercial d
redge
(amateu
r dred
ge allowed)
Two of traw
l, danish
seine
or co
mmercial d
redge
prohibited
One o
f trawl, d
anish
seine
or co
mmercial d
redge
prohibited
Total h
abitat in
bioregio
n
High Current Deep Sand 0.00 2.88 26.95 3,208.6Deep Mud 71.21 2,167.7Deep Sand 2,092.1Shallow Mud 15.23 0.33 3.96 6.25 16.99 1,177.4High Current Deep Gravel 4.98 545.3Deep Gravel 468.1Estuarine Mud 0.00 55.74 63.49 65.94 333.9High Current Deep Mud 19.00 0.36 307.9Sheltered Shallow Sand 6.83 2.51 0.02 1.96 0.15 306.5Estuarine Sand 0.000 15.15 46.81 44.05 65.99 288.0High Current Shallow Sand 4.43 0.004 0.59 0.89 10.57 37.33 264.2Upper Slope 162.0Mudflat 43.65 11.33 4.91 40.08 159.6Biogenic 38.18 6.00 53.56 7.35 108.8High Current Shallow Mud 0.33 5.64 18.27 106.5Estuarine Reef 0.02 17.28 13.51 23.91 99.9Exposed Shallow Sand 0.36 0.21 0.15 95.8Moderate Shallow Sand 2.00 94.5Sheltered Shallow Reef 0.86 8.26 0.22 4.35 61.5High Current Shallow Reef 0.15 0.04 0.91 6.35 3.82 38.0High Current Deep Reef 0.07 0.33 1.03 29.0Exposed Shallow Reef 0.10 0.02 0.09 24.0Deep Reef 0.51 17.9Estuarine 0.05 0.003 15.7Estuarine Beach 0.02 0.13 0.60 1.41 1.16 14.7Moderate Shallow Reef 13.5High Current Shallow Gravel 0.95 13.1Sheltered Beach 0.07 0.09 0.26 0.12 10.9Exposed Shallow Gravel 4.3Sheltered Rocky Shore 0.59 0.21 0.03 0.12 3.6Exposed Beach 0.21 0.13 0.09 2.6Exposed Rocky Shore 2.0High Current Beach 0.65 0.22 0.25 1.1Estuarine Rocky Shore 0.56 0.05 0.8Sheltered Shallow Gravel 0.7High Current Rocky Shore 0.2Estuarine Gravel 0.1Moderate Beach 0.03 0.1Moderate Rocky Shore 0.1
DRAFT ONLY 74

APPENDIX 4.2 AREA (KM 2) OF HABITATS IN MANAGEMENT TOOLS THAT DO NOT MEET THE MPA PROTECTION STANDARD IN EACH BIOREGION.
Southern South Island
km2
Mataitai
Taiap
ure
Natu
re Reserve
Scientific R
eserve
Other D
OC reserve
Tem
porary clo
sure
No traw
l, danish
seine o
r commercial d
redge
(amateu
r dred
ge allowed)
Two of traw
l, danish
seine
or co
mmercial d
redge
prohibited
One o
f trawl, d
anish
seine
or co
mmercial d
redge
prohibited
Total h
abitat in
bioregio
n
Deep Sand 7.03 7,899.5High Current Deep Sand 0.26 1.55 6.37 3.84 2,593.2Upper Slope 2,194.9Deep Gravel 0.21 1,259.8Exposed Shallow Sand 0.56 0.008 4.48 1,221.3High Current Deep Gravel 0.17 1.08 1.02 1,161.8Moderate Shallow Gravel 1.81 1,031.4Moderate Shallow Sand 4.52 0.22 3.51 700.6Deep Mud 528.0High Current Shallow Sand 5.02 0.09 2.69 4.88 2.28 459.2High Current Shallow Gravel 0.72 0.31 3.71 6.08 454.0Exposed Shallow Reef 1.61 0.13 4.39 214.9Shallow Mud 172.9Biogenic 3.58 0.06 0.11 0.36 5.46 157.0High Current Shallow Reef 0.98 0.07 0.59 2.19 3.63 144.3Exposed Shallow Gravel 0.00 2.40 141.7Moderate Shallow Reef 0.93 3.04 0.19 5.19 123.1Mudflat 9.52 1.19 1.55 4.47 48.41 4.07 99.2Estuarine Sand 11.67 0.18 23.01 0.10 75.7Deep Reef 69.2Estuarine 0.05 1.79 11.96 3.62 0.02 0.47 44.5Estuarine Reef 10.81 0.50 1.29 44.3Estuarine Gravel 16.92 1.33 1.59 38.7High Current Deep Reef 0.60 0.36 31.3Estuarine Mud 17.18 5.05 0.14 26.3Sheltered Shallow Sand 2.58 0.44 24.8High Current Beach 0.16 23.42 0.13 24.3Exposed Beach 0.10 0.04 0.005 0.18 12.8Moderate Beach 0.19 0.30 0.00 0.002 0.27 0.29 11.4Exposed Rocky Shore 0.12 0.14 0.19 9.4Sheltered Shallow Reef 3.99 1.02 5.8Estuarine Beach 0.48 0.05 0.01 0.03 0.11 0.21 3.4Moderate Rocky Shore 0.24 0.02 0.29 3.3High Current Rocky Shore 0.002 0.04 0.01 1.7Sheltered Shallow Gravel 0.95 1.0Sheltered Beach 0.15 0.02 0.28 0.5Estuarine Rocky Shore 0.06 0.4Sheltered Rocky Shore 0.03 0.03 0.1
DRAFT ONLY 75

APPENDIX 4.2 AREA (KM 2) OF HABITATS IN MANAGEMENT TOOLS THAT DO NOT MEET THE MPA PROTECTION STANDARD IN EACH BIOREGION.
Subantarctic Islands
km2
Mataitai
Taiap
ure
Natu
re Reserve
Scientific R
eserve
Other D
OC reserve
Tem
porary clo
sure
No traw
l, danish
seine o
r commercial d
redge
(amateu
r dred
ge allowed)
Two of traw
l, danish
seine
or co
mmercial d
redge
prohibited
One o
f trawl, d
anish
seine
or co
mmercial d
redge
prohibited
Total h
abitat in
bioregio
n
Deep Gravel 3,478.79 5,776.5Upper Slope 938.22 1,676.7Lower Slope 1,023.07 1,493.2Mid Slope 675.67 1,274.0Deep Mud 1.50 553.7Deep Sand 497.67 497.7Exposed Shallow Gravel 55.94 358.4Moderate Shallow Gravel 17.90 106.5Estuarine Gravel 4.77 78.9Estuarine Reef 5.84 40.8Moderate Shallow Reef 2.39 30.7Exposed Shallow Reef 2.21 29.5Deep Reef 6.50 9.6Exposed Shallow Sand 4.08 4.1Exposed Rocky Shore 0.87 0.01 2.9Estuarine Rocky Shore 1.5Moderate Rocky Shore 0.11 0.001 1.4Moderate Beach 0.1Estuarine 0.01Estuarine Beach 0.01
DRAFT ONLY 76

APPENDIX 4.2 AREA (KM 2) OF HABITATS IN MANAGEMENT TOOLS THAT DO NOT MEET THE MPA PROTECTION STANDARD IN EACH BIOREGION.
Three Kings
km2
Mataitai
Taiap
ure
Natu
re Reserve
Scientific R
eserve
Other D
OC reserve
Tem
porary clo
sure
No traw
l, danish
seine o
r commercial d
redge
(amateu
r dred
ge allowed)
Two of traw
l, danish
seine
or co
mmercial d
redge
prohibited
One o
f trawl, d
anish
seine
or co
mmercial d
redge
prohibited
Total h
abitat in
bioregio
n
Upper Slope 925.6High Current Deep Sand 796.7Mid Slope 470.4High Current Deep Reef 14.0High Current Deep Gravel 8.8Deep Sand 6.3High Current Shallow Reef 4.8High Current Rocky Shore 0.01 0.01
DRAFT ONLY 77

APPENDIX 4.2 AREA (KM 2) OF HABITATS IN MANAGEMENT TOOLS THAT DO NOT MEET THE MPA PROTECTION STANDARD IN EACH BIOREGION.
West Coast South Island
km2
Mataitai
Taiap
ure
Natu
re Reserve
Scientific R
eserve
Other D
OC reserve
Tem
porary clo
sure
No traw
l, danish
seine o
r commercial d
redge
(amateu
r dred
ge allowed)
Two of traw
l, danish
seine
or co
mmercial d
redge
prohibited
One o
f trawl, d
anish
seine
or co
mmercial d
redge
prohibited
Total h
abitat in
bioregio
n
Deep Mud 6,027.3Deep Sand 2,042.7Exposed Shallow Sand 0.21 1,651.9Mid Slope 858.8Lower Slope 773.4Upper Slope 584.8Shallow Mud 492.5Moderate Shallow Sand 419.7Exposed Shallow Reef 123.7Deep Reef 74.5Estuarine 1.12 40.8Deep Gravel 21.2Exposed Beach 0.005 12.3Moderate Shallow Reef 0.001 11.4Exposed Rocky Shore 5.7Estuarine Beach 0.18 5.5Biogenic 0.10 4.4Moderate Beach 3.7Mudflat 0.09 1.2Estuarine Sand 0.008 1.0Exposed Shallow Gravel 1.0Moderate Rocky Shore 0.7
DRAFT ONLY 78

APPENDIX 4.2 AREA (KM 2) OF HABITATS IN MANAGEMENT TOOLS THAT DO NOT MEET THE MPA PROTECTION STANDARD IN EACH BIOREGION.
Western North Island
km2
Mataitai
Taiap
ure
Natu
re Reserve
Scientific R
eserve
Other D
OC reserve
Tem
porary clo
sure
No traw
l, danish
seine o
r commercial d
redge
(amateu
r dred
ge allowed)
Two of traw
l, danish
seine
or co
mmercial d
redge
prohibited
One o
f trawl, d
anish
seine
or co
mmercial d
redge
prohibited
Total h
abitat in
bioregio
n
Deep Sand 9.04 65.04 280.44 9,026.1Exposed Shallow Sand 3.53 14.16 6.43 809.69 584.80 1,858.5Deep Mud 0.00 57.87 1,180.0Moderate Shallow Sand 0.44 28.58 311.53 162.52 639.6Estuarine Sand 6.18 20.02 0.23 0.008 484.82 28.32 530.4Mudflat 16.87 55.91 2.07 0.86 423.35 81.67 508.8High Current Shallow Sand 1.61 3.98 135.16 63.14 203.1Upper Slope 185.7Biogenic 4.98 12.37 4.80 3.16 144.90 13.46 165.2Exposed Shallow Reef 2.57 2.85 33.33 28.79 62.9Moderate Shallow Reef 1.01 26.91 15.41 51.0Exposed Beach 0.67 0.28 0.82 33.96 0.59 36.4Estuarine 0.000 0.02 0.02 0.04 0.000 26.2Exposed Shallow Gravel 22.75 22.7Deep Gravel 18.79 18.8Estuarine Beach 0.12 0.18 14.70 0.72 0.00 16.0Shallow Mud 2.53 7.32 10.9Deep Reef 1.04 0.00 0.67 9.8Sheltered Shallow Sand 0.01 7.87 7.9Exposed Rocky Shore 4.68 1.49 6.7High Current Deep Sand 4.53 0.78 5.3Moderate Beach 0.23 1.19 4.01 0.64 4.9Moderate Rocky Shore 0.07 1.30 1.55 3.3High Current Shallow Reef 1.49 0.53 2.0Estuarine Mud 1.95 1.9Estuarine Rocky Shore 1.37 0.04 1.4Sheltered Shallow Reef 0.95 0.35 1.3Estuarine Reef 0.79 0.06 0.8Sheltered Beach 0.54 0.03 0.6High Current Rocky Shore 0.42 0.12 0.5High Current Beach 0.33 0.10 0.4Moderate Shallow Gravel 0.38 0.4Sheltered Rocky Shore 0.08 0.1
DRAFT ONLY 79

APPENDIX 5.1 PERCENTAGE AREA OF HABITATS IN MARINE PROTECTED AREAS IN EACH COASTAL MARINE BIOREGION.
Chatham Islands%
Typ
e I Marin
e Reserve
No-take M
arine P
ark
Cab
le or P
ipelin
e Zone
No traw
l, dan
ish sein
e, dred
ge or setn
et
No traw
l, dan
ish sein
e, dred
ge
Total T
ype II M
PA
Total n
o take
Total M
PA
Hab
itat as % of b
ioregio
n
Deep Mud 39.06
Deep Gravel 31.21
Upper Slope 10.76
Moderate Shallow Gravel 5.12
Exposed Shallow Gravel 3.43
Exposed Shallow Reef 3.38
Deep Reef 2.10
Moderate Shallow Reef 1.55
Mid Slope 1.25
Estuarine Gravel 0.96
Mudflat 0.58
Shallow Mud 0.26
Estuarine 0.14
Exposed Rocky Shore 0.08
Moderate Rocky Shore 0.05
Estuarine Beach 0.03
Moderate Beach 0.03
Exposed Beach 0.02
Estuarine Rocky Shore 0.004
DRAFT ONLY 80

APPENDIX 5.1 PERCENTAGE AREA OF HABITATS IN MARINE PROTECTED AREAS IN EACH COASTAL MARINE BIOREGION.
East Coast South Island%
Typ
e I Marin
e Reserve
No-take M
arine P
ark
Cab
le or P
ipelin
e Zone
No traw
l, dan
ish sein
e, dred
ge or setn
et
No traw
l, dan
ish sein
e, dred
ge
Total T
ype II M
PA
Total n
o take
Total M
PA
Hab
itat as % of b
ioregio
n
Deep Sand 18.80
Deep Mud 17.88
Moderate Shallow Sand 10.91
Shallow Mud 6.41
High Current Deep Sand 6.20
Exposed Shallow Sand 0.1 0.1 0.1 5.72
Moderate Shallow Gravel 4.67
Deep Gravel 4.53
Mid Slope 4.04
Sheltered Shallow Sand 3.97
Upper Slope 2.93
Lower Slope 2.90
High Current Deep Mud 2.74
Estuarine 1.67
Moderate Beach 1.60
Moderate Shallow Reef 1.07
High Current Shallow Sand 0.79
Estuarine Mud 0.65
Exposed Shallow Gravel 0.54
High Current Deep Gravel 0.38
Exposed Shallow Reef 3.6 3.6 3.6 0.28
Sheltered Shallow Reef 0.24
Estuarine Sand 2.7 2.7 2.7 0.20
Mudflat 0.03 0.19
Deep Reef 0.18
Sheltered Shallow Gravel 0.12
Biogenic 0.11
Estuarine Reef 0.5 0.5 0.5 0.11
High Current Shallow Reef 0.07
Moderate Rocky Shore 0.5 0.5 0.03
High Current Shallow Mud 0.02
Sheltered Beach 0.01
Exposed Beach 0.01
Estuarine Beach 0.01
High Current Deep Reef 0.01
Estuarine Rocky Shore 0.003
Exposed Rocky Shore 0.002
High Current Rocky Shore 0.000
DRAFT ONLY 81

APPENDIX 5.1 PERCENTAGE AREA OF HABITATS IN MARINE PROTECTED AREAS IN EACH COASTAL MARINE BIOREGION.
Eastern North Island%
Typ
e I Marin
e Reserve
No-take M
arine P
ark
Cab
le or P
ipelin
e Zone
No traw
l, dan
ish sein
e, dred
ge or setn
et
No traw
l, dan
ish sein
e, dred
ge
Total T
ype II M
PA
Total n
o take
Total M
PA
Hab
itat as % of b
ioregio
n
Exposed Rocky Shore 8.4 8.4 8.4 0.08
Exposed Beach 7.3 7.3 7.3 0.01
Exposed Shallow Reef 5.3 5.3 5.3 1.50
Exposed Shallow Sand 4.6 4.6 4.6 0.44
Moderate Rocky Shore 3.0 3.0 3.0 0.11
Moderate Beach 3.0 3.0 3.0 0.06
Deep Reef 2.6 2.6 2.6 0.95
Moderate Shallow Reef 0.8 0.8 0.8 2.45
Deep Sand 0.5 0.5 0.5 8.18
Moderate Shallow Sand 0.2 0.2 0.2 7.17
Shallow Mud 0.1 0.1 0.1 5.16
Estuarine Beach 0.1 0.1 0.1 0.02
Deep Mud 0.02 0.019 0.0 60.37
Estuarine 0.01 0.005 0.01 0.14
Upper Slope 5.05
Moderate Shallow Gravel 1.88
High Current Deep Mud 1.87
Mid Slope 1.50
Deep Gravel 1.48
Sheltered Shallow Sand 0.89
Lower Slope 0.26
High Current Shallow Reef 0.19
High Current Shallow Mud 0.07
Sheltered Shallow Reef 0.06
Sheltered Shallow Gravel 0.03
High Current Shallow Sand 0.02
High Current Deep Reef 0.02
Mudflat 0.01
Sheltered Shingle 0.01
High Current Deep Sand 0.01
Sheltered Beach 0.01
Sheltered Rocky Shore 0.01
Biogenic 0.01
High Current Rocky Shore 0.003
Estuarine Mud 0.002
Estuarine Sand 0.001
High Current Beach 0.001
Estuarine Reef 0.000
DRAFT ONLY 82

APPENDIX 5.1 PERCENTAGE AREA OF HABITATS IN MARINE PROTECTED AREAS IN EACH COASTAL MARINE BIOREGION.
Fiordland%
Typ
e I Marin
e Reserve
No-take M
arine P
ark
Cab
le or P
ipelin
e Zone
No traw
l, dan
ish sein
e, dred
ge or setn
et
No traw
l, dan
ish sein
e, dred
ge
Total T
ype II M
PA
Total n
o take
Total M
PA
Hab
itat as % of b
ioregio
n
Lower Slope 33.69
Deep Sand 16.84
Upper Slope 16.01
Mid Slope 13.60
Deep Mud 0.02 0.02 0.02 4.51
Estuarine Mud 12.0 60.1 60.1 12.0 72.1 4.48
Exposed Shallow Reef 0.02 0.02 0.02 2.73
High Current Deep Sand 1.96
Estuarine Reef 9.9 34.2 34.2 9.9 44.1 1.68
Estuarine Sand 19.6 27.2 27.2 19.6 46.8 1.48
Deep Reef 0.004 0.004 0.004 1.23
Exposed Shallow Sand 0.59
Shallow Mud 0.1 0.1 0.1 0.51
Deep Gravel 0.24
Exposed Rocky Shore 0.01 0.01 0.01 0.20
Estuarine 1.0 0.1 0.1 1.0 1.0 0.10
Estuarine Beach 14.8 66.0 66.0 14.8 80.8 0.04
Estuarine Rocky Shore 3.4 4.3 4.3 3.4 7.7 0.03
High Current Shallow Reef 0.03
High Current Deep Mud 0.01
Exposed Beach 0.01
High Current Deep Reef 0.01
Mudflat 73.0 26.7 26.7 73.0 99.6 0.01
High Current Shallow Sand 0.003
Sheltered Shallow Reef 33.9 33.9 33.9 0.001
Rocky Shore 0.001
High Current Rocky Shore 0.000
DRAFT ONLY 83

APPENDIX 5.1 PERCENTAGE AREA OF HABITATS IN MARINE PROTECTED AREAS IN EACH COASTAL MARINE BIOREGION.
Kermadec Islands%
Typ
e I Marin
e Reserve
No-take M
arine P
ark
Cab
le or P
ipelin
e Zone
No traw
l, dan
ish sein
e, dred
ge or setn
et
No traw
l, dan
ish sein
e, dred
ge
Total T
ype II M
PA
Total n
o take
Total M
PA
Hab
itat as % of b
ioregio
n
Mid Slope 100 100 100 41.82
Lower Slope 100 100 100 38.69
Upper Slope 100 100 100 13.24
Deep Volcanic 100 100 100 4.82
Exposed Shallow Volcanic 100 100 100 0.42
Moderate Shallow Volcanic 100 100 100 0.36
Deep Reef 100 100 100 0.32
Exposed Shallow Reef 100 100 100 0.23
Moderate Shallow Reef 100 100 100 0.08
Exposed Rocky Shore 100 100 100 0.01
Moderate Rocky Shore 100 100 100 0.01
DRAFT ONLY 84

APPENDIX 5.1 PERCENTAGE AREA OF HABITATS IN MARINE PROTECTED AREAS IN EACH COASTAL MARINE BIOREGION.
North Cook Strait%
Typ
e I Marin
e Reserve
No-take M
arine P
ark
Cab
le or P
ipelin
e Zone
No traw
l, dan
ish sein
e, dred
ge or setn
et
No traw
l, dan
ish sein
e, dred
ge
Total T
ype II M
PA
Total n
o take
Total M
PA
Hab
itat as % of b
ioregio
n
Deep Mud 2.5 2.5 2.5 2.5 23.88
Deep Sand 0.1 0.7 0.7 0.7 0.7 14.82
High Current Deep Sand 1.1 0.8 0.8 1.9 1.9 10.79
Upper Slope 2.4 2.4 2.4 2.4 9.13
Mid Slope 7.99
Lower Slope 5.53
Moderate Shallow Sand 0.2 0.1 0.1 0.3 0.3 5.17
Sheltered Shallow Sand 0.02 0.02 0.02 0.02 3.78
High Current Shallow Sand 0.7 0.2 0.2 0.9 0.9 3.65
High Current Deep Gravel 11.7 11.7 11.7 11.7 3.16
Shallow Mud 0.0 0.04 0.04 0.04 3.03
Exposed Shallow Sand 0.02 0.02 0.02 0.02 1.23
Moderate Shallow Reef 1.8 0.7 0.2 0.9 2.4 2.6 1.21
High Current Deep Mud 2.4 2.4 2.4 1.11
Deep Gravel 16.2 16.2 16.2 16.2 1.09
Exposed Shallow Reef 5.1 5.1 5.1 5.1 0.88
High Current Shallow Gravel 0.80
High Current Shallow Reef 6.4 0.7 0.01 0.7 7.2 7.2 0.39
Estuarine 0.37
Exposed Shallow Gravel 28.4 28.4 28.4 28.4 0.37
Deep Reef 0.2 0.2 0.2 0.31
Moderate Shallow Gravel 0.29
Estuarine Mud 0.26
Sheltered Shallow Reef 7.1 7.1 7.1 7.1 0.15
Sheltered Shallow Gravel 0.09
Estuarine Sand 0.08
Estuarine Reef 0.08
High Current Deep Reef 4.1 6.1 6.1 10.2 10.2 0.07
Moderate Beach 0.06
Sheltered Beach 0.3 0.3 0.3 0.3 0.06
Moderate Rocky Shore 1.4 0.4 1.4 1.8 1.8 3.2 0.05
Exposed Rocky Shore 11.4 11.4 11.4 11.4 0.05
Exposed Beach 8.3 8.3 8.3 8.3 0.02
Sheltered Rocky Shore 25.7 25.7 25.7 25.7 0.01
Biogenic 0.01
High Current Rocky Shore 12.1 12.1 12.1 0.01
Estuarine Beach 0.01
Estuarine Rocky Shore 0.01
High Current Beach 7.1 7.1 7.1 0.01
Mudflat 0.002
DRAFT ONLY 85

APPENDIX 5.1 PERCENTAGE AREA OF HABITATS IN MARINE PROTECTED AREAS IN EACH COASTAL MARINE BIOREGION.
North Eastern%
Typ
e I Marin
e Reserve
No-take M
arine P
ark
Cab
le or P
ipelin
e Zone
No traw
l, dan
ish sein
e, dred
ge or setn
et
No traw
l, dan
ish sein
e, dred
ge
Total T
ype II M
PA
Total n
o take
Total M
PA
Hab
itat as % of b
ioregio
n
Deep Sand 0.1 0.000 3.4 0.004 3.4 3.5 3.5 34.29
Deep Mud 0.0 3.9 0.004 3.9 3.9 3.9 23.22
Upper Slope 0.2 0.2 0.2 9.20
Mid Slope 5.90
Moderate Shallow Sand 0.4 0.1 0.1 0.1 0.3 0.7 0.7 4.98
High Current Deep Sand 4.90
Shallow Mud 0.4 3.9 0.3 4.2 4.3 4.6 3.58
Sheltered Shallow Sand 0.8 0.1 0.1 0.2 0.9 0.9 1.83
Lower Slope 1.74
Moderate Shallow Reef 1.9 0.1 0.4 1.6 2.1 2.4 4.0 1.30
Biogenic 0.7 0.028 2.4 0.1 2.6 3.2 3.3 1.28
High Current Shallow Mud 0.5 0.5 0.5 0.5 0.85
Estuarine Sand 0.9 0.9 0.9 0.84
Deep Reef 5.5 1.5 1.5 7.0 7.0 0.72
High Current Deep Mud 0.71
Mudflat 2.0 1.4 3.4 3.4 0.66
Exposed Shallow Sand 0.61
High Current Shallow Sand 0.1 0.5 0.2 0.7 0.6 0.7 0.60
Deep Gravel 3.7 3.7 3.7 3.7 0.58
High Current Deep Gravel 0.40
Estuarine Beach 0.02 0.1 0.1 0.02 0.1 0.31
Sheltered Shallow Reef 0.9 0.2 0.2 0.4 1.1 1.3 0.29
High Current Shallow Gravel 0.25
High Current Beach 0.1 0.1 0.1 0.11
High Current Shallow Reef 0.2 0.2 0.4 0.2 0.4 0.11
Estuarine Reef 0.2 6.7 6.7 0.2 6.9 0.09
Moderate Beach 0.1 0.4 0.4 0.5 1.2 0.9 1.4 0.09
Estuarine Mud 4.4 4.4 0.02 4.4 0.09
Sheltered Shallow Gravel 0.08
Moderate Shallow Gravel 9.4 9.4 9.4 9.4 0.07
Moderate Rocky Shore 1.4 0.5 0.1 1.2 1.8 2.0 3.2 0.07
Estuarine 0.05
Sheltered Rocky Shore 1.0 0.5 0.0 0.5 1.5 1.5 0.04
Exposed Shallow Gravel 0.04
High Current Deep Reef 0.03
Sheltered Beach 0.3 0.5 0.6 1.2 0.9 1.5 0.02
Exposed Shallow Reef 0.02
Exposed Beach 0.02
Estuarine Rocky Shore 2.3 2.3 2.3 0.01
High Current Rocky Shore 1.3 1.3 1.3 0.01
Exposed Rocky Shore 0.001
Estuarine Gravel 0.001
DRAFT ONLY 86

APPENDIX 5.1 PERCENTAGE AREA OF HABITATS IN MARINE PROTECTED AREAS IN EACH COASTAL MARINE BIOREGION.
Snares Islands%
Typ
e I Marin
e Reserve
No-take M
arine P
ark
Cab
le or P
ipelin
e Zone
No traw
l, dan
ish sein
e, dred
ge or setn
et
No traw
l, dan
ish sein
e, dred
ge
Total T
ype II M
PA
Total n
o take
Total M
PA
Hab
itat as % of b
ioregio
n
Deep Gravel 66.83
Upper Slope 29.22
Mid Slope 3.67
Exposed Shallow Reef 0.11
Exposed Shallow Gravel 0.07
Moderate Shallow Reef 0.03
Deep Reef 0.03
Moderate Shallow Gravel 0.02
Exposed Rocky Shore 0.02
Moderate Rocky Shore 0.000
DRAFT ONLY 87

APPENDIX 5.1 PERCENTAGE AREA OF HABITATS IN MARINE PROTECTED AREAS IN EACH COASTAL MARINE BIOREGION.
South Cook Strait%
Typ
e I Marin
e Reserve
No-take M
arine P
ark
Cab
le or P
ipelin
e Zone
No traw
l, dan
ish sein
e, dred
ge or setn
et
No traw
l, dan
ish sein
e, dred
ge
Total T
ype II M
PA
Total n
o take
Total M
PA
Hab
itat as % of b
ioregio
n
High Current Deep Sand 0.02 1.4 1.4 1.4 1.4 26.21
Deep Mud 0.05 0.05 0.05 17.71
Deep Sand 0.1 0.00 0.1 0.1 0.1 17.09
Shallow Mud 1.8 1.8 1.8 9.62
High Current Deep Gravel 15.6 15.6 15.6 15.6 4.45
Deep Gravel 3.82
Estuarine Mud 0.2 0.2 0.2 2.73
High Current Deep Mud 0.1 0.1 0.1 2.52
Sheltered Shallow Sand 0.01 0.9 0.04 1.0 0.9 1.0 2.50
Estuarine Sand 1.3 1.3 1.3 2.35
High Current Shallow Sand 0.1 0.1 0.005 0.1 0.2 0.2 2.16
Upper Slope 0.04 0.04 0.04 0.04 1.32
Mudflat 2.7 2.7 2.7 1.30
Biogenic 0.1 0.000 0.000 0.1 0.1 0.89
High Current Shallow Mud 0.87
Estuarine Reef 1.5 1.5 1.5 0.82
Exposed Shallow Sand 0.78
Moderate Shallow Sand 0.77
Sheltered Shallow Reef 6.8 1.0 1.7 2.7 7.7 9.4 0.50
High Current Shallow Reef 0.3 0.2 0.2 0.4 0.5 0.7 0.31
High Current Deep Reef 0.02 0.2 0.2 0.2 0.2 0.24
Exposed Shallow Reef 0.20
Deep Reef 0.2 0.0 0.2 0.2 0.2 0.15
Estuarine 0.13
Estuarine Beach 0.2 0.2 0.2 0.12
Moderate Shallow Reef 0.11
High Current Shallow Gravel 0.11
Sheltered Beach 0.6 0.6 0.6 0.09
Exposed Shallow Gravel 0.04
Sheltered Rocky Shore 9.0 2.9 4.8 7.7 11.9 16.7 0.03
Exposed Beach 0.02
Exposed Rocky Shore 0.02
High Current Beach 0.01
Estuarine Rocky Shore 0.01
Sheltered Shallow Gravel 0.01
High Current Rocky Shore 8.8 8.8 8.8 0.002
Estuarine Gravel 0.001
Moderate Beach 0.00
Moderate Rocky Shore 0.000
DRAFT ONLY 88

APPENDIX 5.1 PERCENTAGE AREA OF HABITATS IN MARINE PROTECTED AREAS IN EACH COASTAL MARINE BIOREGION.
Southern South Island%
Typ
e I Marin
e Reserve
No-take M
arine P
ark
Cab
le or P
ipelin
e Zone
No traw
l, dan
ish sein
e, dred
ge or setn
et
No traw
l, dan
ish sein
e, dred
ge
Total T
ype II M
PA
Total n
o take
Total M
PA
Hab
itat as % of b
ioregio
n
Deep Sand 37.64
High Current Deep Sand 0.003 0.01 0.01 0.003 0.01 12.36
Upper Slope 10.46
Deep Gravel 6.00
Exposed Shallow Sand 5.82
High Current Deep Gravel 0.000 0.02 0.02 0.000 0.02 5.54
Moderate Shallow Gravel 4.91
Moderate Shallow Sand 3.34
Deep Mud 2.52
High Current Shallow Sand 0.2 1.1 1.1 0.2 1.4 2.19
High Current Shallow Gravel 0.04 0.2 0.2 0.04 0.2 2.16
Exposed Shallow Reef 1.02
Shallow Mud 0.82
Biogenic 2.6 2.6 2.6 0.75
High Current Shallow Reef 0.7 0.7 0.7 0.7 1.4 0.69
Exposed Shallow Gravel 0.68
Moderate Shallow Reef 0.59
Mudflat 6.9 6.9 6.9 0.47
Estuarine Sand 5.1 16.0 16.0 5.1 21.1 0.36
Deep Reef 0.33
Estuarine 0.000 0.000 0.000 0.21
Estuarine Reef 3.5 33.8 33.8 3.5 37.4 0.21
Estuarine Gravel 1.8 50.5 50.5 1.8 52.2 0.18
High Current Deep Reef 0.15
Estuarine Mud 9.3 88.0 88.0 9.3 97.3 0.13
Sheltered Shallow Sand 0.12
High Current Beach 0.12
Exposed Beach 0.06
Moderate Beach 0.05
Exposed Rocky Shore 0.04
Sheltered Shallow Reef 0.03
Estuarine Beach 0.7 15.6 15.6 0.7 16.2 0.02
Moderate Rocky Shore 0.02
High Current Rocky Shore 0.01
Sheltered Shallow Gravel 0.00
Sheltered Beach 0.002
Estuarine Rocky Shore 2.8 17.9 17.9 2.8 20.8 0.002
Sheltered Rocky Shore 0.000
DRAFT ONLY 89

APPENDIX 5.1 PERCENTAGE AREA OF HABITATS IN MARINE PROTECTED AREAS IN EACH COASTAL MARINE BIOREGION.
Subantarctic Islands%
Typ
e I Marin
e Reserve
No-take M
arine P
ark
Cab
le or P
ipelin
e Zone
No traw
l, dan
ish sein
e, dred
ge or setn
et
No traw
l, dan
ish sein
e, dred
ge
Total T
ype II M
PA
Total n
o take
Total M
PA
Hab
itat as % of b
ioregio
n
Deep Gravel 39.8 40 39.8 48.39
Upper Slope 44.0 44 44.0 14.05
Lower Slope 27.6 27.6 27.6 12.51
Mid Slope 38.9 38.9 38.9 10.67
Deep Mud 99.7 99.7 99.7 4.64
Deep Sand 4.17
Exposed Shallow Gravel 84.1 84.4 84.1 3.00
Moderate Shallow Gravel 83.0 83.2 83.0 0.89
Estuarine Gravel 93.9 94.0 93.9 0.66
Estuarine Reef 85.0 85.7 85.0 0.34
Moderate Shallow Reef 92.0 92.2 92.0 0.26
Exposed Shallow Reef 92.2 92.5 92.2 0.25
Deep Reef 32.0 32.0 32.0 0.08
Exposed Shallow Sand 0.03
Exposed Rocky Shore 69.5 69.5 69.5 0.02
Estuarine Rocky Shore 100 100 100 0.01
Moderate Rocky Shore 91.6 92 92 0.01
Moderate Beach 100 100 100 0.001
Estuarine 100 100 100 0.000
Estuarine Beach 100 100 100 0.000
DRAFT ONLY 90

APPENDIX 5.1 PERCENTAGE AREA OF HABITATS IN MARINE PROTECTED AREAS IN EACH COASTAL MARINE BIOREGION.
Three Kings%
Typ
e I Marin
e Reserve
No-take M
arine P
ark
Cab
le or P
ipelin
e Zone
No traw
l, dan
ish sein
e, dred
ge or setn
et
No traw
l, dan
ish sein
e, dred
ge
Total T
ype II M
PA
Total n
o take
Total M
PA
Hab
itat as % of b
ioregio
n
Upper Slope 41.57
High Current Deep Sand 35.78
Mid Slope 21.13
High Current Deep Reef 0.63
High Current Deep Gravel 0.40
Deep Sand 0.28
High Current Shallow Reef 0.21
High Current Rocky Shore 0.001
DRAFT ONLY 91

APPENDIX 5.1 PERCENTAGE AREA OF HABITATS IN MARINE PROTECTED AREAS IN EACH COASTAL MARINE BIOREGION.
West Coast South Island%
Typ
e I Marin
e Reserve
No-take M
arine P
ark
Cab
le or P
ipelin
e Zone
No traw
l, dan
ish sein
e, dred
ge or setn
et
No traw
l, dan
ish sein
e, dred
ge
Total T
ype II M
PA
Total n
o take
Total M
PA
Hab
itat as % of b
ioregio
n
Deep Mud 45.81
Deep Sand 15.52
Exposed Shallow Sand 12.55
Mid Slope 6.53
Lower Slope 5.88
Upper Slope 4.44
Shallow Mud 3.74
Moderate Shallow Sand 3.19
Exposed Shallow Reef 0.94
Deep Reef 0.57
Estuarine 0.31
Deep Gravel 0.16
Exposed Beach 0.09
Moderate Shallow Reef 0.09
Exposed Rocky Shore 0.04
Estuarine Beach 0.04
Biogenic 0.03
Moderate Beach 0.03
Mudflat 0.01
Estuarine Sand 0.01
Exposed Shallow Gravel 0.01
Moderate Rocky Shore 0.01
DRAFT ONLY 92

APPENDIX 5.1 PERCENTAGE AREA OF HABITATS IN MARINE PROTECTED AREAS IN EACH COASTAL MARINE BIOREGION.
Western North Island%
Typ
e I Marin
e Reserve
No-take M
arine P
ark
Cab
le or P
ipelin
e Zone
No traw
l, dan
ish sein
e, dred
ge or setn
et
No traw
l, dan
ish sein
e, dred
ge
Total T
ype II M
PA
Total n
o take
Total M
PA
Hab
itat as % of b
ioregio
n
Deep Sand 0.004 2.9 0.001 2.9 2.9 2.9 61.87
Exposed Shallow Sand 0.001 2.9 0.02 2.9 2.9 2.9 12.74
Deep Mud 8.09
Moderate Shallow Sand 3.9 1.1 0.2 1.3 4.9 5.1 4.38
Estuarine Sand 3.64
Mudflat 3.49
High Current Shallow Sand 1.39
Upper Slope 1.27
Biogenic 1.13
Exposed Shallow Reef 0.002 0.002 0.002 0.002 0.43
Moderate Shallow Reef 12.6 2.8 2.8 12.6 15.4 0.35
Exposed Beach 2.7 2.7 2.7 2.7 0.25
Estuarine 0.18
Exposed Shallow Gravel 0.16
Deep Gravel 0.13
Estuarine Beach 0.11
Shallow Mud 1.4 8.5 8.5 1.4 9.8 0.07
Deep Reef 0.07
Sheltered Shallow Sand 0.05
Exposed Rocky Shore 7.2 7.2 7.2 7.2 0.05
High Current Deep Sand 0.04
Moderate Beach 2.4 1.9 0.6 2.5 4.3 4.9 0.03
Moderate Rocky Shore 12.9 12.9 12.9 0.02
High Current Shallow Reef 0.01
Estuarine Mud 0.01
Estuarine Rocky Shore 0.01
Sheltered Shallow Reef 0.01
Estuarine Reef 0.01
Sheltered Beach 0.004
High Current Rocky Shore 0.004
High Current Beach 0.003
Moderate Shallow Gravel 0.003
Sheltered Rocky Shore 0.001
DRAFT ONLY 93

APPENDIX 5.2 PERCENTAGE AREA OF HABITATS IN MANAGEMENT TOOLS THAT DO NOT MEET THE MPA PROTECTION STANDARD IN EACH COASTAL MARINE BIOREGION.
Chatham Islands%
Mataitai
Taiap
ure
Natu
re Reserve
Scientific R
eserve
Oth
er DO
C reserve
Tem
po
rary closu
re
No
trawl, d
anish
seine o
r co
mm
ercial dred
ge (am
ateur d
redge allo
wed
)
Tw
o o
f trawl, d
anish
seine
or co
mm
ercial dred
ge p
roh
ibited
On
e of traw
l, dan
ish sein
e o
r com
mercial d
redge
pro
hib
ited
Hab
itat as % o
f bio
region
Deep Mud 0.3 39.06
Deep Gravel 14.0 31.21
Upper Slope 10.76
Moderate Shallow Gravel 0.1 76.9 5.12
Exposed Shallow Gravel 0.0 73.1 3.43
Exposed Shallow Reef 0.1 74.3 3.38
Deep Reef 11.6 2.10
Moderate Shallow Reef 0.3 81.4 1.55
Mid Slope 1.25
Estuarine Gravel 0.1 5.2 0.96
Mudflat 0.58
Shallow Mud 2.4 0.26
Estuarine 2.4 0.14
Exposed Rocky Shore 1.3 1.3 93.6 0.08
Moderate Rocky Shore 1.2 4.1 94.7 0.05
Estuarine Beach 0.6 1.8 0.03
Moderate Beach 2.2 97.8 0.03
Exposed Beach 0.6 99.4 0.02
Estuarine Rocky Shore 3.2 96.4 0.004
DRAFT ONLY 94

APPENDIX 5.2 PERCENTAGE AREA OF HABITATS IN MANAGEMENT TOOLS THAT DO NOT MEET THE MPA PROTECTION STANDARD IN EACH COASTAL MARINE BIOREGION.
East Coast South Island%
Mataitai
Taiap
ure
Natu
re Reserve
Scientific R
eserve
Oth
er DO
C reserve
Tem
po
rary closu
re
No
trawl, d
anish
seine o
r co
mm
ercial dred
ge (am
ateur d
redge allo
wed
)
Tw
o o
f trawl, d
anish
seine
or co
mm
ercial dred
ge p
roh
ibited
On
e of traw
l, dan
ish sein
e o
r com
mercial d
redge
pro
hib
ited
Hab
itat as % o
f bio
region
Deep Sand 0.01 0.04 18.80
Deep Mud 0.7 17.88
Moderate Shallow Sand 0.1 0.002 0.0 10.91
Shallow Mud 0.01 0.01 6.41
High Current Deep Sand 6.20
Exposed Shallow Sand 0.2 0.0 5.72
Moderate Shallow Gravel 4.67
Deep Gravel 4.53
Mid Slope 4.04
Sheltered Shallow Sand 3.97
Upper Slope 2.93
Lower Slope 2.90
High Current Deep Mud 2.74
Estuarine 0.1 1.67
Moderate Beach 0.1 1.60
Moderate Shallow Reef 0.3 1.07
High Current Shallow Sand 2.0 2.7 0.79
Estuarine Mud 9.9 30.9 33.2 10.6 0.65
Exposed Shallow Gravel 0.54
High Current Deep Gravel 0.38
Exposed Shallow Reef 3.9 0.4 0.28
Sheltered Shallow Reef 0.1 0.1 0.24
Estuarine Sand 34.5 0.8 52.8 0.20
Mudflat 0.6 5.9 3.1 6.3 0.7 0.19
Deep Reef 0.2 0.18
Sheltered Shallow Gravel 0.12
Biogenic 0.1 0.11
Estuarine Reef 3.6 24.6 33.9 3.8 0.11
High Current Shallow Reef 3.4 4.1 0.07
Moderate Rocky Shore 1.1 0.5 0.03
High Current Shallow Mud 0.02
Sheltered Beach 0.01
Exposed Beach 0.01
Estuarine Beach 0.8 1.2 5.8 12.1 0.9 0.01
High Current Deep Reef 0.01
Estuarine Rocky Shore 3.1 0.003
Exposed Rocky Shore 0.002
High Current Rocky Shore 0.000
DRAFT ONLY 95

APPENDIX 5.2 PERCENTAGE AREA OF HABITATS IN MANAGEMENT TOOLS THAT DO NOT MEET THE MPA PROTECTION STANDARD IN EACH COASTAL MARINE BIOREGION.
Eastern North Island%
Mataitai
Taiap
ure
Natu
re Reserve
Scientific R
eserve
Oth
er DO
C reserve
Tem
po
rary closu
re
No
trawl, d
anish
seine o
r co
mm
ercial dred
ge (am
ateur d
redge allo
wed
)
Tw
o o
f trawl, d
anish
seine
or co
mm
ercial dred
ge p
roh
ibited
On
e of traw
l, dan
ish sein
e o
r com
mercial d
redge
pro
hib
ited
Hab
itat as % o
f bio
region
Deep Mud 0.2 0.1 8.8 60.37
Deep Sand 7.9 28.8 8.18
Moderate Shallow Sand 0.3 2.0 7.2 12.5 61.3 7.17
Shallow Mud 0.5 1.5 0.1 11.8 2.0 55.9 5.16
Upper Slope 5.05
Moderate Shallow Reef 2.9 10.6 10.2 1.0 87.9 2.45
Moderate Shallow Gravel 64.2 24.6 1.88
High Current Deep Mud 0.003 10.4 1.87
Mid Slope 1.50
Exposed Shallow Reef 27.8 62.8 1.50
Deep Gravel 24.6 1.48
Deep Reef 10.5 19.2 0.95
Sheltered Shallow Sand 0.3 15.1 10.4 74.4 0.89
Exposed Shallow Sand 29.0 66.3 0.44
Lower Slope 0.26
High Current Shallow Reef 0.8 99.2 0.19
Estuarine 12.4 26.7 3.5 1.4 0.14
Moderate Rocky Shore 1.2 4.1 26.7 0.3 69.9 0.11
Exposed Rocky Shore 39.3 52.3 0.08
High Current Shallow Mud 3.0 97.0 0.07
Moderate Beach 2.1 10.1 0.6 12.3 10.9 73.7 0.06
Sheltered Shallow Reef 7.7 51.7 7.2 40.7 0.06
Sheltered Shallow Gravel 100.0 0.03
High Current Shallow Sand 65.4 34.6 0.02
High Current Deep Reef 100.0 0.02
Estuarine Beach 3.6 0.0 0.02
Exposed Beach 4.8 87.8 0.01
Mudflat 7.1 5.8 18.8 0.01
Sheltered Shingle 53.6 46.3 0.01
High Current Deep Sand 16.2 83.8 0.01
Sheltered Beach 8.9 26.9 72.9 0.01
Sheltered Rocky Shore 100 0.01
Biogenic 21.9 56.4 5.2 0.1 0.01
High Current Rocky Shore 100 0.003
Estuarine Mud 100 0.002
Estuarine Sand 100 0.001
High Current Beach 100 0.001
Estuarine Reef 100 0.000
DRAFT ONLY 96

APPENDIX 5.2 PERCENTAGE AREA OF HABITATS IN MANAGEMENT TOOLS THAT DO NOT MEET THE MPA PROTECTION STANDARD IN EACH COASTAL MARINE BIOREGION.
Fiordland%
Mataitai
Taiap
ure
Natu
re Reserve
Scientific R
eserve
Oth
er DO
C reserve
Tem
po
rary closu
re
No
trawl, d
anish
seine o
r co
mm
ercial dred
ge (am
ateur d
redge allo
wed
)
Tw
o o
f trawl, d
anish
seine
or co
mm
ercial dred
ge p
roh
ibited
On
e of traw
l, dan
ish sein
e o
r com
mercial d
redge
pro
hib
ited
Hab
itat as % o
f bio
region
Lower Slope 33.69
Deep Sand 0.3 16.84
Upper Slope 16.01
Mid Slope 13.60
Deep Mud 0.2 4.51
Estuarine Mud 21.7 4.48
Exposed Shallow Reef 2.9 2.73
High Current Deep Sand 1.4 1.96
Estuarine Reef 46.3 1.68
Estuarine Sand 53.2 1.48
Deep Reef 2.9 1.23
Exposed Shallow Sand 0.9 0.59
Shallow Mud 0.002 0.51
Deep Gravel 0.24
Exposed Rocky Shore 4.4 0.20
Estuarine 0.000 0.10
Estuarine Beach 9.3 0.04
Estuarine Rocky Shore 76.8 0.03
High Current Shallow Reef 43.0 0.03
High Current Deep Mud 0.01
Exposed Beach 0.01
High Current Deep Reef 28.0 0.01
Mudflat 0.01
High Current Shallow Sand 12.2 0.003
Sheltered Shallow Reef 0.001
Rocky Shore 0.001
High Current Rocky Shore 100 0.000
DRAFT ONLY 97

APPENDIX 5.2 PERCENTAGE AREA OF HABITATS IN MANAGEMENT TOOLS THAT DO NOT MEET THE MPA PROTECTION STANDARD IN EACH COASTAL MARINE BIOREGION.
Kermadec Islands%
Mataitai
Taiap
ure
Natu
re Reserve
Scientific R
eserve
Oth
er DO
C reserve
Tem
po
rary closu
re
No
trawl, d
anish
seine o
r co
mm
ercial dred
ge (am
ateur d
redge allo
wed
)
Tw
o o
f trawl, d
anish
seine
or co
mm
ercial dred
ge p
roh
ibited
On
e of traw
l, dan
ish sein
e o
r com
mercial d
redge
pro
hib
ited
Hab
itat as % o
f bio
region
Mid Slope 41.82
Lower Slope 38.69
Upper Slope 13.24
Deep Volcanic 4.82
Exposed Shallow Volcanic 0.42
Moderate Shallow Volcanic 0.36
Deep Reef 0.32
Exposed Shallow Reef 0.23
Moderate Shallow Reef 0.08
Exposed Rocky Shore 0.01
Moderate Rocky Shore 0.01
DRAFT ONLY 98

APPENDIX 5.2 PERCENTAGE AREA OF HABITATS IN MANAGEMENT TOOLS THAT DO NOT MEET THE MPA PROTECTION STANDARD IN EACH COASTAL MARINE BIOREGION.
North Cook Strait%
Mataitai
Taiap
ure
Natu
re Reserve
Scientific R
eserve
Oth
er DO
C reserve
Tem
po
rary closu
re
No
trawl, d
anish
seine o
r co
mm
ercial dred
ge (am
ateur d
redge allo
wed
)
Tw
o o
f trawl, d
anish
seine
or co
mm
ercial dred
ge p
roh
ibited
On
e of traw
l, dan
ish sein
e o
r com
mercial d
redge
pro
hib
ited
Hab
itat as % o
f bio
region
Deep Mud 17.3 23.88
Deep Sand 11.3 14.82
High Current Deep Sand 14.2 10.79
Upper Slope 3.8 9.13
Mid Slope 0.8 7.99
Lower Slope 5.53
Moderate Shallow Sand 0.03 60.0 5.17
Sheltered Shallow Sand 0.001 0.1 0.5 84.6 3.78
High Current Shallow Sand 0.00 0.02 32.1 3.65
High Current Deep Gravel 12.4 3.16
Shallow Mud 0.2 98.8 3.03
Exposed Shallow Sand 33.5 1.23
Moderate Shallow Reef 1.3 0.2 0.000 93.8 1.21
High Current Deep Mud 56.8 1.11
Deep Gravel 52.8 1.09
Exposed Shallow Reef 93.8 0.88
High Current Shallow Gravel 4.4 0.80
High Current Shallow Reef 0.1 0.01 50.3 0.39
Estuarine 0.001 69.5 0.0 0.37
Exposed Shallow Gravel 71.6 0.37
Deep Reef 43.0 0.31
Moderate Shallow Gravel 70.0 0.29
Estuarine Mud 99.6 0.4 0.26
Sheltered Shallow Reef 0.2 4.0 60.6 0.15
Sheltered Shallow Gravel 32.9 0.09
Estuarine Sand 7.2 82.4 17.6 0.08
Estuarine Reef 0.003 88.3 11.7 0.08
High Current Deep Reef 28.6 0.07
Moderate Beach 0.2 0.04 0.000 99.9 0.06
Sheltered Beach 0.3 0.005 0.5 0.4 98.4 0.06
Moderate Rocky Shore 0.2 0.5 96.3 0.05
Exposed Rocky Shore 88.5 0.05
Exposed Beach 91.7 0.02
Sheltered Rocky Shore 2.2 17.0 55.0 0.01
Biogenic 39.6 100 0.01
High Current Rocky Shore 25.2 26.2 29.2 0.01
Estuarine Beach 13.8 28.7 0.01
Estuarine Rocky Shore 7.0 86.7 6.2 0.01
High Current Beach 23.6 0.1 62.7 0.01
Mudflat 18.3 100 0.002
DRAFT ONLY 99

APPENDIX 5.2 PERCENTAGE AREA OF HABITATS IN MANAGEMENT TOOLS THAT DO NOT MEET THE MPA PROTECTION STANDARD IN EACH COASTAL MARINE BIOREGION.
North Eastern%
Mataitai
Taiap
ure
Natu
re Reserve
Scientific R
eserve
Oth
er DO
C reserve
Tem
po
rary closu
re
No
trawl, d
anish
seine o
r co
mm
ercial dred
ge (am
ateur d
redge allo
wed
)
Tw
o o
f trawl, d
anish
seine
or co
mm
ercial dred
ge p
roh
ibited
On
e of traw
l, dan
ish sein
e o
r com
mercial d
redge
pro
hib
ited
Hab
itat as % o
f bio
region
Deep Sand 0.04 0.000 0.5 5.5 0.1 34.29
Deep Mud 0.005 0.8 6.1 2.3 23.22
Upper Slope 9.20
Mid Slope 5.90
Moderate Shallow Sand 0.2 1.5 0.002 11.4 39.5 2.1 4.98
High Current Deep Sand 10.8 5.6 4.90
Shallow Mud 0.9 0.7 0.0 51.7 15.8 5.1 3.58
Sheltered Shallow Sand 0.001 50.5 42.4 0.8 1.83
Lower Slope 1.74
Moderate Shallow Reef 0.9 1.2 0.2 10.0 19.9 7.3 1.30
Biogenic 1.2 0.8 0.0 0.1 60.9 16.0 1.5 1.28
High Current Shallow Mud 0.0 92.3 4.3 2.5 0.85
Estuarine Sand 3.6 0.1 88.4 6.3 2.2 0.84
Deep Reef 0.00 0.3 7.5 4.0 0.72
High Current Deep Mud 0.1 2.4 8.3 0.71
Mudflat 1.0 6.0 1.4 0.02 77.3 11.1 0.6 0.66
Exposed Shallow Sand 48.9 0.61
High Current Shallow Sand 0.5 23.9 32.0 0.60
Deep Gravel 0.4 3.6 0.58
High Current Deep Gravel 0.1 0.4 0.40
Estuarine Beach 1.6 19.9 75.5 1.3 0.31
Sheltered Shallow Reef 0.0 58.6 15.3 0.6 0.29
High Current Shallow Gravel 0.001 59.0 0.3 0.25
High Current Beach 3.9 1.4 98.2 0.11
High Current Shallow Reef 0.8 0.03 30.2 1.6 17.1 0.11
Estuarine Reef 0.2 0.1 52.6 0.4 8.1 0.09
Moderate Beach 1.0 4.2 16.7 41.5 4.2 0.09
Estuarine Mud 5.5 0.000 0.02 42.4 25.5 11.0 0.09
Sheltered Shallow Gravel 100.0 0.08
Moderate Shallow Gravel 21.4 2.3 0.07
Moderate Rocky Shore 0.6 0.6 3.1 19.3 20.6 16.9 0.07
Estuarine 0.05 0.2 0.6 0.04 0.000 0.05
Sheltered Rocky Shore 79.9 9.0 1.2 0.04
Exposed Shallow Gravel 0.04
High Current Deep Reef 0.9 2.0 0.03
Sheltered Beach 0.01 46.8 22.5 0.3 0.02
Exposed Shallow Reef 9.3 35.2 0.02
Exposed Beach 91.7 1.5 0.02
Estuarine Rocky Shore 63.2 1.3 6.1 0.01
High Current Rocky Shore 88.6 0.01
Exposed Rocky Shore 11.4 16.4 0.001
Estuarine Gravel 77.8 0.001
DRAFT ONLY 100

APPENDIX 5.2 PERCENTAGE AREA OF HABITATS IN MANAGEMENT TOOLS THAT DO NOT MEET THE MPA PROTECTION STANDARD IN EACH COASTAL MARINE BIOREGION.
Snares Islands%
Mataitai
Taiap
ure
Natu
re Reserve
Scientific R
eserve
Oth
er DO
C reserve
Tem
po
rary closu
re
No
trawl, d
anish
seine o
r co
mm
ercial dred
ge (am
ateur d
redge allo
wed
)
Tw
o o
f trawl, d
anish
seine
or co
mm
ercial dred
ge p
roh
ibited
On
e of traw
l, dan
ish sein
e o
r com
mercial d
redge
pro
hib
ited
Hab
itat as % o
f bio
region
Deep Gravel 66.83
Upper Slope 29.22
Mid Slope 3.67
Exposed Shallow Reef 0.11
Exposed Shallow Gravel 0.07
Moderate Shallow Reef 0.03
Deep Reef 0.03
Moderate Shallow Gravel 0.02
Exposed Rocky Shore 100 0.02
Moderate Rocky Shore 100 0.000
DRAFT ONLY 101

APPENDIX 5.2 PERCENTAGE AREA OF HABITATS IN MANAGEMENT TOOLS THAT DO NOT MEET THE MPA PROTECTION STANDARD IN EACH COASTAL MARINE BIOREGION.
South Cook Strait%
Mataitai
Taiap
ure
Natu
re Reserve
Scientific R
eserve
Oth
er DO
C reserve
Tem
po
rary closu
re
No
trawl, d
anish
seine o
r co
mm
ercial dred
ge (am
ateur d
redge allo
wed
)
Tw
o o
f trawl, d
anish
seine
or co
mm
ercial dred
ge p
roh
ibited
On
e of traw
l, dan
ish sein
e o
r com
mercial d
redge
pro
hib
ited
Hab
itat as % o
f bio
region
High Current Deep Sand 0.000 0.1 0.8 26.21
Deep Mud 3.3 17.71
Deep Sand 17.09
Shallow Mud 1.3 0.03 0.3 0.5 1.4 9.62
High Current Deep Gravel 0.9 4.45
Deep Gravel 3.82
Estuarine Mud 0.000 16.7 19.0 19.8 2.73
High Current Deep Mud 6.2 0.1 2.52
Sheltered Shallow Sand 2.2 0.8 0.01 0.6 0.1 2.50
Estuarine Sand 0.000 5.3 16.3 15.3 22.9 2.35
High Current Shallow Sand 1.7 0.002 0.2 0.3 4.0 14.1 2.16
Upper Slope 1.32
Mudflat 27.4 7.1 3.1 25.1 1.30
Biogenic 35.1 5.5 49.2 6.8 0.89
High Current Shallow Mud 0.3 5.3 17.2 0.87
Estuarine Reef 0.02 17.3 13.5 23.9 0.82
Exposed Shallow Sand 0.4 0.2 0.2 0.78
Moderate Shallow Sand 2.1 0.77
Sheltered Shallow Reef 1.4 13.4 0.4 7.1 0.50
High Current Shallow Reef 0.4 0.1 2.4 16.7 10.0 0.31
High Current Deep Reef 0.2 1.1 3.6 0.24
Exposed Shallow Reef 0.4 0.1 0.4 0.20
Deep Reef 2.9 0.15
Estuarine 0.3 0.02 0.13
Estuarine Beach 0.1 0.9 4.1 9.6 7.9 0.12
Moderate Shallow Reef 0.11
High Current Shallow Gravel 7.3 0.11
Sheltered Beach 0.7 0.9 2.4 1.1 0.09
Exposed Shallow Gravel 0.04
Sheltered Rocky Shore 16.5 5.9 0.8 3.5 0.03
Exposed Beach 7.9 4.9 3.4 0.02
Exposed Rocky Shore 0.02
High Current Beach 57.9 19.7 22.5 0.01
Estuarine Rocky Shore 72.1 6.2 0.01
Sheltered Shallow Gravel 0.01
High Current Rocky Shore 0.002
Estuarine Gravel 0.001
Moderate Beach 42.9 0.00
Moderate Rocky Shore 0.000
DRAFT ONLY 102

APPENDIX 5.2 PERCENTAGE AREA OF HABITATS IN MANAGEMENT TOOLS THAT DO NOT MEET THE MPA PROTECTION STANDARD IN EACH COASTAL MARINE BIOREGION.
Southern South Island%
Mataitai
Taiap
ure
Natu
re Reserve
Scientific R
eserve
Oth
er DO
C reserve
Tem
po
rary closu
re
No
trawl, d
anish
seine o
r co
mm
ercial dred
ge (am
ateur d
redge allo
wed
)
Tw
o o
f trawl, d
anish
seine
or co
mm
ercial dred
ge p
roh
ibited
On
e of traw
l, dan
ish sein
e o
r com
mercial d
redge
pro
hib
ited
Hab
itat as % o
f bio
region
Deep Sand 0.1 37.64
High Current Deep Sand 0.01 0.1 0.2 0.1 12.36
Upper Slope 10.46
Deep Gravel 0.0 6.00
Exposed Shallow Sand 0.05 0.001 0.4 5.82
High Current Deep Gravel 0.01 0.1 0.1 5.54
Moderate Shallow Gravel 0.2 4.91
Moderate Shallow Sand 0.6 0.03 0.5 3.34
Deep Mud 2.52
High Current Shallow Sand 1.1 0.02 0.6 1.1 0.5 2.19
High Current Shallow Gravel 0.2 0.1 0.8 1.3 2.16
Exposed Shallow Reef 0.7 0.1 2.0 1.02
Shallow Mud 0.82
Biogenic 2.3 0.0 0.1 0.2 3.5 0.75
High Current Shallow Reef 0.7 0.05 0.4 1.5 2.5 0.69
Exposed Shallow Gravel 0.002 1.7 0.68
Moderate Shallow Reef 0.8 2.5 0.2 4.2 0.59
Mudflat 9.6 1.2 1.6 4.5 48.8 4.1 0.47
Estuarine Sand 15.4 0.2 30.4 0.1 0.36
Deep Reef 0.33
Estuarine 0.1 4.0 26.8 8.1 0.041 1.0 0.21
Estuarine Reef 24.4 1.1 2.9 0.21
Estuarine Gravel 43.8 3.4 4.1 0.18
High Current Deep Reef 1.9 1.1 0.15
Estuarine Mud 65.2 19.2 0.5 0.13
Sheltered Shallow Sand 10.4 1.8 0.12
High Current Beach 0.7 96.4 0.5 0.12
Exposed Beach 0.8 0.3 0.04 1.4 0.06
Moderate Beach 1.6 2.6 0.000 0.02 2.4 2.6 0.05
Exposed Rocky Shore 1.3 1.5 2.0 0.04
Sheltered Shallow Reef 68.5 17.5 0.03
Estuarine Beach 14.2 1.6 0.4 0.8 3.1 6.3 0.02
Moderate Rocky Shore 7.2 0.6 8.8 0.02
High Current Rocky Shore 0.1 2 0.6 0.01
Sheltered Shallow Gravel 100.0 0.00
Sheltered Beach 30.3 3.9 57.0 0.002
Estuarine Rocky Shore 16.6 0.002
Sheltered Rocky Shore 52.4 46 0.000
DRAFT ONLY 103

APPENDIX 5.2 PERCENTAGE AREA OF HABITATS IN MANAGEMENT TOOLS THAT DO NOT MEET THE MPA PROTECTION STANDARD IN EACH COASTAL MARINE BIOREGION.
Subantarctic Islands%
Mataitai
Taiap
ure
Natu
re Reserve
Scientific R
eserve
Oth
er DO
C reserve
No
trawl, d
anish
seine o
r co
mm
ercial dred
ge (am
ateur d
redge allo
wed
)
Tw
o o
f trawl, d
anish
seine
or co
mm
ercial dred
ge p
roh
ibited
On
e of traw
l, dan
ish sein
e o
r com
mercial d
redge
pro
hib
ited
Hab
itat as % o
f bio
region
Deep Gravel 60 48.39
Upper Slope 56.0 14.05
Lower Slope 68.5 12.51
Mid Slope 53.0 10.67
Deep Mud 0.3 4.64
Deep Sand 100 4.17
Exposed Shallow Gravel 16 3.00
Moderate Shallow Gravel 16.8 0.89
Estuarine Gravel 6.0 0.66
Estuarine Reef 14.3 0.34
Moderate Shallow Reef 7.8 0.26
Exposed Shallow Reef 7.5 0.25
Deep Reef 68.0 0.08
Exposed Shallow Sand 100 0.03
Exposed Rocky Shore 30.0 0.5 0.02
Estuarine Rocky Shore 0.01
Moderate Rocky Shore 8.3 0.1 0.01
Moderate Beach 0.001
Estuarine 0.000
Estuarine Beach 0.000
DRAFT ONLY 104

APPENDIX 5.2 PERCENTAGE AREA OF HABITATS IN MANAGEMENT TOOLS THAT DO NOT MEET THE MPA PROTECTION STANDARD IN EACH COASTAL MARINE BIOREGION.
Three Kings%
Mataitai
Taiap
ure
Natu
re Reserve
Scientific R
eserve
Oth
er DO
C reserve
Tem
po
rary closu
re
No
trawl, d
anish
seine o
r co
mm
ercial dred
ge (am
ateur d
redge allo
wed
)
Tw
o o
f trawl, d
anish
seine
or co
mm
ercial dred
ge p
roh
ibited
On
e of traw
l, dan
ish sein
e o
r com
mercial d
redge
pro
hib
ited
Hab
itat as % o
f bio
region
Upper Slope 41.57
High Current Deep Sand 35.78
Mid Slope 21.13
High Current Deep Reef 0.63
High Current Deep Gravel 0.40
Deep Sand 0.28
High Current Shallow Reef 0.21
High Current Rocky Shore 100 0.001
DRAFT ONLY 105

APPENDIX 5.2 PERCENTAGE AREA OF HABITATS IN MANAGEMENT TOOLS THAT DO NOT MEET THE MPA PROTECTION STANDARD IN EACH COASTAL MARINE BIOREGION.
West Coast South Island%
Mataitai
Taiap
ure
Natu
re Reserve
Scientific R
eserve
Oth
er DO
C reserve
No
trawl, d
anish
seine o
r co
mm
ercial dred
ge (am
ateur d
redge allo
wed
)
Tw
o o
f trawl, d
anish
seine
or co
mm
ercial dred
ge p
roh
ibited
On
e of traw
l, dan
ish sein
e o
r com
mercial d
redge
pro
hib
ited
Hab
itat as % o
f bio
region
Deep Mud 45.81
Deep Sand 15.52
Exposed Shallow Sand 0.01 12.55
Mid Slope 6.53
Lower Slope 5.88
Upper Slope 4.44
Shallow Mud 3.74
Moderate Shallow Sand 3.19
Exposed Shallow Reef 0.94
Deep Reef 0.57
Estuarine 2.7 0.31
Deep Gravel 0.16
Exposed Beach 0.04 0.09
Moderate Shallow Reef 0.01 0.09
Exposed Rocky Shore 0.04
Estuarine Beach 3.2 0.04
Biogenic 2.3 0.03
Moderate Beach 0.03
Mudflat 7.5 0.01
Estuarine Sand 0.8 0.01
Exposed Shallow Gravel 0.01
Moderate Rocky Shore 0.01
DRAFT ONLY 106

APPENDIX 5.2 PERCENTAGE AREA OF HABITATS IN MANAGEMENT TOOLS THAT DO NOT MEET THE MPA PROTECTION STANDARD IN EACH COASTAL MARINE BIOREGION.
Western North Island%
Mataitai
Taiap
ure
Natu
re Reserve
Scientific R
eserve
Oth
er DO
C reserve
Tem
po
rary closu
re
No
trawl, d
anish
seine o
r co
mm
ercial dred
ge (am
ateur d
redge allo
wed
)
Tw
o o
f trawl, d
anish
seine
or co
mm
ercial dred
ge p
roh
ibited
On
e of traw
l, dan
ish sein
e o
r com
mercial d
redge
pro
hib
ited
Hab
itat as % o
f bio
region
Deep Sand 0.1 0.7 3.1 61.87
Exposed Shallow Sand 0.2 0.8 0.3 43.6 31.5 12.74
Deep Mud 0.0 5 8.09
Moderate Shallow Sand 0.1 4.5 48.7 25.4 4.38
Estuarine Sand 1.2 3.8 0.04 0.001 91.4 5.3 3.64
Mudflat 3.3 11.0 0.4 0.2 83.2 16.1 3.49
High Current Shallow Sand 0.8 2.0 66.5 31.1 1.39
Upper Slope 1.27
Biogenic 3.0 7.5 2.9 1.9 87.7 8.2 1.13
Exposed Shallow Reef 4.1 4.5 53.0 45.8 0.43
Moderate Shallow Reef 2.0 52.7 30.2 0.35
Exposed Beach 1.9 0.8 2.3 93.4 1.6 0.25
Estuarine 0.0 0.1 0.1 0.2 0.0 0.18
Exposed Shallow Gravel 100 0.16
Deep Gravel 100 0.13
Estuarine Beach 0.8 1.1 91.9 5 0.0 0.11
Shallow Mud 23.1 67.0 0.07
Deep Reef 10.6 0.007 6.8 0.07
Sheltered Shallow Sand 0.1 100 0.05
Exposed Rocky Shore 70.3 22.4 0.05
High Current Deep Sand 85.4 14.6 0.04
Moderate Beach 4.7 24.3 82.0 13.1 0.03
Moderate Rocky Shore 2.1 39.7 47.4 0.02
High Current Shallow Reef 73.7 26.3 0.01
Estuarine Mud 100 0.01
Estuarine Rocky Shore 97.0 3.0 0.01
Sheltered Shallow Reef 73.2 26.7 0.01
Estuarine Reef 93.5 6.5 0.01
Sheltered Beach 95.5 4.4 0.004
High Current Rocky Shore 78.3 21.7 0.004
High Current Beach 76.9 23.0 0.003
Moderate Shallow Gravel 100 0.003
Sheltered Rocky Shore 99.8 0.001
DRAFT ONLY 107

Appendix 6.1 Number of habitats that have greater
than 0 or 1 % of their area in MPAs
for each coastal marine bioregion.
Number of different habitats with greater than 0 or 1% of
their bioregional area in MPAsT
ype I M
arine R
eserve
No
-take Marin
e Park
Cab
le or p
ipelin
e zon
e
No
trawl, d
anish
seine, d
redge o
r setnet
No
trawl, d
anish
seine, d
redge
To
tal Typ
e II MP
A
To
tal no
take
To
tal MP
A
Chatham Islands >0% 0 0 0 0 0 0 0 0
Chatham Islands >1% 0 0 0 0 0 0 0 0
Chatham Islands Total 18 18 18 18 18 18 18 18
East Coast South Island >0% 5 0 0 0 0 0 5 5
East Coast South Island >1% 2 0 0 0 0 0 2 2
East Coast South Island Total 37 37 37 37 37 37 37 37
Eastern North Island >0% 13 0 0 0 0 0 13 13
Eastern North Island >1% 7 0 0 0 0 0 7 7
Eastern North Island Total 36 36 36 36 36 36 36 36
Fiordland >0% 6 0 0 12 0 13 7 13
Fiordland >1% 6 0 0 7 0 7 6 8
Fiordland Total 26 26 26 26 26 26 26 26
Kermadec Islands >0% 11 0 0 0 0 0 11 11
Kermadec Islands >1% 11 0 0 0 0 0 11 11
Kermadec Islands Total 11 11 11 11 11 11 11 11
North Cook Strait >0% 12 0 18 0 3 22 26 26
North Cook Strait >1% 8 0 9 0 1 12 18 18
North Cook Strait Total 39 39 39 39 39 39 39 39
108

Appendix 6.1 Number of habitats that have greater
than 0 or 1 % of their area in MPAs
for each coastal marine bioregion.
Number of different habitats with greater than 0 or 1% of
their bioregional area in MPAsT
ype I M
arine R
eserve
No
-take Marin
e Park
Cab
le or p
ipelin
e zon
e
No
trawl, d
anish
seine, d
redge o
r setnet
No
trawl, d
anish
seine, d
redge
To
tal Typ
e II MP
A
To
tal no
take
To
tal MP
A
North Eastern >0% 19 6 18 11 9 25 24 27
North Eastern >1% 5 0 7 5 1 16 12 18
North Eastern Total 41 41 41 41 41 41 41 41
Snares Islands >0% 0 0 0 0 0 0 0 0
Snares Islands >1% 0 0 0 0 0 0 0 0
Snares Islands Total 10 10 10 10 10 10 10 10
South Cook Strait >0% 17 0 11 0 9 13 21 22
South Cook Strait >1% 6 0 3 0 3 6 8 11
South Cook Strait Total 38 38 38 38 38 38 38 38
Southern South Island >0% 11 0 0 13 0 14 11 14
Southern South Island >1% 5 0 0 9 0 9 5 10
Southern South Island Total 37 37 37 37 37 37 37 37
Subantarctic Islands >0% 17 0 0 0 0 0 17 17
Subantarctic Islands >1% 17 0 0 0 0 2 17 17
Subantarctic Islands Total 19 19 19 19 19 19 19 19
Three Kings >0% 0 0 0 0 0 0 0 0
Three Kings >1% 0 0 0 0 0 0 0 0
Three Kings Total 8 8 8 8 8 8 8 8
West Coast South Island >0% 0 0 0 0 0 0 0 0
West Coast South Island >1% 0 0 0 0 0 0 0 0
West Coast South Island Total 21 21 21 21 21 21 21 21
Western North Island >0% 7 0 7 6 0 9 10 10
Western North Island >1% 5 0 6 2 0 8 9 9
Western North Island Total 32 32 32 32 32 32 32 32
109

Appendix 6.2 Number of habitats with greater
than 0 or 1 % of their area in other
management tools for each bioregion.
Number of different habitats with greater than 0 or 1% of their bioregional area in
management tools that do not meet the MPA protection
standard
Mataitai
Taiap
ure
Nature R
eserve
Scientific R
eserve
Other D
OC reserve
Temporary clo
sure
No traw
l, danish sein
e or co
mmercial d
redge (am
ateur dredge allo
wed)
Two of traw
l, danish sein
e or co
mmercial d
redge p
rohibited
One of traw
l, danish sein
e or co
mmercial d
redge p
rohibited
Chatham Islands >0% 0 0 2 0 0 0 11 0 16
Chatham Islands >1% 0 0 2 0 0 0 4 0 15
Chatham Islands Total 18 18 18 18 18 18 18 18 18
East Coast South Island >0% 6 11 0 0 7 3 0 11 8
East Coast South Island >1% 2 8 0 0 3 0 0 8 2
East Coast South Island Total 37 37 37 37 37 37 37 37 37
Eastern North Island >0% 8 5 0 0 5 0 22 14 31
Eastern North Island >1% 5 5 0 0 4 0 19 13 30
Eastern North Island Total 36 36 36 36 36 36 36 36 36
Fiordland >0% 0 0 0 0 0 0 0 18 0
Fiordland >1% 0 0 0 0 0 0 0 13 0
Fiordland Total 26 26 26 26 26 26 26 26 26
Kermadec Islands >0% 0 0 0 0 0 0 0 0 0
Kermadec Islands >1% 0 0 0 0 0 0 0 0 0
Kermadec Islands Total 11 11 11 11 11 11 11 11 11
North Cook Strait >0% 0 4 3 8 5 4 15 6 36
North Cook Strait >1% 0 1 1 3 3 2 8 2 34
North Cook Strait Total 39 39 39 39 39 39 39 39 39
110
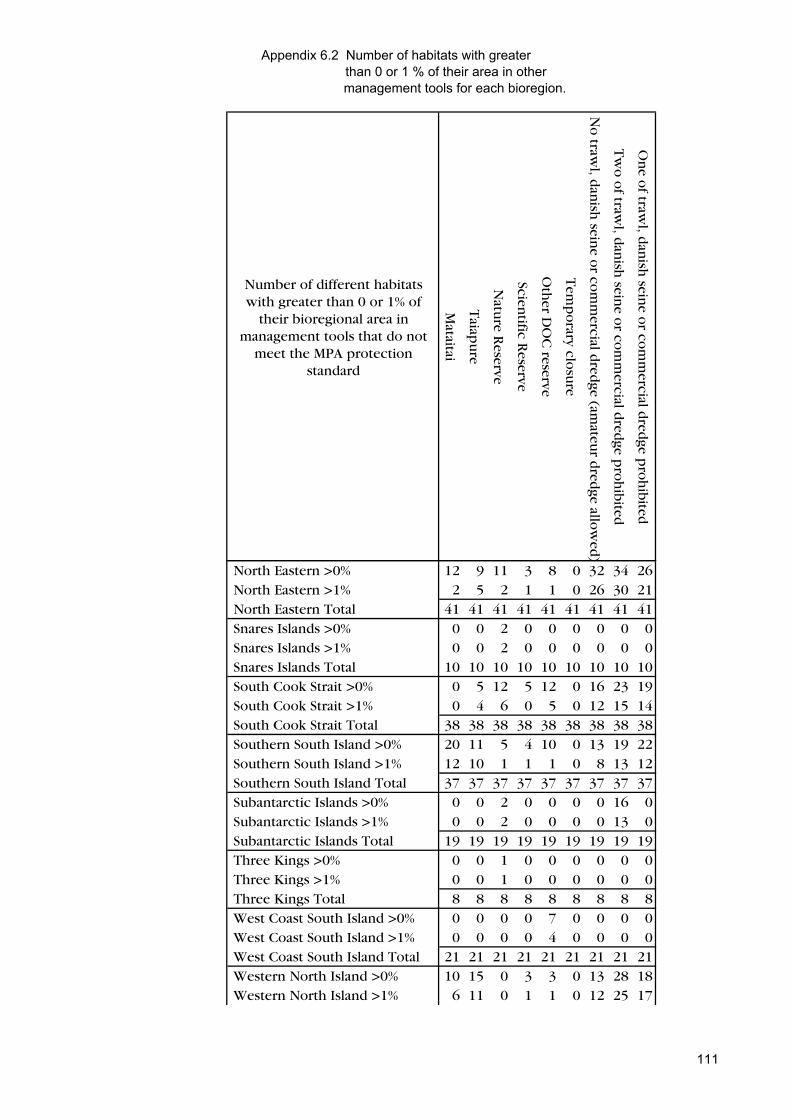
Appendix 6.2 Number of habitats with greater
than 0 or 1 % of their area in other
management tools for each bioregion.
Number of different habitats with greater than 0 or 1% of their bioregional area in
management tools that do not meet the MPA protection
standard
Mataitai
Taiap
ure
Nature R
eserve
Scientific R
eserve
Other D
OC reserve
Temporary clo
sure
No traw
l, danish sein
e or co
mmercial d
redge (am
ateur dredge allo
wed)
Two of traw
l, danish sein
e or co
mmercial d
redge p
rohibited
One of traw
l, danish sein
e or co
mmercial d
redge p
rohibited
North Eastern >0% 12 9 11 3 8 0 32 34 26
North Eastern >1% 2 5 2 1 1 0 26 30 21
North Eastern Total 41 41 41 41 41 41 41 41 41
Snares Islands >0% 0 0 2 0 0 0 0 0 0
Snares Islands >1% 0 0 2 0 0 0 0 0 0
Snares Islands Total 10 10 10 10 10 10 10 10 10
South Cook Strait >0% 0 5 12 5 12 0 16 23 19
South Cook Strait >1% 0 4 6 0 5 0 12 15 14
South Cook Strait Total 38 38 38 38 38 38 38 38 38
Southern South Island >0% 20 11 5 4 10 0 13 19 22
Southern South Island >1% 12 10 1 1 1 0 8 13 12
Southern South Island Total 37 37 37 37 37 37 37 37 37
Subantarctic Islands >0% 0 0 2 0 0 0 0 16 0
Subantarctic Islands >1% 0 0 2 0 0 0 0 13 0
Subantarctic Islands Total 19 19 19 19 19 19 19 19 19
Three Kings >0% 0 0 1 0 0 0 0 0 0
Three Kings >1% 0 0 1 0 0 0 0 0 0
Three Kings Total 8 8 8 8 8 8 8 8 8
West Coast South Island >0% 0 0 0 0 7 0 0 0 0
West Coast South Island >1% 0 0 0 0 4 0 0 0 0
West Coast South Island Total 21 21 21 21 21 21 21 21 21
Western North Island >0% 10 15 0 3 3 0 13 28 18
Western North Island >1% 6 11 0 1 1 0 12 25 17
111

Appendix 6.2 Number of habitats with greater
than 0 or 1 % of their area in other
management tools for each bioregion.
Number of different habitats with greater than 0 or 1% of their bioregional area in
management tools that do not meet the MPA protection
standard
Mataitai
Taiap
ure
Nature R
eserve
Scientific R
eserve
Other D
OC reserve
Temporary clo
sure
No traw
l, danish sein
e or co
mmercial d
redge (am
ateur dredge allo
wed)
Two of traw
l, danish sein
e or co
mmercial d
redge p
rohibited
One of traw
l, danish sein
e or co
mmercial d
redge p
rohibited
Western North Island Total 32 32 32 32 32 32 32 32 32
112