Embed Size (px)
Citation preview

Coastal Georgia Ecosystem Report Card
Heath Kelsey and Alexandra Fries University of Maryland Center for Environmental Science
Brunswick, GA November 13, 2015

Integration & Application Network
IAN’s aim is to enable better communication to empower change.
Solving, not just studying environmental problems
• Dispassionate
• Embrace complexity
• Publish & funding via peer review
• Getting it right
• Passionate
• Simplify
• Publish & funding via stakeholders
• Getting it done
STUDY SOLVE

IAN Personnel Recruiting and retaining talented and committed people
• Science Integrators – PhD scientists
• Science Communicators – MS scientists
• Interns – Undergraduate
scientists

COMMUNICATING SCIENCE EFFECTIVELY REPORTING ECOSYSTEM STATUS TEACHING & TRAINING CATALYZING CONSERVATION OUTCOMES
ADVANCING CHESAPEAKE BAY RESTORATION BUILDING STRATEGIC PARTNERSHIPS CREATING GOOD CITIZENSHIP MODELS
IAN Themes
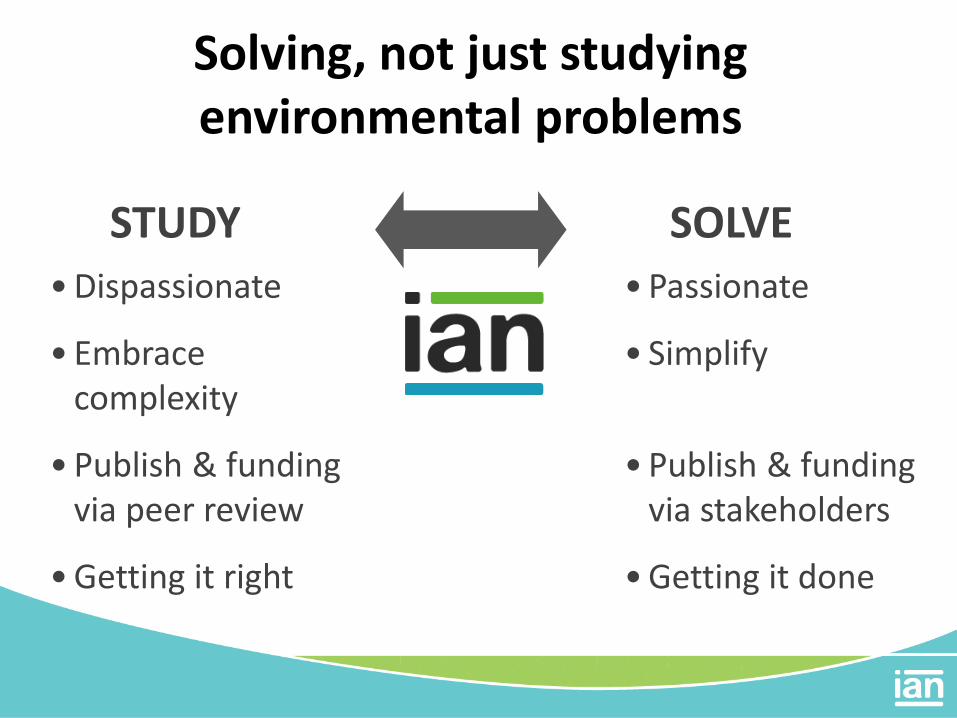
130,561,717 images downloaded
Communicating science effectively Creating innovative ways to visually present science

Report Card Examples

• Broad-level assessments of a region or system
• Communicate complex information
• Based on real data: transparent and defendable
• Provide accountability
• Engage communities
What is an ecosystem health report card?

• Peer pressure is a powerful
human motivator
• Educational report cards are a
common experience • Report cards synthesize large
amounts of data
Ecosystem health report cards are an effective communication tool
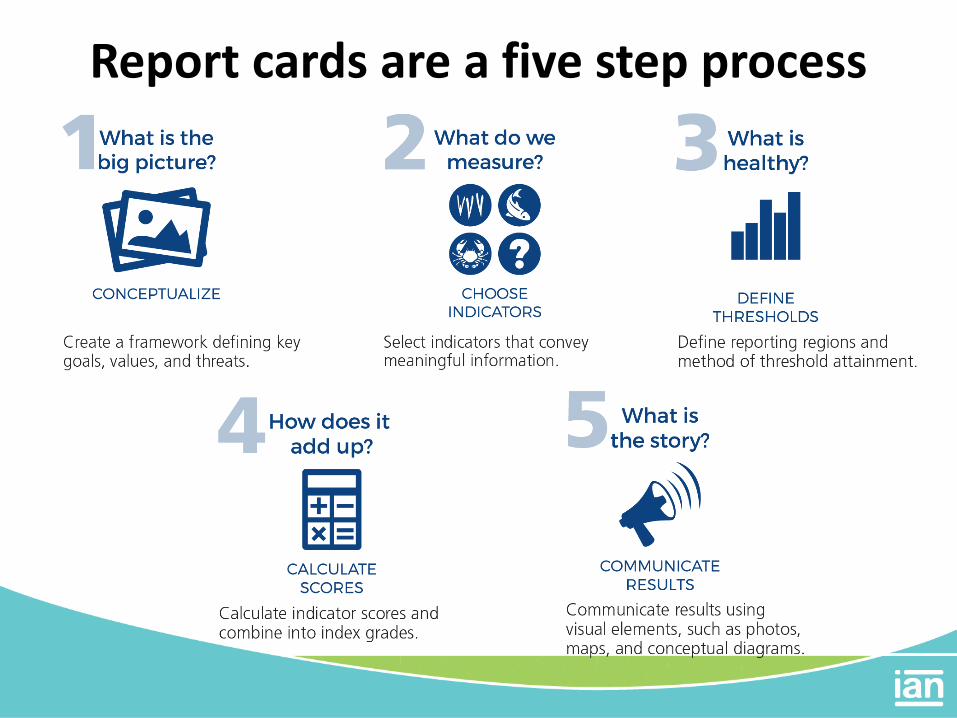
Report cards are a five step process

• Top tier = Report card • 2nd Tier = GA DNR
management plans • 3rd Tier = Technical
reports, scientific literature
• Base = Data
The report card supports Georgia DNR’s management
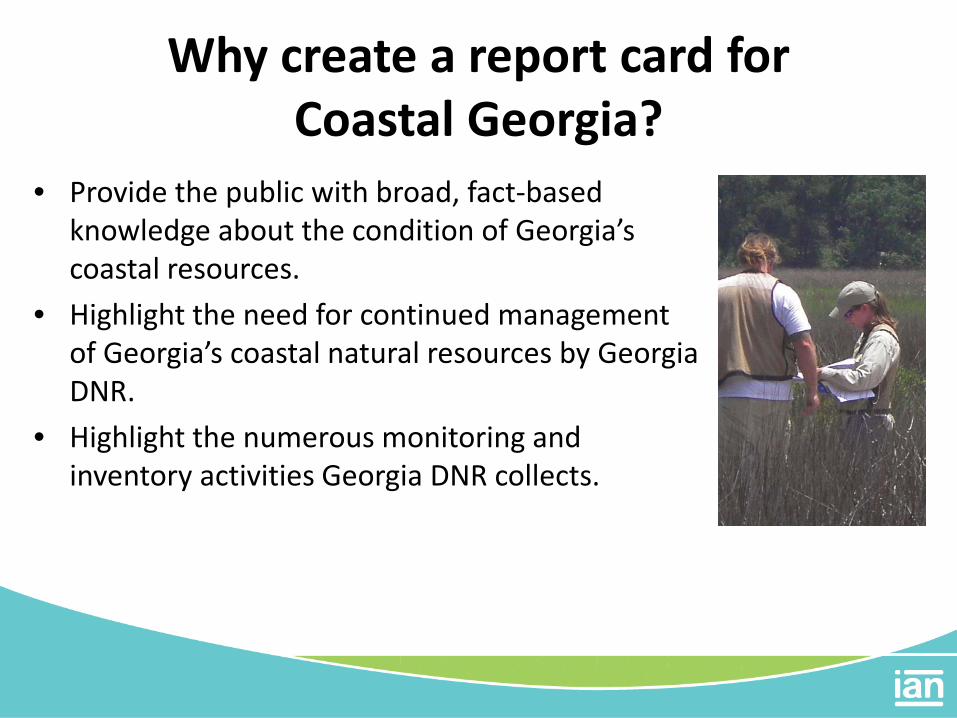
Why create a report card for Coastal Georgia?
• Provide the public with broad, fact-based knowledge about the condition of Georgia’s coastal resources.
• Highlight the need for continued management of Georgia’s coastal natural resources by Georgia DNR.
• Highlight the numerous monitoring and inventory activities Georgia DNR collects.

1. Provide an overall ecosystem health report card for Coastal Georgia.
2. Communicate monitoring results. 3. Engage communities to increase
awareness of environmental issues.
4. Provide recommendations to improve coastal ecosystem condition.
5. Improve awareness of the work Georgia DNR is doing.
Coastal Georgia project goals
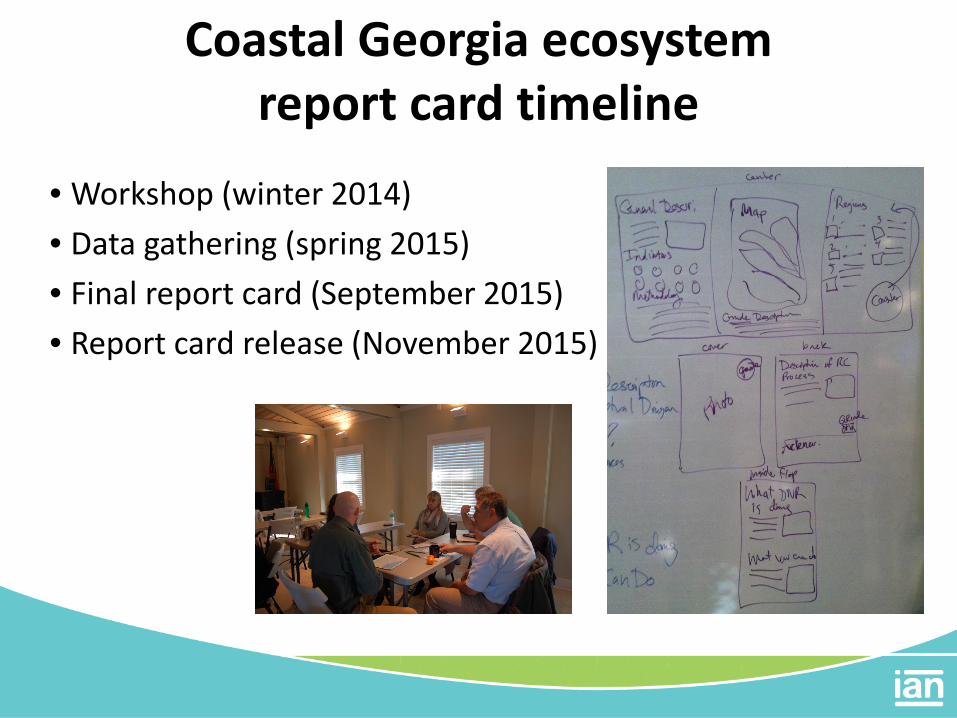
• Workshop (winter 2014) • Data gathering (spring 2015) • Final report card (September 2015) • Report card release (November 2015)
Coastal Georgia ecosystem report card timeline
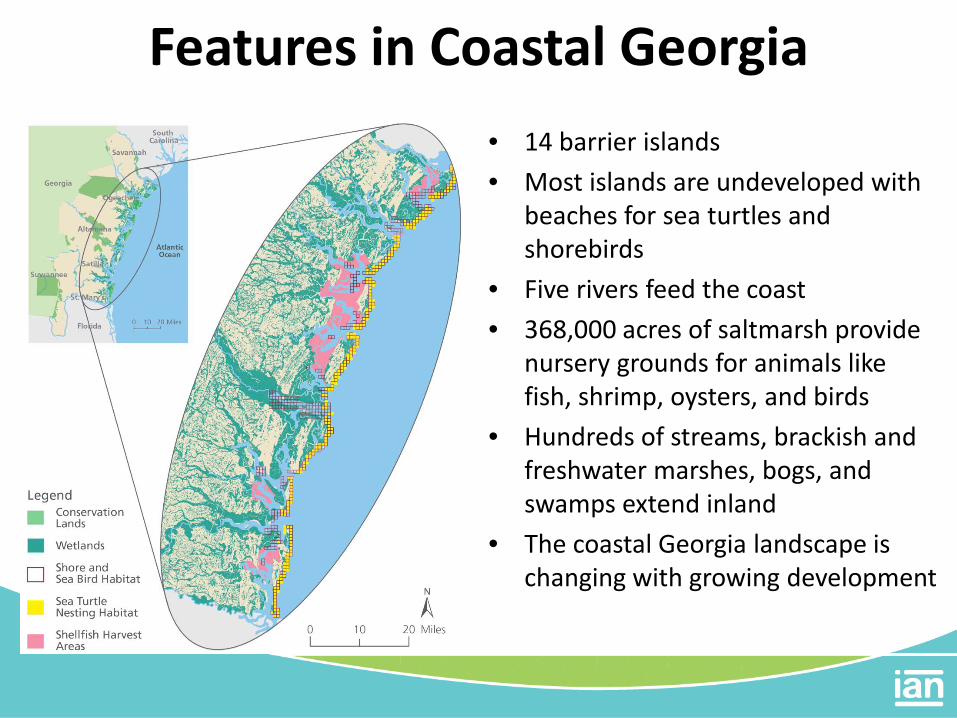
Features in Coastal Georgia • 14 barrier islands • Most islands are undeveloped with
beaches for sea turtles and shorebirds
• Five rivers feed the coast • 368,000 acres of saltmarsh provide
nursery grounds for animals like fish, shrimp, oysters, and birds
• Hundreds of streams, brackish and freshwater marshes, bogs, and swamps extend inland
• The coastal Georgia landscape is changing with growing development

Coastal Georgia sampling locations • Five watersheds in the 11 county
area where the Coastal Resource Division works
• Many sampling sites in the St. Mary’s/Satilla and Ogeechee watersheds
• Limited sampling sites in the Altamaha, Savannah, and none in the Sewanee
• Analyzed the data for the overall area, and did not separate it out by watershed

How were the indicators chosen? • DNR project managers met with
UMCES IAN staff to determine what data to include in the report card.
• Data needed to be part of long-term monitoring programs, be linked to resource management activities, and needed to be coast-wide.
• Lists of potential indicators were prioritized and final selections were made by DNR staff.
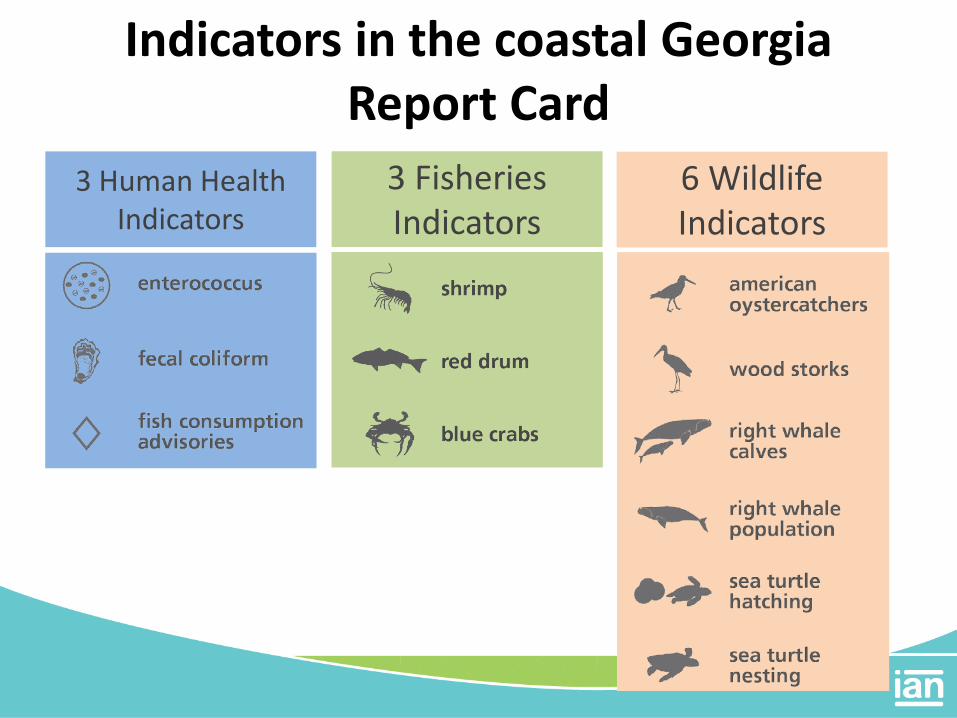
3 Human Health Indicators
3 Fisheries Indicators
6 Wildlife Indicators
Indicators in the coastal Georgia Report Card
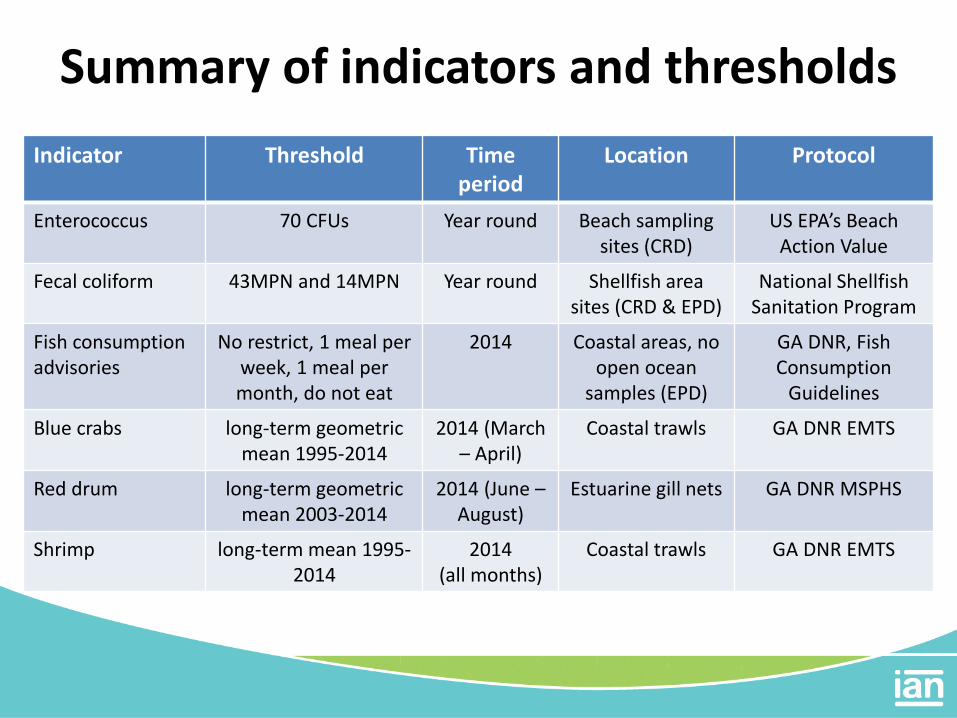
Summary of indicators and thresholds Indicator Threshold Time
period Location Protocol
Enterococcus 70 CFUs Year round Beach sampling sites (CRD)
US EPA’s Beach Action Value
Fecal coliform 43MPN and 14MPN Year round Shellfish area sites (CRD & EPD)
National Shellfish Sanitation Program
Fish consumption advisories
No restrict, 1 meal per week, 1 meal per month, do not eat
2014 Coastal areas, no open ocean
samples (EPD)
GA DNR, Fish Consumption
Guidelines
Blue crabs long-term geometric mean 1995-2014
2014 (March – April)
Coastal trawls GA DNR EMTS
Red drum long-term geometric mean 2003-2014
2014 (June – August)
Estuarine gill nets GA DNR MSPHS
Shrimp long-term mean 1995-2014
2014 (all months)
Coastal trawls GA DNR EMTS

Summary of indicators and thresholds Indicator Threshold Time
period Location Protocol
Wood stork productivity
>2.0, 2.0-1.5, 1.5-1.0, 1.0-0.5, 0.5-0
2014 Beach nest locations
1.5 chicks per nest, regional productivity range
American oystercatcher
>0.5, 0.5-0.32, 0.32-0.2, 0.2-0.1, 0.1-0
2014 Beach nest locations
replacement rate of 0.32
Sea turtle nesting trends
>2% increase, 1%-2% increase, 0-1% increase,
0-1% decrease, >1% decrease
2014 Beach nest locations
National Marine Fisheries Service and US Fish and
Wildlife Service recov. goal = 2% increase over 50yr
Sea turtle hatching success
>70%, 60%-69%, 50%-59%, 40%-49%, 30%-
39%
2014 Beach nest locations
National Marine Fisheries Service and US Fish and
Wildlife Service recov. goal
Right whale population growth rate
>=3.5%, 2.5%-3.49%, 1.5%-2.49%, 0.5%-
1.49%, <0.5%
2011 Ocean surveys
National Marine Fisheries Service
Right whale calf production index
>=0.075, 0.05-0.075, 0.025-0.05, 0.0125-
0.025, <0.0125
2011 Ocean surveys
National Marine Fisheries Service
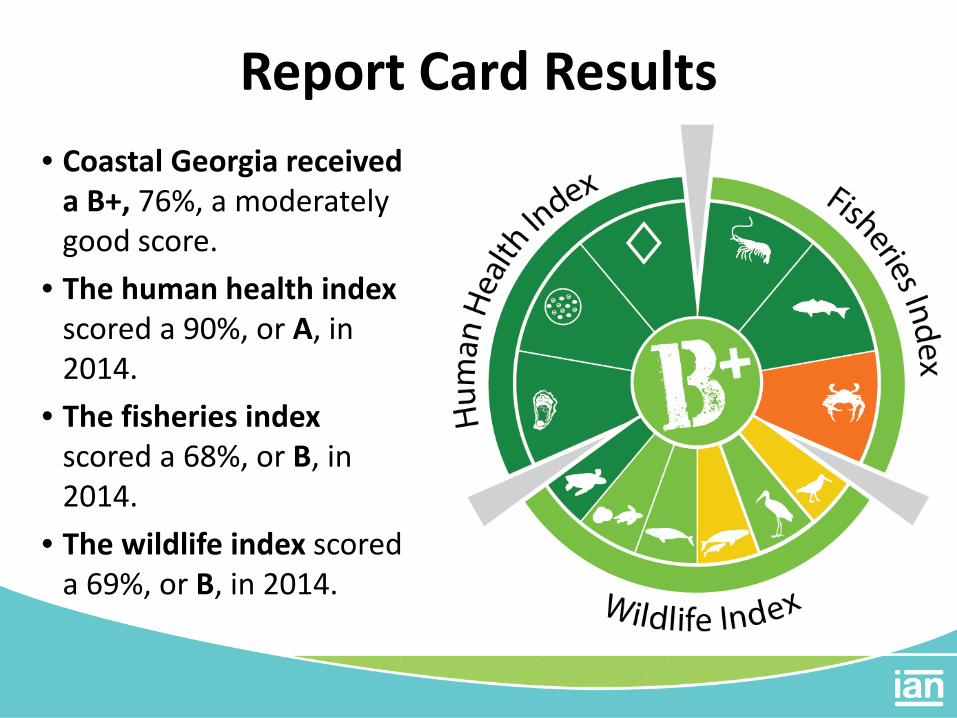
Report Card Results • Coastal Georgia received
a B+, 76%, a moderately good score.
• The human health index scored a 90%, or A, in 2014.
• The fisheries index scored a 68%, or B, in 2014.
• The wildlife index scored a 69%, or B, in 2014.

Detailed indicator scores

Key messages from the report card
• Coastal Georgia has moderately good ecosystem condition that we want to protect.
• Georgia DNR will keep working to protect and restore coastal Georgia.
• Pressure on Georgia’s coast will increase requiring sustained protection.
• Healthy ecosystems mean healthy natural resources, a healthy economy, and healthy people.

What do the scores mean? • Final grades are equally divided to provide a clearer picture of
health. • Following the typical school grading scale overall does not provide
information about small improvements or declines in ecosystem health.
• The equally divided grading scale allows evaluation of small changes in ecosystem health, even at the very poor, poor, and moderately poor ranges.
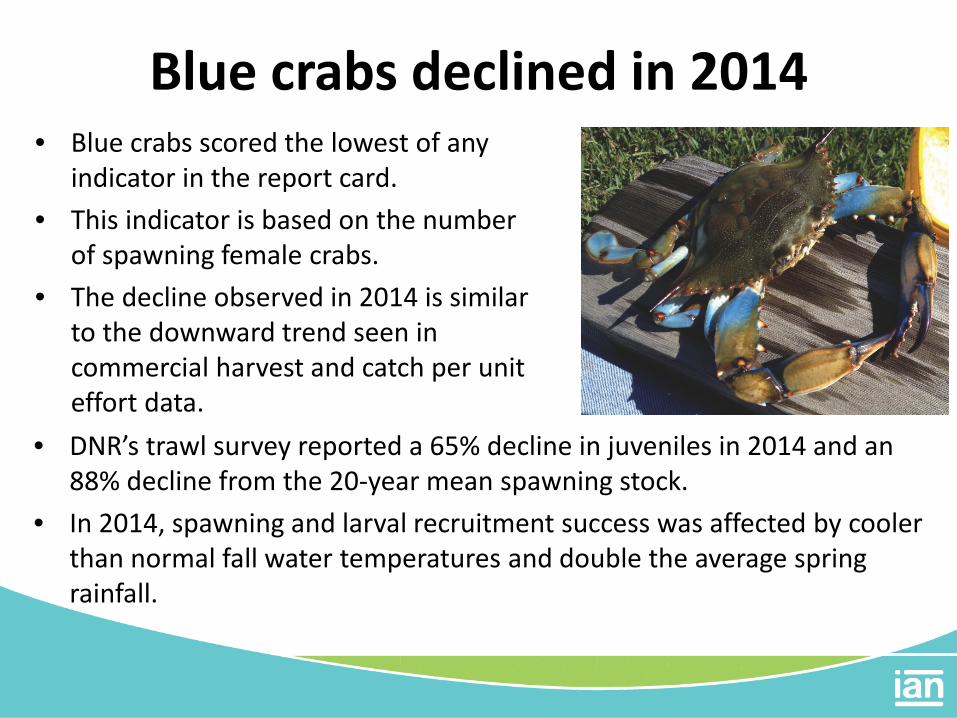
Blue crabs declined in 2014 • Blue crabs scored the lowest of any
indicator in the report card. • This indicator is based on the number
of spawning female crabs. • The decline observed in 2014 is similar
to the downward trend seen in commercial harvest and catch per unit effort data.
• DNR’s trawl survey reported a 65% decline in juveniles in 2014 and an 88% decline from the 20-year mean spawning stock.
• In 2014, spawning and larval recruitment success was affected by cooler than normal fall water temperatures and double the average spring rainfall.

Water quality monitoring • Preliminary water quality
indicators were analyzed. • Dissolved oxygen was not
included in the overall report card scoring, but it was scored and communicated in the report card.
• The thresholds are < 2mg/l, 2−5 mg/l and >5 mg/l from EPA’s NCCA.
• Water quality indicators, can be included in future report cards with further research.

Take home messages
• This report represents information gathered by various DNR programs.
• Coastal Georgia’s ecosystem is in moderately good health for 2014.
• Our purpose for preparing a report card is to share with the public what we know about the state of coastal natural resources.
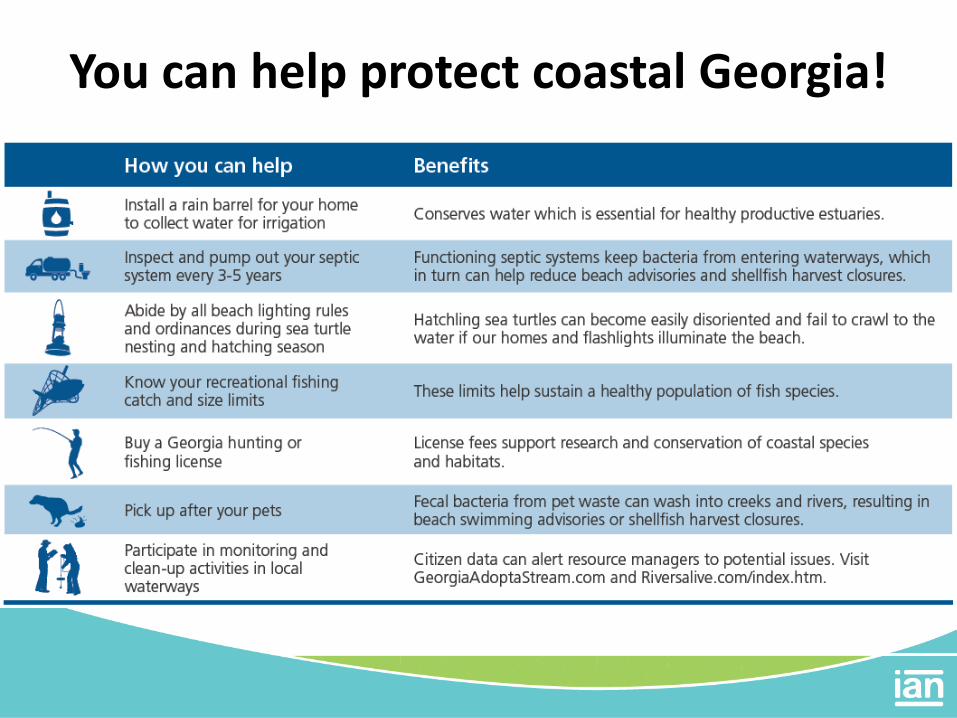
You can help protect coastal Georgia!

Thanks! Heath Kelsey [email protected] Alexandra Fries [email protected]
Jill Andrews [email protected]