Embed Size (px)
Citation preview
COACH INC (COH)
10-K Annual report pursuant to section 13 and 15(d)
Filed on 08/19/2011Filed Period 07/02/2011

UNITED STATES
SECURITIES AND EXCHANGE COMMISSION
Washington, D.C. 20549
FORM 10-K
x ANNUAL REPORT PURSUANT TO SECTION 13 OR 15(d)
OF THE SECURITIES EXCHANGE ACT OF 1934
For the Fiscal Year Ended July 2, 2011
OR
o TRANSITION REPORT PURSUANT TO SECTION 13 OR 15(d)
OF THE SECURITIES EXCHANGE ACT OF 1934
Commission file number: 1-16153
Coach, Inc.(Exact name of registrant as specified in its charter)
Maryland 52-2242751(State or other jurisdiction of
incorporation or organization)
(I.R.S. Employer
Identification No.)
516 West 34th Street, New York, NY 10001
(Address of principal executive offices); (Zip Code)
(212) 594-1850
(Registrant's telephone number, including area code)
Securities Registered Pursuant to Section 12(b) of the Act:
Title of Each Class: Name of Each Exchange on which Registered
Common Stock, par value $.01 per share New York Stock Exchange
Securities Registered Pursuant to Section 12(g) of the Act: None

Indicate by check mark if the registrant is a well-known seasoned issuer, as defined in Rule 405 of the Securities Act. Yes x No o
Indicate by check mark if the registrant is not required to file reports pursuant to Section 13 or Section 15(d) of the Act. Yes o No x
Indicate by check mark whether the registrant (1) has filed all reports required to be filed by Section 13 or 15(d) of the Securities Exchange Act of1934 during the preceding 12 months (or for such shorter period that the registrant was required to file such reports), and (2) has been subject to such filingrequirements for the past 90 days. Yes x No o
Indicate by check mark whether the registrant has submitted electronically and posted on its corporate Web site, if any, every Interactive Data Filerequired to be submitted and posted pursuant to Rule 405 of Regulation S-T (§ 232.405 of this chapter) during the preceding 12 months (or for suchshorter period that the registrant was required to submit and post such files). Yes x No o
Indicate by check mark if disclosure of delinquent filers pursuant to Item 405 of Regulation S-K (§ 229.405 of this chapter) is not contained herein,and will not be contained, to the best of registrant's knowledge, in definitive proxy or information statements incorporated by reference in Part III of thisForm 10-K or any amendment to this Form 10-K. o
Indicate by check mark whether the registrant is a large accelerated filer, an accelerated filer, a non-accelerated filer, or a smaller reporting company.See the definitions of "large accelerated filer", "accelerated filer" and "smaller reporting company" in Rule 12b-2 of the Exchange Act.
Large Accelerated Filer x Accelerated Filer o Non-Accelerated Filer o Smaller Reporting Company o
Indicate by check mark whether the registrant is a shell company (as defined in Rule 12b-2 of the Act). Yes o No x
The aggregate market value of Coach, Inc. common stock held by non-affiliates as of December 31, 2010 (the last business day of the most recentlycompleted second fiscal quarter) was approximately $16.2 billion. For purposes of determining this amount only, the registrant has excluded shares ofcommon stock held by directors and officers. Exclusion of shares held by any person should not be construed to indicate that such person possesses thepower, direct or indirect, to direct or cause the direction of the management or policies of the registrant, or that such person is controlled by or undercommon control with the registrant.
On August 5, 2011, the Registrant had 289,023,860 shares of common stock outstanding.
DOCUMENTS INCORPORATED BY REFERENCE
Documents Form 10-K Reference
Proxy Statement for the 2011 Annual Meeting of Stockholders Part III, Items 10 – 14

TABLE OF CONTENTS
COACH, INC.
TABLE OF CONTENTS
Page
Number
PART I
Item 1.Business
1
Item 1A.Risk Factors
10
Item 1B.Unresolved Staff Comments
14
Item 2.Properties
14
Item 3.Legal Proceedings
14
PART II
Item 5.Market for Registrant's Common Equity, Related Stockholder Matters and Issuer Purchases of Equity Securities
16
Item 6.Selected Financial Data
19
Item 7.Management's Discussion and Analysis of Financial Condition and Results of Operations
21
Item 7A.Quantitative and Qualitative Disclosures About Market Risk
36
Item 8.Financial Statements and Supplementary Data
38
Item 9.Changes in and Disagreements with Accountants on Accounting and Financial Disclosure
38
Item 9A.Controls and Procedures
38
Item 9B.Other Information
38
PART III
Item 10.Directors, Executive Officers and Corporate Governance
39
Item 11.Executive Compensation
39
Item 12.Security Ownership of Certain Beneficial Owners and Management and Related Stockholder Matters
39
Item 13.Certain Relationships and Related Transactions, and Director Independence
39
Item 14.Principal Accountant Fees and Services
39
PART IV
Item 15.Exhibits, Financial Statement Schedules
39
Signatures 40
i

TABLE OF CONTENTS
SPECIAL NOTE ON FORWARD-LOOKING INFORMATION
This document and the documents incorporated by reference in this document contain certain forward-looking statements based on management's
current expectations. These forward-looking statements can be identified by the use of forward-looking terminology such as "may," "will," "should,"
"expect," "intend," "estimate," "are positioned to," "continue," "project," "guidance," "target," "forecast," "anticipated," "plan," "potential," the negative of
these terms or comparable terms. The Company assumes no obligation to revise or update any forward-looking statements for any reason, except as
required by law.
Coach, Inc.'s actual results could differ materially from the results contemplated by these forward-looking statements due to a number of factors,
including those discussed in the sections of this Form 10-K filing entitled "Risk Factors" and "Management's Discussion and Analysis of Financial
Condition and Results of Operations." These factors are not necessarily all of the important factors that could cause actual results to differ materially from
those expressed in any of the forward-looking statements contained in this Form 10-K.

TABLE OF CONTENTS
In this Form 10-K, references to "Coach," "we," "our," "us" and the "Company" refer to Coach, Inc., including consolidated subsidiaries. The fiscal
years ended July 2, 2011 ("fiscal 2011") and June 27, 2009 ("fiscal 2009") were each 52-week periods. The fiscal year ended July 3, 2010 ("fiscal 2010")
was a 53-week period.
PART I
ITEM 1. BUSINESS
GENERAL DEVELOPMENT OF BUSINESS
Founded in 1941, Coach was acquired by Sara Lee Corporation ("Sara Lee") in 1985. In June 2000, Coach was incorporated in the state of Maryland.
In October 2000, Coach was listed on the New York Stock Exchange and sold approximately 68 million shares of common stock, split adjusted,
representing 19.5% of the outstanding shares. In April 2001, Sara Lee completed a distribution of its remaining ownership in Coach via an exchange offer,
which allowed Sara Lee stockholders to tender Sara Lee common stock for Coach common stock.
In June 2001, Coach Japan was formed to expand our presence in the Japanese market and to exercise greater control over our brand in that country.
Coach Japan was initially formed as a joint venture with Sumitomo Corporation. On July 1, 2005, we purchased Sumitomo's 50% interest in Coach Japan,
resulting in Coach Japan becoming a 100% owned subsidiary of Coach, Inc.
In fiscal 2009, the Company acquired the Coach domestic retail businesses in Hong Kong, Macau and mainland China ("Coach China") from its
former distributor, the ImagineX group. These acquisitions provide the Company with greater control over the brand in China, enabling Coach to raise
brand awareness and aggressively grow market share with the Chinese consumer.
In fiscal 2011, the Company entered into an agreement to assume direct control of its domestic retail businesses in Malaysia and Singapore which
were operated by Valiram Group, with a phased transition of such businesses, beginning with Singapore in July 2011.
Additionally in fiscal 2011, the Company acquired a non-controlling interest in a joint venture with Hackett Limited to expand the Coach International
business in Europe. Through the joint venture, the Company opened retail locations in Spain, Portugal and Great Britain beginning in fiscal 2011, and
currently anticipates further European expansion in fiscal 2012.
FINANCIAL INFORMATION ABOUT SEGMENTS
See the Segment Information note presented in the Notes to the Consolidated Financial Statements.
NARRATIVE DESCRIPTION OF BUSINESS
Coach has grown from a family-run workshop in a Manhattan loft to a leading American marketer of fine accessories and gifts for women and men.
Coach is one of the most recognized fine accessories brands in the U.S. and in targeted international markets. We offer premium lifestyle accessories to a
loyal and growing customer base and provide consumers with fresh, relevant and innovative products that are extremely well made, at an attractive price.
Coach's modern, fashionable handbags and accessories use a broad range of high quality leathers, fabrics and materials. In response to our customer's
demands for both fashion and function, Coach offers updated styles and multiple product categories which address an increasing share of our customer's
accessory wardrobe. Coach has created a sophisticated, modern and inviting environment to showcase our product assortment and reinforce a consistent
brand position wherever the consumer may shop. We utilize a flexible, cost-effective global sourcing model, in which independent manufacturers supply
our products, allowing us to bring our broad range of products to market rapidly and efficiently.
Coach offers a number of key differentiating elements that set it apart from the competition, including:
A Distinctive Brand — Coach offers distinctive, easily recognizable, accessible luxury products that are relevant, extremely well made and provide
excellent value.
A Market Leadership Position With Growing Share — Coach is America's leading premium handbag and accessories brand and each year, as our
market share increases, our leadership position strengthens. In Japan, Coach is the leading imported luxury handbag and accessories brand by units
sold.
1

TABLE OF CONTENTS
A Loyal And Involved Consumer — Coach consumers have a specific emotional connection with the brand. Part of the Company's everyday mission
is to cultivate consumer relationships by strengthening this emotional connection.
A Multi-Channel International Distribution Model — This allows Coach to maintain a critical balance as results do not depend solely on the
performance of a single channel or geographic area. The Direct-to-Consumer channel provides us with immediate, controlled access to consumers
through Coach-operated stores in North America, Japan, Hong Kong, Macau and mainland China and the Internet. The Indirect channel provides us
with access to consumers via wholesale department store and specialty store locations in over 20 countries.
Innovation And A Consumer-Centric Focus — Coach listens to its consumer through rigorous consumer research and strong consumer orientation.
Coach works to anticipate the consumer's changing needs by keeping the product assortment fresh and relevant.
We believe that these differentiating elements have enabled the Company to offer a unique proposition to the marketplace. We hold the number one
position within the U.S. premium handbag and accessories market and the number two position within the Japanese imported luxury handbag and
accessories market.
PRODUCTS
Coach's product offerings include women's and men's bag, accessories, business cases, footwear, wearables, jewelry, sunwear, travel bags, watches
and fragrance. The following table shows the percent of net sales that each product category represented:
Fiscal Year Ended
July 2,
2011
July 3,
2010
June 27,
2009Handbags 63% 63% 62% Accessories 27 28 29 All other products 10 9 9 Total 100% 100% 100%
Handbags — Handbag collections feature classically inspired designs as well as fashion designs. Typically, there are three to four collections per
quarter and four to seven styles per collection. These collections are designed to meet the fashion and functional requirements of our broad and diverse
consumer base. In fiscal 2012, we launched a new Chelsea collection and evolved Poppy with updated styles, patterns and prints. The Chelsea collection
features a modern faceted turnlock inspired by our heritage and offered in timeless silhouettes. Poppy has an updated look with new leather, logo fabrics
and new pushlock closures. In August, Madison will be updated with new fall fabrications, colors and patterns.
Accessories — Accessories include women's and men's small leather goods, novelty accessories and women's and men's belts. Women's small leather
goods, which coordinate with our handbags, include money pieces, wristlets, and cosmetic cases. Men's small leather goods consist primarily of wallets
and card cases. Novelty accessories include time management and electronic accessories. Key rings and charms are also included in this category.
Business Cases — This assortment is primarily men's and includes computer bags, messenger-style bags and totes.
Footwear — Jimlar Corporation ("Jimlar") has been Coach's footwear licensee since 1999. Footwear is distributed through select Coach retail stores,
coach.com and about 1,000 U.S. department stores. Footwear sales are comprised primarily of women's styles, which coordinate with Coach's handbag
collections.
Wearables — This category is comprised of jackets, sweaters, gloves, hats and scarves, including both cold weather and fashion. The assortment is
primarily women's and contains a fashion assortment in all components of this category.
Jewelry — This category is comprised of bangle bracelets, necklaces, rings and earrings offered in both sterling silver and non-precious metals.
2
TABLE OF CONTENTS
Sunwear — Marchon Eyewear, Inc. ("Marchon") has been Coach's eyewear licensee since 2003 under a licensing agreement that expires in 2011.
During October 2010, the Company signed a licensing agreement with Luxottica Trading and Finance Ltd. ("Luxottica") and will begin transitioning the
eyewear business during the second half of fiscal 2012. This collection is a collaborative effort that combines the Coach aesthetic for fashion accessories
with the latest fashion directions in sunglasses. Coach sunglasses are sold in Coach retail stores and coach.com, department stores, select sunglass retailers
and optical retailers in major markets.
Travel Bags — The travel collections are comprised of luggage and related accessories, such as travel kits and valet trays.
Watches — Movado Group, Inc. ("Movado") has been Coach's watch licensee since 1998 and has developed a distinctive collection of watches
inspired primarily by the women's collections with select men's styles.
Fragrance — Starting in the spring of 2010, Estée Lauder Companies Inc. ("Estée Lauder"), through its subsidiary, Aramis Inc., became Coach's
fragrance licensee. Fragrance is distributed through Coach retail stores, coach.com and about 3,000 U.S. department stores. Coach offers four women's
fragrance collections and one men's fragrance. The women's fragrance collections include eau de perfume spray, eau de toilette spray, purse spray, body
lotion and body splashes.
DESIGN AND MERCHANDISING
Coach's New York-based design team, led by its Executive Creative Director, is responsible for conceptualizing and directing the design of all Coach
products. Designers have access to Coach's extensive archives of product designs created over the past 70 years, which are a valuable resource for new
product concepts. Coach designers are also supported by a strong merchandising team that analyzes sales, market trends and consumer preferences to
identify business opportunities that help guide each season's design process. Merchandisers also analyze products and edit, add and delete to achieve
profitable sales across all channels. The product category teams, each comprised of design, merchandising/product development and sourcing specialists
help Coach execute design concepts that are consistent with the brand's strategic direction.
Coach's design and merchandising teams work in close collaboration with all of our licensing partners to ensure that the licensed products (watches,
footwear, eyewear and fragrance) are conceptualized and designed to address the intended market opportunity and convey the distinctive perspective and
lifestyle associated with the Coach brand.
During fiscal 2008, the Company announced a new business initiative to drive brand creativity. This initiative has evolved into the Reed Krakoff
brand, representing New American luxury which is supported by a team of experienced designers and merchandisers and encompasses all women's
categories, with a focus on ready-to-wear, handbags, accessories, footwear and jewelry. We introduced the Reed Krakoff brand with store openings in
North America and Japan, and Europe through specialty retailers in early fiscal 2011.
SEGMENTS
Coach operates in two reportable segments: Direct-to-Consumer and Indirect. The reportable segments represent channels of distribution that offer
similar products, service and marketing strategies.
Direct-to-Consumer Segment
The Direct-to-Consumer segment consists of channels that provide us with immediate, controlled access to consumers: Coach-operated stores in North
America, Japan, Hong Kong, Macau and mainland China, the Internet and the Coach catalog. This segment represented approximately 87% of Coach's
total net sales in fiscal 2011, with North American stores and the Internet, Coach Japan and Coach China contributing approximately 64%, 18% and 5% of
total net sales, respectively.
North American Retail Stores — Coach stores are located in regional shopping centers and metropolitan areas throughout the U.S. and Canada. The
retail stores carry an assortment of products depending on their size and location. Our flagship stores, which offer the broadest assortment of Coach
products, are located in high-visibility locations such as New York, Chicago, San Francisco and Toronto.
3

TABLE OF CONTENTS
Our stores are sophisticated, sleek, modern and inviting. They showcase the world of Coach and enhance the shopping experience while reinforcing
the image of the Coach brand. The modern store design creates a distinctive environment to display our products. Store associates are trained to maintain
high standards of visual presentation, merchandising and customer service. The result is a complete statement of the Coach modern American style at the
retail level.
The following table shows the number of Coach retail stores and their total and average square footage:
Fiscal Year Ended
July 2,
2011
July 3,
2010
June 27,
2009Retail stores 345 342 330
Net increase vs. prior year 3 12 33 Percentage increase vs. prior year 0.9% 3.6% 11.1%
Retail square footage 936,277 929,580 893,037 Net increase vs. prior year 6,697 36,543 97,811 Percentage increase vs. prior year 0.7% 4.1% 12.3%
Average square footage 2,714 2,718 2,706
North American Factory Stores — Coach's factory stores serve as an efficient means to sell manufactured-for-factory-store product, including
factory exclusives, as well as discontinued and irregular inventory outside the retail channel. These stores operate under the Coach Factory name and are
geographically positioned primarily in established outlet centers that are generally more than 40 miles from major markets.
Coach's factory store design, visual presentations and customer service levels support and reinforce the brand's image. Through these factory stores,
Coach targets value-oriented customers who would not otherwise buy the Coach brand. Prices are generally discounted from 10% to 50% below full retail
prices.
The following table shows the number of Coach factory stores and their total and average square footage:
Fiscal Year Ended
July 2,
2011
July 3,
2010
June 27,
2009Factory stores 143 121 111
Net increase vs. prior year 22 10 9 Percentage increase vs. prior year 18.2% 9.0% 8.8%
Factory square footage 649,094 548,797 477,724 Net increase vs. prior year 100,297 71,073 64,335 Percentage increase vs. prior year 18.3% 14.9% 15.6%
Average square footage 4,539 4,536 4,304
Internet — Coach views its website as a key communications vehicle for the brand to promote traffic in Coach retail stores and department store
locations and build brand awareness. During fiscal 2009, we relaunched the coach.com website, to enhance the e-commerce shopping experience while
reinforcing the image of the Coach brand. With approximately 68 million unique visits to the website in fiscal 2011, our online store provides a showcase
environment where consumers can browse through a selected offering of the latest styles and colors.
Coach Japan — Coach Japan operates department store shop-in-shop locations and freestanding flagship, retail and factory stores as well as an e-
commerce website. Flagship stores, which offer the broadest assortment of Coach products, are located in select shopping districts throughout Japan.
4

TABLE OF CONTENTS
The following table shows the number of Coach Japan locations and their total and average square footage:
Fiscal Year Ended
July 2,
2011
July 3,
2010
June 27,
2009Coach Japan locations 169 161 155
Net increase vs. prior year 8 6 6 Percentage increase vs. prior year 5.0% 3.9% 4.0%
Coach Japan square footage 303,925 293,441 280,428 Net increase vs. prior year 10,484 13,013 20,435 Percentage increase vs. prior year 3.6% 4.6% 7.9%
Average square footage 1,798 1,823 1,809
Coach China — Coach China operates department store shop-in-shop locations as well as freestanding flagship, retail and factory stores. Flagship
stores, which offer the broadest assortment of Coach products, are located in select shopping districts throughout Hong Kong and mainland China.
The following table shows the number of Coach China locations and their total and average square footage:
Fiscal Year Ended
July 2,
2011
July 3,
2010
June 27,
2009Coach China locations 66 41 28
Net increase vs. prior year 25 13 4 Percentage increase vs. prior year 61.0% 46.4% 16.7%
Coach China square footage 127,550 78,887 52,671 Net increase vs. prior year 48,663 26,216 8,167 Percentage increase vs. prior year 61.7% 49.8% 18.4%
Average square footage 1,933 1,924 1,881
Reed Krakoff — The Reed Krakoff brand represents New American luxury primarily for handbags, accessories and ready-to-wear. We introduced
the Reed Krakoff brand with store openings in North America and Japan, and Europe through specialty retailers in early fiscal 2011. Reed Krakoff
operates department store shop-in-shop locations, freestanding flagship stores as well as an e-commerce website at reedkrakoff.com. Flagship stores,
which offer the broadest assortment of Reed Krakoff products, are located in select shopping districts in the U.S. and Japan.
Indirect Segment
Coach began as a U.S. wholesaler to department stores and this segment remains important to our overall consumer reach. Today, we work closely
with our partners, both domestic and international, to ensure a clear and consistent product presentation. The Indirect segment represented approximately
13% of total net sales in fiscal 2011, with U.S. Wholesale and Coach International representing approximately 7% and 5% of total net sales, respectively.
The Indirect segment also includes royalties earned on licensed product.
U.S. Wholesale — This channel offers access to Coach products to consumers who prefer shopping at department stores. Coach products are also
available on macys.com, dillards.com and nordstrom.com. While overall U.S. department store sales have not increased over the last few years, the
handbag and accessories category has remained strong, in large part due to the strength of the Coach brand. The Company continues to manage inventories
in this channel given the highly promotional environment at point-of-sale.
Coach recognizes the continued importance of U.S. department stores as a distribution channel for premier accessories. We continue to fine-tune our
strategy to increase productivity and drive volume in existing locations by enhancing presentation, primarily through the creation of more shop-in-shops
with proprietary Coach fixtures. Coach custom tailors its assortments through wholesale product planning and allocation processes to better match the
attributes of our department store consumers in each local market.
5
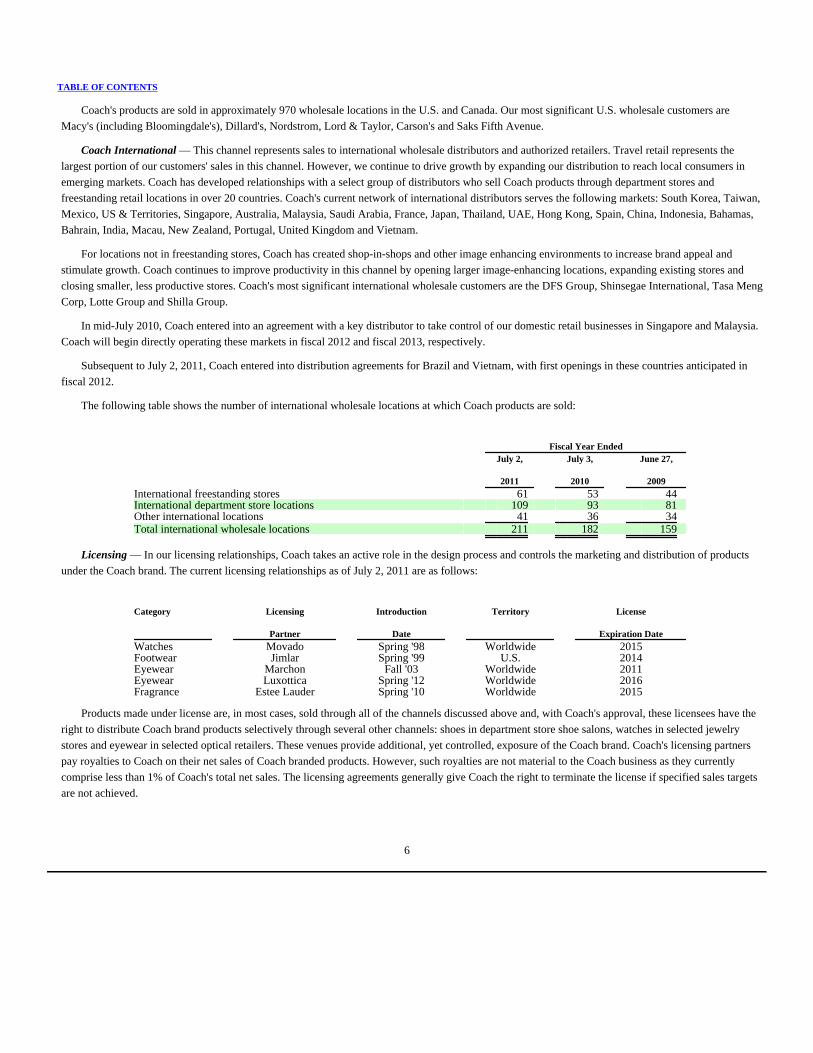
TABLE OF CONTENTS
Coach's products are sold in approximately 970 wholesale locations in the U.S. and Canada. Our most significant U.S. wholesale customers are
Macy's (including Bloomingdale's), Dillard's, Nordstrom, Lord & Taylor, Carson's and Saks Fifth Avenue.
Coach International — This channel represents sales to international wholesale distributors and authorized retailers. Travel retail represents the
largest portion of our customers' sales in this channel. However, we continue to drive growth by expanding our distribution to reach local consumers in
emerging markets. Coach has developed relationships with a select group of distributors who sell Coach products through department stores and
freestanding retail locations in over 20 countries. Coach's current network of international distributors serves the following markets: South Korea, Taiwan,
Mexico, US & Territories, Singapore, Australia, Malaysia, Saudi Arabia, France, Japan, Thailand, UAE, Hong Kong, Spain, China, Indonesia, Bahamas,
Bahrain, India, Macau, New Zealand, Portugal, United Kingdom and Vietnam.
For locations not in freestanding stores, Coach has created shop-in-shops and other image enhancing environments to increase brand appeal and
stimulate growth. Coach continues to improve productivity in this channel by opening larger image-enhancing locations, expanding existing stores and
closing smaller, less productive stores. Coach's most significant international wholesale customers are the DFS Group, Shinsegae International, Tasa Meng
Corp, Lotte Group and Shilla Group.
In mid-July 2010, Coach entered into an agreement with a key distributor to take control of our domestic retail businesses in Singapore and Malaysia.
Coach will begin directly operating these markets in fiscal 2012 and fiscal 2013, respectively.
Subsequent to July 2, 2011, Coach entered into distribution agreements for Brazil and Vietnam, with first openings in these countries anticipated in
fiscal 2012.
The following table shows the number of international wholesale locations at which Coach products are sold:
Fiscal Year Ended
July 2,
2011
July 3,
2010
June 27,
2009International freestanding stores 61 53 44 International department store locations 109 93 81 Other international locations 41 36 34 Total international wholesale locations 211 182 159
Licensing — In our licensing relationships, Coach takes an active role in the design process and controls the marketing and distribution of products
under the Coach brand. The current licensing relationships as of July 2, 2011 are as follows:
Category Licensing
Partner
Introduction
Date
Territory License
Expiration DateWatches Movado Spring '98 Worldwide 2015Footwear Jimlar Spring '99 U.S. 2014Eyewear Marchon Fall '03 Worldwide 2011Eyewear Luxottica Spring '12 Worldwide 2016Fragrance Estee Lauder Spring '10 Worldwide 2015
Products made under license are, in most cases, sold through all of the channels discussed above and, with Coach's approval, these licensees have the
right to distribute Coach brand products selectively through several other channels: shoes in department store shoe salons, watches in selected jewelry
stores and eyewear in selected optical retailers. These venues provide additional, yet controlled, exposure of the Coach brand. Coach's licensing partners
pay royalties to Coach on their net sales of Coach branded products. However, such royalties are not material to the Coach business as they currently
comprise less than 1% of Coach's total net sales. The licensing agreements generally give Coach the right to terminate the license if specified sales targets
are not achieved.
6
TABLE OF CONTENTS
MARKETING
Coach's marketing strategy is to deliver a consistent message each time the consumer comes in contact with the Coach brand through our
communications and visual merchandising. The Coach image is created internally and executed by the creative marketing, visual merchandising and
public relations teams. Coach also has a sophisticated consumer and market research capability, which helps us assess consumer attitudes and trends and
gauge the likelihood of a product's success in the marketplace prior to its introduction.
In conjunction with promoting a consistent global image, Coach uses its extensive customer database and consumer knowledge to target specific
products and communications to specific consumers to efficiently stimulate sales across all distribution channels.
Coach engages in several consumer communication initiatives, including direct marketing activities and national, regional and local advertising. In
fiscal 2011, consumer contacts increased 52% to over 625 million primarily driven by increased email communications. The Company continues to
leverage marketing expenses by refining our marketing programs to increase productivity and optimize distribution. Total expenses related to consumer
communications in fiscal 2011 were $75.0 million, representing less than 2% of net sales.
Coach's wide range of direct marketing activities includes email contacts, catalogs and brochures targeted to promote sales to consumers in their
preferred shopping venue. In addition to building brand awareness, the coach.com and reedkrakoff.com websites and the Coach catalog serve as effective
brand communications vehicles by providing a showcase environment where consumers can browse through a strategic offering of the latest styles and
colors, which drive store traffic.
As part of Coach's direct marketing strategy, the Company uses its database consisting of approximately 19 million active households in North
America and 4.2 million active households in Japan. Email contacts and catalogs are Coach's principal means of communication and are sent to selected
households to stimulate consumer purchases and build brand awareness. During fiscal 2011, the Company sent approximately 480 million emails to
strategically selected customers as we continue to evolve our internet outreach to maximize productivity while streamlining distribution. In fiscal 2011, the
Company distributed approximately a million catalogs in Coach stores in Japan, Hong Kong, Macau and mainland China. The growing number of visitors
to the coach.com websites in the U.S., Canada and Japan provides an opportunity to increase the size of these databases.
In fiscal 2011, Coach had informational websites in Australia, Bahrain, China, France, Malaysia, Mexico, Portugal, Singapore, South Korea, Spain,
Taiwan, Thailand, UAE and United Kingdom. In addition, the Company utilizes and continues to explore new technologies such as blogs and social
networking websites, including Twitter and Facebook, as a cost effective consumer communication opportunity to increase on-line and store sales and
build brand awareness.
The Company also runs national, regional and local advertising campaigns in support of its major selling seasons.
MANUFACTURING
While all of our products are manufactured by independent manufacturers, we nevertheless maintain control of the supply chain process from design
through manufacture. We are able to do this by qualifying raw material suppliers and by maintaining sourcing and product development offices in Hong
Kong, China, South Korea, India, Italy and Vietnam that work closely with our independent manufacturers. This broad-based, global manufacturing
strategy is designed to optimize the mix of cost, lead times and construction capabilities. Over the last several years, we have increased the presence of our
senior management at our manufacturers' facilities to enhance control over decision making and ensure the speed with which we bring new product to
market is maximized.
These independent manufacturers support a broad mix of product types, materials and a seasonal influx of new, fashion oriented styles, which allows
us to meet shifts in marketplace demand and changes in consumer preferences. During fiscal 2011, approximately 84% of Coach's total net sales were
generated from
7

TABLE OF CONTENTS
products introduced within the fiscal year. As the collections are seasonal and planned to be sold in stores for short durations, our production quantities are
limited which lowers our exposure to excess and obsolete inventory.
All product sources, including independent manufacturers and licensing partners, must achieve and maintain Coach's high quality standards, which are
an integral part of the Coach identity. One of Coach's keys to success lies in the rigorous selection of raw materials. Coach has longstanding relationships
with purveyors of fine leathers and hardware. Although Coach products are manufactured by independent manufacturers, we maintain control of the raw
materials that are used in all of our products. Compliance with quality control standards is monitored through on-site quality inspections at all independent
manufacturing facilities.
Coach carefully balances its commitments to a limited number of "better brand" partners with demonstrated integrity, quality and reliable delivery.
Our manufacturers are located in many countries, including China, United States, Italy, Hong Kong, India, Thailand, Vietnam, Macau, Philippines,
Turkey, Colombia, Malaysia, Mexico, Peru, South Africa and Taiwan. Coach continues to evaluate new manufacturing sources and geographies to deliver
the finest quality products at the lowest cost and help limit the impact of manufacturing in inflationary markets. No one vendor currently provides more
than approximately 15% of Coach's total units. Before partnering with a vendor, Coach evaluates each facility by conducting a quality and business
practice standards audit. Periodic evaluations of existing, previously approved facilities are conducted on a random basis. We believe that all of our
manufacturing partners are in material compliance with Coach's integrity standards.
DISTRIBUTION
Coach operates an 850,000 square foot distribution and consumer service facility in Jacksonville, Florida. This automated facility uses a bar code
scanning warehouse management system. Coach's distribution center employees use handheld radio frequency scanners to read product bar codes, which
allow them to more accurately process and pack orders, track shipments, manage inventory and generally provide excellent service to our customers.
Coach's products are primarily shipped to Coach retail stores and wholesale customers via express delivery providers and common carriers, and direct to
consumers via express delivery providers.
To support our growth in China and the region, during the second half of fiscal 2010 we established an Asia distribution center in Shanghai, owned
and operated by a third-party, allowing us to better manage the logistics in this region while reducing costs. The Company also operates a distribution
center, through a third-party, in Japan.
MANAGEMENT INFORMATION SYSTEMS
The foundation of Coach's information systems is its Enterprise Resource Planning ("ERP") system. This fully integrated system supports all aspects
of finance and accounting, procurement, inventory control, sales and store replenishment. The system functions as a central repository for all of Coach's
transactional information, resulting in increased efficiencies, improved inventory control and a better understanding of consumer demand. This system was
upgraded in fiscal 2008 and continues to be fully scalable to accommodate growth.
Complementing its ERP system are several other system solutions, each of which Coach believes is well suited for its needs. The data warehouse
system summarizes the transaction information and provides a single platform for all management reporting. The supply chain management system
supports sales and inventory planning and reporting functions. Product fulfillment is facilitated by Coach's highly automated warehouse management
system and electronic data interchange system, while the unique requirements of Coach's internet and catalog businesses are supported by Coach's order
management system. Finally, the point-of-sale system supports all in-store transactions, distributes management reporting to each store, and collects sales
and payroll information on a daily basis. This daily collection of store sales and inventory information results in early identification of business trends and
provides a detailed baseline for store inventory replenishment. Updates and upgrades of these systems are made on a periodic basis in order to ensure that
we constantly improve our functionality. All complementary systems are integrated with the central ERP system.
8

TABLE OF CONTENTS
TRADEMARKS AND PATENTS
Coach owns all of the material trademark rights used in connection with the production, marketing and distribution of all of its products, both in the
U.S. and in other countries in which the products are principally sold. Coach also owns and maintains worldwide registrations for trademarks in all
relevant classes of products in each of the countries in which Coach products are sold. Major trademarks include Coach, Coach and lozenge design, Coach
and tag design, Signature C design, Coach Op Art design and The Heritage Logo (Coach Leatherware Est. 1941). Coach is not dependent on any one
particular trademark or design patent although Coach believes that the Coach name is important for its business. In addition, several of Coach's products
are covered by design patents or patent applications. Coach aggressively polices its trademarks and trade dress, and pursues infringers both domestically
and internationally. It also pursues counterfeiters domestically and internationally through leads generated internally, as well as through its network of
investigators, the Coach hotline and business partners around the world.
Coach expects that its material trademarks will remain in existence for as long as Coach continues to use and renew them. Coach has no material
patents.
SEASONALITY
Because Coach products are frequently given as gifts, Coach has historically realized, and expects to continue to realize, higher sales and operating
income in the second quarter of its fiscal year, which includes the holiday months of November and December. In addition, fluctuations in sales and
operating income in any fiscal quarter are affected by the timing of seasonal wholesale shipments and other events affecting retail sales. Over the last
several years, we have achieved higher levels of growth in the non-holiday quarters, which has reduced these seasonal fluctuations.
GOVERNMENT REGULATION
Most of Coach's imported products are subject to existing or potential duties, tariffs or quotas that may limit the quantity of products that Coach may
import into the U.S. and other countries or may impact the cost of such products. Coach has not been restricted by quotas in the operation of its business
and customs duties have not comprised a material portion of the total cost of its products. In addition, Coach is subject to foreign governmental regulation
and trade restrictions, including retaliation against certain prohibited foreign practices, with respect to its product sourcing and international sales
operations.
COMPETITION
The premium handbag and accessories industry is highly competitive. The Company mainly competes with European luxury brands as well as private
label retailers, including some of Coach's wholesale customers. Over the last several years the category has grown, encouraging the entry of new
competitors as well as increasing the competition from existing competitors. The Company believes, however, that as a market leader we benefit from this
increased competition as it drives consumer interest in this brand loyal category.
The Company further believes that there are several factors that differentiate us from our competitors, including but not limited to: distinctive
newness, innovation and quality of our products, ability to meet consumer's changing preferences and our superior customer service.
EMPLOYEES
As of July 2, 2011, Coach employed approximately 15,000 people, including both full and part time employees. Of these employees, approximately
5,200 and 6,800 were full time and part time employees, respectively, in the retail field in North America, Japan, Hong Kong, Macau, and mainland
China. Approximately 65 of Coach's employees are covered by collective bargaining agreements. Coach believes that its relations with its employees are
good, and it has never encountered a strike or work stoppage.
FINANCIAL INFORMATION ABOUT GEOGRAPHIC AREAS
See the Segment Information note presented in the Notes to the Consolidated Financial Statements for geographic information.
9
TABLE OF CONTENTS
AVAILABLE INFORMATION
Our Annual Reports on Form 10-K, Quarterly Reports on Form 10-Q, Current Reports on Form 8-K, and all amendments to these reports filed or
furnished pursuant to Section 13(a) or 15(d) of the Securities Exchange Act of 1934, are available free of charge on our website, located at
www.coach.com, as soon as reasonably practicable after they are filed with or furnished to the Securities and Exchange Commission. These reports are
also available on the Securities and Exchange Commission's website at www.sec.gov. No information contained on any of our websites is intended to be
included as part of, or incorporated by reference into, this Annual Report on Form 10-K.
The Company has included the Chief Executive Officer ("CEO") and Chief Financial Officer certifications regarding its public disclosure required by
Section 302 of the Sarbanes-Oxley Act of 2002 as Exhibit 31.1 to this report on Form 10-K. Additionally, the Company filed with the New York Stock
Exchange ("NYSE") the CEO's certification regarding the Company's compliance with the NYSE's Corporate Governance Listing Standards ("Listing
Standards") pursuant to Section 303A.12(a) of the Listing Standards, which indicated that the CEO was not aware of any violations of the Listing
Standards by the Company.
ITEM 1A. RISK FACTORS
You should consider carefully all of the information set forth or incorporated by reference in this document and, in particular, the following risk
factors associated with the Business of Coach and forward-looking information in this document. Please also see "Special Note on Forward-Looking
Information" at the beginning of this report. The risks described below are not the only ones we face. Additional risks not presently known to us or that we
currently deem immaterial may also have an adverse effect on us. If any of the risks below actually occur, our business, results of operations, cash flows
or financial condition could suffer.
The current economic conditions could materially adversely affect our financial condition, results of operations and consumer purchases of luxuryitems.
The current uncertain global economic conditions are having a significant negative impact on businesses around the world. Our results can be
impacted by a number of macroeconomic factors, including but not limited to consumer confidence and spending levels, unemployment, consumer credit
availability, raw materials costs, fuel and energy costs, global factory production, commercial real estate market conditions, credit market conditions and
the level of customer traffic in malls and shopping centers.
Demand for our products, and consumer spending in the premium handbag and accessories market generally, is significantly impacted by trends in
consumer confidence, general business conditions, interest rates, the availability of consumer credit, and taxation. Consumer purchases of discretionary
luxury items, such as Coach products, tend to decline during recessionary periods, when disposable income is lower. The general economic conditions in
the economy may continue to affect consumer purchases of our products for the foreseeable future and adversely impact our results of operations.
The growth of our business depends on the successful execution of our growth strategies, including our efforts to expand internationally.
Our growth depends on the continued success of existing products, as well as the successful design and introduction of new products. Our ability to
create new products and to sustain existing products is affected by whether we can successfully anticipate and respond to consumer preferences and
fashion trends. The failure to develop and launch successful new products could hinder the growth of our business. Also, any delay in the development or
launch of a new product could result in our not being the first to market, which could compromise our competitive position.
Additionally, our current growth strategy includes plans to expand in a number of international regions, including Asia and Europe. We currently plan
to open additional Coach stores in China, and we have entered into strategic agreements with various partners to expand our operations in Europe and to
take control of certain of our retail operations in the Asia-Pacific region. We do not yet have significant experience operating in these countries, and in
many of them we face established competitors. Many of these countries have different operational characteristics, including but not limited to employment
and labor, transportation, logistics, real estate, and local reporting or legal requirements.
10

TABLE OF CONTENTS
Furthermore, consumer demand and behavior, as well as tastes and purchasing trends may differ in these countries, and as a result, sales of our
product may not be successful, or the margins on those sales may not be in line with those we currently anticipate. In many of these countries, there is
significant competition to attract and retain experienced and talented employees. If our international expansion plans are unsuccessful, our financial results
could be materially adversely affected.
Significant competition in our industry could adversely affect our business.
We face intense competition in the product lines and markets in which we operate. Our competitors are European and American luxury brands as well
as private label retailers, including some of Coach's wholesale customers. There is a risk that our competitors may develop new products that are more
popular with our customers. We may be unable to anticipate the timing and scale of such product introductions by competitors, which could harm our
business. Our ability to compete also depends on the strength of our brand, whether we can attract and retain key talent, and our ability to protect our
trademarks and design patents. A failure to compete effectively could adversely affect our growth and profitability.
We face risks associated with operating in international markets.
We operate on a global basis, with approximately 30% of our net sales coming from operations outside the U.S. However, sales to our international
wholesale customers are denominated in U.S. dollars. While geographic diversity helps to reduce the Company's exposure to risks in any one country, we
are subject to risks associated with international operations, including, but not limited to:
• changes in exchange rates for foreign currencies, which may adversely affect the retail prices of our products, result in decreased international
consumer demand, or increase our supply costs in those markets, with a corresponding negative impact on our gross margin rates,
• political or economic instability or changing macroeconomic conditions in our major markets,
• natural and other disasters in international and other markets such as the recent earthquake and tsunami in Japan, and
• changes in foreign or domestic legal and regulatory requirements resulting in the imposition of new or more onerous trade restrictions, tariffs,
embargoes, exchange or other government controls.
We monitor our foreign currency exposure in Japan and Canada and in order to minimize the impact on earnings of foreign currency rate movements
we hedge our subsidiaries' U.S. dollar-denominated inventory purchases, as well as Coach Japan's U.S. dollar-denominated intercompany loan. We cannot
ensure, however, that these hedges will succeed in offsetting any impact of foreign currency rate movements.
Failure to adequately protect our intellectual property and curb the sale of counterfeit merchandise could injure the brand and negatively affect sales.
We believe our trademarks, copyrights, patents, and other intellectual property rights are extremely important to our success and our competitive
position. We devote significant resources to the registration and protection of our trademarks and to anti-counterfeiting efforts worldwide. In spite of our
efforts, counterfeiting still occurs and if we are unsuccessful in challenging a third-party's rights related to trademark, copyright, or patent this could
adversely affect our future sales, financial condition, and results of operation. We are aggressive in pursuing entities involved in the trafficking and sale of
counterfeit merchandise through legal or other appropriate action. We cannot guarantee that the actions we have taken to curb counterfeiting and protect
our intellectual property will be adequate to prevent to protect the brand and prevent counterfeiting in the future. Furthermore, our efforts to enforce our
intellectual property rights are often met with defenses and counterclaims attacking the validity and enforceability of our intellectual property rights.
Unplanned increases in legal fees and other costs associates with defending our intellectual property rights could result in higher operating expenses.
Finally, many countries' laws do not protect intellectual property rights to the same degree as US laws.
11

TABLE OF CONTENTS
Our business is subject to the risks inherent in global sourcing activities.
As a company engaged in sourcing on a global scale, we are subject to the risks inherent in such activities, including, but not limited to:
• unavailability of or significant fluctuations in the cost of raw materials,
• compliance with labor laws and other foreign governmental regulations,
• imposition of additional duties, taxes and other charges on imports or exports,
• increases in the cost of labor, fuel, travel and transportation,
• compliance with our Global Business Integrity Program,
• disruptions or delays in shipments,
• loss or impairment of key manufacturing sites,
• inability to engage new independent manufacturers that meet the Company's cost-effective sourcing model,
• product quality issues,
• political unrest, and
• natural disasters, acts of war or terrorism and other external factors over which we have no control.
While we require our independent manufacturers and suppliers to operate in compliance with applicable laws and regulations, as well as our Global
Operating Principles and/or Supplier Selection Guidelines, we do not control these manufacturers or suppliers or their labor or other business practices.
Copies of our Global Business Integrity Program, Global Operating Principles and Supplier Selection Guidelines are posted on our website, coach.com.
The violation of labor or other laws by an independent manufacturer or supplier, or divergence of an independent manufacturer's or suppliers' labor
practices from those generally accepted as ethical or appropriate in the U.S., could interrupt or otherwise disrupt the shipment of our products, harm our
trademarks or damage our reputation. The occurrence of any of these events could adversely affect our financial condition and results of operations.
While we have business continuity and contingency plans for our sourcing sites, significant disruption of manufacturing for any of the above reasons
could interrupt product supply and, if not remedied in a timely manner, could have an adverse impact on our business.
Increases in our costs, such as raw materials, labor or freight could negatively impact our overall profitability. Labor costs at many of our
manufacturers has been increasing significantly and, as the middle class in developing countries continues to grow, it is unlikely that such cost pressure
will abate. The cost of transportation has been increasing as well and it is unlikely such cost pressure will abate if oil prices continue to increase. We may
not be able to offset such increases in raw materials or labor or transportation costs through pricing measures or other means. These increasing costs of
productions could also adversely affect our ability to achieve the gross margin objectives we have established.
Our business is subject to increased costs due to excess inventories if we misjudge the demand for our products.
If Coach misjudges the market for its products it may be faced with significant excess inventories for some products and missed opportunities for
other products. In addition, because Coach places orders for products with its manufacturers before it receives wholesale customers' orders, it could
experience higher excess inventories if wholesale customers order fewer products than anticipated. If that occurs, we may be forced to rely on markdowns
or promotional sales to dispose of excess, slow-moving inventory, which may negatively impact our business.
12

TABLE OF CONTENTS
Our Indirect segment could suffer as a result of consolidations, liquidations, restructurings and other ownership changes in the retail industry.
Our Indirect segment, consisting of the U.S. Wholesale and Coach International businesses comprised approximately 13% of total net sales for fiscal
2011. Continued consolidation in the retail industry could further decrease the number of, or concentrate the ownership of, stores that carry our and our
licensees' products. Furthermore, a decision by the controlling owner of a group of stores or any other significant customer, whether motivated by
competitive conditions, financial difficulties or otherwise, to decrease or eliminate the amount of merchandise purchased from us or our licensing partners
could result in an adverse effect on the sales and profitability within our Indirect segment.
Our operating results are subject to seasonal and quarterly fluctuations, which could adversely affect the market price of Coach common stock.
Because Coach products are frequently given as gifts, Coach has historically realized, and expects to continue to realize, higher sales and operating
income in the second quarter of its fiscal year, which includes the holiday months of November and December. Poor sales in Coach's second fiscal quarter
would have a material adverse effect on its full year operating results and result in higher inventories. In addition, fluctuations in sales and operating
income in any fiscal quarter are affected by the timing of seasonal wholesale shipments and other events affecting retail sales.
If we are unable to pay quarterly dividends at intended levels, our reputation and stock price may be harmed.
Our quarterly cash dividend is currently $0.225 per common share. The dividend program requires the use of a modest portion of our cash flow. Our
ability to pay dividends will depend on our ability to generate sufficient cash flows from operations in the future. This ability may be subject to certain
economic, financial, competitive and other factors that are beyond our control. Our Board of Directors ("Board") may, at its discretion, decrease the
intended level of dividends or entirely discontinue the payment of dividends at any time. Any failure to pay dividends after we have announced our
intention to do so may negatively impact our reputation, investor confidence in us and negatively impact our stock price.
Fluctuations in our tax obligations and effective tax rate may result in volatility of our operating results and stock price.
We are subject to income taxes in many U.S. and certain foreign jurisdictions. We record tax expense based on our estimates of future payments,
which includes reserves for uncertain tax positions in multiple tax jurisdictions. At any one time, many tax years are subject to audit by various taxing
jurisdictions. The results of these audits and negotiations with taxing authorities may affect the ultimate settlement of these issues. As a result, we expect
that throughout the year there could be ongoing variability in our quarterly tax rates as events occur and exposures are evaluated. In addition, our effective
tax rate in a given financial statement period may be materially impacted by changes in the mix and level of earnings or by changes to existing accounting
rules or regulations. Further, there is proposed tax legislation that may be enacted in the future, which could negatively impact our current or future tax
structure and effective tax rates.
Provisions in Coach's charter, bylaws and Maryland law may delay or prevent an acquisition of Coach by a third party.
Coach's charter, bylaws and Maryland law contain provisions that could make it more difficult for a third party to acquire Coach without the consent
of Coach's Board. Coach's charter permits its Board, without stockholder approval, to amend the charter to increase or decrease the aggregate number of
shares of stock or the number of shares of stock of any class or series that Coach has the authority to issue. In addition, Coach's Board may classify or
reclassify any unissued shares of common stock or preferred stock and may set the preferences, rights and other terms of the classified or reclassified
shares. Although Coach's Board has no intention to do so at the present time, it could establish a series of preferred stock that could have the effect of
delaying, deferring or preventing a transaction or a change in control that might involve a premium price for Coach's common stock or otherwise be in the
best interest of Coach's stockholders.
13
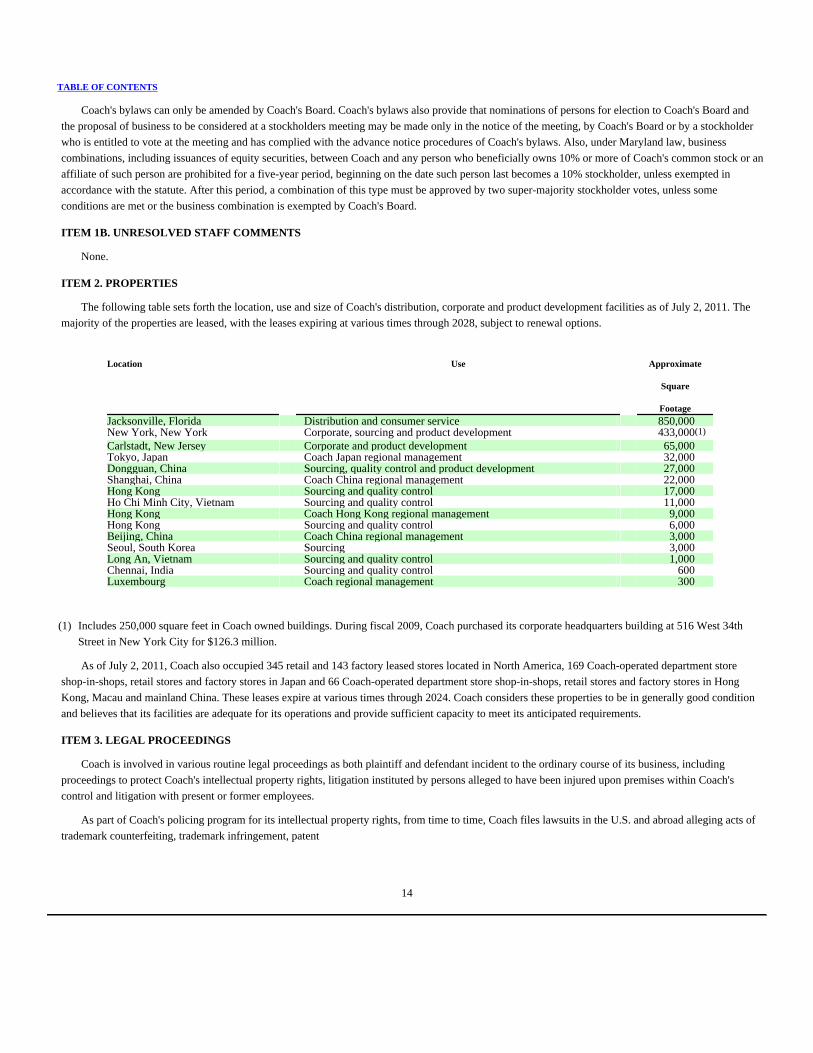
TABLE OF CONTENTS
Coach's bylaws can only be amended by Coach's Board. Coach's bylaws also provide that nominations of persons for election to Coach's Board and
the proposal of business to be considered at a stockholders meeting may be made only in the notice of the meeting, by Coach's Board or by a stockholder
who is entitled to vote at the meeting and has complied with the advance notice procedures of Coach's bylaws. Also, under Maryland law, business
combinations, including issuances of equity securities, between Coach and any person who beneficially owns 10% or more of Coach's common stock or an
affiliate of such person are prohibited for a five-year period, beginning on the date such person last becomes a 10% stockholder, unless exempted in
accordance with the statute. After this period, a combination of this type must be approved by two super-majority stockholder votes, unless some
conditions are met or the business combination is exempted by Coach's Board.
ITEM 1B. UNRESOLVED STAFF COMMENTS
None.
ITEM 2. PROPERTIES
The following table sets forth the location, use and size of Coach's distribution, corporate and product development facilities as of July 2, 2011. The
majority of the properties are leased, with the leases expiring at various times through 2028, subject to renewal options.
Location Use Approximate
Square
Footage
Jacksonville, Florida Distribution and consumer service 850,000 New York, New York Corporate, sourcing and product development 433,000(1) Carlstadt, New Jersey Corporate and product development 65,000 Tokyo, Japan Coach Japan regional management 32,000 Dongguan, China Sourcing, quality control and product development 27,000 Shanghai, China Coach China regional management 22,000 Hong Kong Sourcing and quality control 17,000 Ho Chi Minh City, Vietnam Sourcing and quality control 11,000 Hong Kong Coach Hong Kong regional management 9,000 Hong Kong Sourcing and quality control 6,000 Beijing, China Coach China regional management 3,000 Seoul, South Korea Sourcing 3,000 Long An, Vietnam Sourcing and quality control 1,000 Chennai, India Sourcing and quality control 600 Luxembourg Coach regional management 300
(1) Includes 250,000 square feet in Coach owned buildings. During fiscal 2009, Coach purchased its corporate headquarters building at 516 West 34th
Street in New York City for $126.3 million.
As of July 2, 2011, Coach also occupied 345 retail and 143 factory leased stores located in North America, 169 Coach-operated department store
shop-in-shops, retail stores and factory stores in Japan and 66 Coach-operated department store shop-in-shops, retail stores and factory stores in Hong
Kong, Macau and mainland China. These leases expire at various times through 2024. Coach considers these properties to be in generally good condition
and believes that its facilities are adequate for its operations and provide sufficient capacity to meet its anticipated requirements.
ITEM 3. LEGAL PROCEEDINGS
Coach is involved in various routine legal proceedings as both plaintiff and defendant incident to the ordinary course of its business, including
proceedings to protect Coach's intellectual property rights, litigation instituted by persons alleged to have been injured upon premises within Coach's
control and litigation with present or former employees.
As part of Coach's policing program for its intellectual property rights, from time to time, Coach files lawsuits in the U.S. and abroad alleging acts of
trademark counterfeiting, trademark infringement, patent
14

TABLE OF CONTENTS
infringement, trade dress infringement, trademark dilution and/or state or foreign law claims. At any given point in time, Coach may have a number of
such actions pending. These actions often result in seizure of counterfeit merchandise and/or out of court settlements with defendants. From time to time,
defendants will raise, either as affirmative defenses or as counterclaims, the invalidity or unenforceability of certain of Coach's intellectual properties.
Although Coach's litigation with present or former employees is routine and incidental to the conduct of Coach's business, as well as for any business
employing significant numbers of employees, such litigation can result in large monetary awards when a civil jury is allowed to determine compensatory
and/or punitive damages for actions claiming discrimination on the basis of age, gender, race, religion, disability or other legally protected characteristic or
for termination of employment that is wrongful or in violation of implied contracts.
Coach believes that the outcome of all pending legal proceedings in the aggregate will not have a material adverse effect on Coach's business or
consolidated financial statements.
Coach has not entered into any transactions that have been identified by the IRS as abusive or that have a significant tax avoidance purpose.
Accordingly, we have not been required to pay a penalty to the IRS for failing to make disclosures required with respect to certain transactions that have
been identified by the IRS as abusive or that have a significant tax avoidance purpose.
15

TABLE OF CONTENTS
PART II
ITEM 5. MARKET FOR REGISTRANT'S COMMON EQUITY, RELATED STOCKHOLDER MATTERS AND ISSUER PURCHASES OFEQUITY SECURITIES
Market and Dividend Information
Coach's common stock is listed on the New York Stock Exchange and is traded under the symbol "COH." The following table sets forth, for the fiscal
periods indicated, the high and low prices per share of Coach's common stock as reported on the New York Stock Exchange Composite Index.
High Low Dividends
Declared per
Common Share
Fiscal 2011 Quarter ended:
October 2, 2010 $ 43.86 $ 33.75 0.150 January 1, 2011 58.55 42.27 0.150 April 2, 2011 58.28 49.24 0.150 July 2, 2011 66.14 50.34 0.225 Closing price at July 1, 2011 $ 65.99 Fiscal 2010 Quarter ended:
September 26, 2009 $ 33.80 $ 22.94 0.075 December 26, 2009 37.35 31.04 0.075 March 27, 2010 40.60 32.96 0.075 July 3, 2010 44.37 35.36 0.150 Closing price at July 2, 2010 $ 35.77
As of August 5, 2011, there were 3,461 holders of record of Coach's common stock.
Any future determination to pay cash dividends will be at the discretion of Coach's Board and will be dependent upon Coach's financial condition,
operating results, capital requirements and such other factors as the Board deems relevant.
16

TABLE OF CONTENTS
Performance Graph
The following graph compares the cumulative total stockholder return (assuming reinvestment of dividends) of Coach's common stock with the
cumulative total return of the S&P 500 Stock Index and the "peer group" companies listed below over the five-fiscal-year period ending July 1, 2011, the
last trading day of Coach's most recent fiscal year. Coach's "peer group," as determined by management, consists of:
• Ann Taylor Stores Corporation,
• Kenneth Cole Productions, Inc.,
• Polo Ralph Lauren Corporation,
• Tiffany & Co.,
• Talbots, Inc., and
• Williams-Sonoma, Inc.
TOTAL RETURN PERFORMANCE GRAPH
Jun-06 Jun-07 Jun-08 Jun-09 Jul-10 Jul-11
COH $ 100.00 $ 161.34 $ 97.69 $ 87.73 $ 122.91 $ 229.70 Peer Set 100.00 129.07 80.64 48.04 81.34 128.70 S&P 500 100.00 121.37 102.58 74.79 87.07 116.36
The graph assumes that $100 was invested on June 30, 2006 at the per share closing price in each of Coach's common stock, the S&P 500 Stock Index
and a "Peer Group" index compiled by us tracking the peer group companies listed above, and that all dividends were reinvested. The stock performance
shown in the graph is not intended to forecast or be indicative of future performance.
17

TABLE OF CONTENTS
Stock Repurchase Program
The Company's share repurchases during the fourth quarter of fiscal 2011 were as follows:
Period Total Number of
Shares Purchased Average Price Paid
per Share Total Number of Shares
Purchased as Part of PubliclyAnnounced Plans or
Programs(1)
Approximate Dollar Value ofShares that May Yet be
Purchased Under the Plans orPrograms(1)
(in thousands, except per share data)Period 10
(4/3/11 – 5/7/11)
1,231 $ 59.50 1,231 $ 1,268,963
Period 11(5/8/11 – 6/4/11)
3,212 60.25 3,212 1,075,432
Period 12(6/5/11 – 7/2/11)
1,891 60.18 1,891 961,627
Total 6,334 6,334
(1) The Company repurchases its common shares under repurchase programs that were approved by the Board as follows:
Date Share Repurchase Programs were Publicly Announced
Total Dollar Amount Approved Expiration Date of Plan
January 25, 2011 $1.5 billion June 2013
18

TABLE OF CONTENTS
ITEM 6. SELECTED FINANCIAL DATA (dollars and shares in thousands, except per share data)
The selected historical financial data presented below as of and for each of the fiscal years in the five-year period ended July 2, 2011 have been
derived from Coach's audited Consolidated Financial Statements. The financial data should be read in conjunction with Item 7, "Management's Discussion
and Analysis of Financial Condition and Results of Operations," the Consolidated Financial Statements and Notes thereto and other financial data included
elsewhere herein.
Fiscal Year Ended(1)
July 2,
2011(2)
July 3,
2010
June 27,
2009(2)
June 28,
2008(2)
June 30,
2007(3)
Consolidated Statements of Income:
Net sales $4,158,507 $3,607,636 $3,230,468 $3,180,757 $2,612,456 Gross profit 3,023,541 2,633,691 2,322,610 2,407,103 2,022,986 Selling, general and administrative expenses 1,718,617 1,483,520 1,350,697 1,259,974 1,029,589 Operating income 1,304,924 1,150,171 971,913 1,147,129 993,397 Interest income, net(4) 1,031 7,961 10,779 44,639 41,273 Income from continuing operations 880,800 734,940 623,369 783,039 636,529 Income from continuing operations:
Per basic share $ 2.99 $ 2.36 $ 1.93 $ 2.20 $ 1.72 Per diluted share 2.92 2.33 1.91 2.17 1.69
Weighted-average basic shares outstanding 294,877 311,413 323,714 355,731 369,661 Weighted-average diluted shares outstanding 301,558 315,848 325,620 360,332 377,356 Dividends declared per common share(5) $ 0.675 $ 0.375 $ 0.075 $ — $ —
Consolidated Percentage of Net Sales Data:
Gross margin 72.7% 73.0% 71.9% 75.7% 77.4% Selling, general and administrative expenses 41.3% 41.1% 41.8% 39.6% 39.4% Operating margin 31.4% 31.9% 30.1% 36.1% 38.0% Income from continuing operations 21.2% 20.4% 19.3% 24.6% 24.4%
Consolidated Balance Sheet Data:
Working capital $ 859,371 $ 773,605 $ 936,757 $ 908,277 $1,309,299 Total assets 2,635,116 2,467,115 2,564,336 2,247,353 2,426,611 Cash, cash equivalents and investments 712,754 702,398 806,362 706,905 1,185,816 Inventory 421,831 363,285 326,148 318,490 267,779 Long-term debt 23,360 24,159 25,072 2,580 2,865 Stockholders' equity 1,612,569 1,505,293 1,696,042 1,490,375 1,888,499
Coach Operated Store Data:(6)
North American retail stores 345 342 330 297 259 North American factory stores 143 121 111 102 93 Coach Japan locations 169 161 155 149 137 Coach China locations 66 41 28 24 16
Total stores open at fiscal year-end 723 665 624 572 505 North American retail stores 936,277 929,580 893,037 795,226 672,737 North American factory stores 649,094 548,797 477,724 413,389 321,372 Coach Japan locations 303,925 293,441 280,428 259,993 229,862 Coach China locations 127,550 78,887 52,671 44,504 25,541
Total store square footage at fiscal year-end 2,016,846 1,850,705 1,703,860 1,513,112 1,249,512 Average store square footage at fiscal year-end:
North American retail stores 2,714 2,718 2,706 2,678 2,597 North American factory stores 4,539 4,536 4,304 4,053 3,456 Coach Japan locations 1,798 1,823 1,809 1,745 1,678 Coach China locations 1,933 1,924 1,881 1,854 1,596
(1) Coach's fiscal year ends on the Saturday closest to June 30. Fiscal years 2011, 2009, 2008 and 2007 were each 52-week years. Fiscal year 2010 was a
53-week year.
19

TABLE OF CONTENTS
(2) During fiscal 2011, fiscal 2009 and fiscal 2008, the Company recorded certain items which affect the comparability of our results. The following tables
reconcile the as reported results to such results excluding these items. See Item 7, "Management's Discussion and Analysis of Financial Condition and
Results of Operations," for further information about these items.
Fiscal 2011
Income from
Continuing Operations SG&A Operating
Income
Amount Per Diluted
ShareAs Reported: (GAAP Basis) $ 1,718,617 $ 1,304,924 $ 880,800 $ 2.92 Excluding items affecting comparability (25,678) 25,678 0 0.00 Adjusted: (Non-GAAP Basis) $ 1,692,939 $ 1,330,602 $ 880,800 $ 2.92
Fiscal 2009
Income from
Continuing Operations SG&A Operating
Income
Amount Per Diluted
ShareAs Reported: (GAAP Basis) $ 1,350,697 $ 971,913 $ 623,369 $ 1.91 Excluding items affecting comparability (28,365) 28,365 (1,241) 0.00 Adjusted: (Non-GAAP Basis) $ 1,322,332 $ 1,000,278 $ 622,128 $ 1.91
Fiscal 2008
Income from
Continuing Operations SG&A Operating
Income
Amount Per Diluted
ShareAs Reported: (GAAP Basis) $ 1,259,974 $ 1,147,129 $ 783,039 $ 2.17 Excluding items affecting comparability (32,100) 32,100 (41,037) (0.11) Adjusted: (Non-GAAP Basis) $ 1,227,874 $ 1,179,229 $ 742,002 $ 2.06
(3) During fiscal 2007, the Company exited its corporate accounts business.
(4) During fiscal 2011, the Company changed its method of accounting for the classification of interest and penalties related to uncertain tax positions to
include such amounts as a component of the Provision for income taxes. They had previously been classified within Interest income, net. Previously
reported amounts for fiscal years 2010, 2009 and 2008 have been restated to reflect this change. See the Change in Accounting Principle note
presented in the Notes to the Consolidated Financial Statements.
(5) During the fourth quarter of fiscal 2009, the Company initiated a cash dividend at an annual rate of $0.30 per share. During the fourth quarter of fiscal
2010, the Company increased the cash dividend to an annual rate of $0.60 per share. During the fourth quarter of fiscal 2011, the Company increased
the cash dividend to an expected annual rate of $0.90 per share.
(6) During fiscal 2009, the Company acquired its domestic retail businesses in Hong Kong, Macau and mainland China from its former distributor, the
ImagineX group. Prior to the acquisitions, these locations were operated by the ImagineX group. See the Acquisitions note presented in the Notes to
the Consolidated Financial Statements.
20

TABLE OF CONTENTS
ITEM 7. MANAGEMENT'S DISCUSSION AND ANALYSIS OF FINANCIAL CONDITION AND RESULTS OF OPERATIONS
The following discussion of Coach's financial condition and results of operations should be read together with Coach's financial statements and notes
to those statements included elsewhere in this document. When used herein, the terms "Coach," "Company," "we," "us" and "our" refer to Coach, Inc.,
including consolidated subsidiaries.
EXECUTIVE OVERVIEW
Coach is a leading American marketer of fine accessories and gifts for women and men. Our product offerings include women's and men's bags,
accessories, business cases, footwear, wearables, jewelry, sunwear, travel bags, watches and fragrance. Coach operates in two segments: Direct-to-
Consumer and Indirect. The Direct-to-Consumer segment includes sales to consumers through Company-operated stores in North America, Japan, Hong
Kong, Macau and mainland China, the Internet and Coach catalog. The Indirect segment includes sales to wholesale customers and distributors in over 20
countries, including the United States, and royalties earned on licensed product. As Coach's business model is based on multi-channel international
distribution, our success does not depend solely on the performance of a single channel or geographic area.
In order to sustain growth within our global framework, we continue to focus on two key growth strategies: increased global distribution, with an
emphasis on North America and China, and improved store sales productivity. To that end we are focused on five key initiatives:
• Build market share in North America's accessories market in part by growing our North American retail store base by opening stores in new
markets and adding stores in under-penetrated existing markets. We believe that North America can support about 500 retail stores in total,
including up to 30 in Canada. We expect to open about 15 net new retail stores and 25 factory outlets in fiscal 2012. The pace of our future retail
store openings will depend upon the economic environment and will reflect opportunities in the marketplace. In addition, as part of our culture of
innovation and continuous improvement, we have implemented a number of initiatives to accelerate the level of newness, elevate our product
offering and enhance the in-store experience. These initiatives will enable us to maximize productivity and continue to leverage our leadership
position in the market.
• Raise brand awareness and build market share in markets in which Coach is under-penetrated, most notably in Asia, where China is our largest
geographic opportunity as our brand awareness is increasing and the category is developing rapidly. We currently plan to open about 30 new
locations in mainland China during fiscal 2012. Outside of Asia, we are developing the brand opportunity as we expand into Europe and South
America.
• Refocus on the Men's opportunity for the brand, globally, drawing on our long heritage in the category, notably in North America and Asia. We
have implemented a number of initiatives to elevate our Men's product offering through image-enhancing and accessible locations. To this end, in
fiscal 2012 our new store openings in North America and Japan will focus primarily on Men's factory and retail stores, while our new shops in
China will be dual-gender locations. Specifically, we expect about half our North American retail store openings to be Men's locations and about
15 Men's-only factory stores.
• Continue to expand market share with the Japanese consumer, driving growth in Japan primarily by opening new retail locations. We believe that
Japan can support about 180 retail locations in total. We currently plan to open approximately 15 net new locations during fiscal 2012.
• Raise brand awareness and build market share through our digital strategy, coach.com, our global e-commerce sites, marketing sites and social
networking. The Company utilizes and continues to explore implementing new technologies such as our global web presence, with 17
informational websites in 18 countries with e-commerce enabled in the United States, Canada and Japan, social networking and blogs as cost-
effective consumer communication opportunities to increase on-line and store sales.
21

TABLE OF CONTENTS
We believe the growth strategies described above will allow us to deliver long-term superior returns on our investments and drive increased cash
flows from operating activities. However, the current macroeconomic environment, while stabilizing, has created a challenging retail market in which
consumers, notably in North America and Japan, are still cautious. The Company believes long-term growth can still be achieved through a combination
of expanded distribution, a focus on innovation to support productivity and disciplined expense control. Our multi-channel distribution model is
diversified and includes substantial international and factory businesses, which reduces our reliance upon our full-price U.S. business. With an essentially
debt-free balance sheet and significant cash position, we believe we are well positioned to manage our business to take advantage of profitable growth
opportunities while returning cash to shareholders through common stock repurchases and dividends.
FISCAL 2011
The key metrics of fiscal 2011 were:
• Earnings per diluted share rose 25.5% to $2.92.
• Net sales increased 15.3% to $4.16 billion. The 53rd week in fiscal 2010 contributed approximately $70 million of additional net sales.
• Direct-to-consumer sales rose 14.8% to $3.62 billion.
• Comparable sales in Coach's North American stores increased 10.6%, primarily due to improved conversion.
• In North America, Coach opened three net new retail stores and 22 new factory stores, bringing the total number of retail and factory stores to
345 and 143, respectively, at the end of fiscal 2011. We also expanded six factory stores in North America.
• Coach Japan opened eight net new locations, bringing the total number of locations at the end of fiscal 2011 to 169. In addition, we expanded
three locations.
• Coach China results continued to be strong with double-digit growth in comparable stores and channel profitability. At the end of fiscal 2011, we
had a total of 66 locations.
• Coach's Board increased the Company's cash dividend to an expected annual rate of $0.90 per share starting with the dividend paid on July 5,
2011.
• As a result of the March 2011 earthquake and tsunami in Japan, the Company estimates that sales in Japan were impacted by approximately $20
million and earnings per share by about two and a half cents during the third quarter and by approximately $26 million and about three and a half
cents during the fourth quarter. Due to the events in Japan, as of the end of the fiscal year, two stores remained temporarily closed; these two
stores reopened during July 2011.
22

TABLE OF CONTENTS
FISCAL 2011 COMPARED TO FISCAL 2010
The following table summarizes results of operations for fiscal 2011 compared to fiscal 2010:
Fiscal Year Ended
July 2, 2011 July 3, 2010 Variance (dollars in millions, except per share data) Amount % of
net sales
Amount % of
net sales
Amount %
Net sales $ 4,158.5 100.0% $ 3,607.6 100.0% $ 550.9 15.3% Gross profit 3,023.5 72.7 2,633.7 73.0 389.9 14.8 Selling, general and administrative expenses 1,718.6 41.3 1,483.5 41.1 235.1 15.8 Operating income 1,304.9 31.4 1,150.2 31.9 154.8 13.5 Interest income, net 1.0 0.0 8.0 0.2 (6.9) (87.0) Provision for income taxes 420.4 10.1 423.2 11.7 (2.8) (0.7) Net income 880.8 21.2 734.9 20.4 145.9 19.8 Net Income per share:
Basic $ 2.99 $ 2.36 $ 0.63 26.6% Diluted 2.92 2.33 0.59 25.5
Net Sales
The following table presents net sales by operating segment for fiscal 2011 compared to fiscal 2010:
Fiscal Year Ended
Net Sales Percentage of
Total Net Sales July 2, 2011 July 3, 2010 Rate of
Change
July 2, 2011 July 3,
2010 (dollars in millions) (FY11 vs. FY10) Direct-to-Consumer $ 3,621.9 $ 3,155.8 14.8% 87.1% 87.5% Indirect 536.6 451.8 18.8 12.9 12.5 Total net sales $ 4,158.5 $ 3,607.6 15.3 100.0% 100.0%
23

TABLE OF CONTENTS
Direct-to-Consumer — Net sales increased 14.8% to $3.62 billion during fiscal 2011 from $3.16 billion during fiscal 2010, driven by sales increases
in our Company-operated stores in North America and China. Net sales of fiscal 2010 included an additional week of sales, which represented
approximately $62 million.
Comparable store sales measure sales performance at stores that have been open for at least 12 months, and includes sales from coach.com. Coach
excludes new locations from the comparable store base for the first year of operation. Similarly, stores that are expanded by 15.0% or more are also
excluded from the comparable store base until the first anniversary of their reopening. Stores that are closed for renovations are removed from the
comparable store base.
In North America, net sales increased 14.4% driven by sales from new and expanded stores and by a 10.6% increase in comparable store sales. During
fiscal 2011, Coach opened three net new retail stores and 22 new factory stores, and expanded six factory stores in North America. In Japan, net sales
increased 5.1% driven by an approximately $69.8 million, or 9.8%, positive impact from foreign currency exchange. During fiscal 2011, Coach opened
eight net new locations and expanded three locations in Japan. Coach China results continued to be strong with double-digit percentage growth in
comparable store sales. During fiscal 2011, Coach opened 25 net new stores in Hong Kong and mainland China.
Indirect — Net sales increased 18.8% to $536.6 million from $451.8 million in fiscal 2010. The increase was driven primarily by an 18.4% increase
in Coach International Wholesale and U.S. Wholesale net revenue. The net sales increase was partially offset by an additional week of sales in fiscal 2010,
which represented approximately $8 million. Licensing revenue of approximately $24.7 million and $19.2 million in fiscal 2011 and fiscal 2010,
respectively, is included in Indirect sales.
Operating Income
Operating income increased 13.5% to $1.30 billion in fiscal 2011 as compared to $1.15 billion in fiscal 2010. Excluding items affecting comparability
of $25.7 million in fiscal 2011, operating income increased 15.7% to $1.33 billion. Operating margin decreased to 31.4% as compared to 31.9% in the
prior year, as gross margin decreased while selling, general, and administrative ("SG&A") expenses slightly increased as a percentage of sales. Excluding
items affecting comparability, operating margin was 32.0% in fiscal 2011.
Gross profit increased 14.8% to $3.02 billion in fiscal 2011 from $2.63 billion in fiscal 2010. Gross margin was 72.7% in fiscal 2011 as compared to
73.0% during fiscal 2010. Coach's gross profit is dependent upon a variety of factors, including changes in the relative sales mix among distribution
channels, changes in the mix of products sold, foreign currency exchange rates and fluctuations in material costs. These factors, among, others may cause
gross profit to fluctuate from year to year.
SG&A expenses are comprised of four categories: (1) selling; (2) advertising, marketing and design; (3) distribution and consumer service; and (4)
administrative. Selling expenses include store employee compensation, store occupancy costs, store supply costs, wholesale account administration
compensation and all Coach Japan and Coach China operating expenses. These expenses are affected by the number of Coach-operated stores in North
America, Japan, Hong Kong, Macau and mainland China open during any fiscal period and the related proportion of retail and wholesale sales.
Advertising, marketing and design expenses include employee compensation, media space and production, advertising agency fees, new product design
costs, public relations, market research expenses and mail order costs. Distribution and consumer service expenses include warehousing, order fulfillment,
shipping and handling, customer service and bag repair costs. Administrative expenses include compensation costs for the executive, finance, human
resources, legal and information systems departments, corporate headquarters occupancy costs, consulting and software expenses. SG&A expenses
increase as the number of Coach-operated stores increase, although an increase in the number of stores generally results in the fixed portion of SG&A
expenses being spread over a larger sales base.
During fiscal 2011, SG&A expenses increased 15.8% to $1.72 billion, compared to $1.48 billion during fiscal 2010. Excluding items affecting
comparability of $25.7 million in fiscal 2011, SG&A expenses were $1.69 billion. As a percentage of net sales, SG&A expenses were 41.3% and 41.1%
during fiscal 2011 and fiscal 2010, respectively. Excluding items affecting comparability during fiscal 2011, SG&A expenses as a percentage of net sales
were 40.7% as we leveraged our selling expense base on higher sales.
24

TABLE OF CONTENTS
Selling expenses were $1.18 billion, or 28.5% of net sales compared to $1.05 billion, or 29.1% of net sales, during fiscal 2010. The dollar increase in
selling expenses was due to higher operating expenses in Coach China and North American stores due to higher sales and new store openings.
Additionally, selling expenses of Reed Krakoff stores contributed to the dollar increase since the brand was not launched until the beginning of fiscal
2011. Coach China and North American store expenses as a percentage of sales decreased primarily due to operating efficiencies and sales leverage. The
decrease in Coach Japan operating expenses in constant currency of $10.2 million was offset by the impact of foreign currency exchange rates which
increased reported expenses by approximately $33.5 million.
Advertising, marketing, and design costs were $224.4 million, or 5.4% of net sales, compared to $179.4 million, or 5.0% of net sales, during fiscal
2010. The increase was primarily due to new design expenditures and development costs for new merchandising initiatives. Also contributing to the
increase were marketing expenses related to consumer communications, which includes our digital strategy through coach.com, our global e-commerce
sites, marketing sites and social networking. The Company utilizes and continues to explore implementing new technologies such as our global web
presence, with informational websites in 17 countries, social networking and blogs as cost-effective consumer communication opportunities to increase
on-line and store sales and build brand awareness.
Distribution and consumer service expenses were $58.2 million, or 1.4% of net sales, compared to $48.0 million, or 1.3% of net sales, during fiscal
2010. To support our growth in China and the region, during the second half of fiscal 2010 we established an Asia distribution center in Shanghai, owned
and operated by a third-party, allowing us to better manage the logistics in this region. During fiscal 2011, the Asia distribution center contributed to the
increase in distribution and consumer service expenses; however in the long run, the Company expects the Asia distribution center to reduce costs as a
percentage of net sales.
Administrative expenses were $252.4 million, or 6.1% of net sales, compared to $204.0 million, or 5.7% of net sales, during fiscal 2010. Excluding
items affecting comparability of $25.7 million in fiscal 2011, expenses were $226.7 million, representing 5.5% of net sales. The increase in administrative
expenses was primarily due to higher share-based and performance-based compensation.
Interest Income, Net
Net interest income was $1.0 million in fiscal 2011 compared to $8.0 million in fiscal 2010. The decrease is attributable to lower returns on our
investments due to lower investment balances during the year.
Provision for Income Taxes
The effective tax rate was 32.3% in fiscal 2011 compared to 36.5% in fiscal 2010. Excluding the benefit from the items affecting comparability, the
effective tax rate was 33.6% in fiscal 2011. The decrease in the effective tax rate is primarily attributable to a favorable settlement of a multi-year tax
return examination and higher profitability in lower tax rate jurisdictions in which income is earned, due to the increased globalization of the Company,
and a lower effective state tax rate.
Net Income
Net income was $880.8 million in fiscal 2011 compared to $734.9 million in fiscal 2010. The increase was due to the higher operating income and a
reduction of the effective tax rate.
25
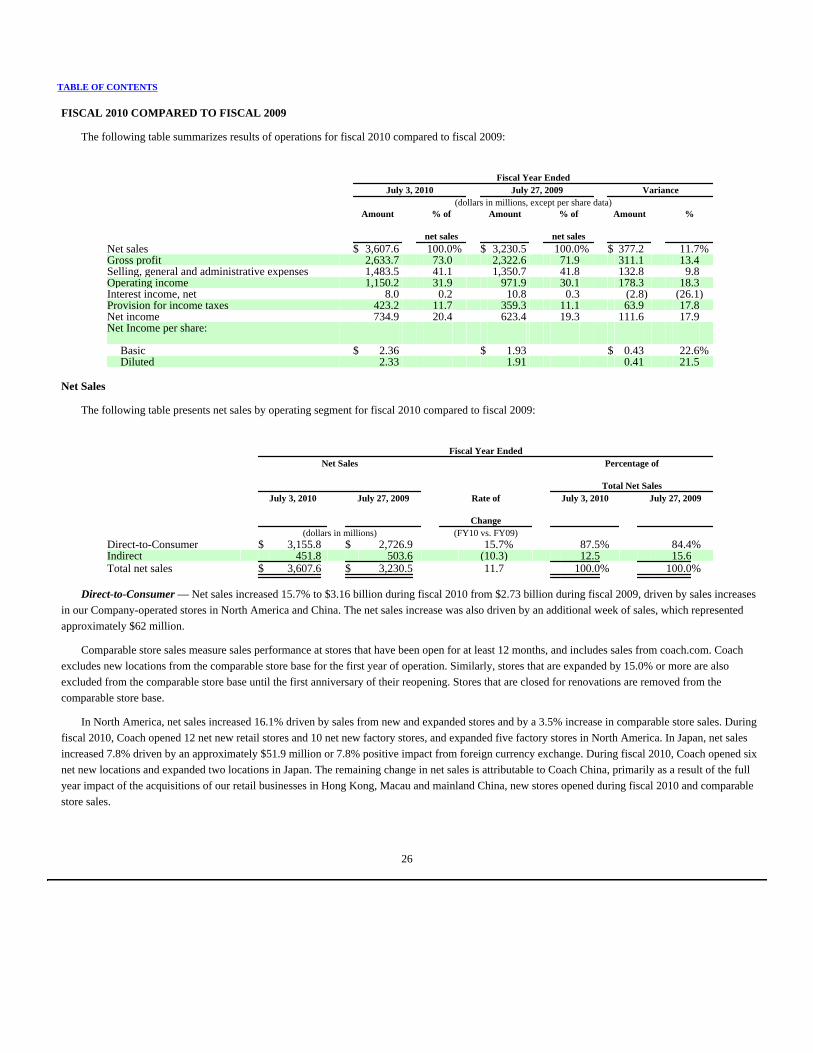
TABLE OF CONTENTS
FISCAL 2010 COMPARED TO FISCAL 2009
The following table summarizes results of operations for fiscal 2010 compared to fiscal 2009:
Fiscal Year Ended
July 3, 2010 July 27, 2009 Variance (dollars in millions, except per share data) Amount % of
net sales
Amount % of
net sales
Amount %
Net sales $ 3,607.6 100.0% $ 3,230.5 100.0% $ 377.2 11.7% Gross profit 2,633.7 73.0 2,322.6 71.9 311.1 13.4 Selling, general and administrative expenses 1,483.5 41.1 1,350.7 41.8 132.8 9.8 Operating income 1,150.2 31.9 971.9 30.1 178.3 18.3 Interest income, net 8.0 0.2 10.8 0.3 (2.8) (26.1) Provision for income taxes 423.2 11.7 359.3 11.1 63.9 17.8 Net income 734.9 20.4 623.4 19.3 111.6 17.9 Net Income per share:
Basic $ 2.36 $ 1.93 $ 0.43 22.6% Diluted 2.33 1.91 0.41 21.5
Net Sales
The following table presents net sales by operating segment for fiscal 2010 compared to fiscal 2009:
Fiscal Year Ended
Net Sales Percentage of
Total Net Sales July 3, 2010 July 27, 2009 Rate of
Change
July 3, 2010 July 27, 2009
(dollars in millions) (FY10 vs. FY09) Direct-to-Consumer $ 3,155.8 $ 2,726.9 15.7% 87.5% 84.4% Indirect 451.8 503.6 (10.3) 12.5 15.6 Total net sales $ 3,607.6 $ 3,230.5 11.7 100.0% 100.0%
Direct-to-Consumer — Net sales increased 15.7% to $3.16 billion during fiscal 2010 from $2.73 billion during fiscal 2009, driven by sales increases
in our Company-operated stores in North America and China. The net sales increase was also driven by an additional week of sales, which represented
approximately $62 million.
Comparable store sales measure sales performance at stores that have been open for at least 12 months, and includes sales from coach.com. Coach
excludes new locations from the comparable store base for the first year of operation. Similarly, stores that are expanded by 15.0% or more are also
excluded from the comparable store base until the first anniversary of their reopening. Stores that are closed for renovations are removed from the
comparable store base.
In North America, net sales increased 16.1% driven by sales from new and expanded stores and by a 3.5% increase in comparable store sales. During
fiscal 2010, Coach opened 12 net new retail stores and 10 net new factory stores, and expanded five factory stores in North America. In Japan, net sales
increased 7.8% driven by an approximately $51.9 million or 7.8% positive impact from foreign currency exchange. During fiscal 2010, Coach opened six
net new locations and expanded two locations in Japan. The remaining change in net sales is attributable to Coach China, primarily as a result of the full
year impact of the acquisitions of our retail businesses in Hong Kong, Macau and mainland China, new stores opened during fiscal 2010 and comparable
store sales.
26

TABLE OF CONTENTS
Indirect — Net sales decreased 10.3% driven primarily by a 18.2% decrease in U.S. wholesale as the Company continued to control shipments into
U.S. department stores in order to manage customer inventory levels due to a weak sales environment. The net sales decrease was partially offset by an
additional week of sales, which represented approximately $8 million. We continue to experience better performance with international locations catering
to indigenous consumers, where the brand is gaining recognition, whereas the Company's travel business has experienced weakness, as it is heavily
dependent on the Japanese traveler. Licensing revenue of approximately $19.2 million and $19.5 million in fiscal 2010 and fiscal 2009, respectively, is
included in Indirect sales.
Operating Income
Operating income increased 18.3% to $1.15 billion in fiscal 2010 as compared to $971.9 million in fiscal 2009. Excluding items affecting
comparability of $28.4 million in fiscal 2009, operating income increased 15.0% from $1.00 billion. Operating margin increased to 31.9% as compared to
30.1% in the prior year, as gross margin increased while SG&A expenses declined as a percentage of sales. Excluding items affecting comparability,
operating margin was 31.0% in fiscal 2009.
Gross profit increased 13.4% to $2.63 billion in fiscal 2010 from $2.32 billion in fiscal 2009. Gross margin was 73.0% in fiscal 2010 as compared to
71.9% during fiscal 2009. The change in gross margin was driven primarily by lower manufacturing costs and product mix. Coach's gross profit is
dependent upon a variety of factors, including changes in the relative sales mix among distribution channels, changes in the mix of products sold, foreign
currency exchange rates and fluctuations in material costs. These factors among others may cause gross profit to fluctuate from year to year.
SG&A expenses are comprised of four categories: (1) selling; (2) advertising, marketing and design; (3) distribution and consumer service; and (4)
administrative. Selling expenses include store employee compensation, store occupancy costs, store supply costs, wholesale account administration
compensation and all Coach Japan and Coach China operating expenses. These expenses are affected by the number of Coach-operated stores in North
America, Japan, Hong Kong, Macau and mainland China open during any fiscal period and the related proportion of retail and wholesale sales.
Advertising, marketing and design expenses include employee compensation, media space and production, advertising agency fees, new product design
costs, public relations, market research expenses and mail order costs. Distribution and consumer service expenses include warehousing, order fulfillment,
shipping and handling, customer service and bag repair costs. Administrative expenses include compensation costs for the executive, finance, human
resources, legal and information systems departments, corporate headquarters occupancy costs, and consulting and software expenses. SG&A expenses
increase as the number of Coach-operated stores increase, although an increase in the number of stores generally results in the fixed portion of SG&A
expenses being spread over a larger sales base.
During fiscal 2010, SG&A expenses increased 9.8% to $1.48 billion, compared to $1.35 billion in fiscal 2009. Excluding items affecting
comparability of $28.4 million in fiscal 2009, SG&A expenses were $1.32 billion. As a percentage of net sales, SG&A expenses were 41.1% and 41.8%
during fiscal 2010 and fiscal 2009, respectively. Excluding items affecting comparability during fiscal 2009, selling general and administrative expenses as
a percentage of net sales were 40.9%. Overall SG&A expenses increased primarily from higher administrative expenses driven by performance-based
compensation and a prior year reversal of a straight-line rent accrual, resulting from the purchase of our corporate headquarters building that did not recur
in fiscal 2010.
Selling expenses were $1.05 billion, or 29.1% of net sales, in fiscal 2010 compared to $981.5 million, or 30.4% of net sales, in fiscal 2009. Excluding
items affecting comparability during fiscal 2009 of $5.0 million related to the planned closure of four underperforming stores during the stores lease terms,
selling expenses were $976.5 million, representing 30.2% of net sales. The dollar increase in selling expenses was primarily due to an increase in
operating expenses of North American stores and Coach China. The increase in North American store expenses was primarily attributable to expenses
from new and expanded stores opened during fiscal 2010 and the incremental expense associated with having a full year of expenses related to stores
opened in the prior year. Coach China and North American store expenses as a percentage of sales decreased primarily attributable to operating
efficiencies achieved since the end of the fiscal 2009. The increase in
27

TABLE OF CONTENTS
Coach Japan operating expenses was driven primarily by the impact of foreign currency exchange rates which increased reported expenses by
approximately $22.0 million.
Advertising, marketing, and design costs were $179.4 million, or 5.0% of net sales, in fiscal 2010, compared to $163.6 million, or 5.1% of net sales,
during fiscal 2009. The increase was primarily due to new design expenditures for the Reed Krakoff brand, with expected introductions in fiscal year
2011, partly offset by controlled sample making expenses.
Distribution and consumer service expenses were $48.0 million, or 1.3% of net sales, in fiscal 2010, compared to $52.2 million, or 1.6%, in fiscal
2009. The decrease in expenses was primarily the result of fiscal 2009 cost savings initiatives and process improvements.
Administrative expenses were $204.0 million, or 5.7% of net sales, in fiscal 2010 compared to $153.4 million, or 4.7% of net sales, during fiscal
2009. Excluding items affecting comparability of $23.4 in fiscal 2009, expenses were $130.0 million, representing 4.0% of net sales. The increase in
administrative expenses was primarily due to higher performance-based and share-based compensation. Also during fiscal 2009, the Company reversed
straight-line rent accruals resulting from the purchase of our corporate headquarters building during the lease period.
Interest Income, Net
Net interest income was $8.0 million in fiscal 2010 compared to $10.8 million in fiscal 2009. The decrease is attributable to lower returns on our
investments due to lower interest rates.
Provision for Income Taxes
The effective tax rate was 36.5% in fiscal 2010 compared to 36.6% in fiscal 2009. In the fourth quarter of fiscal 2009, the Company recorded a benefit
of $18.8 million primarily related to favorable settlements of tax return examinations and certain other tax accounting adjustments. Excluding these
benefits, the effective tax rate was 38.5% in fiscal 2009.
Net Income
Net income was $734.9 million in fiscal 2010 compared to $623.4 million in fiscal 2009. Excluding items affecting comparability of $1.2 million in
fiscal 2009, net income was $622.1 million in fiscal 2009. The increase was primarily due to operating income improvement partially offset by a higher
provision for income taxes.
28
TABLE OF CONTENTS
FISCAL 2011, FISCAL 2009 AND FISCAL 2008 ITEMS AFFECTING COMPARABILITY OF OUR FINANCIAL RESULTS
Non-GAAP Measures
The Company's reported results are presented in accordance with U.S. Generally Accepted Accounting Principles ("GAAP"). The reported SG&A
expenses, operating income, and provision for income taxes in fiscal 2011 reflect certain items which affect the comparability of our results. Similarly, the
reported SG&A expenses, operating income, provision for income taxes, income from continuing operations, net income and earnings per diluted share
from continuing operations in both fiscal 2009 and fiscal 2008 reflect certain items which affect the comparability of our results. These metrics are also
reported on a non-GAAP basis for these fiscal years to exclude the impact of these items.
These non-GAAP performance measures were used by management to conduct and evaluate its business during its regular review of operating results
for the periods affected. Management and the Company's Board utilized these non-GAAP measures to make decisions about the uses of Company
resources, analyze performance between periods, develop internal projections and measure management performance. The Company's primary internal
financial reporting excluded these items affecting comparability. In addition, the compensation committee of the Company's Board used these non-GAAP
measures when setting and assessing achievement of incentive compensation goals.
We believe these non-GAAP measures are useful to investors in evaluating the Company's ongoing operating and financial results and understanding
how such results compare with the Company's historical performance. In addition, we believe excluding the items affecting comparability assists investors
in developing expectations of future performance. These items affecting comparability do not represent the Company's direct, ongoing business
operations. By providing the non-GAAP measures, as a supplement to GAAP information, we believe we are enhancing investors' understanding of our
business and our results of operations. The non-GAAP financial measures are limited in their usefulness and should be considered in addition to, and not
in lieu of, U.S. GAAP financial measures. Further, these non-GAAP measures may be unique to the Company, as they may be different from non-GAAP
measures used by other companies.
29

TABLE OF CONTENTS
The year-over-year comparisons of our financial results are affected by the following items included in our reported results:
Fiscal Year Ended
(dollars in millions, except per share data) July 2,
2011
June 27,
2009
June 28,
2008Operating income
Cost savings measures $ — $ (13.4) $ — Charitable foundation contribution (25.7) (15.0) (20.0) Variable expense — — (12.1)
Total Operating income impact $ (25.7) $ (28.4) $ (32.1) Provision for income taxes
Cost savings measures $ — $ (5.1) $ — Charitable foundation contribution (10.2) (5.7) (7.8) Tax adjustments (15.5) (18.8) (60.6) Variable expense — — (4.7)
Total Provision for income taxes impact $ (25.7) $ (29.6) $ (73.1) Net income
Cost savings measures $ — $ (8.3) $ — Charitable foundation contribution (15.5) (9.3) (12.2) Tax adjustments 15.5 18.8 60.6 Variable expense — — (7.4)
Total Net income impact $ 0.0 $ 1.2 $ 41.0 Diluted earnings per share
Cost savings measures $ — $ (0.03) $ — Charitable foundation contribution (0.05) (0.03) (0.03) Tax adjustments 0.05 0.06 0.17 Variable expense — — (0.02)
Total Diluted earnings per share impact $ 0.00 $ 0.00 $ 0.11
Fiscal 2011 Items
Charitable Contributions and Tax Adjustments
During the third quarter of fiscal 2011, the Company decreased the provision for income taxes by $15.5 million, primarily as a result of a favorable
settlement of a multi-year tax return examination. The Company used the net income favorability to contribute $20.9 million to the Coach Foundation and
400 million yen or $4.8 million to the Japanese Red Cross Society. The Company believed that in order to reflect the direct results of the normal, ongoing
business operations, both the tax adjustments and the resulting Coach Foundation funding and Japanese Red Cross Society contribution needed to be
adjusted. This exclusion is consistent with the way management views its results and is the basis on which incentive compensation will be calculated for
fiscal 2011.
Fiscal 2009 Items
Cost Savings Measures
During the third quarter of fiscal 2009, the Company recorded a charge of $13.4 million, related to cost savings initiatives. These initiatives included
the elimination of approximately 150 positions from the Company's corporate offices in New York, New Jersey and Jacksonville, the closure of four
underperforming retail stores and the closure of Coach Europe Services, the Company's sample-making facility in Italy. Prior to these cost savings
measures in fiscal 2009, the Company had no recent past history of similar elimination of positions, closure of facilities, or closure of underperforming
stores during the stores' lease terms.
30
TABLE OF CONTENTS
Charitable Contribution and Tax Adjustments
During the fourth quarter of fiscal 2009, the Company decreased the provision for income taxes by $18.8 million, primarily as a result of a favorable
settlement of a multi-year tax return examination and other tax accounting adjustments. The underlying events and circumstances for the tax settlement
and adjustments were not related to the fiscal 2008 settlement. The Company used the net income favorability to contribute $15.0 million to the Coach
Foundation. The Company believed that in order to reflect the direct results of the normal, ongoing business operations, both the tax adjustments and the
resulting foundation funding needed to be adjusted. This exclusion is consistent with the way management views its results and is the basis on which
incentive compensation was calculated and paid for fiscal 2009.
Fiscal 2008 Items
Charitable Contribution and Tax Adjustments
During the fourth quarter of fiscal 2008, the Company decreased the provision for income taxes by $60.6 million, primarily as a result of a favorable
settlement of a tax return examination. The underlying events and circumstances for the tax settlement were not related to the fiscal 2009 settlement. The
Company used the net income favorability to create the Coach Foundation. The Company recorded an initial contribution to the Coach Foundation in the
amount of $20.0 million. The Company believed that in order to reflect the direct results of the business operations as was done for executive management
incentive compensation, both the tax adjustments and the resulting foundation funding needed to be adjusted.
Variable Expenses
As a result of the lower income tax provision, the Company incurred additional incentive compensation expense of $12.1 million, as a portion of the
Company's incentive compensation plan is based on net income and earnings per share. Incremental incentive compensation driven by tax settlements of
this magnitude is unlikely to recur in the near future as the Company has modified its incentive compensation plans during fiscal 2009 to be measured
exclusive of any unusual accounting adjustments. The Company believes excluding these variable expenses, which were directly linked to the tax
settlements, assists investors in evaluating the Company's direct, ongoing business operations.
Currency Fluctuation Effects
Percentage increases and decreases in sales in fiscal 2011 and fiscal 2010 for Coach Japan have been presented both including and excluding currency
fluctuation effects from translating foreign-denominated sales into U.S. dollars and comparing these figures to the same period in the prior fiscal year.
We believe that presenting Coach Japan sales increases and decreases, including and excluding currency fluctuation effects, will help investors and
analysts to understand the effect on this valuable performance measure of significant year-over-year currency fluctuations.
31

TABLE OF CONTENTS
FINANCIAL CONDITION
Cash Flow
Net cash provided by operating activities was $1.03 billion in fiscal 2011 compared to $990.9 million in fiscal 2010. The increase of $42.4 million
was primarily due to the $145.9 million increase in net income as well as changes in deferred income taxes year-over-year, partially offset by working
capital changes between the two periods, the most significant of which occurred in other assets and trade accounts receivable. Deferred income taxes were
a source of cash of $39.7 million in fiscal 2011 compared to a use of cash of $17.1 million in fiscal 2010, due to the timing of deferred tax items. Other
assets were a use of cash of $42.2 million in fiscal 2011 compared to a cash source of $35.6 million in fiscal 2010, primarily due to the timing of certain
cash receipts. Trade accounts receivable were a use of cash of $31.8 million in fiscal 2011, compared to a cash source of $4.3 million in fiscal 2010, due to
the timing of shipments to, and payments from, customers.
Net cash used in investing activities was $59.6 million in fiscal 2011 compared to $182.2 million in fiscal 2010. Purchases of investments and
proceeds from their maturities and sales resulted in a net cash inflow in fiscal 2011 of $97.7 million, compared to a net cash outflow of $99.9 million in
fiscal 2010. Additionally, purchases of property and equipment were $66.6 million higher in the current fiscal year, driven by the timing of certain projects
and the Company's international expansion.
Net cash used in financing activities was $875.1 million in fiscal 2011 as compared to $1.02 billion in fiscal 2010. The decrease of $144.8 million was
primarily attributable to $138.6 million of higher cash proceeds from share-based compensation awards during the current fiscal year. The Company spent
approximately $1.10 billion on repurchases of common stock in both fiscal 2011and fiscal 2010.
Revolving Credit Facilities
On July 26, 2007, the Company renewed its $100 million revolving credit facility with certain lenders and Bank of America, N.A. as the primary
lender and administrative agent (the "Bank of America facility"), extending the facility expiration to July 26, 2012. At Coach's request and lenders'
consent, the Bank of America facility can be expanded to $200 million. The facility can also be extended for two additional one-year periods, at Coach's
request and the lenders' consent.
Coach's Bank of America facility is available for seasonal working capital requirements or general corporate purposes and may be prepaid without
penalty or premium. During fiscal 2011 and fiscal 2010 there were no borrowings under the Bank of America facility. Accordingly, as of July 2, 2011 and
July 3, 2010, there were no outstanding borrowings under the Bank of America facility. The Company's borrowing capacity as of July 2, 2011 was $90.0
million, due to outstanding letters of credit.
Coach pays a commitment fee of 6 to 12.5 basis points on any unused amounts and interest of LIBOR plus 20 to 55 basis points on any outstanding
borrowings. Both the commitment fee and the LIBOR margin are based on the Company's fixed charge coverage ratio. At July 2, 2011, the commitment
fee was 7 basis points and the LIBOR margin was 30 basis points.
The Bank of America facility contains various covenants and customary events of default. Coach has been in compliance with all covenants since its
inception.
To provide funding for working capital and general corporate purposes, Coach Japan has available credit facilities with several Japanese financial
institutions. These facilities allow a maximum borrowing of 4.1 billion yen, or approximately $50.7 million, at July 2, 2011. Interest is based on the Tokyo
Interbank rate plus a margin of 30 basis points. During fiscal 2011, the peak borrowings under the Japanese credit facilities were $27.1 million. There were
no borrowings in fiscal 2010. As of July 2, 2011 and July 3, 2010, there were no outstanding borrowings under the Japanese credit facilities.
To provide funding for working capital and general corporate purposes, Coach Shanghai Limited has a credit facility that allows a maximum
borrowing of 63 million Chinese renminbi, or approximately $10 million at July 2, 2011. Interest is based on the People's Bank of China rate. During
fiscal 2011 and fiscal 2010, the peak borrowings under this credit facility were $0 and $7.5 million. At July 2, 2011 and July 3, 2010, there were no
outstanding borrowings under this facility.
32

TABLE OF CONTENTS
Common Stock Repurchase Program
During fiscal 2011, the Company completed its $1.0 billion common stock repurchase program, which was put into place in April 2010. In January
2011, the Board approved a new common stock repurchase program to acquire up to $1.5 billion of Coach's outstanding common stock through June 2013.
Purchases of Coach common stock are made subject to market conditions and at prevailing market prices, through open market purchases. Repurchased
shares become authorized but unissued shares and may be issued in the future for general corporate and other uses. The Company may terminate or limit
the stock repurchase program at any time.
During fiscal 2011 and fiscal 2010, the Company repurchased and retired 20.4 million and 30.7 million shares, respectively, or $1.10 billion and $1.15
billion of common stock, respectively, at an average cost of $53.81 and $37.48, respectively. As of July 2, 2011, $961.6 million remained available for
future purchases under the existing program.
Liquidity and Capital Resources
In fiscal 2011, total capital expenditures were $147.7 million related primarily to new stores and corporate infrastructure in North America, China, and
Japan which accounted for approximately $42.5 million, $34.7, and $8.8 million, respectively, of total capital expenditures. Approximately $7.9 million
related to investments in stores for Reed Krakoff which launched during fiscal 2011. Spending on department store renovations and distributor locations
accounted for approximately $10.9 million of the total capital expenditures. The remaining capital expenditures related to corporate systems and
infrastructure. These investments were financed from on hand cash and operating cash flows.
For the fiscal year ending June 30, 2012, the Company expects total capital expenditures to be approximately $200 million. Capital expenditures will
be primarily for new stores in North America; Hong Kong, Macau and mainland China; Japan; and Singapore and technology to support our global
expansion. We will also continue to invest in corporate infrastructure and department store and distributor locations. These investments will be financed
primarily from on hand cash and operating cash flows.
Coach experiences significant seasonal variations in its working capital requirements. During the first fiscal quarter Coach builds inventory for the
holiday selling season, opens new retail stores and generates higher levels of trade receivables. In the second fiscal quarter its working capital
requirements are reduced substantially as Coach generates consumer sales and collects wholesale accounts receivable. In fiscal 2011, Coach purchased
approximately $1.2 billion of inventory, which was primarily funded by on hand cash and operating cash flows.
Management believes that cash flow from operations and on hand cash will provide adequate funds for the foreseeable working capital needs, planned
capital expenditures, dividend payments and the common stock repurchase program. Any future acquisitions, joint ventures or other similar transactions
may require additional capital. There can be no assurance that any such capital will be available to Coach on acceptable terms or at all. Coach's ability to
fund its working capital needs, planned capital expenditures, dividend payments and scheduled debt payments, as well as to comply with all of the
financial covenants under its debt agreements, depends on its future operating performance and cash flow, which in turn are subject to prevailing economic
conditions and to financial, business and other factors, some of which are beyond Coach's control.
Commitments
At July 2, 2011, the Company had credit available of $275.0 million, of which $171.9 million of letters of credit were outstanding. These letters of
credit, which expire at various dates through 2014, primarily collateralize the Company's obligation to third parties for the purchase of inventory.
33

TABLE OF CONTENTS
Contractual Obligations
As of July 2, 2011, Coach's long-term contractual obligations are as follows:
Payments Due by Period
Less than
1 Year
1 – 3 Years 3 – 5 Years More than
5 Years Total Fiscal
2012
Fiscal 2013 – 2014 Fiscal 2015 – 2016 Fiscal 2017
and beyond (amounts in millions)
Capital expenditure commitments(1) $ 1.1 $ 1.1 $ — $ — $ — Inventory purchase obligations(2) 195.4 195.4 — — — Long-term debt, including the current portion(3) 24.2 0.8 22.9 0.5 — Operating leases 1,019.3 152.9 288.4 227.3 350.7 Total $ 1,240.0 $ 350.2 $ 311.3 $ 227.8 $ 350.7
(1) Represents the Company's legally binding agreements related to capital expenditures.
(2) Represents the Company's legally binding agreements to purchase finished goods.
(3) Amounts presented include interest payment obligations.
The table above excludes the following: amounts included in current liabilities, other than the current portion of long-term debt, in the Consolidated
Balance Sheet at July 2, 2011 as these items will be paid within one year; long-term liabilities not requiring cash payments, such as deferred lease
incentives; and cash contributions for the Company's pension plans. The Company intends to contribute approximately $0.4 million to its pension plans
during the next year. The above table also excludes reserves recorded in accordance with the Financial Accounting Standards Board's ("FASB") guidance
for accounting for uncertainty in income taxes which has been codified within Accounting Standards Codification ("ASC") 740, as we are unable to
reasonably estimate the timing of future cash flows related to these reserves.
Coach does not have any off-balance-sheet financing or unconsolidated special purpose entities. Coach's risk management policies prohibit the use of
derivatives for trading or speculative purposes. The valuation of financial instruments that are marked-to-market are based upon independent third-party
sources.
Long-Term Debt
Coach is party to an Industrial Revenue Bond related to its Jacksonville, Florida distribution and consumer service facility. This loan has a remaining
balance of $1.9 million and bears interest at 4.5%. Principal and interest payments are made semiannually, with the final payment due in 2014.
During fiscal 2009, Coach assumed a mortgage in connection with the purchase of its corporate headquarters building in New York City. This
mortgage bears interest at 4.68%. Interest payments are made monthly and principal payments began in July 2009, with the final payment of $21.6 million
due in June 2013. As of July 2, 2011, the remaining balance on the mortgage was $22.3 million.
CRITICAL ACCOUNTING POLICIES AND ESTIMATES
The preparation of financial statements in conformity with accounting principles generally accepted in the United States of America requires
management to make estimates and assumptions. Predicting future events is inherently an imprecise activity and, as such, requires the use of judgment.
Actual results may vary from estimates in amounts that may be material to the financial statements. The development and selection of the Company's
critical accounting policies and estimates are periodically reviewed with the Audit Committee of the Board.
The accounting policies discussed below are considered critical because changes to certain judgments and assumptions inherent in these policies could
affect the financial statements. For more information on Coach's accounting policies, please refer to the Notes to Consolidated Financial Statements.
34

TABLE OF CONTENTS
Income Taxes
The Company's effective tax rate is based on pre-tax income, statutory tax rates, tax laws and regulations, and tax planning strategies available in the
various jurisdictions in which Coach operates. Deferred tax assets are reported at net realizable value, as determined by management. Significant
management judgment is required in determining the effective tax rate, in evaluating our tax positions and in determining the net realizable value of
deferred tax assets. In accordance with ASC 740-10, the Company recognizes the impact of tax positions in the financial statements if those positions will
more likely than not be sustained on audit, based on the technical merits of the position. Tax authorities periodically audit the Company's income tax
returns. Management believes that our tax filing positions are reasonable and legally supportable. However, in specific cases, various tax authorities may
take a contrary position. A change in our tax positions or audit settlements could have a significant impact on our results of operations. For further
information about income taxes, see the Income Taxes note presented in the Notes to the Consolidated Financial Statements.
Inventories
The Company's inventories are reported at the lower of cost or market. Inventory costs include material, conversion costs, freight and duties and are
determined by the first-in, first-out method. The Company reserves for slow-moving and aged inventory based on historical experience, current product
demand and expected future demand. A decrease in product demand due to changing customer tastes, buying patterns or increased competition could
impact Coach's evaluation of its slow-moving and aged inventory and additional reserves might be required. At July 2, 2011, a 10% change in the reserve
for slow-moving and aged inventory would have resulted in an insignificant change in inventory and cost of goods sold.
Goodwill and Other Intangible Assets
The Company evaluates goodwill and other indefinite life intangible assets annually for impairment. In order to complete our impairment analysis, we
must perform a valuation analysis which includes determining the fair value of the Company's reporting units based on discounted cash flows. This
analysis contains uncertainties as it requires management to make assumptions and estimate the profitability of future growth strategies. The Company
determined that there was no impairment in fiscal 2011, fiscal 2010 or fiscal 2009.
Long-Lived Assets
Long-lived assets, such as property and equipment, are evaluated for impairment annually and whenever events or circumstances indicate that the
carrying value of the assets may not be recoverable. The evaluation is based on a review of forecasted operating cash flows and the profitability of the
related business. An impairment loss is recognized if the forecasted cash flows are less than the carrying amount of the asset. The Company recorded an
impairment loss in fiscal 2009 of $1.5 million related to the closure of three underperforming stores. The Company did not record any impairment losses
in fiscal 2011 or fiscal 2010. However, as the determination of future cash flows is based on expected future performance, impairment could result in the
future if expectations are not met.
Revenue Recognition
Sales are recognized at the point of sale, which occurs when merchandise is sold in an over-the-counter consumer transaction or, for the wholesale
channels, upon shipment of merchandise, when title passes to the customer. Revenue associated with gift cards is recognized upon redemption. The
Company estimates the amount of gift cards that will not be redeemed and records such amounts as revenue over the period of the performance obligation.
Allowances for estimated uncollectible accounts, discounts and returns are provided when sales are recorded based upon historical experience and current
trends. Royalty revenues are earned through license agreements with manufacturers of other consumer products that incorporate the Coach brand. Revenue
earned under these contracts is recognized based upon reported sales from the licensee. At July 2, 2011, a 10% change in the allowances for estimated
uncollectible accounts, discounts and returns would have resulted in an insignificant change in accounts receivable and net sales.
35

TABLE OF CONTENTS
Share-Based Compensation
The Company recognizes the cost of employee services received in exchange for awards of equity instruments, such as stock options, based on the
grant-date fair value of those awards. The grant-date fair value of stock option awards is determined using the Black-Scholes option pricing model and
involves several assumptions, including the expected term of the option, expected volatility and dividend yield. The expected term of options represents
the period of time that the options granted are expected to be outstanding and is based on historical experience. Expected volatility is based on historical
volatility of the Company's stock as well as the implied volatility from publicly traded options on Coach's stock. Dividend yield is based on the current
expected annual dividend per share and the Company's stock price. Changes in the assumptions used to determine the Black-Scholes value could result in
significant changes in the Black-Scholes value. However, a 10% change in the Black-Scholes value would result in an insignificant change in fiscal 2011
share-based compensation expense.
Recent Accounting Pronouncements
Accounting Standards Codification 820-10 "Fair Value Measurements and Disclosures," ("ASC 820-10") was amended in January 2010 to require
additional disclosures related to recurring and nonrecurring fair value measurements. The guidance requires disclosure of transfers of assets and liabilities
between Levels 1 and 2 of the fair value hierarchy, including the reasons and the timing of the transfers, and information on purchases, sales, issuances,
and settlements on a gross basis in the reconciliation of the assets and liabilities measured under Level 3 of the fair value hierarchy. The guidance was
effective for the Company beginning on December 27, 2009, except for certain disclosures about purchases, sales, issuances, and settlements related to
Level 3 fair value measurements, which were effective for the Company beginning on January 2, 2011. The disclosure guidance adopted on December 27,
2009 and January 2, 2011 did not have a material impact on our consolidated financial statements.
In May 2011, ASC 820-10 was further amended to clarify certain disclosure requirements and improve consistency with international reporting
standards. This amendment is to be applied prospectively and is effective for the Company beginning January 1, 2012. The Company does not expect its
adoption to have a material effect on its consolidated financial statements.
Accounting Standards Codification Topic 220, "Comprehensive Income," was amended in June 2011 to require entities to present the total of
comprehensive income, the components of net income, and the components of other comprehensive income either in a single continuous statement of
comprehensive income or in two separate but consecutive statements. The amendment does not change the items that must be reported in other
comprehensive income or when an item of other comprehensive income must be reclassified to net income under current GAAP. This guidance is
effective for the Company's fiscal year and interim periods beginning July 1, 2012. The Company is currently evaluating this guidance, but does not expect
its adoption to have a material effect on its consolidated financial statements.
ITEM 7A. QUANTITATIVE AND QUALITATIVE DISCLOSURES ABOUT MARKET RISK
The market risk inherent in our financial instruments represents the potential loss in fair value, earnings or cash flows arising from adverse changes in
interest rates or foreign currency exchange rates. Coach manages these exposures through operating and financing activities and, when appropriate,
through the use of derivative financial instruments with respect to Coach Japan and Coach Canada. The use of derivative financial instruments is in
accordance with Coach's risk management policies. Coach does not enter into derivative transactions for speculative or trading purposes.
The following quantitative disclosures are based on quoted market prices obtained through independent pricing sources for the same or similar types
of financial instruments, taking into consideration the underlying terms and maturities and theoretical pricing models. These quantitative disclosures do
not represent the maximum possible loss or any expected loss that may occur, since actual results may differ from those estimates.
36

TABLE OF CONTENTS
Foreign Currency Exchange
Foreign currency exposures arise from transactions, including firm commitments and anticipated contracts, denominated in a currency other than the
entity's functional currency, and from foreign-denominated revenues and expenses translated into U.S. dollars.
Substantially all of Coach's fiscal 2011 non-licensed product needs were purchased from independent manufacturers in countries other than the United
States. These countries include China, United States, Italy, Hong Kong, India, Thailand, Vietnam, Macau, Philippines, Turkey, Colombia, Malaysia,
Mexico, Peru, South Africa and Taiwan. Additionally, sales are made through international channels to third party distributors. Substantially all purchases
and sales involving international parties, excluding consumer sales at Coach Japan, Coach Canada and Coach China, are denominated in U.S. dollars and,
therefore, are not subject to foreign currency exchange risk.
In Japan and Canada, Coach is exposed to market risk from foreign currency exchange rate fluctuations resulting from Coach Japan and Coach
Canada's U.S. dollar denominated inventory purchases. Coach Japan and Coach Canada enter into certain foreign currency derivative contracts, primarily
zero-cost collar options, to manage these risks. As of July 2, 2011 and July 3, 2010, open foreign currency forward contracts designated as hedges with a
notional amount of $171.0 million and $248.6 million, respectively, were outstanding.
Coach is also exposed to market risk from foreign currency exchange rate fluctuations with respect to Coach Japan as a result of its $109.1 million
U.S. dollar-denominated fixed rate intercompany loan from Coach. To manage this risk, on June 30, 2011, Coach Japan entered into a cross currency swap
transaction, the terms of which include an exchange of a yen fixed interest rate for a U.S. dollar fixed interest rate. The loan matures on December 29,
2011, at which point the swap requires an exchange of Japanese yen and U.S. dollar based notional values.
The fair value of open foreign currency derivatives included in current assets at July 2, 2011 and July 3, 2010 was $2.0 million and $2.1 million,
respectively. The fair value of open foreign currency derivatives included in current liabilities at July 2, 2011 and July 3, 2010 was $1.7 million and $7.5
million, respectively. The fair value of these contracts is sensitive to changes in Japanese yen and Canadian dollar exchange rates.
Coach believes that exposure to adverse changes in exchange rates associated with revenues and expenses of foreign operations, which are
denominated in Japanese yen, Chinese renminbi, Hong Kong dollar, Macau pataca and Canadian dollars, are not material to the Company's consolidated
financial statements.
Interest Rate
Coach is exposed to interest rate risk in relation to its investments, revolving credit facilities and long-term debt.
The Company's investment portfolio is maintained in accordance with the Company's investment policy, which identifies allowable investments,
specifies credit quality standards and limits the credit exposure of any single issuer. The primary objective of our investment activities is the preservation
of principal while maximizing interest income and minimizing risk. We do not hold any investments for trading purposes. The Company's investment
portfolio consists of U.S. government and agency securities as well as corporate debt securities. As the Company does not have the intent to sell and will
not be required to sell these securities until maturity, investments are classified as held-to-maturity and stated at amortized cost, except for auction rate
securities, which are classified as available-for-sale. At July 2, 2011 and July 3, 2010, the Company's investments, classified as held-to-maturity, consisted
of commercial paper and treasury bills valued at $2.3 million and $99.9 million, on those dates respectively. As the adjusted book value of the commercial
paper and treasury bills equals its fair value, there were no unrealized gains or losses associated with these investments. At July 2, 2011, the Company's
investments, classified as available-for-sale, consisted of a $6.0 million auction rate security. At July 2, 2011, as the auction rate securities' adjusted book
value equaled its fair value, there were no unrealized gains or losses associated with this investment.
37

TABLE OF CONTENTS
As of July 2, 2011, the Company had no outstanding borrowings on its Bank of America facility, its revolving credit facility maintained by Coach
Japan, and its revolving credit facility maintained by Coach Shanghai Limited. The fair value of any future borrowing may be impacted by fluctuations in
interest rates.
As of July 2, 2011, Coach's outstanding long-term debt, including the current portion, was $24.2 million. A hypothetical 10% change in the interest
rate applied to the fair value of debt would not have a material impact on earnings or cash flows of Coach.
ITEM 8. FINANCIAL STATEMENTS AND SUPPLEMENTARY DATA
See "Index to Financial Statements," which is located on page 41 of this report.
ITEM 9. CHANGES IN AND DISAGREEMENTS WITH ACCOUNTANTS ON ACCOUNTING AND FINANCIAL DISCLOSURE
None.
ITEM 9A. CONTROLS AND PROCEDURES
Disclosure Controls and Procedures
Based on the evaluation of the Company's disclosure controls and procedures, as that term is defined in Rule 13a-15(e) under the Securities Exchange
Act of 1934, as amended, each of Lew Frankfort, the Chief Executive Officer of the Company, and Michael F. Devine, III, the Chief Financial Officer of
the Company, has concluded that the Company's disclosure controls and procedures are effective as of July 2, 2011.
Management's Report on Internal Control over Financial Reporting
The Company's management is responsible for establishing and maintaining adequate internal controls over financial reporting. The Company's
internal control system was designed to provide reasonable assurance to the Company's management and Board regarding the preparation and fair
presentation of published financial statements. Management evaluated the effectiveness of the Company's internal control over financial reporting using
the criteria set forth by the Committee of Sponsoring Organizations (COSO) of the Treadway Commission in Internal Control — Integrated Framework.
Management, under the supervision and with the participation of the Company's Chief Executive Officer and Chief Financial Officer, assessed the
effectiveness of the Company's internal control over financial reporting as of July 2, 2011 and concluded that it is effective.
The Company's independent auditors have issued an audit report on the Company's internal control over financial reporting. The audit report appears
on page 43 of this report.
Changes in Internal Control over Financial Reporting
There were no changes in internal control over financial reporting that occurred during the fourth fiscal quarter that have materially affected, or are
reasonably likely to materially affect, the Company's internal control over financial reporting.
ITEM 9B. OTHER INFORMATION
None.
38

TABLE OF CONTENTS
PART III
ITEM 10. DIRECTORS, EXECUTIVE OFFICERS AND CORPORATE GOVERNANCE
The information set forth in the Proxy Statement for the 2011 Annual Meeting of Stockholders is incorporated herein by reference. The Proxy
Statement will be filed with the Commission within 120 days after the end of the fiscal year covered by this Form 10-K pursuant to Regulation 14A under
the Securities Exchange Act of 1934, as amended.
ITEM 11. EXECUTIVE COMPENSATION
The information set forth in the Proxy Statement for the 2011 Annual Meeting of Stockholders is incorporated herein by reference. The Proxy
Statement will be filed with the Commission within 120 days after the end of the fiscal year covered by this Form 10-K pursuant to Regulation 14A under
the Securities Exchange Act of 1934, as amended.
ITEM 12. SECURITY OWNERSHIP OF CERTAIN BENEFICIAL OWNERS AND MANAGEMENT AND RELATED STOCKHOLDERMATTERS
(a) Security ownership of management set forth in the Proxy Statement for the 2011 Annual Meeting of Stockholders is incorporated herein by
reference.
(b) There are no arrangements known to the registrant that may at a subsequent date result in a change in control of the registrant.
The Proxy Statement will be filed with the Commission within 120 days after the end of the fiscal year covered by this Form 10-K pursuant to
Regulation 14A under the Securities Exchange Act of 1934, as amended.
ITEM 13. CERTAIN RELATIONSHIPS AND RELATED TRANSACTIONS, AND DIRECTOR INDEPENDENCE
The information set forth in the Proxy Statement for the 2011 Annual Meeting of Stockholders is incorporated herein by reference. The Proxy
Statement will be filed with the Commission within 120 days after the end of the fiscal year covered by this Form 10-K pursuant to Regulation 14A under
the Securities Exchange Act of 1934, as amended.
ITEM 14. PRINCIPAL ACCOUNTANT FEES AND SERVICES
The information required by this item is incorporated herein by reference to the section entitled "Matters Relating to Coach's Independent Auditors" in
the Proxy Statement for the 2011 Annual Meeting of Stockholders. The Proxy Statement will be filed with the Commission within 120 days after the end
of the fiscal year covered by this Form 10-K pursuant to Regulation 14A under the Securities Exchange Act of 1934, as amended.
PART IV
ITEM 15. EXHIBITS, FINANCIAL STATEMENT SCHEDULES
(a) Financial Statements and Financial Statement Schedules
See "Index to Financial Statements" which is located on page 41 of this report.
(b) Exhibits. See the exhibit index which is included herein.
39
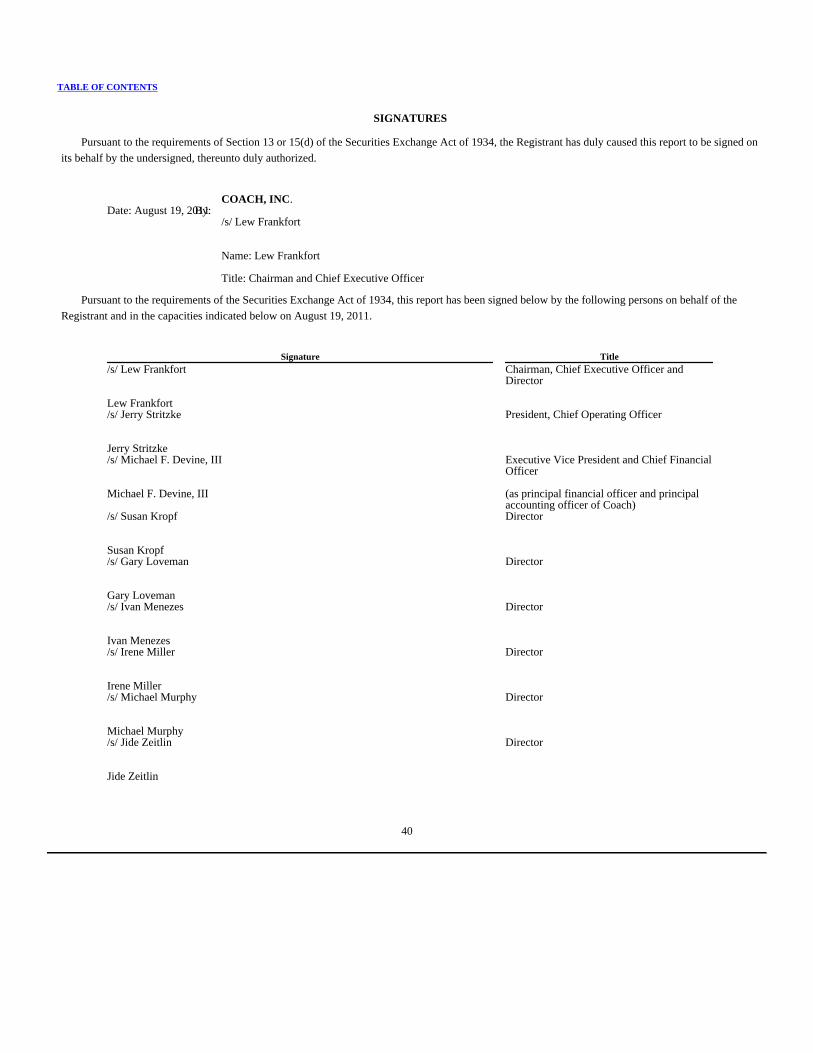
TABLE OF CONTENTS
SIGNATURES
Pursuant to the requirements of Section 13 or 15(d) of the Securities Exchange Act of 1934, the Registrant has duly caused this report to be signed on
its behalf by the undersigned, thereunto duly authorized.
COACH, INC.
Date: August 19, 2011 By:/s/ Lew Frankfort
Name: Lew Frankfort Title: Chairman and Chief Executive Officer
Pursuant to the requirements of the Securities Exchange Act of 1934, this report has been signed below by the following persons on behalf of the
Registrant and in the capacities indicated below on August 19, 2011.
Signature Title
/s/ Lew Frankfort
Lew Frankfort
Chairman, Chief Executive Officer andDirector
/s/ Jerry Stritzke
Jerry Stritzke
President, Chief Operating Officer
/s/ Michael F. Devine, III
Michael F. Devine, III
Executive Vice President and Chief FinancialOfficer (as principal financial officer and principalaccounting officer of Coach)
/s/ Susan Kropf
Susan Kropf
Director
/s/ Gary Loveman
Gary Loveman
Director
/s/ Ivan Menezes
Ivan Menezes
Director
/s/ Irene Miller
Irene Miller
Director
/s/ Michael Murphy
Michael Murphy
Director
/s/ Jide Zeitlin
Jide Zeitlin
Director
40

TABLE OF CONTENTS
UNITED STATES
SECURITES AND EXCHANGE COMMISSION
Washington, D.C. 20549
FORM 10-K
FINANCIAL STATEMENTS
For the Fiscal Year Ended July 2, 2011
COACH, INC.
New York, New York 10001
INDEX TO FINANCIAL STATEMENTS
Page
Number
Reports of Independent Registered Public Accounting Firm 42 Consolidated Balance Sheets — At July 2, 2011 and July 3, 2010 44 Consolidated Statements of Income — For Fiscal Years Ended July 2, 2011, July 3, 2010 and June 27, 2009 45 Consolidated Statements of Stockholders' Equity — For Fiscal Years Ended July 2, 2011, July 3, 2010 and June 27,
2009 46
Consolidated Statements of Cash Flows — For Fiscal Years Ended July 2, 2011, July 3, 2010 and June 27, 2009 47 Notes to Consolidated Financial Statements 48 Financial Statement Schedules for the years ended July 2, 2011, July 3, 2010 and June 27, 2009:
Schedule II — Valuation and Qualifying Accounts 70
All other schedules are omitted because they are not applicable or the required information is shown in the consolidated financial statements or notes
thereto.
41

TABLE OF CONTENTS
REPORT OF INDEPENDENT REGISTERED PUBLIC ACCOUNTING FIRM
To the Board of Directors and Stockholders of
Coach, Inc.
New York, New York
We have audited the accompanying consolidated balance sheets of Coach, Inc. and subsidiaries (the "Company") as of July 2, 2011 and July 3, 2010,
and the related consolidated statements of income, stockholders' equity, and cash flows for each of the three years in the period ended July 2, 2011. Our
audits also included the financial statement schedule listed in the Index at Item 15. These financial statements and financial statement schedule are the
responsibility of the Company's management. Our responsibility is to express an opinion on these financial statements and financial statement schedule
based on our audits.
We conducted our audits in accordance with the standards of the Public Company Accounting Oversight Board (United States). Those standards
require that we plan and perform the audit to obtain reasonable assurance about whether the financial statements are free of material misstatement. An
audit includes examining, on a test basis, evidence supporting the amounts and disclosures in the financial statements. An audit also includes assessing the
accounting principles used and significant estimates made by management, as well as evaluating the overall financial statement presentation. We believe
that our audits provide a reasonable basis for our opinion.
In our opinion, such consolidated financial statements present fairly, in all material respects, the consolidated financial position of the Company at
July 2, 2011 and July 3, 2010, and the results of their operations and their cash flows for each of the three years in the period ended July 2, 2011, in
conformity with accounting principles generally accepted in the United States of America. Also, in our opinion, such financial statement schedule, when
considered in relation to the basic consolidated financial statements taken as a whole, presents fairly, in all material respects, the information set forth
therein.
As discussed in Note 16 to the consolidated financial statements, effective July 4, 2010, the Company changed its method of accounting for
presentation of interest and penalties for uncertain tax positions from classifying such amounts as a component of interest expense included within Interest
income, net to classifying such amounts as a component of the provision for income taxes.
We have also audited, in accordance with the standards of the Public Company Accounting Oversight Board (United States), the Company's internal
control over financial reporting as of July 2, 2011, based on the criteria established in Internal Control — Integrated Framework issued by the Committee
of Sponsoring Organizations of the Treadway Commission and our report dated August 19, 2011 expressed an unqualified opinion on the Company's
internal control over financial reporting.
/s/ Deloitte & Touche LLP
New York, New York
August 19, 2011
42
TABLE OF CONTENTS
REPORT OF INDEPENDENT REGISTERED PUBLIC ACCOUNTING FIRM
To the Board of Directors and Stockholders of
Coach, Inc.
New York, New York
We have audited the internal control over financial reporting of Coach, Inc. and subsidiaries (the "Company") as of July 2, 2011 based on criteria
established in Internal Control — Integrated Framework issued by the Committee of Sponsoring Organizations of the Treadway Commission. The
Company's management is responsible for maintaining effective internal control over financial reporting and for its assessment of the effectiveness of
internal control over financial reporting, included in the accompanying Management's Report on Internal Control over Financial Reporting. Our
responsibility is to express an opinion on the Company's internal control over financial reporting based on our audit.
We conducted our audit in accordance with the standards of the Public Company Accounting Oversight Board (United States). Those standards
require that we plan and perform the audit to obtain reasonable assurance about whether effective internal control over financial reporting was maintained
in all material respects. Our audit included obtaining an understanding of internal control over financial reporting, assessing the risk that a material
weakness exists, testing and evaluating the design and operating effectiveness of internal control based on the assessed risk, and performing such other
procedures as we considered necessary in the circumstances. We believe that our audit provides a reasonable basis for our opinion.
A company's internal control over financial reporting is a process designed by, or under the supervision of, the company's principal executive and
principal financial officers, or persons performing similar functions, and effected by the company's board of directors, management, and other personnel to
provide reasonable assurance regarding the reliability of financial reporting and the preparation of financial statements for external purposes in accordance
with generally accepted accounting principles. A company's internal control over financial reporting includes those policies and procedures that (1) pertain
to the maintenance of records that, in reasonable detail, accurately and fairly reflect the transactions and dispositions of the assets of the company; (2)
provide reasonable assurance that transactions are recorded as necessary to permit preparation of financial statements in accordance with generally
accepted accounting principles, and that receipts and expenditures of the company are being made only in accordance with authorizations of management
and directors of the company; and (3) provide reasonable assurance regarding prevention or timely detection of unauthorized acquisition, use, or
disposition of the company's assets that could have a material effect on the financial statements.
Because of the inherent limitations of internal control over financial reporting, including the possibility of collusion or improper management override
of controls, material misstatements due to error or fraud may not be prevented or detected on a timely basis. Also, projections of any evaluation of the
effectiveness of the internal control over financial reporting to future periods are subject to the risk that the controls may become inadequate because of
changes in conditions, or that the degree of compliance with the policies or procedures may deteriorate.
In our opinion, the Company maintained, in all material respects, effective internal control over financial reporting as of July 2, 2011, based on the
criteria established in Internal Control — Integrated Framework issued by the Committee of Sponsoring Organizations of the Treadway Commission.
We have also audited, in accordance with the standards of the Public Company Accounting Oversight Board (United States), the consolidated
financial statements and financial statement schedule as of and for the year ended July 2, 2011 of the Company and our report dated August 19, 2011
expressed an unqualified opinion on those consolidated financial statements and consolidated financial statement schedule and includes an explanatory
paragraph regarding the Company's change in method of accounting for presentation of interest and penalties for uncertain tax positions from classifying
such amounts as a component of interest expense included within Interest income, net to classifying such amounts as a component of the provision for
income taxes.
/s/ Deloitte & Touche LLP
New York, New York
August 19, 2011
43

TABLE OF CONTENTS
COACH, INC.
CONSOLIDATED BALANCE SHEETS
(amounts in thousands, except share data)
July 2,
2011
July 3,
2010ASSETS
Current Assets:
Cash and cash equivalents $ 699,782 $ 596,470 Short-term investments 2,256 99,928 Trade accounts receivable, less allowances of $9,544 and $6,965, respectively 142,898 109,068 Inventories 421,831 363,285 Deferred income taxes 93,902 77,355 Prepaid expenses 38,203 30,375 Other current assets 53,516 26,160
Total current assets 1,452,388 1,302,641 Property and equipment, net 582,348 548,474 Goodwill 331,004 305,861 Intangible assets 9,788 9,788 Deferred income taxes 103,657 156,465 Other assets 155,931 143,886
Total assets $2,635,116 $2,467,115 LIABILITIES AND STOCKHOLDERS' EQUITY
Current Liabilities:
Accounts payable $ 118,612 $ 105,569 Accrued liabilities 473,610 422,725 Current portion of long-term debt 795 742
Total current liabilities 593,017 529,036 Long-term debt 23,360 24,159 Other liabilities 406,170 408,627
Total liabilities 1,022,547 961,822 See note on commitments and contingencies
Stockholders' Equity:
Preferred stock: (authorized 25,000,000 shares; $0.01 par value) none issued — — Common stock: (authorized 1,000,000,000 shares; $0.01 par value) issued and outstanding –
288,514,529 and 296,867,247, respectively 2,886 2,969
Additional paid-in-capital 2,000,426 1,502,982 Accumulated deficit (445,654) (30,053) Accumulated other comprehensive income 54,911 29,395
Total stockholders' equity 1,612,569 1,505,293 Total liabilities and stockholders' equity $2,635,116 $2,467,115
See accompanying Notes to Consolidated Financial Statements.
44

TABLE OF CONTENTS
COACH, INC.
CONSOLIDATED STATEMENTS OF INCOME
(amounts in thousands, except per share data)
Fiscal Year Ended
July 2,
2011
July 3,
2010
June 27,
2009Net sales $ 4,158,507 $ 3,607,636 $ 3,230,468 Cost of sales 1,134,966 973,945 907,858
Gross profit 3,023,541 2,633,691 2,322,610 Selling, general and administrative expenses 1,718,617 1,483,520 1,350,697
Operating income 1,304,924 1,150,171 971,913 Interest income, net 1,031 7,961 10,779 Other expense (4,736) — —
Income before provision for income taxes 1,301,219 1,158,132 982,692 Provision for income taxes 420,419 423,192 359,323
Net income $ 880,800 $ 734,940 $ 623,369 Net income per share
Basic $ 2.99 $ 2.36 $ 1.93 Diluted $ 2.92 $ 2.33 $ 1.91
Shares used in computing net income per share
Basic 294,877 311,413 323,714 Diluted 301,558 315,848 325,620
See accompanying Notes to Consolidated Financial Statements.
45

TABLE OF CONTENTS
COACH, INC.
CONSOLIDATED STATEMENTS OF STOCKHOLDERS' EQUITY
(amounts in thousands)
Shares of
Common
Stock
Preferred
Stock
Common
Stock
Additional
Paid-in-
Capital
Retained
Earnings/
(Accumulated
Deficit)
Accumulated
Other
Comprehensive
Income
Total
Stockholders'
Equity
Balances at June 28, 2008 336,729 $ — $3,367 $1,115,041 $ 353,122 $ 18,845 $ 1,490,375 Net income — — — — 623,369 — 623,369 Unrealized losses on cash flow hedging derivatives,
net of tax — — — — — (7,278) (7,278)
Translation adjustments — — — — — (5,298) (5,298) Change in pension liability, net of tax — — — — — (1,368) (1,368) Comprehensive income 609,425 Cumulative effect of adoption of ASC 320-10-35-17
(see note on Fair Value Measurements) — — — — 1,072 (1,072) —
Shares issued for stock options and employeebenefit plans
1,436 — 15 7,348 — — 7,363
Share-based compensation — — — 67,542 — — 67,542 Tax deficit from share-based compensation — — — (871) — — (871) Repurchase and retirement of common stock (20,159) — (202) — (453,584) — (453,786) Adjustment to adopt ASC 715 measurement date
provision, net of tax — — — — (183) 22 (161)
Dividends declared — — — — (23,845) — (23,845) Balances at June 27, 2009 318,006 — 3,180 1,189,060 499,951 3,851 1,696,042
Net income — — — — 734,940 — 734,940 Unrealized losses on cash flow hedging derivatives,
net of tax — — — — — (1,757) (1,757)
Translation adjustments — — — — — 27,464 27,464 Change in pension liability, net of tax — — — — — (163) (163) Comprehensive income 760,484 Shares issued for stock options and employee
benefit plans 9,547 — 96 204,886 — — 204,982
Share-based compensation — — — 81,420 — — 81,420 Excess tax benefit from share-based compensation — — — 27,616 — — 27,616 Repurchase and retirement of common stock (30,686) — (307) — (1,149,691) — (1,149,998) Dividends declared — — — — (115,253) — (115,253)
Balances at July 3, 2010 296,867 — 2,969 1,502,982 (30,053) 29,395 1,505,293 Net income — — — — 880,800 — 880,800 Unrealized gains on cash flow hedging derivatives,
net of tax — — — — — 627 627
Translation adjustments — — — — — 24,351 24,351 Change in pension liability, net of tax — — — — — 538 538 Comprehensive income 906,316 Shares issued for stock options and employee
benefit plans 12,052 — 121 343,450 — — 343,571
Share-based compensation — — — 95,830 — — 95,830 Excess tax benefit from share-based compensation — — — 58,164 — — 58,164 Repurchase and retirement of common stock (20,404) — (204) — (1,097,796) — (1,098,000) Dividends declared — — — — (198,605) — (198,605)
Balances at July 2, 2011 288,515 $ — $2,886 $2,000,426 $ (445,654) $ 54,911 $ 1,612,569
See accompanying Notes to Consolidated Financial Statements.

46

TABLE OF CONTENTS
COACH, INC.
CONSOLIDATED STATEMENTS OF CASH FLOWS
(amounts in thousands)
Fiscal Year Ended
July 2,
2011
July 3,
2010
June 27,
2009CASH FLOWS FROM OPERATING ACTIVITIES
Net income $ 880,800 $ 734,940 $ 623,369 Adjustments to reconcile net income to net cash from operating activities:
Depreciation and amortization 125,106 126,744 123,014 Provision for bad debt 2,014 (698) 909 Share-based compensation 95,830 81,420 67,542 Excess tax (benefit) deficit from share-based compensation (58,164) (27,616) 871 Deferred income taxes 39,724 (17,129) 13,660 Other noncash credits and (charges), net 9,790 (10,449) 10,151 Changes in operating assets and liabilities:
(Increase) decrease in trade accounts receivable (31,831) 4,344 3,309 (Increase) decrease in inventories (64,720) (33,878) 4,070 (Increase) decrease in other assets (42,174) 35,640 31,155 Increase in other liabilities 13,421 28,477 211 Increase (decrease) in accounts payable 9,742 1,019 (37,017) Increase (decrease) in accrued liabilities 53,733 68,063 (32,092)
Net cash provided by operating activities 1,033,271 990,877 809,152 CASH FLOWS FROM INVESTING ACTIVITIES
Acquisition of interest in equity method investment (9,559) — — Acquisition of distributor — (1,200) (24,400) Purchases of property and equipment (147,744) (81,116) (137,029) Purchase of corporate headquarters building — — (103,300) Purchases of investments (224,007) (229,860) — Proceeds from sales and maturities of investments 321,679 129,932 — Net cash used in investing activities (59,631) (182,244) (264,729)
CASH FLOWS FROM FINANCING ACTIVITIES
Dividend payments (178,115) (94,324) — Repurchase of common stock (1,098,000) (1,149,998) (453,786) Repayment of long-term debt (746) (679) (285) (Repayments) borrowings on revolving credit facility, net — (7,496) 7,496 Proceeds from share-based awards, net 343,571 204,982 7,363 Excess tax benefit (deficit) from share-based compensation 58,164 27,616 (871) Net cash used in financing activities (875,126) (1,019,899) (440,083)
Effect of exchange rate changes on cash and cash equivalents 4,798 7,374 (2,883) Increase (decrease) increase in cash and cash equivalents 103,312 (203,892) 101,457 Cash and cash equivalents at beginning of year 596,470 800,362 698,905 Cash and cash equivalents at end of year $ 699,782 $ 596,470 $ 800,362 Supplemental information:
Cash paid for income taxes $ 364,493 $ 364,156 $ 336,091 Cash paid for interest $ 1,233 $ 1,499 $ 2,014 Noncash investing activity – property and equipment obligations $ 23,173 $ 16,526 $ 20,520 Noncash financing activity – mortgage debt assumed $ — $ — $ 23,000
See accompanying Notes to Consolidated Financial Statements.

47

TABLE OF CONTENTS
COACH, INC.
Notes to Consolidated Financial Statements
(dollars and shares in thousands, except per share data)
1. NATURE OF OPERATIONS
Coach, Inc. (the "Company") designs and markets high-quality, modern American classic accessories. The Company's primary product offerings,
manufactured by third-party suppliers, include women's and men's bags, accessories, business cases, footwear, wearables, jewelry, sunwear, travel bags,
watches and fragrance. Coach's products are sold through the Direct-to-Consumer segment, which includes Company-operated stores in North America,
Japan, Hong Kong, Macau and mainland China, the Internet and the Coach catalog, and through the Indirect segment, which includes sales to wholesale
customers and distributors in over 20 countries, including the United States, and royalties earned on licensed products.
2. SIGNIFICANT ACCOUNTING POLICIES
Fiscal Year
The Company's fiscal year ends on the Saturday closest to June 30. Unless otherwise stated, references to years in the financial statements relate to
fiscal years. The fiscal years ended July 2, 2011 ("fiscal 2011") and June 27, 2009 ("fiscal 2009") were each 52-week periods. The fiscal year ended July
3, 2010 ("fiscal 2010") was a 53-week period. The fiscal year ending June 30, 2012 ("fiscal 2012") will be a 52-week period.
Use of Estimates
The preparation of financial statements in conformity with accounting principles generally accepted in the United States of America requires
management to make estimates and assumptions that affect the reported amounts of assets and liabilities and disclosure of contingent assets and liabilities
at the date of the financial statements as well as the reported amounts of revenues and expenses during the reporting period. The level of uncertainty in
estimates and assumptions increases with the length of time until the underlying transactions are completed. Actual results could differ from estimates in
amounts that may be material to the financial statements.
Principles of Consolidation
The consolidated financial statements include the accounts of the Company and all 100% owned subsidiaries. All significant intercompany
transactions and balances are eliminated in consolidation.
Cash and Cash Equivalents
Cash and cash equivalents consist of cash balances and highly liquid investments with a maturity of three months or less at the date of purchase.
Investments
Investments consist of U.S. government and agency debt securities as well as municipal government and corporate debt securities. Long-term
investments are classified as available-for-sale and recorded at fair value, with unrealized gains and losses recorded in other comprehensive income.
Dividend and interest income are recognized when earned.
Short-term investments consist of commercial paper; the adjusted book value of the commercial paper equals its fair value. As the Company does not
have the intent to sell and will not be required to sell these securities until maturity, investments are classified as held-to-maturity and stated at amortized
cost.
In fiscal 2011, the Company participated in the organization of a joint venture. The Company has contributed a total of $9,559 in cash to the joint
venture through July 2, 2011. This investment, which consists of a 50% equity interest, is accounted for using the equity method of accounting.
Concentration of Credit Risk
Financial instruments that potentially expose Coach to concentration of credit risk consist primarily of cash and cash equivalents, investments and
accounts receivable. The Company places its cash investments
48


TABLE OF CONTENTS
COACH, INC.
Notes to Consolidated Financial Statements
(dollars and shares in thousands, except per share data)
2. SIGNIFICANT ACCOUNTING POLICIES – (continued)
with high-credit quality financial institutions and currently invests primarily in U.S. government and agency debt securities, municipal government and
corporate debt securities, and money market funds placed with major banks and financial institutions. Accounts receivable is generally diversified due to
the number of entities comprising Coach's customer base and their dispersion across many geographical regions. The Company believes no significant
concentration of credit risk exists with respect to these cash investments and accounts receivable.
Inventories
Inventories consist primarily of finished goods and are valued at the lower of cost (determined by the first-in, first-out method) or market. Inventory
costs include material, conversion costs, freight and duties.
Property and Equipment
Property and equipment are stated at cost less accumulated depreciation. Depreciation is calculated on a straight-line basis over the estimated useful
lives of the assets. Buildings are depreciated over 40 years. Machinery and equipment are depreciated over lives of five to seven years and furniture and
fixtures are depreciated over lives of three to five years. Leasehold improvements are amortized over the shorter of their estimated useful lives or the
related lease terms. Maintenance and repair costs are charged to earnings as incurred while expenditures for major renewals and improvements are
capitalized. Upon the disposition of property and equipment, the cost and related accumulated depreciation are removed from the accounts.
Operating Leases
The Company's leases for office space, retail stores and the distribution facility are accounted for as operating leases. The majority of the Company's
lease agreements provide for tenant improvement allowances, rent escalation clauses and/or contingent rent provisions. Tenant improvement allowances
are recorded as a deferred lease credit on the balance sheet and amortized over the lease term, which is consistent with the amortization period for the
constructed assets. Rent expense is recorded when the Company takes possession of a store to begin its build out, which generally occurs before the stated
commencement of the lease term and is approximately 60 to 90 days prior to the opening of the store.
Goodwill and Other Intangible Assets
Goodwill and indefinite life intangible assets are evaluated for impairment annually or more frequently if events or changes in circumstances indicate
that the asset might be impaired. The Company performed an impairment evaluation in fiscal 2011, fiscal 2010 and fiscal 2009 and concluded that there
was no impairment of its goodwill or indefinite life intangible assets.
Valuation of Long-Lived Assets
Long-lived assets, such as property and equipment, are evaluated for impairment annually and whenever events or circumstances indicate that the
carrying value of the assets may not be recoverable. The evaluation is based on a review of forecasted operating cash flows and the profitability of the
related business. An impairment loss is recognized if the forecasted cash flows are less than the carrying amount of the asset. The Company performed an
impairment evaluation in fiscal 2011, fiscal 2010 and fiscal 2009 and concluded that there was no impairment of its long-lived assets for stores expected to
remain open. The Company recorded an impairment charge of $1,500 in fiscal 2009 related to the closure of three underperforming stores.
Stock Repurchase and Retirement
Coach accounts for stock repurchases and retirements by allocating the repurchase price to common stock, additional paid-in-capital and retained
earnings. The repurchase price allocation is based upon the equity contribution associated with historical issuances, beginning with the earliest issuance.
Under Maryland
49

TABLE OF CONTENTS
COACH, INC.
Notes to Consolidated Financial Statements
(dollars and shares in thousands, except per share data)
2. SIGNIFICANT ACCOUNTING POLICIES – (continued)
law, Coach's state of incorporation, treasury shares are not allowed. As a result, all repurchased shares are retired when acquired. During the second
quarter of fiscal 2008, the Company's total cumulative stock repurchases exceeded the total shares issued in connection with the Company's October 2000
initial public offering, and stock repurchases in excess of this amount are assumed to be made from the Company's April 2001 Sara Lee exchange offer.
Shares issued in connection with this exchange offer were accounted for as a contribution to common stock and retained earnings. Therefore, stock
repurchases and retirements associated with the exchange offer are accounted for by allocation of the repurchase price to common stock and retained
earnings. During the fourth quarter of fiscal 2010, cumulative stock repurchases allocated to retained earnings have resulted in an accumulated deficit
balance. Since its initial public offering, the Company has not experienced a net loss in any fiscal year, and the net accumulated deficit balance in
stockholders' equity is attributable to the cumulative stock repurchase activity. The total cumulative amount of common stock repurchase price allocated to
retained earnings as of July 2, 2011 was approximately $5,100,000.
Revenue Recognition
Sales are recognized at the point of sale, which occurs when merchandise is sold in an over-the-counter consumer transaction or, for the wholesale
channels, upon shipment of merchandise, when title passes to the customer. Revenue associated with gift cards is recognized upon redemption. The
Company estimates the amount of gift cards that will not be redeemed and records such amounts as revenue over the period of the performance obligation.
Allowances for estimated uncollectible accounts, discounts and returns are provided when sales are recorded. Royalty revenues are earned through license
agreements with manufacturers of other consumer products that incorporate the Coach brand. Revenue earned under these contracts is recognized based
upon reported sales from the licensee. Taxes collected from customers and remitted to governmental authorities are recorded on a net basis and therefore
are excluded from revenue.
Cost of Sales
Cost of sales consists of cost of merchandise, inbound freight and duty expenses, and other inventory-related costs such as shrinkage, damages,
replacements and production overhead.
Selling, General and Administrative Expenses
Selling, general and administrative expenses are comprised of four categories: (1) selling; (2) advertising, marketing and design; (3) distribution and
consumer service; and (4) administrative. Selling expenses include store employee compensation, store occupancy costs, store supply costs, wholesale
account administration compensation and all Coach Japan and Coach China operating expenses. Advertising, marketing and design expenses include
employee compensation, media space and production, advertising agency fees, new product design costs, public relations, market research expenses and
mail order costs. Distribution and consumer service expenses include warehousing, order fulfillment, shipping and handling, customer service and bag
repair costs. Administrative expenses include compensation costs for the executive, finance, human resources, legal and information systems departments,
corporate headquarters occupancy costs, and consulting and software expenses.
Preopening Costs
Costs associated with the opening of new stores are expensed in the period incurred.
Advertising
Advertising costs include expenses related to direct marketing activities, such as catalogs, as well as media and production costs. In fiscal 2011, fiscal
2010 and fiscal 2009, advertising expenses totaled $74,988, $61,241 and $50,078, respectively, and are included in selling, general and administrative
expenses. Advertising costs are expensed when the advertising first appears.
50
TABLE OF CONTENTS
COACH, INC.
Notes to Consolidated Financial Statements
(dollars and shares in thousands, except per share data)
2. SIGNIFICANT ACCOUNTING POLICIES – (continued)
Share-Based Compensation
The Company measures the cost of employee services received in exchange for an award of equity instruments based on the grant-date fair value of
the award. The grant-date fair value of the award is recognized as compensation expense over the vesting period.
Shipping and Handling
Shipping and handling costs incurred were $31,522, $22,661 and $26,142 in fiscal 2011, fiscal 2010 and fiscal 2009, respectively, and are included in
selling, general and administrative expenses.
Income Taxes
The Company accounts for income taxes in accordance with Accounting Standards Codification ("ASC") 740, "Income Taxes." Under ASC 740, a
deferred tax liability or asset is recognized for the estimated future tax consequences of temporary differences between the carrying amounts of assets and
liabilities in the financial statements and their respective tax bases. In evaluating the unrecognized tax benefits associated with the Company's various tax
filing positions, management records these positions using a more-likely-than-not recognition threshold for income tax positions taken or expected to be
taken in accordance with ASC 740. The Company classifies interest and penalties, if present, on uncertain tax positions in the Provision for income taxes.
See the note on Change in Accounting Principle.
Fair Value of Financial Instruments
As of July 2, 2011 and July 3, 2010, the carrying values of cash and cash equivalents, trade accounts receivable, accounts payable and accrued
liabilities approximated their values due to the short-term maturities of these accounts. The Company has evaluated its Industrial Revenue Bond and
mortgage and believes, based on the interest rates, related terms and maturities, that the fair values of such instruments approximate their carrying
amounts. See note on Fair Value Measurements for the fair values of the Company's investments as of July 2, 2011 and July 3, 2010.
Coach Japan and Coach Canada enter into foreign currency contracts that hedge certain U.S. dollar-denominated inventory purchases. Additionally,
Coach Japan entered into a cross-currency swap transaction to hedge its fixed rate U.S. dollar denominated intercompany loan. These contracts qualify for
hedge accounting and have been designated as cash flow hedges. The fair value of these contracts is recorded in other comprehensive income and
recognized in earnings in the period in which the hedged item is also recognized in earnings. The fair value of the foreign currency derivative is based on
its market value. Considerable judgment is required of management in developing estimates of fair value. The use of different market assumptions or
methodologies could affect the estimated fair value.
Foreign Currency
The functional currency of the Company's foreign operations is generally the applicable local currency. Assets and liabilities are translated into U.S.
dollars using the current exchange rates in effect at the balance sheet date, while revenues and expenses are translated at the weighted-average exchange
rates for the period. The resulting translation adjustments are recorded as a component of accumulated other comprehensive income within stockholders'
equity.
Net Income Per Share
Basic net income per share is calculated by dividing net income by the weighted-average number of shares outstanding during the period. Diluted net
income per share is calculated similarly but includes potential dilution from the exercise of stock options and vesting of stock awards.
51
TABLE OF CONTENTS
COACH, INC.
Notes to Consolidated Financial Statements
(dollars and shares in thousands, except per share data)
2. SIGNIFICANT ACCOUNTING POLICIES – (continued)
Subsequent Event Evaluation
The Company evaluated subsequent events through the date these financial statements were issued, and concluded there were no events to recognize
or disclose.
Recent Accounting Pronouncements
Accounting Standards Codification 820-10 "Fair Value Measurements and Disclosures," ("ASC 820-10") was amended in January 2010 to require
additional disclosures related to recurring and nonrecurring fair value measurements. The guidance requires disclosure of transfers of assets and liabilities
between Levels 1 and 2 of the fair value hierarchy, including the reasons and the timing of the transfers, and information on purchases, sales, issuances,
and settlements on a gross basis in the reconciliation of the assets and liabilities measured under Level 3 of the fair value hierarchy. The guidance was
effective for the Company beginning on December 27, 2009, except for certain disclosures about purchases, sales, issuances, and settlements related to
Level 3 fair value measurements, which were effective for the Company beginning on January 2, 2011. The disclosure guidance adopted on December 27,
2009 and January 2, 2011 did not have a material impact on our consolidated financial statements.
In May 2011, ASC 820-10 was further amended to clarify certain disclosure requirements and improve consistency with international reporting
standards. This amendment is to be applied prospectively and is effective for the Company beginning January 1, 2012. The Company does not expect its
adoption to have a material effect on its consolidated financial statements.
Accounting Standards Codification Topic 220, "Comprehensive Income," was amended in June 2011 to require entities to present the total of
comprehensive income, the components of net income, and the components of other comprehensive income either in a single continuous statement of
comprehensive income or in two separate but consecutive statements. The amendment does not change the items that must be reported in other
comprehensive income or when an item of other comprehensive income must be reclassified to net income under current GAAP. This guidance is
effective for the Company's fiscal year and interim periods beginning July 1, 2012. The Company is currently evaluating this guidance, but does not expect
its adoption to have a material effect on its consolidated financial statements.
3. SHARE-BASED COMPENSATION
The Company maintains several share-based compensation plans which are more fully described below. The following table shows the total
compensation cost charged against income for these plans and the related tax benefits recognized in the income statement:
Fiscal Year Ended
July 2,
2011
July 3,
2010
June 27,
2009Share-based compensation expense $ 95,830 $ 81,420 $ 67,542 Income tax benefit related to share-based compensation expense 33,377 28,446 23,920
Coach Stock-Based Plans
Coach maintains the 2010 Stock Incentive Plan to award stock options and shares to certain members of Coach management and the outside members
of its Board of Directors ("Board"). Coach maintains the 2000 Stock Incentive Plan, the 2000 Non-Employee Director Stock Plan and the 2004 Stock
Incentive Plan for awards granted prior to the establishment of the 2010 Stock Incentive Plan. These plans were approved by Coach's stockholders. The
exercise price of each stock option equals 100% of the market price of Coach's stock on the date of grant and generally has a maximum term of 10 years.
Stock options and share awards
52

TABLE OF CONTENTS
COACH, INC.
Notes to Consolidated Financial Statements
(dollars and shares in thousands, except per share data)
3. SHARE-BASED COMPENSATION – (continued)
that are granted as part of the annual compensation process generally vest ratably over three years. Other stock option and share awards, granted primarily
for retention purposes, are subject to forfeiture until completion of the vesting period, which ranges from one to five years. The Company issues new
shares upon the exercise of stock options, vesting of share units and employee stock purchase.
For options granted under Coach's stock option plans prior to July 1, 2003, an active employee can receive a replacement stock option equal to the
number of shares surrendered upon a stock-for-stock exercise. The exercise price of the replacement option equals 100% of the market value at the date of
exercise of the original option and will remain exercisable for the remaining term of the original option. Replacement stock options generally vest six
months from the grant date. No replacement stock options were granted in fiscal 2011, fiscal 2010 or fiscal 2009.
Stock Options
A summary of option activity under the Coach stock option plans as of July 2, 2011 and changes during the year then ended is as follows:
Number of Options
Outstanding Weighted-Average
Exercise Price Weighted-Average
Remaining ContractualTerm
(in years)
Aggregate IntrinsicValue
Outstanding at July 3,2010
24,905 $ 30.87
Granted 3,598 39.57 Exercised (11,167) 32.00 Forfeited or expired (504) 39.04
Outstanding at July 2,2011
16,832 31.73 6.1 $ 576,621
Vested or expected tovest at July 2, 2011
16,774 31.70 6.1 575,205
Exercisable at July 2,2011
8,324 29.91 4.3 300,328
The fair value of each Coach option grant is estimated on the date of grant using the Black-Scholes option pricing model and the following weighted-
average assumptions:
Fiscal Year Ended
July 2,
2011
July 3,
2010
June 27,
2009Expected term (years) 3.3 3.0 3.0 Expected volatility 44.9% 49.4% 44.7% Risk-free interest rate 1.0% 1.7% 2.7% Dividend yield 1.5% 1.0% 0.0%
The expected term of options represents the period of time that the options granted are expected to be outstanding and is based on historical
experience. Expected volatility is based on historical volatility of the Company's stock as well as the implied volatility from publicly traded options on
Coach's stock. The risk free interest rate is based on the zero-coupon U.S. Treasury issue as of the date of the grant. Grants subsequent to the Company's
April 2009 Board approval to initiate a quarterly dividend included a dividend yield assumption based on Coach's annual expected dividend divided by the
grant-date share price.
The weighted-average grant-date fair value of options granted during fiscal 2011, fiscal 2010 and fiscal 2009 was $11.41, $9.68 and $8.36,
respectively. The total intrinsic value of options exercised during fiscal 2011, fiscal 2010 and fiscal 2009 was $226,511, $127,879 and $11,495,
respectively. The total cash received from option exercises was $357,344, $208,919 and $9,382 in fiscal 2011, fiscal 2010 and fiscal 2009,
53

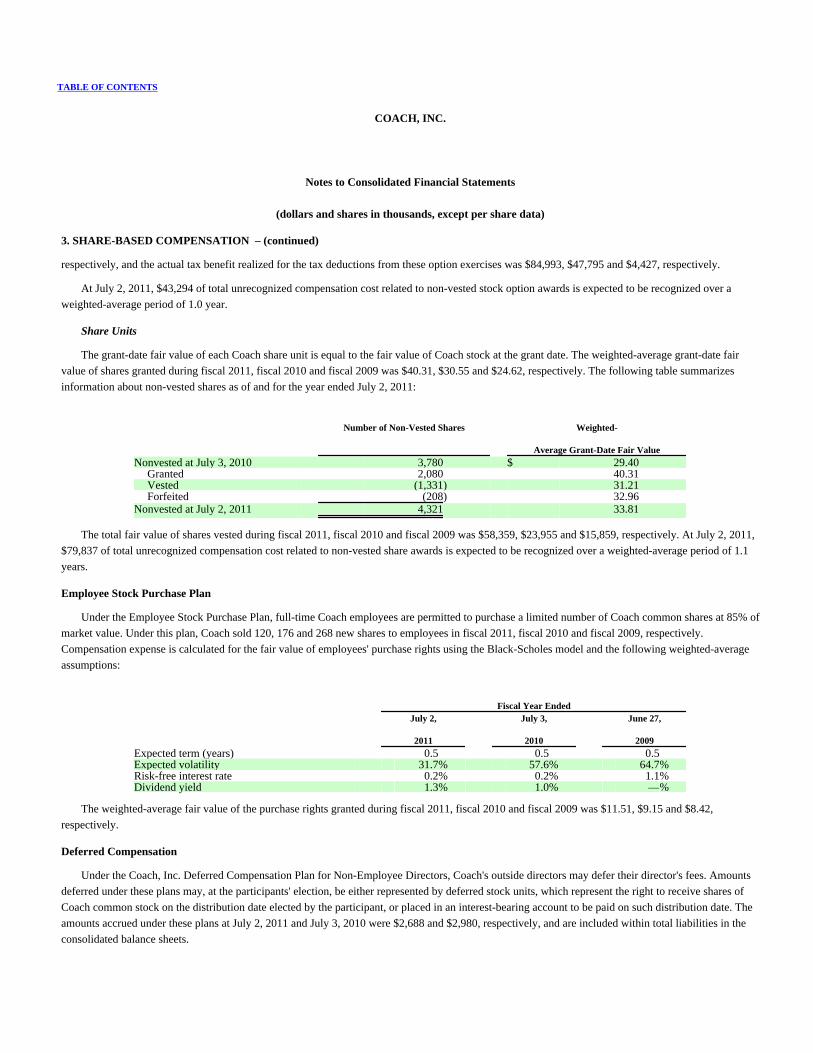
TABLE OF CONTENTS
COACH, INC.
Notes to Consolidated Financial Statements
(dollars and shares in thousands, except per share data)
3. SHARE-BASED COMPENSATION – (continued)
respectively, and the actual tax benefit realized for the tax deductions from these option exercises was $84,993, $47,795 and $4,427, respectively.
At July 2, 2011, $43,294 of total unrecognized compensation cost related to non-vested stock option awards is expected to be recognized over a
weighted-average period of 1.0 year.
Share Units
The grant-date fair value of each Coach share unit is equal to the fair value of Coach stock at the grant date. The weighted-average grant-date fair
value of shares granted during fiscal 2011, fiscal 2010 and fiscal 2009 was $40.31, $30.55 and $24.62, respectively. The following table summarizes
information about non-vested shares as of and for the year ended July 2, 2011:
Number of Non-Vested Shares Weighted-
Average Grant-Date Fair Value
Nonvested at July 3, 2010 3,780 $ 29.40 Granted 2,080 40.31 Vested (1,331) 31.21 Forfeited (208) 32.96
Nonvested at July 2, 2011 4,321 33.81
The total fair value of shares vested during fiscal 2011, fiscal 2010 and fiscal 2009 was $58,359, $23,955 and $15,859, respectively. At July 2, 2011,
$79,837 of total unrecognized compensation cost related to non-vested share awards is expected to be recognized over a weighted-average period of 1.1
years.
Employee Stock Purchase Plan
Under the Employee Stock Purchase Plan, full-time Coach employees are permitted to purchase a limited number of Coach common shares at 85% of
market value. Under this plan, Coach sold 120, 176 and 268 new shares to employees in fiscal 2011, fiscal 2010 and fiscal 2009, respectively.
Compensation expense is calculated for the fair value of employees' purchase rights using the Black-Scholes model and the following weighted-average
assumptions:
Fiscal Year Ended
July 2,
2011
July 3,
2010
June 27,
2009Expected term (years) 0.5 0.5 0.5 Expected volatility 31.7% 57.6% 64.7% Risk-free interest rate 0.2% 0.2% 1.1% Dividend yield 1.3% 1.0% —%
The weighted-average fair value of the purchase rights granted during fiscal 2011, fiscal 2010 and fiscal 2009 was $11.51, $9.15 and $8.42,
respectively.
Deferred Compensation
Under the Coach, Inc. Deferred Compensation Plan for Non-Employee Directors, Coach's outside directors may defer their director's fees. Amounts
deferred under these plans may, at the participants' election, be either represented by deferred stock units, which represent the right to receive shares of
Coach common stock on the distribution date elected by the participant, or placed in an interest-bearing account to be paid on such distribution date. The
amounts accrued under these plans at July 2, 2011 and July 3, 2010 were $2,688 and $2,980, respectively, and are included within total liabilities in the
consolidated balance sheets.

54

TABLE OF CONTENTS
COACH, INC.
Notes to Consolidated Financial Statements
(dollars and shares in thousands, except per share data)
4. LEASES
Coach leases certain office, distribution and retail facilities. The lease agreements, which expire at various dates through 2028, are subject, in some
cases, to renewal options and provide for the payment of taxes, insurance and maintenance. Certain leases contain escalation clauses resulting from the
pass-through of increases in operating costs, property taxes and the effect on costs from changes in consumer price indices. Certain rentals are also
contingent upon factors such as sales.
Rent-free periods and scheduled rent increases are recorded as components of rent expense on a straight-line basis over the related terms of such
leases. Contingent rentals are recognized when the achievement of the target (i.e., sales levels), which triggers the related payment, is considered probable.
Rent expense for the Company's operating leases consisted of the following:
Fiscal Year Ended
July 2,
2011
July 3,
2010
June 27,
2009Minimum rentals $ 129,110 $ 121,563 $ 107,272 Contingent rentals 77,795 59,806 43,995 Total rent expense $ 206,905 $ 181,369 $ 151,267
Future minimum rental payments under noncancelable operating leases are as follows:
Fiscal Year Amount2012 $ 152,871 2013 148,348 2014 140,032 2015 133,556 2016 93,785 Subsequent to 2016 350,671
Total minimum future rental payments $ 1,019,263
Certain operating leases provide for renewal for periods of five to ten years at their fair rental value at the time of renewal. In the normal course of
business, operating leases are generally renewed or replaced by new leases.
5. FAIR VALUE MEASUREMENTS
In accordance with ASC 820-10, "Fair Value Measurements and Disclosures," the Company categorized its assets and liabilities based on the priority
of the inputs to the valuation technique into a three-level fair value hierarchy as set forth below. The three levels of the hierarchy are defined as follows:
Level 1 — Unadjusted quoted prices in active markets for identical assets or liabilities. Coach currently does not have any Level 1 financial assets
or liabilities.
Level 2 — Observable inputs other than quoted prices included in Level 1. Level 2 inputs include quoted prices for identical assets or liabilities in
non-active markets, quoted prices for similar assets or liabilities in active markets, and inputs other than quoted prices that are observable for
substantially the full term of the asset or liability.
Level 3 — Unobservable inputs reflecting management's own assumptions about the input used in pricing the asset or liability.
55

TABLE OF CONTENTS
COACH, INC.
Notes to Consolidated Financial Statements
(dollars and shares in thousands, except per share data)
5. FAIR VALUE MEASUREMENTS – (continued)
The following table shows the fair value measurements of the Company's assets and liabilities at July 2, 2011 and July 3, 2010:
Level 2 Level 3
July 2,
2011
July 3,
2010
July 2,
2011
July 3,
2010Assets:
Long-term investment – auction rate security(a) $ — $ — $ 6,000 $ 6,000 Derivative assets – zero-cost collar options(b) 2,020 2,052 — —
Total $ 2,020 $ 2,052 $ 6,000 $ 6,000 Liabilities:
Derivative liabilities – zero-cost collar options(b) $ 1,062 $ 5,120 $ — $ — Derivative liabilities – cross-currency swap(c) — — 651 2,418
Total $ 1,062 $ 5,120 $ 651 $ 2,418
(a) The fair value of the security is determined using a model that takes into consideration the financial conditions of the issuer and the bond insurer,
current market conditions and the value of the collateral bonds.
(b) The Company enters into zero-cost collar options to manage its exposure to foreign currency exchange rate fluctuations resulting from Coach Japan's
and Coach Canada's U.S. dollar-denominated inventory purchases. The fair value of these cash flow hedges is primarily based on the forward curves of
the specific indices upon which settlement is based and includes an adjustment for the counterparty's or Company's credit risk.
(c) The Company is a party to a cross-currency swap transaction in order to manage its exposure to foreign currency exchange rate fluctuations resulting
from Coach Japan's U.S. dollar-denominated fixed rate intercompany loan. The fair value of this cash flow hedge is primarily based on the forward
curves of the specific indices upon which settlement is based and includes an adjustment for the Company's credit risk.
See note on Derivative Instruments and Hedging Activities for more information on the Company's derivative contracts.
As of July 2, 2011 and July 3, 2010, the Company's investments included an auction rate security ("ARS") classified as a long-term investment, as the
auction for this security has been unsuccessful. The underlying investments of the ARS are scheduled to mature in 2035. We have determined that the
significant majority of the inputs used to value this security fall within Level 3 of the fair value hierarchy as the inputs are based on unobservable
estimates. At both July 2, 2011 and July 3, 2010, the fair value of the Company's ARS was $6,000.
56

TABLE OF CONTENTS
COACH, INC.
Notes to Consolidated Financial Statements
(dollars and shares in thousands, except per share data)
5. FAIR VALUE MEASUREMENTS – (continued)
As of July 2, 2011 and July 3, 2010, the fair value of the Company's cross-currency swap derivatives were included within accrued liabilities. The
Company uses a management model which includes a combination of observable inputs, such as tenure of the agreement and notional amount and
unobservable inputs, such as the Company's credit rating. The table below presents the changes in the fair value of the cross-currency swap during fiscal
2011 and fiscal 2010:
Cross-Currency Swaps
Balance at July 3, 2010 $ 2,418 Settlement of cross-currency swap on June 30, 2011 (2,418) Unrealized loss on cross-currency swap maturing on December 29, 2011, recorded in
accumulated other comprehensive income 651
Balance at July 2, 2011 $ 651 Balance at June 27, 2009 $ 36,118
Settlement of cross-currency swap on July 2, 2010 (36,118) Unrealized loss on cross-currency swap maturing on June 30, 2011, recorded in accumulated
other comprehensive income 2,418
Balance at July 3, 2010 $ 2,418
The above settlement amounts for the cross-currency swaps on June 30, 2011 and July 2, 2010 are net of previously unrecognized losses recognized
through accumulated other comprehensive income of $10,807 and $14,851 in fiscal 2011 and 2010, respectively, prior to the respective settlement dates.
During fiscal 2011 and fiscal 2010, the Company purchased $224,007 and $229,860, respectively, of short-term investments consisting of U.S.
treasury bills and commercial paper. These investments, net of proceeds from sales and maturities, totaled $2,256 and $99,928 as of July 2, 2011 and July
3, 2010, respectively, and are classified as held-to-maturity based on our positive intent and ability to hold the securities to maturity. They are stated at
amortized cost, which approximates fair market value due to their short maturities.
6. DEBT
Revolving Credit Facilities
The Company maintains a $100,000 revolving credit facility with certain lenders and Bank of America, N.A. as the primary lender and administrative
agent (the "Bank of America facility"). The facility expires on July 26, 2012. At Coach's request and lenders' consent, the Bank of America facility can be
expanded to $200,000 and can also be extended for two additional one-year periods. Under the Bank of America facility, Coach pays a commitment fee of
6 to 12.5 basis points on any unused amounts and interest of LIBOR plus 20 to 55 basis points on any outstanding borrowings. At July 2, 2011, the
commitment fee was 7 basis points and the LIBOR margin was 30 basis points.
The Bank of America facility is available for seasonal working capital requirements or general corporate purposes and may be prepaid without penalty
or premium. During fiscal 2011 and fiscal 2010 there were no borrowings under the Bank of America facility. Accordingly, as of July 2, 2011 and July 3,
2010, there were no outstanding borrowings under the Bank of America facility. The Company's borrowing capacity as of July 2, 2011 was $89,993, due
to outstanding letters of credit.
The Bank of America facility contains various covenants and customary events of default. Coach has been in compliance with all covenants since its
inception.
57
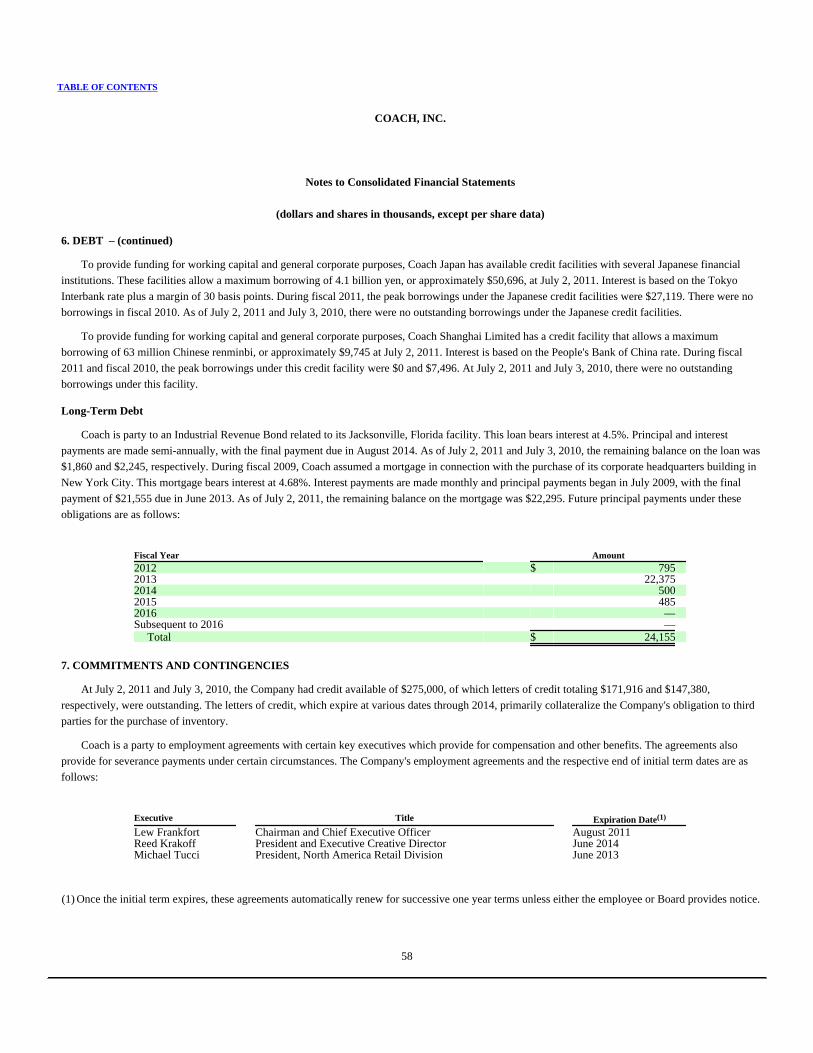
TABLE OF CONTENTS
COACH, INC.
Notes to Consolidated Financial Statements
(dollars and shares in thousands, except per share data)
6. DEBT – (continued)
To provide funding for working capital and general corporate purposes, Coach Japan has available credit facilities with several Japanese financial
institutions. These facilities allow a maximum borrowing of 4.1 billion yen, or approximately $50,696, at July 2, 2011. Interest is based on the Tokyo
Interbank rate plus a margin of 30 basis points. During fiscal 2011, the peak borrowings under the Japanese credit facilities were $27,119. There were no
borrowings in fiscal 2010. As of July 2, 2011 and July 3, 2010, there were no outstanding borrowings under the Japanese credit facilities.
To provide funding for working capital and general corporate purposes, Coach Shanghai Limited has a credit facility that allows a maximum
borrowing of 63 million Chinese renminbi, or approximately $9,745 at July 2, 2011. Interest is based on the People's Bank of China rate. During fiscal
2011 and fiscal 2010, the peak borrowings under this credit facility were $0 and $7,496. At July 2, 2011 and July 3, 2010, there were no outstanding
borrowings under this facility.
Long-Term Debt
Coach is party to an Industrial Revenue Bond related to its Jacksonville, Florida facility. This loan bears interest at 4.5%. Principal and interest
payments are made semi-annually, with the final payment due in August 2014. As of July 2, 2011 and July 3, 2010, the remaining balance on the loan was
$1,860 and $2,245, respectively. During fiscal 2009, Coach assumed a mortgage in connection with the purchase of its corporate headquarters building in
New York City. This mortgage bears interest at 4.68%. Interest payments are made monthly and principal payments began in July 2009, with the final
payment of $21,555 due in June 2013. As of July 2, 2011, the remaining balance on the mortgage was $22,295. Future principal payments under these
obligations are as follows:
Fiscal Year Amount2012 $ 795 2013 22,375 2014 500 2015 485 2016 — Subsequent to 2016 —
Total $ 24,155
7. COMMITMENTS AND CONTINGENCIES
At July 2, 2011 and July 3, 2010, the Company had credit available of $275,000, of which letters of credit totaling $171,916 and $147,380,
respectively, were outstanding. The letters of credit, which expire at various dates through 2014, primarily collateralize the Company's obligation to third
parties for the purchase of inventory.
Coach is a party to employment agreements with certain key executives which provide for compensation and other benefits. The agreements also
provide for severance payments under certain circumstances. The Company's employment agreements and the respective end of initial term dates are as
follows:
Executive Title Expiration Date(1)
Lew Frankfort Chairman and Chief Executive Officer August 2011Reed Krakoff President and Executive Creative Director June 2014Michael Tucci President, North America Retail Division June 2013
(1) Once the initial term expires, these agreements automatically renew for successive one year terms unless either the employee or Board provides notice.
58

TABLE OF CONTENTS
COACH, INC.
Notes to Consolidated Financial Statements
(dollars and shares in thousands, except per share data)
7. COMMITMENTS AND CONTINGENCIES – (continued)
In addition to the employment agreements described above, other contractual cash obligations as of July 2, 2011 and July 3, 2010 included $195,382
and $166,596, respectively, related to inventory purchase obligations and $1,087 and $1,611, respectively, related to capital expenditure purchase
obligations.
In the ordinary course of business, Coach is a party to several pending legal proceedings and claims. Although the outcome of such items cannot be
determined with certainty, Coach's general counsel and management are of the opinion that the final outcome will not have a material effect on Coach's
cash flow, results of operations or financial position.
8. DERIVATIVE INSTRUMENTS AND HEDGING ACTIVITIES
Substantially all purchases and sales involving international parties are denominated in U.S. dollars, which limits the Company's exposure to foreign
currency exchange rate fluctuations. However, the Company is exposed to market risk from foreign currency exchange risk related to Coach Japan's and
Coach Canada's U.S. dollar-denominated inventory purchases and Coach Japan's $109,110 U.S. dollar-denominated fixed rate intercompany loan. Coach
uses derivative financial instruments to manage these risks. These derivative transactions are in accordance with the Company's risk management policies.
Coach does not enter into derivative transactions for speculative or trading purposes.
Coach Japan and Coach Canada enter into certain foreign currency derivative contracts, primarily zero-cost collar options, to manage the exchange
rate risk related to their inventory purchases. As of July 2, 2011 and July 3, 2010, $171,030 and $248,555 of foreign currency forward contracts were
outstanding, respectively.
On July 1, 2005, to manage the exchange rate risk related to a $231,000 intercompany loan, Coach Japan entered into a cross currency swap
transaction. The terms of the cross currency swap transaction included an exchange of a yen fixed interest rate for a U.S. dollar fixed interest rate and an
exchange of yen and U.S. dollar-based notional values at maturity on July 2, 2010.
On July 2, 2010, Coach Japan repaid the loan, settled the cross currency swap, and entered into a new $139,400 intercompany loan agreement.
Concurrently, Coach Japan entered into a cross currency swap transaction, the terms of which included an exchange of a yen fixed interest rate for a U.S.
dollar fixed interest rate, requiring an exchange of yen and U.S. dollar based notional values at maturity on June 30, 2011.
On June 30, 2011, Coach Japan repaid the loan, settled the cross currency swap, and entered into a new $109,110 intercompany loan agreement with a
maturity date of December 29, 2011. Similar to the previous loans, to manage the exchange rate risk, Coach Japan entered into a new cross currency swap
transaction, the terms of which include an exchange of a yen fixed interest rate for a U.S. dollar fixed interest rate and an exchange of yen and U.S. dollar
based notional values at maturity on December 29, 2011.
The Company's derivative instruments are designated as cash flow hedges. The effective portion of gains or losses on the derivative instruments are
reported as a component of other comprehensive income and reclassified into earnings in the same periods during which the hedged transaction affects
earnings. The ineffective portion of gains or losses on the derivative instruments are recognized in current earnings and are included within net cash
provided by operating activities.
59

TABLE OF CONTENTS
COACH, INC.
Notes to Consolidated Financial Statements
(dollars and shares in thousands, except per share data)
8. DERIVATIVE INSTRUMENTS AND HEDGING ACTIVITIES – (continued)
The following tables provide information related to the Company's derivatives:
Derivatives Designated as Hedging Instruments Balance Sheet Classification Fair Value
At
July 2,
2011
At
July 3,
2010Foreign exchange contracts
Other Current Assets $ 2,020 $ 2,052
Total derivative assets $ 2,020 $ 2,052 Foreign exchange contracts
Accrued Liabilities $ 1,713 $ 7,538
Total derivative liabilities $ 1,713 $ 7,538
Amount of Loss Recognized
in OCI on Derivatives
(Effective Portion)
Year EndedDerivatives in Cash Flow Hedging Relationships July 2,
2011
July 3,
2010Foreign exchange contracts $ (9,394) $ (3,363)
Total $ (9,394) $ (3,363)
For fiscal 2011 and fiscal 2010, the amounts above are net of tax of $5,960 and $2,858, respectively.
Amount of Loss Reclassified from Accumulated OCI into Income (Effective Portion)
Year EndedLocation of Loss Reclassified from AccumulatedOCI into Income (Effective Portion)
July 2,
2011
July 3,
2010Cost of Sales $ (15,886) $ (5,453)
Total $ (15,886) $ (5,453)
During fiscal 2011 and fiscal 2010, there were no material gains or losses recognized in income due to hedge ineffectiveness.
The Company expects that $2,356 of net derivative losses included in accumulated other comprehensive income at July 2, 2011 will be reclassified
into earnings within the next 12 months. This amount will vary due to fluctuations in the Japanese yen and Canadian dollar exchange rates.
Hedging activity affected accumulated other comprehensive income, net of tax, as follows:
Year Ended
July 2,
2011
July 3,
2010Balance at beginning of period $ (2,092) $ (335) Net losses transferred to earnings 10,021 1,606 Change in fair value, net of tax (9,394) (3,363) Balance at end of period $ (1,465) $ (2,092)

60
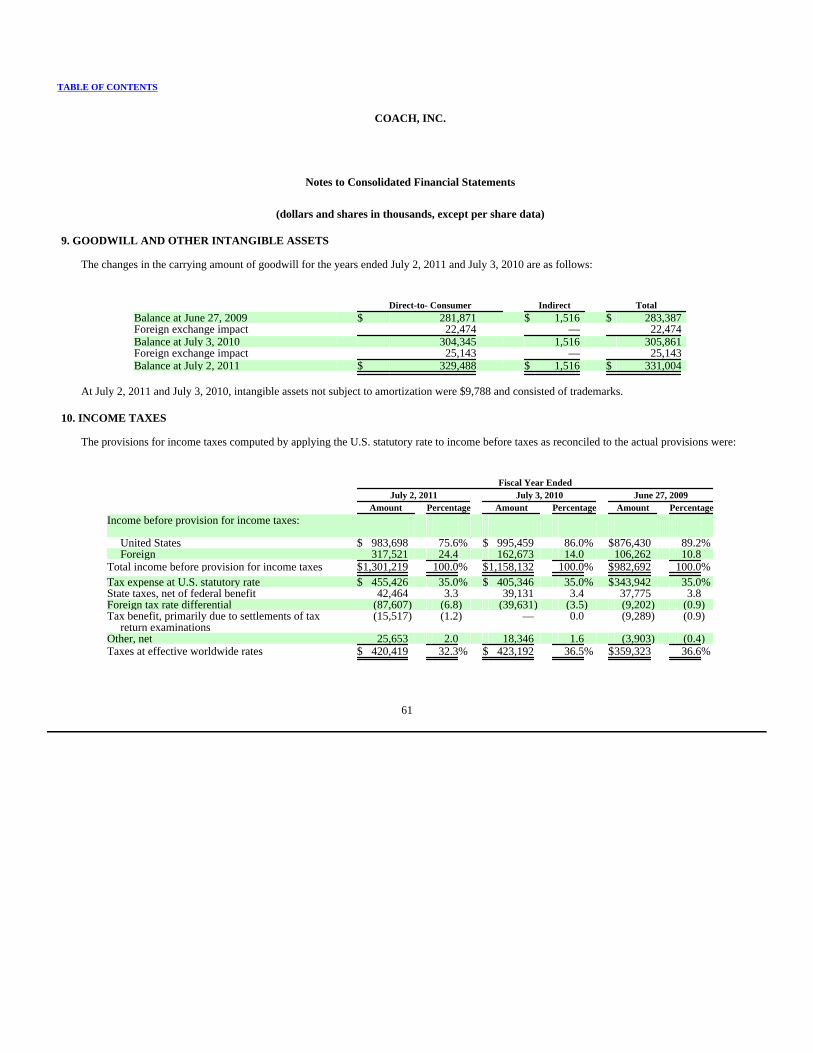
TABLE OF CONTENTS
COACH, INC.
Notes to Consolidated Financial Statements
(dollars and shares in thousands, except per share data)
9. GOODWILL AND OTHER INTANGIBLE ASSETS
The changes in the carrying amount of goodwill for the years ended July 2, 2011 and July 3, 2010 are as follows:
Direct-to- Consumer Indirect Total
Balance at June 27, 2009 $ 281,871 $ 1,516 $ 283,387 Foreign exchange impact 22,474 — 22,474 Balance at July 3, 2010 304,345 1,516 305,861 Foreign exchange impact 25,143 — 25,143 Balance at July 2, 2011 $ 329,488 $ 1,516 $ 331,004
At July 2, 2011 and July 3, 2010, intangible assets not subject to amortization were $9,788 and consisted of trademarks.
10. INCOME TAXES
The provisions for income taxes computed by applying the U.S. statutory rate to income before taxes as reconciled to the actual provisions were:
Fiscal Year Ended
July 2, 2011 July 3, 2010 June 27, 2009 Amount Percentage Amount Percentage Amount PercentageIncome before provision for income taxes:
United States $ 983,698 75.6% $ 995,459 86.0% $876,430 89.2% Foreign 317,521 24.4 162,673 14.0 106,262 10.8
Total income before provision for income taxes $1,301,219 100.0% $1,158,132 100.0% $982,692 100.0% Tax expense at U.S. statutory rate $ 455,426 35.0% $ 405,346 35.0% $343,942 35.0% State taxes, net of federal benefit 42,464 3.3 39,131 3.4 37,775 3.8 Foreign tax rate differential (87,607) (6.8) (39,631) (3.5) (9,202) (0.9) Tax benefit, primarily due to settlements of tax
return examinations (15,517) (1.2) — 0.0 (9,289) (0.9)
Other, net 25,653 2.0 18,346 1.6 (3,903) (0.4) Taxes at effective worldwide rates $ 420,419 32.3% $ 423,192 36.5% $359,323 36.6%
61

TABLE OF CONTENTS
COACH, INC.
Notes to Consolidated Financial Statements
(dollars and shares in thousands, except per share data)
10. INCOME TAXES – (continued)
Current and deferred tax provisions (benefits) were:
Fiscal Year Ended
July 2, 2011 July 3, 2010 June 27, 2009 Current Deferred Current Deferred Current DeferredFederal $ 345,006 $ 11,848 $ 384,716 $ (40,613) $ 300,700 $ (5,646) Foreign (3,064) 26,589 (9,956) 28,449 (4,544) 14,788 State 38,753 1,287 65,562 (4,965) 49,507 4,518 Total current and deferred tax provisions (benefits) $ 380,695 $ 39,724 $ 440,322 $ (17,129) $ 345,663 $ 13,660
The components of deferred tax assets and liabilities at the respective year-ends were as follows:
Fiscal 2011 Fiscal 2010
Share-based compensation $ 59,672 $ 74,455 Reserves not deductible until paid 67,072 81,396 Pensions and other employee benefits 67,264 45,935 Property and equipment 12,439 17,121 Net operating loss 42,215 40,890 Other 2,887 3,194 Gross deferred tax assets $ 251,549 $ 262,991 Prepaid expenses $ 6,781 $ 7,426 Goodwill 45,528 20,521 Other 1,681 1,224 Gross deferred tax liabilities 53,990 29,171 Net deferred tax assets $ 197,559 $ 233,820 Consolidated Balance Sheets Classification
Deferred income taxes – current asset $ 93,902 $ 77,355 Deferred income taxes – noncurrent asset 103,657 156,465 Deferred income taxes – noncurrent liability — — Net amount recognized $ 197,559 $ 233,820
Significant judgment is required in determining the worldwide provision for income taxes, and there are many transactions for which the ultimate tax
outcome is uncertain. It is the Company's policy to establish provisions for taxes that may become payable in future years as a result of an examination by
tax authorities. The Company establishes the provisions based upon management's assessment of exposure associated with uncertain tax positions. The
provisions are analyzed periodically and adjustments are made as events occur that warrant adjustments to those provisions. All of these determinations
are subject to the requirements of ASC 740.
62

TABLE OF CONTENTS
COACH, INC.
Notes to Consolidated Financial Statements
(dollars and shares in thousands, except per share data)
10. INCOME TAXES – (continued)
A reconciliation of the beginning and ending gross amount of unrecognized tax benefits is as follows:
Fiscal 2011 Fiscal 2010 Fiscal 2009
Balance at beginning of fiscal year $ 165,676 $ 137,807 $ 131,185 Gross increase due to tax positions related to prior periods 5,225 3,903 13,690 Gross decrease due to tax positions related to prior periods (1,218) (971) (9,841) Gross increase due to tax positions related to current period 29,342 27,034 42,367 Decrease due to lapse of statutes of limitations (6,519) (1,692) (833) Decrease due to settlements with taxing authorities (30,446) (405) (38,761) Balance at end of fiscal year $ 162,060 $ 165,676 $ 137,807
Of the $162,060 ending gross unrecognized tax benefit balance, $79,370 relates to items which, if recognized, would impact the effective tax rate. As
of July 2, 2011 and July 3, 2010, gross interest and penalties payable was $35,258 and $35,331, which are included in other liabilities. During fiscal 2011,
fiscal 2010 and fiscal 2009, the Company recognized interest and penalty (income) expense of $(3,195), $6,204 and $5,611, respectively, in the
Consolidated Statements of Income.
The Company files income tax returns in the U.S. federal jurisdiction as well as various state and foreign jurisdictions. Fiscal years 2008 to present are
open to examination in the federal jurisdiction, fiscal 2004 to present in significant state jurisdictions, and from fiscal 2004 to present in foreign
jurisdictions. During the fiscal 2011 and fiscal 2009, the Company decreased the provision for income taxes primarily as a result of a favorable settlement
of a multi-year tax return examination.
Based on the number of tax years currently under audit by the relevant tax authorities, the Company anticipates that one or more of these audits may
be finalized in the foreseeable future. However, based on the status of these examinations, and the protocol of finalizing audits by the relevant tax
authorities, we cannot reasonably estimate the impact of any amount of such changes in the next 12 months, if any, to previously recorded uncertain tax
positions.
At July 2, 2011, the Company had net operating loss carryforwards in foreign tax jurisdictions of $100,393, which will expire beginning in fiscal
years 2013 through fiscal year 2017.
The total amount of undistributed earnings of foreign subsidiaries as of July 2, 2011 was $941,859. It is the Company's intention to permanently
reinvest undistributed earnings of its foreign subsidiaries and thereby indefinitely postpone their remittance. Accordingly, no provision has been made for
foreign withholding taxes or United States income taxes which may become payable if undistributed earnings of foreign subsidiaries are paid as dividends.
11. DEFINED CONTRIBUTION PLAN
Coach maintains the Coach, Inc. Savings and Profit Sharing Plan, which is a defined contribution plan. Employees who meet certain eligibility
requirements and are not part of a collective bargaining agreement may participate in this program. The annual expense incurred by Coach for this defined
contribution plan was $16,029, $13,285 and $12,511 in fiscal 2011, fiscal 2010 and fiscal 2009, respectively.
63

TABLE OF CONTENTS
COACH, INC.
Notes to Consolidated Financial Statements
(dollars and shares in thousands, except per share data)
12. SEGMENT INFORMATION
The Company operates its business in two reportable segments: Direct-to-Consumer and Indirect. The Company's reportable segments represent
channels of distribution that offer similar merchandise, service and marketing strategies. Sales of Coach products through Company-operated stores in
North America, Japan, Hong Kong, Macau and mainland China, the Internet and the Coach catalog constitute the Direct-to-Consumer segment. The
Indirect segment includes sales to wholesale customers and distributors in over 20 countries, including the United States, and royalties earned on licensed
products. In deciding how to allocate resources and assess performance, Coach's executive officers regularly evaluate the sales and operating income of
these segments. Operating income is the gross margin of the segment less direct expenses of the segment. Unallocated corporate expenses include
production variances, general marketing, administration and information systems, as well as distribution and consumer service expenses.
In connection with the acquisitions of the retail businesses in Hong Kong, Macau and mainland China, the Company evaluated the composition of its
reportable segments and concluded that sales in these regions should be included in the Direct-to-Consumer segment.
Direct-to- Consumer Indirect Corporate Unallocated Total
Fiscal 2011
Net sales $ 3,621,886 $ 536,621 $ — $ 4,158,507 Operating income (loss) 1,423,191 296,032 (414,299) 1,304,924 Income (loss) before provision for income taxes 1,423,191 296,032 (418,004) 1,301,219 Depreciation and amortization expense 82,333 11,273 31,500 125,106 Total assets 1,454,106 109,514 1,071,496 2,635,116 Additions to long-lived assets 106,556 8,671 39,424 154,651 Fiscal 2010
Net sales $ 3,155,860 $ 451,776 $ — $ 3,607,636 Operating income (loss) 1,245,400 256,637 (351,866) 1,150,171 Income (loss) before provision for income taxes(1) 1,245,400 256,637 (343,905) 1,158,132 Depreciation and amortization expense 85,110 10,138 31,496 126,744 Total assets 1,294,445 120,739 1,051,931 2,467,115 Additions to long-lived assets 45,003 9,088 26,307 80,398 Fiscal 2009
Net sales $ 2,726,891 $ 503,577 $ — $ 3,230,468 Operating income (loss) 996,285 290,981 (315,353) 971,913 Income (loss) before provision for income taxes(1) 996,285 290,981 (304,574) 982,692 Depreciation and amortization expense 82,539 10,394 30,081 123,014 Total assets 1,311,341 86,235 1,166,760 2,564,336 Additions to long-lived assets 82,852 7,242 158,665 248,759
(1) During fiscal 2011, the Company changed its method of accounting for the classification of interest and penalties related to uncertain tax positions to
include such amounts as a component of the Provision for income taxes. They had previously been classified within Interest income, net. Previously
reported amounts for fiscal years 2010 and 2009 have been restated to reflect this change. See the Change in Accounting Principle note presented in
the Notes to the Consolidated Financial Statements.
64
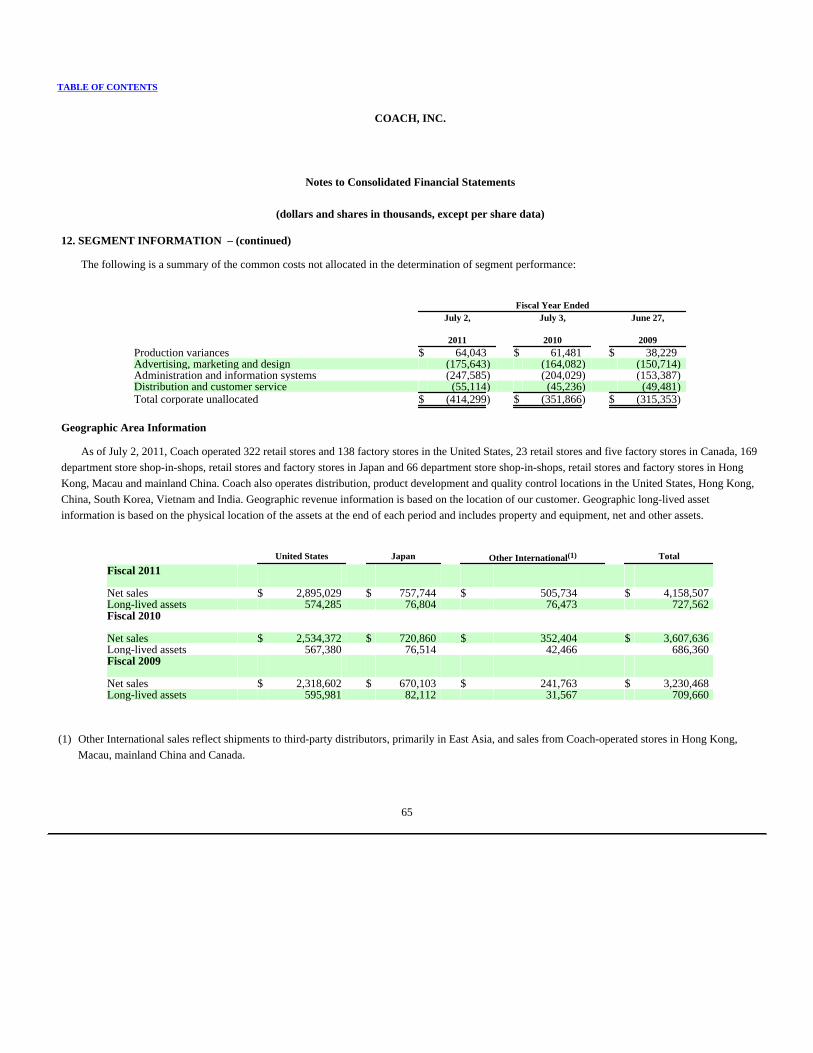
TABLE OF CONTENTS
COACH, INC.
Notes to Consolidated Financial Statements
(dollars and shares in thousands, except per share data)
12. SEGMENT INFORMATION – (continued)
The following is a summary of the common costs not allocated in the determination of segment performance:
Fiscal Year Ended
July 2,
2011
July 3,
2010
June 27,
2009Production variances $ 64,043 $ 61,481 $ 38,229 Advertising, marketing and design (175,643) (164,082) (150,714) Administration and information systems (247,585) (204,029) (153,387) Distribution and customer service (55,114) (45,236) (49,481) Total corporate unallocated $ (414,299) $ (351,866) $ (315,353)
Geographic Area Information
As of July 2, 2011, Coach operated 322 retail stores and 138 factory stores in the United States, 23 retail stores and five factory stores in Canada, 169
department store shop-in-shops, retail stores and factory stores in Japan and 66 department store shop-in-shops, retail stores and factory stores in Hong
Kong, Macau and mainland China. Coach also operates distribution, product development and quality control locations in the United States, Hong Kong,
China, South Korea, Vietnam and India. Geographic revenue information is based on the location of our customer. Geographic long-lived asset
information is based on the physical location of the assets at the end of each period and includes property and equipment, net and other assets.
United States Japan Other International(1) Total
Fiscal 2011
Net sales $ 2,895,029 $ 757,744 $ 505,734 $ 4,158,507 Long-lived assets 574,285 76,804 76,473 727,562 Fiscal 2010
Net sales $ 2,534,372 $ 720,860 $ 352,404 $ 3,607,636 Long-lived assets 567,380 76,514 42,466 686,360 Fiscal 2009
Net sales $ 2,318,602 $ 670,103 $ 241,763 $ 3,230,468 Long-lived assets 595,981 82,112 31,567 709,660
(1) Other International sales reflect shipments to third-party distributors, primarily in East Asia, and sales from Coach-operated stores in Hong Kong,
Macau, mainland China and Canada.
65
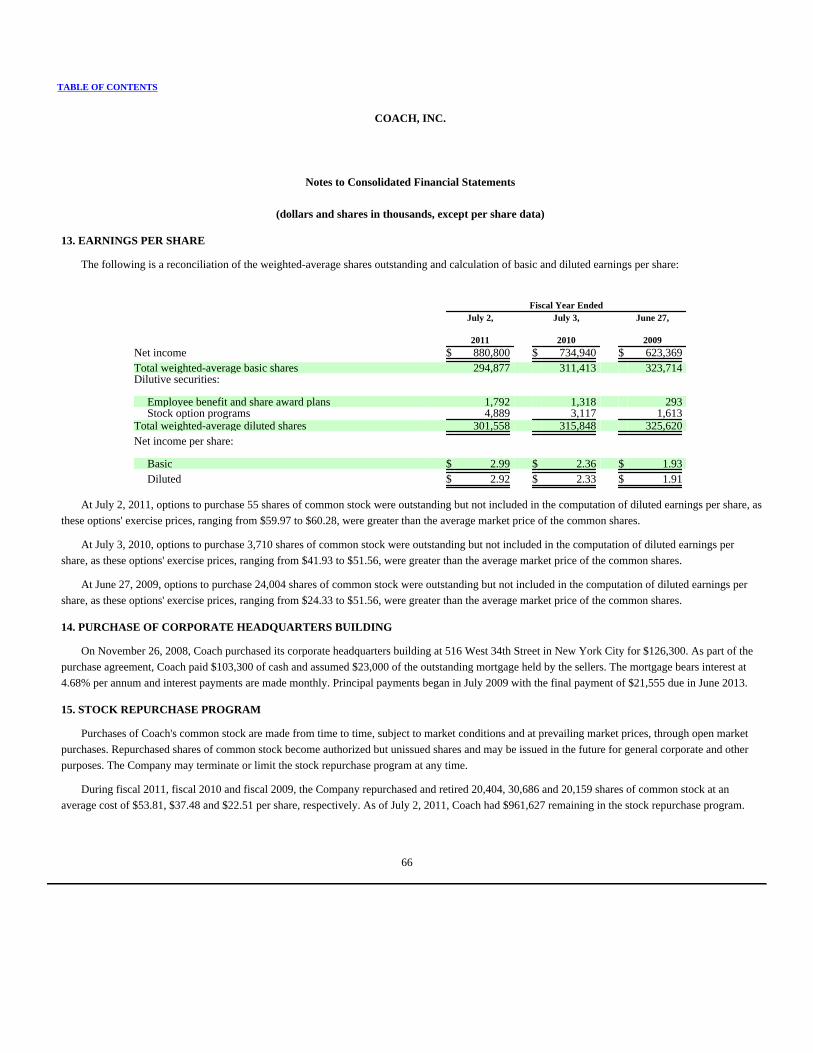
TABLE OF CONTENTS
COACH, INC.
Notes to Consolidated Financial Statements
(dollars and shares in thousands, except per share data)
13. EARNINGS PER SHARE
The following is a reconciliation of the weighted-average shares outstanding and calculation of basic and diluted earnings per share:
Fiscal Year Ended
July 2,
2011
July 3,
2010
June 27,
2009Net income $ 880,800 $ 734,940 $ 623,369 Total weighted-average basic shares 294,877 311,413 323,714 Dilutive securities:
Employee benefit and share award plans 1,792 1,318 293 Stock option programs 4,889 3,117 1,613
Total weighted-average diluted shares 301,558 315,848 325,620 Net income per share:
Basic $ 2.99 $ 2.36 $ 1.93 Diluted $ 2.92 $ 2.33 $ 1.91
At July 2, 2011, options to purchase 55 shares of common stock were outstanding but not included in the computation of diluted earnings per share, as
these options' exercise prices, ranging from $59.97 to $60.28, were greater than the average market price of the common shares.
At July 3, 2010, options to purchase 3,710 shares of common stock were outstanding but not included in the computation of diluted earnings per
share, as these options' exercise prices, ranging from $41.93 to $51.56, were greater than the average market price of the common shares.
At June 27, 2009, options to purchase 24,004 shares of common stock were outstanding but not included in the computation of diluted earnings per
share, as these options' exercise prices, ranging from $24.33 to $51.56, were greater than the average market price of the common shares.
14. PURCHASE OF CORPORATE HEADQUARTERS BUILDING
On November 26, 2008, Coach purchased its corporate headquarters building at 516 West 34th Street in New York City for $126,300. As part of the
purchase agreement, Coach paid $103,300 of cash and assumed $23,000 of the outstanding mortgage held by the sellers. The mortgage bears interest at
4.68% per annum and interest payments are made monthly. Principal payments began in July 2009 with the final payment of $21,555 due in June 2013.
15. STOCK REPURCHASE PROGRAM
Purchases of Coach's common stock are made from time to time, subject to market conditions and at prevailing market prices, through open market
purchases. Repurchased shares of common stock become authorized but unissued shares and may be issued in the future for general corporate and other
purposes. The Company may terminate or limit the stock repurchase program at any time.
During fiscal 2011, fiscal 2010 and fiscal 2009, the Company repurchased and retired 20,404, 30,686 and 20,159 shares of common stock at an
average cost of $53.81, $37.48 and $22.51 per share, respectively. As of July 2, 2011, Coach had $961,627 remaining in the stock repurchase program.
66

TABLE OF CONTENTS
COACH, INC.
Notes to Consolidated Financial Statements
(dollars and shares in thousands, except per share data)
16. CHANGE IN ACCOUNTING PRINCIPLE
Coach adopted the FASB's guidance for accounting for uncertainty in income taxes, codified within ASC 740 "Income Taxes," on July 1, 2007, the
first day of fiscal 2008. At adoption, Coach elected to classify interest and penalties related to uncertain tax positions as a component of interest expense
included within Interest income, net. On July 4, 2010, the Company changed its method of accounting to include such amounts as a component of the
provision for income taxes. The Company believes this change is preferable because: it will improve Coach's comparability with its industry peers; it is
more consistent with the way in which the Company manages the settlement of uncertain tax positions as one overall amount inclusive of interest and
penalties; and it will provide more meaningful information to investors by including only interest expense related to revolving credit facilities and long-
term debt financing activities within Interest income, net.
The change in accounting method for presentation of interest and penalties for uncertain tax positions was completed in accordance with ASC 250,
"Accounting Changes and Error Corrections." Accordingly, the change in accounting principle has been applied retrospectively by adjusting the financial
statement amounts for the prior periods presented. The change to current or historical periods presented herein due to the change in accounting principle
was limited to income statement classification, with no effect on net income.
The following tables detail the retrospective application impact on previously reported amounts:
For the Year Ended July 3, 2010 As Previously Reported Effect of Accounting Principle Change AdjustedInterest income, net $ 1,757 $ 6,204 $ 7,961 Provision for income taxes 416,988 6,204 423,192
For the Year Ended June 27, 2009 Interest income, net $ 5,168 $ 5,611 $ 10,779 Provision for income taxes 353,712 5,611 359,323
The following table shows the impact of the accounting principle change on reported balances for the year ended July 2, 2011:
For the Year Ended July 2,2011
As Computed Under PriorMethod
Effect of Accounting PrincipleChange
As Reported Under CurrentMethod
Interest income, net $ 4,226 (3,195) $ 1,031 Provision for income
taxes 423,614 (3,195) 420,419
67
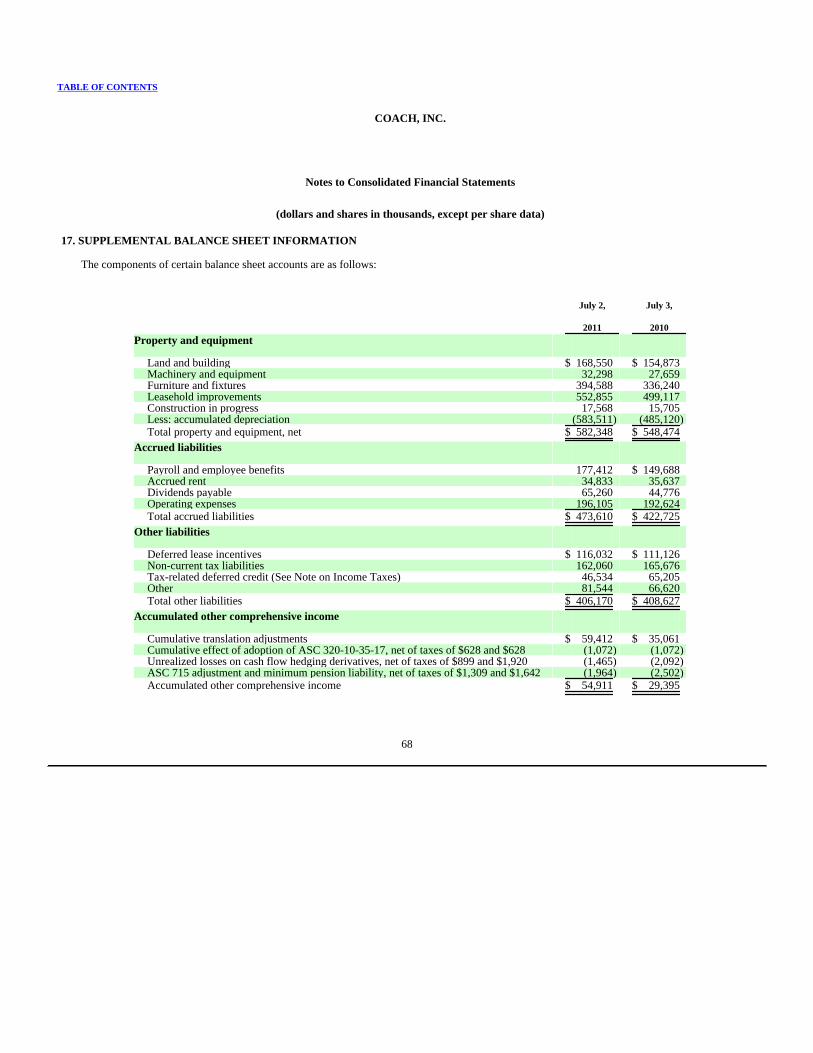
TABLE OF CONTENTS
COACH, INC.
Notes to Consolidated Financial Statements
(dollars and shares in thousands, except per share data)
17. SUPPLEMENTAL BALANCE SHEET INFORMATION
The components of certain balance sheet accounts are as follows:
July 2,
2011
July 3,
2010Property and equipment
Land and building $ 168,550 $ 154,873 Machinery and equipment 32,298 27,659 Furniture and fixtures 394,588 336,240 Leasehold improvements 552,855 499,117 Construction in progress 17,568 15,705 Less: accumulated depreciation (583,511) (485,120) Total property and equipment, net $ 582,348 $ 548,474
Accrued liabilities
Payroll and employee benefits 177,412 $ 149,688 Accrued rent 34,833 35,637 Dividends payable 65,260 44,776 Operating expenses 196,105 192,624 Total accrued liabilities $ 473,610 $ 422,725
Other liabilities
Deferred lease incentives $ 116,032 $ 111,126 Non-current tax liabilities 162,060 165,676 Tax-related deferred credit (See Note on Income Taxes) 46,534 65,205 Other 81,544 66,620 Total other liabilities $ 406,170 $ 408,627
Accumulated other comprehensive income
Cumulative translation adjustments $ 59,412 $ 35,061 Cumulative effect of adoption of ASC 320-10-35-17, net of taxes of $628 and $628 (1,072) (1,072) Unrealized losses on cash flow hedging derivatives, net of taxes of $899 and $1,920 (1,465) (2,092) ASC 715 adjustment and minimum pension liability, net of taxes of $1,309 and $1,642 (1,964) (2,502) Accumulated other comprehensive income $ 54,911 $ 29,395
68

TABLE OF CONTENTS
COACH, INC.
Notes to Consolidated Financial Statements
(dollars and shares in thousands, except per share data)
18. ACQUISITIONS
On September 1, 2008, Coach acquired 100% of its domestic retail businesses in Hong Kong and Macau and on April 1, 2009, acquired 100% of its
domestic retail business in mainland China from the former distributor, the ImagineX group. The results of the acquired businesses have been included in
the consolidated financial statements since September 1, 2008 and April 1, 2009, respectively, within the Direct-to-Consumer segment. These acquisitions
provide the Company with greater control over the brand in Hong Kong, Macau and mainland China, enabling Coach to raise brand awareness and
aggressively grow market share with the Chinese consumer.
The aggregate purchase price of the Hong Kong, Macau and mainland China businesses was $25,600, of which $24,400 was paid during fiscal 2009
and $1,200 was paid during fiscal 2010. The following table summarizes the fair values of the assets acquired at the dates of acquisition:
Assets Acquired Fair Value of Hong Kong
and Macau(1)
Fair Value of Mainland China(2) Total
Current assets $ 5,099 $ 4,868 $ 9,967 Fixed assets 3,555 3,525 7,080 Other assets 2,299 — 2,299 Goodwill 3,554 2,700 6,254 Total assets acquired $ 14,507 $ 11,093 $ 25,600
(1) Fair value as of the acquisition date of September 1, 2008
(2) Fair value as of the acquisition date of April 1, 2009
Prior to these acquisitions, the ImagineX group operated eight retail and department store locations in Hong Kong, two retail locations in Macau, and
15 retail locations in mainland China. The strength of the going concern and the established locations supported a premium above the fair value of the
individual assets acquired. Unaudited pro forma information related to these acquisitions is not included as the impact of these transactions is not material
to the consolidated results of the Company.
*************************************************************************************
69
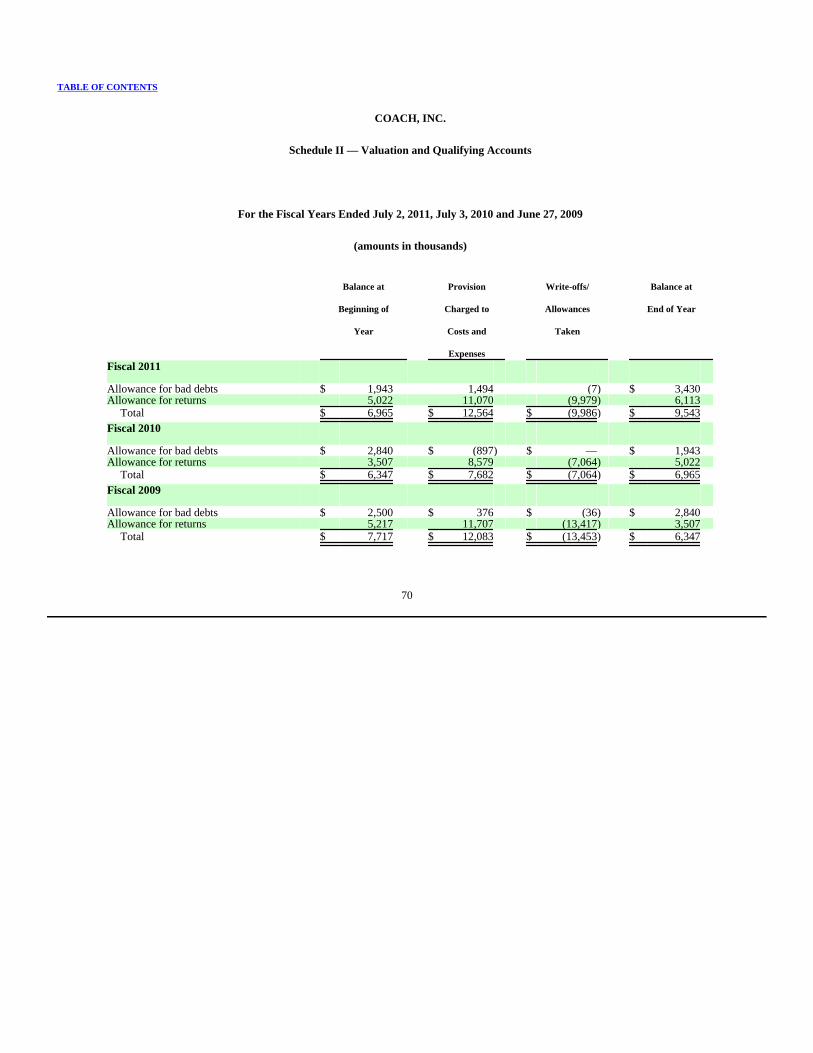
TABLE OF CONTENTS
COACH, INC.
Schedule II — Valuation and Qualifying Accounts
For the Fiscal Years Ended July 2, 2011, July 3, 2010 and June 27, 2009
(amounts in thousands)
Balance at
Beginning of
Year
Provision
Charged to
Costs and
Expenses
Write-offs/
Allowances
Taken
Balance at
End of Year
Fiscal 2011
Allowance for bad debts $ 1,943 1,494 (7) $ 3,430 Allowance for returns 5,022 11,070 (9,979) 6,113
Total $ 6,965 $ 12,564 $ (9,986) $ 9,543 Fiscal 2010
Allowance for bad debts $ 2,840 $ (897) $ — $ 1,943 Allowance for returns 3,507 8,579 (7,064) 5,022
Total $ 6,347 $ 7,682 $ (7,064) $ 6,965 Fiscal 2009
Allowance for bad debts $ 2,500 $ 376 $ (36) $ 2,840 Allowance for returns 5,217 11,707 (13,417) 3,507
Total $ 7,717 $ 12,083 $ (13,453) $ 6,347
70

TABLE OF CONTENTS
COACH, INC.
Quarterly Financial Data
(dollars and shares in thousands, except per share data)
(unaudited)
First
Quarter
Second
Quarter
Third
Quarter
Fourth
Quarter
Fiscal 2011(1)
Net sales $ 911,669 $ 1,264,457 $ 950,706 $ 1,031,675 Gross profit 676,171 915,176 691,655 740,539 Net income 188,876 303,428 186,015 202,481 Net income per common share:
Basic 0.64 1.02 0.63 0.70 Diluted 0.63 1.00 0.62 0.68
Fiscal 2010(1)
Net sales $ 761,437 $ 1,065,005 $ 830,669 $ 950,525 Gross profit 550,178 770,939 615,575 696,999 Net income 140,827 240,950 157,636 195,527 Net income per common share:
Basic 0.44 0.76 0.51 0.65 Diluted 0.44 0.75 0.50 0.64
Fiscal 2009(1)(2)
Net sales $ 752,529 $ 960,256 $ 739,939 $ 777,744 Gross profit 558,193 692,036 525,063 547,318 Net income 145,811 216,906 114,859 145,793 Net income per common share:
Basic 0.44 0.67 0.36 0.46 Diluted 0.44 0.67 0.36 0.45
(1) The sum of the quarterly earnings per share may not equal the full-year amount, as the computations of the weighted-average number of common basic
and diluted shares outstanding for each quarter and the full year are performed independently.
(2) The reported results for the third quarter of fiscal 2009 include a net charge of $8,286, or $0.03 per share which affects the comparability of our
reported results. Excluding this net charge, net income and diluted earnings per share were $123,145 and $0.38 per share, respectively. The $8,286 net
charge represents cost savings initiatives. The reported results for the fourth quarter of fiscal 2009 include a net benefit of $9,527, or $0.03 per share.
Excluding this net benefit, net income and diluted earnings per share were $136,266 and $0.43 per share, respectively. The $9,527 net benefit
represents a favorable settlement of a multi-year tax return examination and increased interest income reduced by a charitable contribution to the
Coach Foundation. See Fiscal 2011, Fiscal 2009 and Fiscal 2008 Items Affecting Comparability of Our Financial Results within Item 6.
71

TABLE OF CONTENTS
COACH, INC.
EXHIBITS TO FORM 10-K
(a) Exhibit Table (numbered in accordance with Item 601 of Regulation S-K)
Exhibit
No.
Description
3.1 Amended and Restated Bylaws of Coach, Inc., dated February 7, 2008, which is incorporated herein by reference fromExhibit 3.1 to Coach's Current Report on Form 8-K filed on February 13, 2008
3.2 Articles Supplementary of Coach, Inc., dated May 3, 2001, which is incorporated herein by reference from Exhibit 3.2 toCoach's Current Report on Form 8-K filed on May 9, 2001
3.3 Articles of Amendment of Coach, Inc., dated May 3, 2001, which is incorporated herein by reference from Exhibit 3.3 toCoach's Current Report on Form 8-K filed on May 9, 2001
3.4 Articles of Amendment of Coach, Inc., dated May 3, 2002, which is incorporated by reference from Exhibit 3.4 to Coach'sAnnual Report on Form 10-K for the fiscal year ended June 29, 2002
3.5 Articles of Amendment of Coach, Inc., dated February 1, 2005, which is incorporated by reference from Exhibit 99.1 toCoach's Current Report on Form 8-K filed on February 2, 2005
4.1 Specimen Certificate for Common Stock of Coach, which is incorporated herein by reference from Exhibit 4.1 to Coach'sRegistration Statement on Form S-1 (Registration No. 333-39502)
10.1 Revolving Credit Agreement, dated as of July 26, 2007, by and between Coach, certain lenders and Bank of America, N.A.which is incorporated by reference from Exhibit 10 to Coach's Quarterly Report on Form 10-Q for the period ended April 2,2011
10.2 Coach, Inc. 2000 Stock Incentive Plan, which is incorporated by reference from Exhibit 10.10 to Coach's Annual Report onForm 10-K for the fiscal year ended June 28, 2003
10.3 Coach, Inc. Performance-Based Annual Incentive Plan, which is incorporated by reference from Appendix A to theRegistrant's Definitive Proxy Statement for the 2005 Annual Meeting of Stockholders, filed on September 28, 2005
10.4 Coach, Inc. 2000 Non-Employee Director Stock Plan, which is incorporated by reference from Exhibit 10.13 to Coach'sAnnual Report on Form 10-K for the fiscal year ended June 28, 2003
10.5 Coach, Inc. Non-Qualified Deferred Compensation Plan for Outside Directors, which is incorporated by reference fromExhibit 10.14 to Coach's Annual Report on Form 10-K for the fiscal year ended June 28, 2003
10.6 Coach, Inc. 2001 Employee Stock Purchase Plan, which is incorporated by reference from Exhibit 10.15 to Coach's AnnualReport on Form 10-K for the fiscal year ended June 29, 2002
10.7 Coach, Inc. 2004 Stock Incentive Plan, which is incorporated by reference from Appendix A to the Registrant's DefinitiveProxy Statement for the 2004 Annual Meeting of Stockholders, filed on September 29, 2004
10.8 Employment Agreement dated June 1, 2003 between Coach and Lew Frankfort, which is incorporated by reference fromExhibit 10.20 to Coach's Annual Report on Form 10-K for the fiscal year ended June 28, 2003
10.9 Employment Agreement dated June 1, 2003 between Coach and Reed Krakoff, which is incorporated by reference fromExhibit 10.21 to Coach's Annual Report on Form 10-K for the fiscal year ended June 28, 2003
10.10 Branding Agreement dated August 5, 2010 between Coach and Reed Krakoff, which is incorporated by reference fromExhibit 10.10 to Coach's Annual Report on Form 10-K for the fiscal year ended July 3, 2010
72
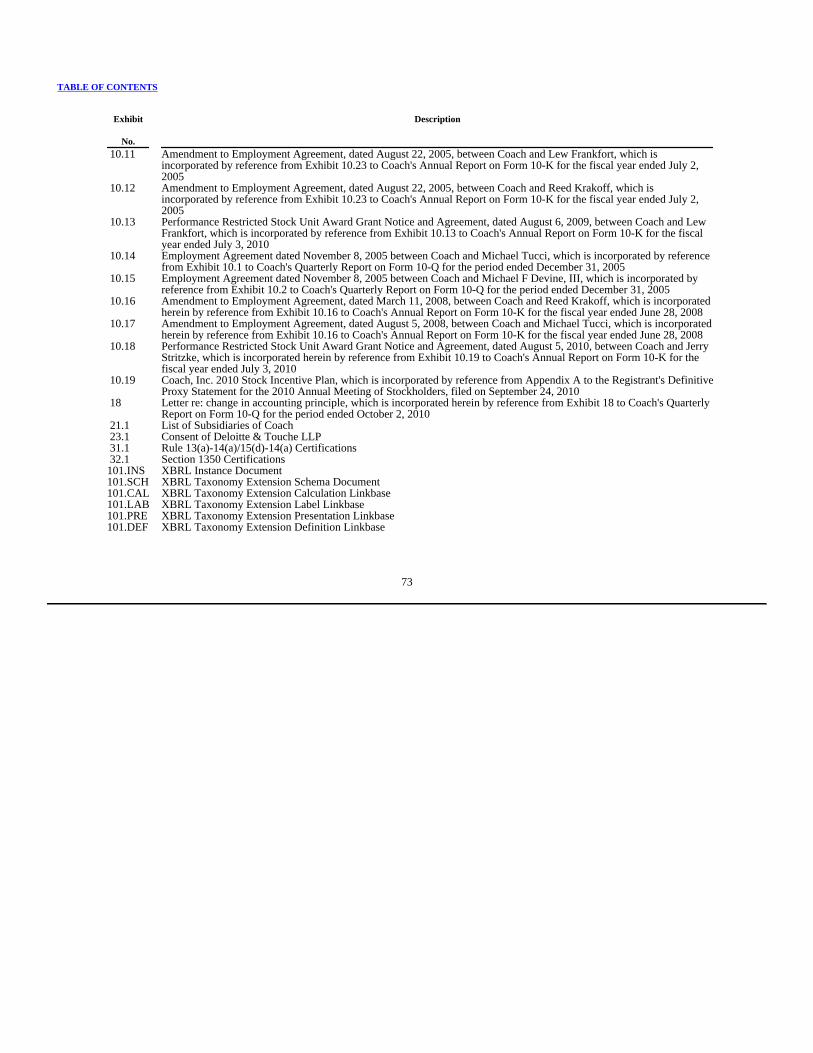
TABLE OF CONTENTS
Exhibit
No.
Description
10.11 Amendment to Employment Agreement, dated August 22, 2005, between Coach and Lew Frankfort, which isincorporated by reference from Exhibit 10.23 to Coach's Annual Report on Form 10-K for the fiscal year ended July 2,2005
10.12 Amendment to Employment Agreement, dated August 22, 2005, between Coach and Reed Krakoff, which isincorporated by reference from Exhibit 10.23 to Coach's Annual Report on Form 10-K for the fiscal year ended July 2,2005
10.13 Performance Restricted Stock Unit Award Grant Notice and Agreement, dated August 6, 2009, between Coach and LewFrankfort, which is incorporated by reference from Exhibit 10.13 to Coach's Annual Report on Form 10-K for the fiscalyear ended July 3, 2010
10.14 Employment Agreement dated November 8, 2005 between Coach and Michael Tucci, which is incorporated by referencefrom Exhibit 10.1 to Coach's Quarterly Report on Form 10-Q for the period ended December 31, 2005
10.15 Employment Agreement dated November 8, 2005 between Coach and Michael F Devine, III, which is incorporated byreference from Exhibit 10.2 to Coach's Quarterly Report on Form 10-Q for the period ended December 31, 2005
10.16 Amendment to Employment Agreement, dated March 11, 2008, between Coach and Reed Krakoff, which is incorporatedherein by reference from Exhibit 10.16 to Coach's Annual Report on Form 10-K for the fiscal year ended June 28, 2008
10.17 Amendment to Employment Agreement, dated August 5, 2008, between Coach and Michael Tucci, which is incorporatedherein by reference from Exhibit 10.16 to Coach's Annual Report on Form 10-K for the fiscal year ended June 28, 2008
10.18 Performance Restricted Stock Unit Award Grant Notice and Agreement, dated August 5, 2010, between Coach and JerryStritzke, which is incorporated herein by reference from Exhibit 10.19 to Coach's Annual Report on Form 10-K for thefiscal year ended July 3, 2010
10.19 Coach, Inc. 2010 Stock Incentive Plan, which is incorporated by reference from Appendix A to the Registrant's DefinitiveProxy Statement for the 2010 Annual Meeting of Stockholders, filed on September 24, 2010
18 Letter re: change in accounting principle, which is incorporated herein by reference from Exhibit 18 to Coach's QuarterlyReport on Form 10-Q for the period ended October 2, 2010
21.1 List of Subsidiaries of Coach 23.1 Consent of Deloitte & Touche LLP 31.1 Rule 13(a)-14(a)/15(d)-14(a) Certifications 32.1 Section 1350 Certifications101.INS XBRL Instance Document101.SCH XBRL Taxonomy Extension Schema Document101.CAL XBRL Taxonomy Extension Calculation Linkbase101.LAB XBRL Taxonomy Extension Label Linkbase101.PRE XBRL Taxonomy Extension Presentation Linkbase101.DEF XBRL Taxonomy Extension Definition Linkbase
73

Exhibit 21.1
LIST OF SUBSIDIARIES OF COACH, INC.
1. Coach, Inc. (Maryland)
2. Coach Services, Inc. (Maryland)
3. 504-514 West 34th Street Corp. (Maryland)
4. Coach Stores Puerto Rico, Inc. (Delaware)
5. Coach Japan Investments, LLC (Delaware)
6. 516 West 34th Street LLC (Delaware)
7. Reed Krakoff LLC (Delaware)
8. Coach Stores Canada, Inc. (Canada)
9. Coach International Holdings, Inc. (Cayman Islands)
10. Coach Consulting Dongguan Co. Ltd. (China)
11. Coach Shanghai Limited (China)
12. Coach Management (Shanghai) Co., Ltd. (China)
13. Coach International Limited (Hong Kong)
14. Coach Hong Kong Limited (Hong Kong)
15. Coach Manufacturing Limited (Hong Kong)
16. Coach Italy Services S.r.l. (Italy)
17. Coach Japan LLC (Japan)
18. Coach Korea Limited (Korea)
19. Coach Leatherware India Private Limited (India)
20. Coach France S.A.S. (France)
21. Coach Stores Limited (UK)
22. Coach Spain, S.L. (Spain)
23. Coach (Gibraltar) Limited (Gibraltar)
24. Coach International Holdings, Sàrl (Luxembourg)
25. Coach, Inc. Luxembourg Branch (Luxembourg)
26. Coach Netherlands B.V. (Netherlands)
27. Coach Stores, Unipessoal LDA (Portugal)
28. Coach Singapore Pte. Ltd. (Singapore)
29. Coach Malaysia SDN. BHD. (Malaysia)
30. Coach Vietnam Company Limited (Vietnam)

EXHIBIT 23.1
CONSENT OF INDEPENDENT REGISTERED PUBLIC ACCOUNTING FIRM
We consent to the incorporation by reference in Registration Statement Nos. 333-172699, 333-131750,333-51706 and 333-82102 on Form S-8 and
333-162454 and 333-162502 on Form S-3 of our reports dated August 19, 2011, relating to the consolidated financial statements and consolidated
financial statement schedule of Coach, Inc. and subsidiaries (the "Company") (which report expresses an unqualified opinion and includes an explanatory
paragraph regarding the Company's change in method of accounting for presentation of interest and penalties for uncertain tax positions) and the
effectiveness of the Company's internal control over financial reporting, appearing in this Annual Report on Form 10-K of the Company for the year ended
July 2, 2011.
/s/ Deloitte & Touche LLP
New York, New York
August 19, 2011

EXHIBIT 31.1
I, Lew Frankfort, certify that:
1. I have reviewed this Annual Report on Form 10-K of Coach, Inc.;
2. Based on my knowledge, this report does not contain any untrue statement of a material fact or omit to state a material fact necessary to make the
statements made, in light of the circumstances under which such statements were made, not misleading with respect to the period covered by this
report;
3. Based on my knowledge, the financial statements, and other financial information included in this report, fairly present in all material respects the
financial condition, results of operations and cash flows of the registrant as of, and for, the periods presented in this report;
4. The registrant's other certifying officer and I are responsible for establishing and maintaining disclosure controls and procedures (as defined in
Exchange Act Rules 13a-15(e) and 15d-15(e)) and internal control over financial reporting (as defined in Exchange Act Rules 13a-15(f) and 15d-15(f))
for the registrant and have:
(a) Designed such disclosure controls and procedures, or caused such disclosure controls and procedures to be designed under our supervision, to
ensure that material information relating to the registrant, including its consolidated subsidiaries, is made known to us by others within those entities,
particularly during the period in which this report is being prepared;
(b) Designed such internal control over financial reporting, or caused such internal control over financial reporting to be designed under our
supervision, to provide reasonable assurance regarding the reliability of financial reporting and the preparation of financial statements for external
purposes in accordance with generally accepted accounting principles;
(c) Evaluated the effectiveness of the registrant's disclosure controls and procedures and presented in this report our conclusions about the
effectiveness of the disclosure controls and procedures, as of the end of the period covered by this report based on such evaluation; and
(d) Disclosed in this report any change in the registrant's internal control over financial reporting that occurred during the registrant's most recent
fiscal quarter (the registrant's fourth fiscal quarter in the case of an annual report) that has materially affected, or is reasonably likely to materially
affect, the registrant's internal control over financial reporting; and
5. The registrant's other certifying officer and I have disclosed, based on our most recent evaluation of internal control over financial reporting, to the
registrant's auditors and the audit committee of the registrant's board of directors (or persons performing the equivalent functions):
(a) All significant deficiencies and material weaknesses in the design or operation of internal control over financial reporting which are
reasonably likely to adversely affect the registrant's ability to record, process, summarize and report financial information; and
(b) Any fraud, whether or not material, that involves management or other employees who have a significant role in the registrant's internal
control over financial reporting.
Date: August 19, 2011
By: /s/ Lew Frankfort
Name: Lew Frankfort
Title: Chairman and Chief Executive Officer
I, Michael F. Devine III, certify that:
1. I have reviewed this Annual Report on Form 10-K of Coach, Inc.;
2. Based on my knowledge, this report does not contain any untrue statement of a material fact or omit to state a material fact necessary to make the
statements made, in light of the circumstances under which such statements were made, not misleading with respect to the period covered by this
report;
3. Based on my knowledge, the financial statements, and other financial information included in this report, fairly present in all material respects the
financial condition, results of operations and cash flows of the registrant as of, and for, the periods presented in this report;
4. The registrant's other certifying officer and I are responsible for establishing and maintaining disclosure controls and procedures (as defined in
Exchange Act Rules 13a-15(e) and 15d-15(e)) and internal control over financial reporting (as defined in Exchange Act Rules 13a-15(f) and 15d-15(f))
for the registrant and have:
(a) Designed such disclosure controls and procedures, or caused such disclosure controls and procedures to be designed under our supervision, to
ensure that material information relating to the registrant, including its consolidated subsidiaries, is made known to us by others within those entities,
particularly during the period in which this report is being prepared;
(b) Designed such internal control over financial reporting, or caused such internal control over financial reporting to be designed under our
supervision, to provide reasonable assurance regarding the reliability of financial reporting and the preparation of financial statements for external
purposes in accordance with generally accepted accounting principles;
(c) Evaluated the effectiveness of the registrant's disclosure controls and procedures and presented in this report our conclusions about the
effectiveness of the disclosure controls and procedures, as of the end of the period covered by this report based on such evaluation; and
(d) Disclosed in this report any change in the registrant's internal control over financial reporting that occurred during the registrant's most recent
fiscal quarter (the registrant's fourth fiscal quarter in the case of an annual report) that has materially affected, or is reasonably likely to materially
affect, the registrant's internal control over financial reporting; and
5. The registrant's other certifying officer and I have disclosed, based on our most recent evaluation of internal control over financial reporting, to the
registrant's auditors and the audit committee of the registrant's board of directors (or persons performing the equivalent functions):
(a) All significant deficiencies and material weaknesses in the design or operation of internal control over financial reporting which are
reasonably likely to adversely affect the registrant's ability to record, process, summarize and report financial information; and
(b) Any fraud, whether or not material, that involves management or other employees who have a significant role in the registrant's internal
control over financial reporting.
Date: August 19, 2011
By: /s/ Michael F. Devine, III
Name: Michael F. Devine, III
Title: Executive Vice President and Chief Financial Officer

EXHIBIT 32.1
Pursuant to 18 U.S.C. § 1350, as created by Section 906 of the Sarbanes-Oxley Act of 2002, the undersigned officer of Coach, Inc. (the "Company")
hereby certifies, to such officer's knowledge, that:
(i) the accompanying Annual Report on Form 10-K of the Company for the fiscal year ended July 2, 2011 (the "Report") fully complies with the
requirements of Section 13(a) or Section 15(d), as applicable, of the Securities Exchange Act of 1934, as amended; and
(ii) the information contained in the Report fairly presents, in all material respects, the financial condition and results of operations of the
Company.
Date: August 19, 2011
By: /s/ Lew Frankfort
Name: Lew Frankfort
Title: Chairman and Chief Executive Officer
Pursuant to 18 U.S.C. § 1350, as created by Section 906 of the Sarbanes-Oxley Act of 2002, the undersigned officer of Coach, Inc. (the "Company")
hereby certifies, to such officer's knowledge, that:
(i) the accompanying Annual Report on Form 10-K of the Company for the fiscal year ended July 2, 2011 (the "Report") fully complies with the
requirements of Section 13(a) or Section 15(d), as applicable, of the Securities Exchange Act of 1934, as amended; and
(ii) the information contained in the Report fairly presents, in all material respects, the financial condition and results of operations of the
Company.
Date: August 19, 2011
By: /s/ Michael F. Devine, III
Name: Michael F. Devine, III
Title: Executive Vice President and Chief Financial Officer