Embed Size (px)
Citation preview

516 West 34th Street, New York, New York 10001
CO
AC
H A
NN
UA
L R
EP
OR
T 2
00
5
ANNUAL REPORT 2005
59246_L01POBCv5.qxd 9/12/05 10:12 PM Page 1

2 F I N A N C I A L H I G H L I G H T S
3 C H A I R M A N ’ S L E T T E R
4 T H E C O A C H B R A N D
7 R O A D M A P F O R G R O W T H
8 I N C R E A S E D I S T R I B U T I O N
1 1 M A X I M I Z E P R O D U C T I V I T Y
1 3 P R O D U C T I N N O V AT I O N A N D R E L E V A N C E
1 4 C O A C H S E R V I C E
1 6 T H E C O A C H R E S U LT S
59246_L01PIFCv1 8/30/05 11:58 PM Page 1

“Our outstanding sales performance and growth is a direct result of the strength
of the Coach brand, which rests on three core brand equities:
product innovation, relevance, and excellent value.”
— Lew Frankfort, Chairman and CEO
59246L01PA_16v1.qxd 9/9/05 12:10 AM Page 17

59246L01PA_16v1.qxd 9/9/05 12:07 AM Page 1
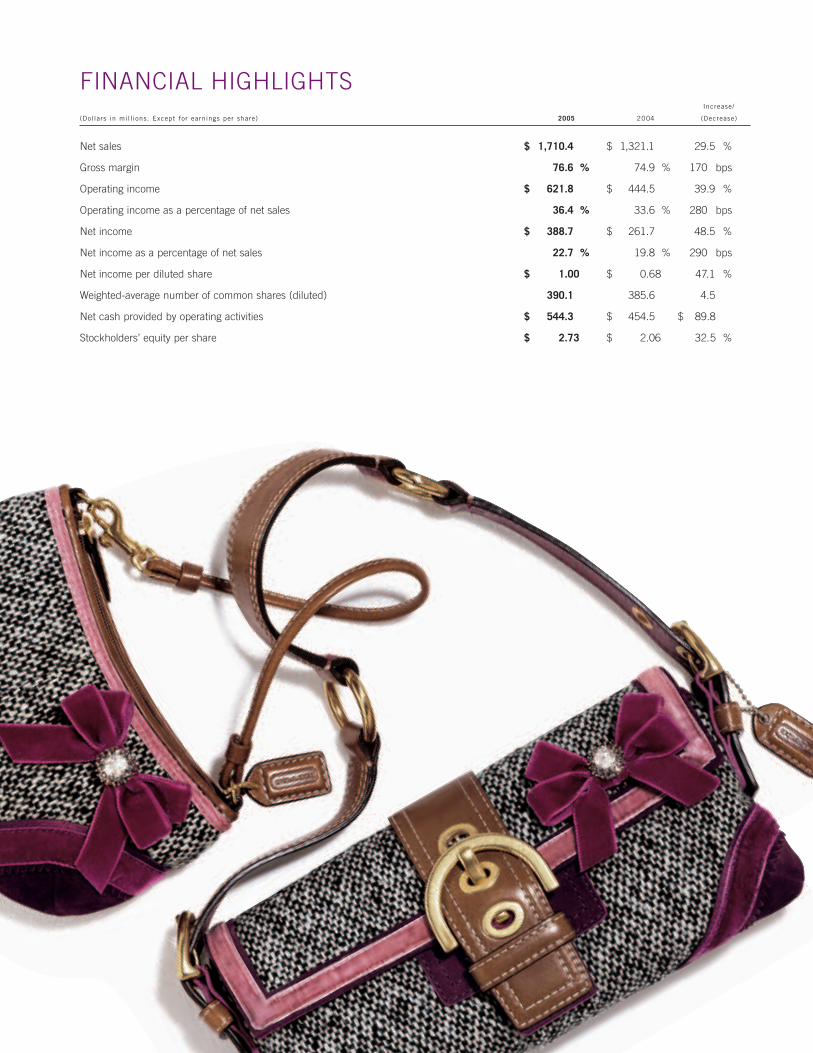
FINANCIAL HIGHLIGHTSIncrease/
(Dollars in mill ions. Except for earnings per share) 2005 2004 (Decrease)
Net sales $ 1,710.4 $ 1,321.1 29.5 %
Gross margin 76.6 % 74.9 % 170 bps
Operating income $ 621.8 $ 444.5 39.9 %
Operating income as a percentage of net sales 36.4 % 33.6 % 280 bps
Net income $ 388.7 $ 261.7 48.5 %
Net income as a percentage of net sales 22.7 % 19.8 % 290 bps
Net income per diluted share $ 1.00 $ 0.68 47.1 %
Weighted-average number of common shares (diluted) 390.1 385.6 4.5 %
Net cash provided by operating activities $ 544.3 $ 454.5 $ 89.8
Stockholders’ equity per share $ 2.73 $ 2.06 32.5 %
59246L01PA_16v1.qxd 9/9/05 12:08 AM Page 2

TO OUR SHAREHOLDERS
Fiscal 2005 was a stellar year for Coach, as we delivered outstanding results in all key financial metrics, throughout every channel of
our business. Our performance once again reflected the strength of our business model, the sustainability of our growth strategies,
our ability to execute efficiently and the endurance of the Coach brand.
Sales for fiscal 2005 rose 29% to $1.7 billion, with all channels of distribution posting increases from prior year levels. We were
particularly pleased with the strength of both our full priced retail and wholesale channels and our rapidly growing factory business in
North America. In addition, we were also happy with the continued strong market share gains we achieved in Japan, consolidating
our number two market share position. Once again, both new and existing stores generated excellent results driven by product
innovation, relevance and excellent value within our offering.
Gross margin for the year climbed to nearly 77%, driven by channel mix, product mix, and sourcing cost
initiatives. At the same time, selling, general, and administrative expenses as a percentage of net sales
declined to about 40%,due to operating leverage achieved in the U.S. and other non-Japan businesses. The
company’s operating margin rose to 36.4%, a remarkable 280 basis point expansion from fiscal 2004 levels.
Direct to consumer sales, which consist primarily of sales at Coach stores, rose 29% to $935 million in fiscal
2005. These results were generated by new and expanded stores as well as higher comparable store sales.
Indirect sales increased 30% to $775 million, driven by strong gains in all channels, including Coach Japan,
U.S. department stores, international wholesale, and business-to-business. In fiscal 2005, sales at Coach
Japan accounted for 22% of revenues.
Fiscal 2005 was another year of continued distribution and market share growth for Coach. In the U.S. we added 19 new full price
stores, including six new markets, and expanded seven others. Through Coach Japan we continued to develop our opportunity in
Japan, adding four net new locations and expanding 14 highly productive shop-in-shops, as well as one retail store. We also opened
four Japanese flagship stores with excellent results this year, in the cities of Sapporo, Sendai, Osaka and Nagoya.
Our formula for success has remained constant despite a changing environment. We have five unvarying elements that separate us
from the competition – our distinctive brand, our leadership position, our loyal consumer base, our multi-channel, international
distribution and our focus on product innovation and the consumer. The engine that drives these elements is our strong and seasoned
management team, fueled by fresh, exciting product and supported by an adaptive, dynamic, global sourcing and supply chain.
It is the passion, commitment and talent of our people that enable us to consistently excel. Our brand has never been stronger, nor
has our accessible luxury proposition ever been more vibrant. We believe that we are well positioned to capitalize on the multiple
opportunities ahead of us and have the vision, strategies and tactics in place to realize our long term growth plans. We’re confident
that our growth strategies will allow us to achieve continued momentum in the years ahead.
Lew Frankfort,
Chairman and CEO
3chairman's letter
59246L01PA_16v2.qxd 9/12/05 2:19 PM Page 3

THE COACH BRAND
Coach is a distinctive American brand. We deliver stylish, aspirational, extremely
well-made products that represent excellent value. Coach is the number one
accessible luxury accessories brand in the U.S., and in Japan, we’re the fastest
growing imported handbag and accessory brand. Each year, as our market
share grows, our leadership position becomes even stronger.
4 the coach brand
The hallmark of the Coach brand is our product. Each is crafted from exceptional
leathers and materials, proprietary hardware and the finest attention to detail. Today,
Coach products, which were originally known for their classic style and excellent
quality, are also renowned for their innovative design and fresh, modern appeal.
As we celebrate our five year anniversary as a public company, the strength of the
Coach brand endures, resting on three core brand equities – product innovation,
relevance and exceptional value.
59246L01PA_16v1.qxd 9/9/05 12:08 AM Page 4

59246L01PA_16v1.qxd 9/9/05 12:08 AM Page 5

59246L01PA_16v1.qxd 9/9/05 12:08 AM Page 6

ROADMAP FOR GROWTH
Coach is a growth story. Our distinctive brand proposition differentiates us from
our competition and provides a strong foundation for accelerated, sustainable
growth. The Coach business is based on our multi-channel international
distribution model, which maintains a critical balance. Our success does not
depend on the performance of a single channel.
We have a clearly articulated “roadmap” for growth, with the target of doubling
our sales over the next four to five years with a higher rate of profitability. To drive
this growth, we have a strong, knowledge-driven management team in place,
supported by a performance-based corporate culture. We have a nimble and
flexible supply chain able to adapt to change. And finally, we have advanced
technological systems designed to support our growth.
Our strategy for the future is focused on two “primary drivers”– increasing
distribution and maximizing productivity.
7roadmap for growth
59246L01PA_16v1.qxd 9/9/05 12:08 AM Page 7

INCREASE DISTRIBUTION
We are accelerating growth internationally through store openings in new and
existing markets, as well as expansions and relocations of our most productive stores.
8 increase distribution
Over the next four to five years, we plan to open over 100 new Coach stores in the
U.S. and Canada, bringing our North American full price store base to nearly 300.
We believe we can reach about 140 locations throughout Japan, including at least
15 flagship stores, double the current number of flagships.
During the next few years, we expect to achieve about 10% growth per year
through distribution, just as we have done in the past.
In addition, emerging markets such as Greater China, Korea and Taiwan also
provide attractive distribution growth opportunities for Coach.
59246L01PA_16v1.qxd 9/9/05 12:09 AM Page 8

59246L01PA_16v1.qxd 9/9/05 12:09 AM Page 9

59246L01PA_16v1.qxd 9/9/05 12:09 AM Page 10

MAXIMIZE PRODUCTIVITY
Maximizing productivity in our stores is the second strategy for growth. This
initiative is twofold.
First – our goal is to improve sales productivity by introducing new product
monthly, gaining a greater share of our consumer’s accessories wardrobe. We will
continue to design product for new usage occasions, such as evening and
weekend, meeting the demands of our consumer’s changing lifestyle.
One way we develop new product is by “building on our successes”– expanding
and evolving Coach Collections that are popular with our consumers. Hamptons
Weekend, Madison, and Duffles are examples of Coach Collections that we
update seasonally, adding new silhouettes, colors, and textures.
11maximize productivity
59246L01PA_16v1.qxd 9/9/05 12:09 AM Page 11

59246L01PA_16v1.qxd 9/9/05 12:09 AM Page 12

13product innovation and relevance
PRODUCT INNOVATIONAND RELEVANCEMany of our consumers tell us that they now come to Coach as a fashion
innovation resource, similar to how they seek out trends in technology. For
example, we now offer iPod®
covers in seasonal leathers, metallics and exotic
materials designed to coordinate with other Coach Collections.
Reed KrakoffPresident, Executive Creative Director
Second – we will continue to offer new product that is innovative and relevant to our
consumer’s lifestyle. At Coach, we understand the importance of our consumer’s point of
view. We conduct extensive consumer research each year by individually interviewing
about 15,000 consumers in order to understand and anticipate their needs. As a result we
introduce fresh, relevant product into our stores and department store locations, website
and direct mail programs monthly, matching the shopping style of our best consumers.
iPod®
is a registered trademark of Apple.
59246L01PA_16v1.qxd 9/9/05 12:09 AM Page 13

COACH SERVICE
Excellent customer service remains an element critical to the success of the
Coach brand. To further enhance our profitability we are strengthening customer
service in our stores to create a more satisfying shopping experience.
14 coach service
First – we have evolved our in-store marketing programs, making it easier for our
consumers to shop. An example is a program called “Coach By Special Request”,
which allows our consumers to order classic and special edition Coach product,
direct from our factory and shipped to their home.
Second–we are elevating the level of customer service in our stores in a number
of ways, including comprehensive training programs for our sales associates and
consumer appreciation programs.
At Coach, we want to be as well-known for excellent service as we are for
great product.
59246L01PA_16v1.qxd 9/9/05 12:10 AM Page 14

59246L01PA_16v1.qxd 9/9/05 12:10 AM Page 15

Keith MondaPresident, Chief Operating Officer
THE COACH RESULTS
1 7 S E L E C T E D F I N A N C I A L D AT A
1 8 M A N A G E M E N T ’ S D I S C U S S I O N A N D A N A LY S I S O F
F I N A N C I A L C O N D I T I O N A N D R E S U LT S O F O P E R AT I O N S
2 9 R E P O R T S O F I N D E P E N D E N T R E G I S T E R E D P U B L I C A C C O U N T I N G F I R M
3 1 C O N S O L I D AT E D B A L A N C E S H E E T S
3 2 C O N S O L I D AT E D S T AT E M E N T S O F I N C O M E
3 3 C O N S O L I D AT E D S T AT E M E N T O F S T O C K H O L D E R S ’ E Q U I T Y
3 4 C O N S O L I D AT E D S T AT E M E N T S O F C A S H F L O W S
3 5 N O T E S T O C O N S O L I D AT E D F I N A N C I A L S T AT E M E N T S
5 7 C O R P O R AT E I N F O R M AT I O N
5 8 S H A R E H O L D E R I N F O R M AT I O N
16 the coach results
59246L01PA_16v1.qxd 9/9/05 12:10 AM Page 16

Results
CO
AC
H, IN
C. A
R 2
00
5
17`
The selected historical financial data presented below as of and for each of the fiscal years in the five-year period ended July 2, 2005have been derived from Coach’s audited Consolidated Financial Statements. The financial data should be read in conjunction withManagement’s Discussion and Analysis of Financial Condition and Results of Operations, the Consolidated Financial Statements andNotes thereto and other financial data included elsewhere herein.
F ISCAL YEAR ENDED(1) JULY 2, 2005 JULY 3, 2004 JUNE 28, 2003 JUNE 29, 2002 JUNE 30, 2001ppppppppppppppppppppppppppppppppppppppppppppppppppppppp ppppppppppppppppppppppppppppppppppppppppppppppppppppppp ppppppppppppppppppppppppppppppppppppppppppppppppppppppp ppppppppppppppppppppppppppppppppppppppppppppppppppppppp ppppppppppppppppppppppppppppppppppppppppppppppppppppppp
CONSOLIDATED STATEMENTS OF I NCOME:
Net sales $ 1,710,423 $ 1,321,106 $ 953,226 $ 719,403 $ 600,491Cost of sales 399,652 331,024 275,797 236,041 218,507
ppppppppppppppppppppppppppppppppppppppppppppppppppppppp ppppppppppppppppppppppppppppppppppppppppppppppppppppppp ppppppppppppppppppppppppppppppppppppppppppppppppppppppp ppppppppppppppppppppppppppppppppppppppppppppppppppppppp ppppppppppppppppppppppppppppppppppppppppppppppppppppppp
Gross profit 1,310,771 990,082 677,429 483,362 381,984Selling, general and administrative expenses 688,961 545,617 433,667 346,354 275,727Reorganization costs(2) – – – 3,373 4,569
ppppppppppppppppppppppppppppppppppppppppppppppppppppppp ppppppppppppppppppppppppppppppppppppppppppppppppppppppp ppppppppppppppppppppppppppppppppppppppppppppppppppppppp ppppppppppppppppppppppppppppppppppppppppppppppppppppppp ppppppppppppppppppppppppppppppppppppppppppppppppppppppp
Operating income 621,810 444,465 243,762 133,635 101,688Interest income (expense), net 15,760 3,192 1,059 (299) (2,258)
ppppppppppppppppppppppppppppppppppppppppppppppppppppppp ppppppppppppppppppppppppppppppppppppppppppppppppppppppp ppppppppppppppppppppppppppppppppppppppppppppppppppppppp ppppppppppppppppppppppppppppppppppppppppppppppppppppppp ppppppppppppppppppppppppppppppppppppppppppppppppppppppp
Income before provision for income taxes and minority interest 637,570 447,657 244,821 133,336 99,430
Provision for income taxes 235,277 167,866 90,585 47,325 35,400Minority interest, net of tax 13,641 18,043 7,608 184 –
ppppppppppppppppppppppppppppppppppppppppppppppppppppppp ppppppppppppppppppppppppppppppppppppppppppppppppppppppp ppppppppppppppppppppppppppppppppppppppppppppppppppppppp ppppppppppppppppppppppppppppppppppppppppppppppppppppppp ppppppppppppppppppppppppppppppppppppppppppppppppppppppp
Net income $ 388,652 $ 261,748 $ 146,628 $ 85,827 $ 64,030pppppppppppppp pppppppppppppp pppppppppppppp pppppppppppppp pppppppppppppp
Net income per shareBasic $ 1.03 $ 0.70 $ 0.41 $ 0.24 $ 0.20
pppppppppppppp pppppppppppppp pppppppppppppp pppppppppppppp pppppppppppppp
Diluted $ 1.00 $ 0.68 $ 0.39 $ 0.24 $ 0.19pppppppppppppp pppppppppppppp pppppppppppppp pppppppppppppp pppppppppppppp
Shares used in computing net income per share:(3)
Basic 378,670 372,120 359,116 352,192 327,440pppppppppppppp pppppppppppppp pppppppppppppp pppppppppppppp pppppppppppppp
Diluted 390,191 385,558 371,684 363,808 337,248pppppppppppppp pppppppppppppp pppppppppppppp pppppppppppppp pppppppppppppp
CONSOLIDATED PERCENTAGE OF NET SALES DATA:
Gross margin 76.6% 74.9% 71.1% 67.2% 63.6%Selling, general and administrative expenses 40.3% 41.3% 45.5% 48.1% 45.9%Operating income 36.3% 33.6% 25.6% 18.6% 16.9%Net income 22.7% 19.8% 15.4% 11.9% 10.7%
CONSOLIDATED BALANCE SHEET DATA:
Working capital $ 443,580 $ 535,384 $ 297,488 $ 136,902 $ 53,991Total assets 1,347,132 1,044,425 629,109 448,402 262,506Inventory 184,419 161,913 143,807 136,404 105,162Revolving credit facility 12,292 1,699 26,471 34,169 7,700Long-term debt 3,270 3,420 3,535 3,615 3,690Stockholders’ equity $ 1,032,776 $ 782,286 $ 426,929 $ 260,356 $ 148,314
(1) Coach’s f iscal year ends on the Saturday closest to June 30. Fiscal years 2005, 2003, 2002 and 2001 were 52-week years, while f iscal year 2004 was a 53-week year.
(2) During f iscal 2001, Coach committed to and completed a reorganization plan involving the complete closure of its Medley, Florida, manufacturing operation. Theseactions, intended to reduce costs, resulted in the transfer of production to lower cost third-party manufacturers and the consolidation of all of its distribution functions at the Jacksonville, Florida, distribution center. During f iscal 2002, Coach committed to and completed a reorganization plan involving the complete closure of its Lares, Puerto Rico, manufacturing operation. These actions, also intended to reduce costs, resulted in the transfer of production to lower cost third-party manufacturers.
(3) The two-for-one stock splits in April 2005, October 2003 and July 2002 have been retroactively applied to all prior periods.
Selected Financial Data (DOLLARS AND SHARES IN THOUSANDS, E XCEPT PER SHARE DATA)
18
The following discussion of Coach’s f inancial condition and results of operations should be read together with Coach’s f inancialstatements and notes to those statements included elsewhere in this document.
EXECUTIVE OVERVIEW
Founded in 1941, Coach (the “Company”) is a designer and marketer of high-quality, modern American classic accessories. Coach’sprimary product offerings include handbags, accessories, business cases, outerwear and related accessories and weekend andtravel accessories.
Coach generates revenue by selling its products directly to consumers, indirectly through wholesale customers and Coach Japan,and by licensing its brand name to select manufacturers. Direct-to-consumer sales consist of sales of Coach products through its193 Company-operated North American retail stores, its 82 Company-operated North American factory stores, its online store and its catalogs. Indirect sales consist of sales of Coach products to approximately 1,000 department store locations in the UnitedStates, through 94 international department stores, freestanding retail locations and specialty retailers in 19 countries and through103 department store shop-in-shops and retail and factory store locations operated by Coach Japan, Inc. Coach generates addi-tional wholesale sales through business-to-business programs, in which companies purchase Coach products to use as gifts orincentive rewards. Licensing revenues consist of royalties paid to Coach under licensing arrangements with select partners for thesale of Coach branded watches, footwear, eyewear and off ice furniture. Net sales were $1,710.4 million, $1,321.1 million and$953.2 million in f iscal 2005, 2004 and 2003, respectively, representing a 29.5% increase in f iscal 2005 as compared to f iscal 2004 and a 38.6% increase in f iscal 2004 as compared to f iscal 2003. These net sales increases were driven by growth across all distribution channels.
Coach’s cost of sales consists of the costs associated with the sourcing of its products. Coach’s gross profit is dependent upon a variety of factors, including changes in the relative sales mix among distribution channels, changes in the mix of products sold,foreign currency exchange rates and f luctuations in material costs. These factors, among others, may cause gross profit to f luctuatefrom quarter to quarter. Gross profit increased to $1,310.8 million in f iscal 2005 from $990.1million in f iscal 2004 and $677.4 million infiscal 2003. Gross margin increased to 76.6% in f iscal 2005 as compared to 74.9% in f iscal 2004 and 71.1% in f iscal 2003, represent-ing an increase of 170 basis points in f iscal 2005 as compared to f iscal 2004 and 380 basis points in f iscal 2004 as compared to f iscal 2003. These increases were primarily driven by the factors discussed above.
Selling, general and administrative expenses comprise four categories: selling; advertising, marketing and design; distribution andcustomer service; and administration and information services. Selling expenses include store employee compensation, storeoccupancy costs, store supply costs, wholesale account administration compensation and all Coach Japan operating expenses.These expenses are affected by the number of Coach and Coach Japan operated stores open during any f iscal period and therelated proportion of retail and wholesale sales. Advertising, marketing and design expenses include employee compensation,media space and production, advertising agency fees, new product design costs, public relations, market research expenses andmail order costs. Distribution and customer services expenses include warehousing, order fulf illment, shipping and handling, cus-tomer service and bag repair costs. Administration and information services expenses include compensation costs for the executive,f inance, human resources, legal and information systems departments, as well as consulting and software expenses. Selling, general and administrative expenses increase as Coach and Coach Japan operate more stores, although an increase in the numberof stores generally results in the fixed portion of selling, general and administrative expenses being spread over a larger sales base.
Operating income was $621.8 million, $444.5 million and $243.8 million in f iscal 2005, 2004 and 2003, respectively. The 39.9%increase in f iscal 2005 from fiscal 2004 and 82.3% increase in f iscal 2004 from fiscal 2003 were both driven by the increases in netsales and gross profit discussed previously, partially offset by increases in selling, general and administrative expenses.
Net income was $388.7 million, $261.7 million and $146.6 million in f iscal 2005, 2004 and 2003, respectively. In all f iscal years, theincreases in net income were primarily attributable to the increases in operating income, discussed above.
Coach’s f iscal year ends on the Saturday closest to June 30. Fiscal 2005 and fiscal 2003 were each 52-week periods, whereasfiscal 2004 was a 53-week period. The f ifty-third week in f iscal 2004 contributed approximately $19.5 million of additional net sales.
Management’s Discussion and Analysis
of Financial Condition and Results of Operations

Results
CO
AC
H, IN
C. A
R 2
00
5
19`
ACQU ISITION OF COACH JA PAN, I NC.
On July1, 2005, Coach completed the purchase of Sumitomo’s 50% interest in Coach Japan, Inc. for $228.4 million, including transac-tion costs, plus undistributed profits and paid-in capital of $72.9 million. Coach Japan was a joint venture established between Coachand Sumitomo Corporation, to operate and expand the Coach business in Japan. Coach Japan is accounted for as a consolidatedsubsidiary. Coach recorded the 50% interest in the assets and liabilities of Coach Japan acquired through this acquisition at their fairvalues as follows: trade accounts receivable of $15.4 million, inventory of $43.1 million, property and equipment of $21.8 million, cus-tomer list of $0.3 million, goodwill of $225.3 million, other assets of $25.0 million, and liabilities of $30.7 million. The results of operationsfor Coach Japan, Inc. from July1, 2005 are included in our consolidated results of operations for the fiscal year ended July 2, 2005.
The following unaudited pro forma information assumes the Coach Japan, Inc. acquisition had occurred on July 4, 2004. The proforma information, as presented below, is not indicative of the results that would have been obtained had the transaction occurredJuly 4, 2004, nor is it indicative of our future results. The f inal purchase price allocation and the resulting effect on net income maydif fer signif icantly from the unaudited pro forma amounts included herein.
F ISCAL YEAR ENDED JULY 2, 2005 JULY 3, 2004ppppppppppppppppppppppppppppppppppppppppppppppppppppppp ppppppppppppppppppppppppppppppppppppppppppppppppppppppp
(DOLLARS IN MILL IONS, E XCEPT PER SHARE DATA) (UNAUDITED) (UNAUDITED)
Net revenue $ 1,710.4 $ 1,321.1Net income 402.3 279.8Net income per share – Basic 1.06 0.75Net income per share – Diluted 1.03 0.73
The following is a discussion of the results of operations for fiscal 2005 compared to fiscal 2004 and fiscal 2004 compared to fiscal 2003 as well as a discussion of the changes in f inancial condition during f iscal 2005.
R ESULTS OF OPERATIONS
Consolidated statements of income for f iscal 2005, 2004 and 2003 are as follows:
F ISCAL YEAR ENDED JULY 2, 2005 JULY 3, 2004(1) JUNE 28, 2003ppppppppppppppppppppppppppppppppppppppppppppppppppppppppppppppppppppppppppppppppppppppppppppppppppppppppppppppppppppppppp ppppppppppppppppppppppppppppppppppppppppppppppppppppppppppppppppppppppppppppppppppppppppppppppppppppppppppppppppppppppppp ppppppppppppppppppppppppppppppppppppppppppppppppppppppppppppppppppppppppppppppppppppppppppppppppppppppppppppppppppppppppp
(DOLLARS AND SHARES IN MILL IONS, E XCEPT PER SHARE DATA) $ % OF NE T SALES $ % OF NE T SALES $ % OF NE T SALES
ppppppppppppppppppppppppppppppppppppppppppppppppppppppp ppppppppppppppppppppppppppppppppppppppppppppppppppppppp ppppppppppppppppppppppppppppppppppppppppppppppppppppppp ppppppppppppppppppppppppppppppppppppppppppppppppppppppp ppppppppppppppppppppppppppppppppppppppppppppppppppppppp ppppppppppppppppppppppppppppppppppppppppppppppppppppppp
Net sales $ 1,704.1 99.6% $ 1,316.3 99.6% $ 949.4 99.6%Licensing revenue 6.3 0.4 4.8 0.4 3.8 0.4
ppppppppppppppppppppppppppppppppppppppppppppppppppppppp ppppppppppppppppppppppppppppppppppppppppppppppppppppppp ppppppppppppppppppppppppppppppppppppppppppppppppppppppp ppppppppppppppppppppppppppppppppppppppppppppppppppppppp ppppppppppppppppppppppppppppppppppppppppppppppppppppppp ppppppppppppppppppppppppppppppppppppppppppppppppppppppp
Total net sales 1,710.4 100.0 1,321.1 100.0 953.2 100.0Cost of sales 399.6 23.4 331.0 25.1 275.8 28.9
ppppppppppppppppppppppppppppppppppppppppppppppppppppppp ppppppppppppppppppppppppppppppppppppppppppppppppppppppp ppppppppppppppppppppppppppppppppppppppppppppppppppppppp ppppppppppppppppppppppppppppppppppppppppppppppppppppppp ppppppppppppppppppppppppppppppppppppppppppppppppppppppp ppppppppppppppppppppppppppppppppppppppppppppppppppppppp
Gross profit 1,310.8 76.6 990.1 74.9 677.4 71.1Selling, general and administrative expenses 689.0 40.3 545.6 41.3 433.7 45.5
ppppppppppppppppppppppppppppppppppppppppppppppppppppppp ppppppppppppppppppppppppppppppppppppppppppppppppppppppp ppppppppppppppppppppppppppppppppppppppppppppppppppppppp ppppppppppppppppppppppppppppppppppppppppppppppppppppppp ppppppppppppppppppppppppppppppppppppppppppppppppppppppp ppppppppppppppppppppppppppppppppppppppppppppppppppppppp
Operating income 621.8 36.3 444.5 33.6 243.7 25.6Interest income, net 15.8 0.9 3.2 0.2 1.1 0.1
ppppppppppppppppppppppppppppppppppppppppppppppppppppppp ppppppppppppppppppppppppppppppppppppppppppppppppppppppp ppppppppppppppppppppppppppppppppppppppppppppppppppppppp ppppppppppppppppppppppppppppppppppppppppppppppppppppppp ppppppppppppppppppppppppppppppppppppppppppppppppppppppp ppppppppppppppppppppppppppppppppppppppppppppppppppppppp
Income before provision for income taxes and minority interest 637.6 37.3 447.7 33.9 244.8 25.7
Provision for income taxes 235.3 13.8 168.0 12.7 90.6 9.5Minority interest, net of tax 13.6 0.8 18.0 1.4 7.6 0.8
ppppppppppppppppppppppppppppppppppppppppppppppppppppppp ppppppppppppppppppppppppppppppppppppppppppppppppppppppp ppppppppppppppppppppppppppppppppppppppppppppppppppppppp ppppppppppppppppppppppppppppppppppppppppppppppppppppppp ppppppppppppppppppppppppppppppppppppppppppppppppppppppp ppppppppppppppppppppppppppppppppppppppppppppppppppppppp
Net income $ 388.7 22.7% $ 261.7 19.8% $ 146.6 15.4%pppppppppppppp pppppppppppppp pppppppppppppp pppppppppppppp pppppppppppppp pppppppppppppp
Net income per share:Basic $ 1.03 $ 0.70 $ 0.41 Diluted $ 1.00 $ 0.68 $ 0.39
Weighted-average number of common shares: Basic 378.7 372.1 359.1Diluted 390.2 385.6 371.7
(1) 53-week f iscal year

M D A C O N T I N U E D
20
Net sales by business segment for f iscal 2005 compared to f iscal 2004 and fiscal 2003 are as follows:
NE T SALES RATE OF INCREASE PERCENTAGE OF TOTAL NE T SALES ppppppppppppppppppppppppppppppppppppppppppppppppppppppppppppppppppppppppppppppppppppppppppppppppppppppppppppppppppppppppppppppppppppppppppppppppppppppppppppppppppppppppppppppppppppppppp pppppppppppppppppppppppppppppppppppppppppppppppppppppppppppppppppppppppppppppppppppppppppppppppppppppppppppppppppppppppp ppppppppppppppppppppppppppppppppppppppppppppppppppppppppppppppppppppppppppppppppppppppppppppppppppppppppppppppppppppppppppppppppppppppppppppppppppppppppppppppppppppppppppppppppppppppppp
F ISCAL YEAR ENDED JULY 2, 2005 JULY 3, 2004(1) JUNE 28, 2003 (’05 VERSUS ’04) (’04 VERSUS ’03) JULY 2, 2005 JULY 3, 2004 JUNE 28, 2003ppppppppppppppppppppppppppppppppppppppppppppppppppppppp ppppppppppppppppppppppppppppppppppppppppppppppppppppppp ppppppppppppppppppppppppppppppppppppppppppppppppppppppp ppppppppppppppppppppppppppppppppppppppppppppppppppppppp ppppppppppppppppppppppppppppppppppppppppppppppppppppppp ppppppppppppppppppppppppppppppppppppppppppppppppppppppp ppppppppppppppppppppppppppppppppppppppppppppppppppppppp ppppppppppppppppppppppppppppppppppppppppppppppppppppppp
(DOLLARS IN MILL IONS)
Direct $ 935.5 $ 726.5 $ 559.5 28.8% 29.8% 54.7% 55.0% 58.7%
Indirect 774.9 594.6 393.7 30.3 51.0 45.3 45.0 41.3ppppppppppppppppppppppppppppppppppppppppppppppppppppppp ppppppppppppppppppppppppppppppppppppppppppppppppppppppp ppppppppppppppppppppppppppppppppppppppppppppppppppppppp ppppppppppppppppppppppppppppppppppppppppppppppppppppppp ppppppppppppppppppppppppppppppppppppppppppppppppppppppp ppppppppppppppppppppppppppppppppppppppppppppppppppppppp
Total net sales $ 1,710.4 $ 1,321.1 $ 953.2 29.5% 38.6% 100.0% 100.0% 100.0%pppppppppppppp pppppppppppppp pppppppppppppp pppppppppppppp pppppppppppppp pppppppppppppp
(1) 53-week f iscal year
FISCA L 2005 COMPAR ED TO FISCA L 2004
N E T S A L E S
Coach excludes new locations from the comparable store base for the f irst year of operation. Similarly, stores that are expanded bymore than 15% are also excluded from the comparable store base until the f irst anniversary of their reopening. Stores that areclosed for renovations are removed from the comparable store base. In f iscal 2005, 52 weeks of sales were reported and comparedto the equivalent 52-week period during f iscal 2004.
D I R E C T Net sales increased 28.8% to $935.5 million during f iscal 2005 from $726.5 million during f iscal 2004, driven by increasedcomparable store sales, new store sales and expanded store sales in our North American retail and factory stores divisions. Salesgrowth in comparable stores was 14.1% for retail stores and 23.9% for factory stores. Comparable store sales growth for the entireNorth American store chain was 18.2%, which accounted for $112.0 million of the net sales increase. Since the end of f iscal 2004,Coach has opened 19 retail stores and seven factory stores. Sales from these new stores, as well as the noncomparable portion ofsales from stores opened during f iscal 2004, accounted for $84.8 million of the net sales increase. Since the end of f iscal 2004,Coach also expanded seven retail stores and two factory stores. Sales from these expanded stores, as well as the noncomparableportion of sales from stores expanded during f iscal 2004, accounted for $11.0 million of the net sales increase. Sales growth in theInternet business accounted for the remaining sales increase. The net sales increase was offset by an additional week of sales during f iscal 2004, which represented approximately $11.6 million. Also, these increases were slightly offset by a decline in thedirect marketing channel and store closures. Since the end of f iscal 2004, Coach has closed one factory store.
I N D I R E C T Net sales increased 30.3% to $774.9 million in f iscal 2005 from $594.6 million during f iscal 2004. The increase was primarily driven by growth at Coach Japan, Inc. in which net sales increased $95.7 million over the comparable period of the prioryear. Since the end of f iscal 2004, we have opened 12 locations in Japan. Sales from these new stores, as well as the noncompara-ble portion of sales from other new stores, accounted for $40.3 million of the net sales increase. In addition, comparable store netsales gains accounted for an increase of $30.3 million over the prior year. Since the end of f iscal 2004, we have also expanded14 locations in Japan. Sales from these expanded stores, as well as the noncomparable portion of sales from other expandedstores, accounted for $20.2 million of the net sales increase. Finally, the impact of foreign currency exchange rates resulted in anincrease in reported net sales of $12.9 million. The net sales increase was slightly offset by $4.1 million of sales from Coach Japanduring the additional week of f iscal 2004. The net sales increase was further offset by Coach Japan store closures. Since the end of f iscal 2004, Coach Japan has closed eight locations.
The increase in indirect net sales was also driven by growth in the U.S. wholesale, international wholesale and business-to-business divisions, which contributed increased sales of $47.8 million, $19.0 million and $9.9 million, respectively, as compared tothe prior year. The remaining net sales increase is attributable to increases in other indirect channels. The net sales increase wasslightly offset by $3.8 million of sales from other indirect channels during the additional week of f iscal 2004.
G R O S S P R O F I T
Gross profit increased 32.4% to $1,310.8 million in f iscal 2005 from $990.1 million in f iscal 2004. Gross margin increased 170 basispoints to 76.6% in f iscal 2005 from 74.9% in f iscal 2004. This improvement was driven by: a shift in channel mix, as our higher grossmargin channels grew faster than the business as a whole, which contributed approximately 80 additional basis points; a shift in

Results
CO
AC
H, IN
C. A
R 2
00
5
21`
product mix, ref lecting increased penetration of higher margin mixed material product and accessories, which contributed approximately 60 additional basis points; and the continuing impact of sourcing cost initiatives, which contributed approximately30 additional basis points.
The following chart illustrates the gross margin performance we have experienced over the last 12 quarters:
F IRST SECOND F IRST THIRD FOURTH SECOND TOTALQUARTER QUARTER HALF QUARTER QUARTER HALF YEAR
ppppppppppppppppppppppppppppppppppppppppppppppppppppppp ppppppppppppppppppppppppppppppppppppppppppppppppppppppp ppppppppppppppppppppppppppppppppppppppppppppppppppppppp ppppppppppppppppppppppppppppppppppppppppppppppppppppppp ppppppppppppppppppppppppppppppppppppppppppppppppppppppp ppppppppppppppppppppppppppppppppppppppppppppppppppppppp ppppppppppppppppppppppppppppppppppppppppppppppppppppppp
Fiscal 2005 75.0% 75.8% 75.5% 78.1% 77.6% 77.8% 76.6%
Fiscal 2004 72.7% 74.2% 73.6% 75.9% 76.7% 76.3% 74.9%
Fiscal 2003 68.1% 70.3% 69.4% 72.5% 73.2% 72.9% 71.1%
S E L L I N G , G E N E R A L A N D A D M I N I S T R AT I V E E X P E N S E S
Selling, general and administrative expenses increased 26.3% to $689.0 million in f iscal 2005 from $545.6 million in f iscal 2004. Thedollar increase was caused primarily by increased store operating expenses attributable to new stores opened both domesticallyand in Japan and increased variable expenses to support increased net sales. As a percentage of net sales, selling, general and administrative expenses during f iscal 2005 were 40.3% compared to 41.3% during f iscal 2004. This improvement was due to leveraging our expense base on higher sales.
Selling expenses increased 28.8% to $497.3 million, or 29.1% of net sales, in f iscal 2005 from $386.2 million, or 29.2% of net sales,in f iscal 2004. The dollar increase in these expenses was primarily due to an increase in operating expenses associated withCoach Japan and operating expenses associated with North American stores that were opened during and after the end of f iscal 2004. The increase in Coach Japan expenses was $51.4 million, driven by new store operating expenses, investment in corporate infrastructure, increased variable expenses related to higher sales and increased advertising expense to support thebrand in Japan. In addition, the impact of foreign currency exchange rates increased reported expenses by $5.8 mil lion.Domestically, Coach has opened 19 new retail stores and seven new factory stores since the end of f iscal 2004. Expenses fromthese new stores, as well as the noncomparable portion of expenses from stores opened in f iscal 2004, increased total expenses by$23.1million. The remaining increase in selling expenses was due to increased variable expenses to support sales growth.
Advertising, marketing, and design costs increased by 24.1% to $78.8 million, or 4.6% of net sales, in fiscal 2005 from $63.5 million, or4.8% of net sales, in fiscal 2004. This dollar increase was primarily due to increased staffing costs and increased design expenditures.
Distribution and customer service expenses increased to $36.9 million in f iscal 2005 from $32.4 million in f iscal 2004. The dollarincrease in these expenses was primarily due to higher sales volumes. However, eff iciency gains at the distribution and customerservice facility resulted in an improvement in the ratio of these expenses to net sales from 2.5% in f iscal 2004 to 2.2% in f iscal 2005.
Administrative expenses increased 19.7% to $76.0 million, or 4.4% of net sales, in f iscal 2005 from $63.5 million, or 4.8% of netsales, in f iscal 2004. The dollar increase in these expenses was primarily due to increased compensation costs as well as increasedprofessional and consulting fees. Included in administrative expenses are business interruption proceeds of $2.6 million, related toour World Trade Center location.
I N T E R E S T I N C O M E , N E T
Net interest income was $15.8 million in f iscal 2005, as compared to $3.2 million in f iscal 2004. This dollar change was due toincreased positive cash balances during f iscal 2005 as well as higher returns on investments. During f iscal 2004, Coach beganinvesting in marketable securities with maturities greater than 90 days, which yielded greater rates of return.
P R O V I S I O N F O R I N C O M E TA X E S
The effective tax rate decreased to 36.9% in fiscal 2005 compared with the 37.5% recorded in fiscal 2004. As a result of the buyout ofour joint venture partner in Coach Japan and a continued need to grow the Coach Japan business, we have determined that the earningsof Coach Japan will be permanently reinvested and the tax provision previously recorded relating to the expatriation of those earningswas reversed. The reversal was recorded in the fourth quarter and brought the full year to the lower effective appropriate annual rate.

M D A C O N T I N U E D
22
M I N O R I T Y I N T E R E S T
Minority interest expense, net of tax, decreased to $13.6 million, or 0.8% of net sales, in f iscal 2005 from $18.0 million, or1.4% of netsales, in f iscal 2004. The decrease was primarily due to transfer price increases to Coach Japan, Inc., increased marketingexpenses and additional infrastructure investments.
FISCA L 2004 COMPAR ED TO FISCA L 2003
N E T S A L E S
Coach excludes new locations from the comparable store base for the f irst year of operation. Similarly, stores that are expanded bymore than 15% are also excluded from the comparable store base until the f irst anniversary of their reopening. Stores that areclosed for renovations are removed from the comparable store base. In f iscal 2004, 53 weeks of sales were reported and comparedto the equivalent 53-week period.
D I R E C T Net sales increased 29.8% to $726.5 million during f iscal 2004 from $559.5 million in f iscal 2003, driven by increased com-parable store sales, new store sales and expanded store sales in our North American retail and factory stores divisions. This netsales increase was also driven by an additional week of sales, which represented approximately $11.6 million of the total. Salesgrowth in comparable stores was 21.9% for retail stores and 10.3% for factory stores. Comparable store sales growth for the entireNorth American store chain was 16.9%, which accounted for $95.7 million of the net sales increase. Since the end of f iscal 2003,Coach has opened 19 retail stores and two factory stores. Sales from these new stores, as well as the noncomparable portion ofsales from stores opened during f iscal 2003, accounted for $53.0 million of the net sales increase. Since the end of f iscal 2003,Coach also expanded nine retail stores. Sales from these expanded stores, as well as the noncomparable portion of sales fromstores expanded during f iscal 2003, accounted for $15.3 million of the net sales increase. Sales growth in the Internet businessaccounted for the remaining sales increase. These increases were slightly offset by a decline in the direct marketing channel andstore closures. Since the end of f iscal 2003, Coach has closed one retail store and two factory stores.
I N D I R E C T Net sales increased 51.0% to $594.6 million in f iscal 2004 from $393.7 million during f iscal 2003. The increase was primarily driven by growth at our Japanese joint venture, Coach Japan, Inc. in which net sales increased $100.4 million over thecomparable period of the prior year, including $4.1 million of sales during the additional week of the f iscal year. Since the end of f iscal 2003, we have opened eight locations in Japan. Sales from these new stores, as well as the noncomparable portion of salesfrom stores opened during f iscal 2003, accounted for $44.0 million of the net sales increase. Our Japan locations experienced double-digit comparable net sales gains from the prior year, which represented $33.3 million of the net sales increase. Since theend of f iscal 2003, we have also expanded 16 locations in Japan, which accounted for $7.3 million of the net sales increase. Finally,the impact of foreign currency exchange rates resulted in an increase in reported net sales of $21.7 million. These net salesincreases were slightly offset by store closures. Since the end of f iscal 2003, Coach Japan has closed one location. The increase inindirect net sales was also driven by growth in the U.S. wholesale, international wholesale and business-to-business divisions,which contributed increased sales of $37.5 million, $33.5 million and $22.0 million, respectively, as compared to the same period inthe prior year. The remaining net sales increase is attributable to increases in other indirect channels.
G R O S S P R O F I T
Gross profit increased 46.2% to $990.1 million in f iscal 2004 from $677.4 million in f iscal 2003. Gross margin increased 380 basispoints to 74.9% in f iscal 2004 from 71.1% in f iscal 2003. This improvement was driven by: a shift in channel mix, as our higher grossmargin channels grew faster than the business as a whole, which contributed approximately 140 additional basis points; a shift inproduct mix, ref lecting increased penetration of higher margin mixed material product and accessories, which contributed approx-imately 120 additional basis points; and the continuing impact of sourcing cost initiatives, which contributed approximately120 additional basis points.
S E L L I N G , G E N E R A L A N D A D M I N I S T R AT I V E E X P E N S E S
Selling, general and administrative expenses increased 25.8% to $545.6 million in f iscal 2004 from $433.7 million in f iscal 2003. Thedollar increase was caused primarily by increased variable expenses related to Coach Japan, increased variable expenses to support increased net sales, and increased store operating expenses attributable to new stores opened both domestically and in

Results
CO
AC
H, IN
C. A
R 2
00
5
23`
Japan, as compared to the prior year. As a percentage of net sales, selling, general and administrative expenses during f iscal 2004were 41.3% compared to 45.5% during f iscal 2003. This improvement was due to leveraging our expense base on higher sales.
Selling expenses increased 31.0% to $386.2 million, or 29.2% of net sales, in f iscal 2004 from $294.9 million, or 30.9% of net sales,in f iscal 2003. The dollar increase in these expenses was primarily due to an increase in operating expenses associated with CoachJapan and operating expenses associated with North American stores that were opened during and after the end of f iscal 2003.The increase in Coach Japan expenses was $42.8 million, driven by new stores operating expenses, increased variable expensesrelated to higher sales, and the nonrecurrence of a $3.4 million favorable fair value adjustment for open foreign currency forwardcontracts. In addition, the impact of foreign currency exchange rates increased reported expenses by $10.0 million. Domestically,Coach has opened19 new retail stores and two new factory stores since the end of f iscal 2003. Expenses from these new stores, aswell as the noncomparable portion of expenses from stores opened in f iscal 2003, increased total expenses by $16.2 million. Theremaining increase in selling expenses was due to increased variable expenses to support sales growth.
Advertising, marketing, and design costs increased by 10.8% to $63.5 million, or 4.8% of net sales, in fiscal 2004, from $57.3 million, or6.0% of net sales, in fiscal 2003. This dollar increase was primarily due to increased staffing costs and increased design expenditures.
Distribution and customer service expenses increased to $32.4 million in f iscal 2004 from $29.7 million in f iscal 2003. The dollarincrease in these expenses was primarily due to higher sales volumes. However, eff iciency gains at the distribution and customerservice facility resulted in an improvement in the ratio of these expenses to net sales from 3.1% in f iscal 2003 to 2.5% in f iscal 2004.
Administrative expenses increased 22.6% to $63.5 million, or 4.8% of net sales, in f iscal 2004 from $51.8 million, or 5.5% of netsales, in f iscal 2003. The dollar increase in these expenses was primarily due to increased compensation costs as well as increasedprofessional and consulting fees. These increases were offset by an increase in business interruption proceeds of $1.2 million,related to our World Trade Center location.
I N T E R E S T I N C O M E , N E T
Net interest income was $3.2 million in f iscal 2004, as compared to $1.1 million in f iscal 2003. This dollar change was due toincreased positive cash balances during f iscal 2004 as well as higher returns on investments. During f iscal 2004, Coach beganinvesting in marketable securities with maturities greater than 90 days, which yielded greater rates of return.
P R O V I S I O N F O R I N C O M E TA X E S
The effective tax rate increased to 37.5% in f iscal 2004 compared with the 37.0% recorded in f iscal 2003.
M I N O R I T Y I N T E R E S T
Minority interest expense, net of tax, increased to $18.0 million, or 1.4% of net sales, in f iscal 2004 from $7.6 million, or 0.8% of netsales, in fiscal 2003. This increase was due to increased profits from the operations of Coach Japan and the impact of a stronger yen.
FI NANCIA L CONDITION
L I Q U I D I T Y A N D C A P I TA L R E S O U R C E S
Net cash provided from operating activities was $544.3 million in f iscal 2005 compared to $454.5 million in f iscal 2004. The$89.8 million increase was due primarily to increased earnings of $126.9 million, as well as an increase in accrued liabilities of$36.1 million, primarily attributable to a higher provision for income taxes. There was a decrease in the change in accounts receiv-able of $10.6 million due to improved collection rates. The increase was offset by increased deferred taxes of $67.9 million. Finally,there was a decrease in the tax benefit from the exercise of stock options of $28.0 million.
Net cash used in investment activities was $371.8 million in f iscal 2005 compared to $375.3 million in f iscal 2004. The decrease in net cash used in investment activities is attributable to investment maturities during the year of $330.7 million. This decrease was partially offset by the buyout of our joint venture partner’s interest in Coach Japan of $228.4 million, increased investment purchases of $77.8 million and increased capital expenditures of $20.9 million, which related primarily to new and renovated retailstores in the United States and Japan, as well as technology enhancements.

M D A C O N T I N U E D
24
Net cash used in f inancing activities was $280.6 million in f iscal 2005 compared to $45.7 million in f iscal 2004. The $234.9 millionincrease in cash used resulted from an additional $210.0 million of funds expended to repurchase common stock. In connection withthe buyout of Coach Japan, we distributed accumulated earnings of $57.4 million and repaid our initial investment of $15.5 million to our joint venture partner. The increase in cash used was offset by additional net borrowings on the revolving credit facility of$35.4 million and increased proceeds of $12.7 million received from the exercise of stock options.
On October 16, 2003, Coach, certain lenders and Bank of America, N.A. (“Bank of America”), as primary lender and administrativeagent, renewed the $100 million senior unsecured revolving credit facility (the “Bank of America facility”), extending the facility expiration to October16, 2006. At Coach’s request, the Bank of America facility can be expanded to $125 million. On June 23, 2005,this facility was expanded for one additional year, to October 16, 2007. This facility is available for seasonal working capitalrequirements or general corporate purposes and may be prepaid without penalty or premium.
During f iscal 2005 and fiscal 2004 there were no borrowings under the Bank of America facility. As of July 2, 2005, there were nooutstanding borrowings under the Bank of America facility.
Under this revolving credit facility, Coach pays a commitment fee of 10 to 25 basis points, based on the Company’s f ixed chargecoverage ratio, on any unused amounts of the revolving credit facility. The initial commitment fee was 15 basis points. At July 2,2005, the commitment fee was 12.5 basis points. The initial LIBOR margin under the facility was 62.5 basis points. At July 2, 2005,the LIBOR margin was 55 basis points, ref lecting an improvement in our f ixed-charge coverage ratio.
The Bank of America facility contains various covenants and customary events of default. Coach has been in compliance with allcovenants since its inception.
To provide funding for working capital and general corporate purposes, Coach Japan entered into credit facilities with severalJapanese f inancial institutions. These facilities allow a maximum borrowing of 8.6 billion yen, or approximately $77 million, at July 2,2005. Interest is based on the Tokyo Interbank rate plus a margin of up to 50 basis points.
During f iscal 2005 and fiscal 2004, the peak borrowings under the Japanese credit facilities were $50.5 million and $36.1 mil-lion, respectively. At July 2, 2005 and July 3, 2004, outstanding borrowings under the Japanese facilities were $12.3 million and$1.7 million, respectively.
These Japanese facilities contain various covenants and customary events of default. Coach Japan has been in compliance with allcovenants since their inception. These facilities include automatic renewals based on compliance with the covenants. Coach, Inc. is not a guarantor on these facilities.
On August 12, 2004, the Coach Board of Directors approved a $200 million increase to the Company’s existing common stockrepurchase program and extended the duration of this program through August 2006. As of April 2, 2005, Coach had completedthis authorization of the stock repurchase program.
On May 11, 2005, the Coach Board of Directors approved a common stock repurchase program to acquire up to $250 million ofCoach’s outstanding common stock. Purchases of Coach stock may be made from time to time, subject to market conditions and at prevailing market prices, through open market purchases. Repurchased shares of common stock will become authorized butunissued shares and may be issued in the future for general corporate and other purposes. The Company may terminate or limit thestock repurchase program at any time.
During f iscal 2005 and fiscal 2004, Coach repurchased 11.0 million and 3.0 million shares, respectively, of common stock, at anaverage cost of $24.09 and $18.18 per share, respectively.

Results
CO
AC
H, IN
C. A
R 2
00
5
25`
In f iscal 2005, total capital expenditures were $94.6 million. Coach opened 19 new retail and seven new factory stores in NorthAmerica, which represented $20.0 million of capital expenditures. We also expanded seven retail stores and two factory stores,which represented $19.9 million of capital expenditures. Spending on department store renovations and distributor locations was$4.7 million. In addition, $14.0 million was used for information systems and corporate facilities. These investments were f inancedfrom internally generated cash f lows and on hand cash. In Japan, we invested $22.9 million, primarily for the opening of 12 newlocations, store expansions and information systems. These investments were financed by using funds from our Japanese revolvingcredit facilities and operating cash f low.
Coach experiences signif icant seasonal variations in its working capital requirements. During the f irst f iscal quarter Coach buildsinventory for the holiday selling season, opens new retail stores and generates higher levels of trade receivables. In the second fiscal quarter its working capital requirements are reduced substantially as Coach generates consumer sales and collects whole-sale accounts receivable. In f iscal 2005, Coach purchased approximately $377 million of inventory, which was funded by on handcash, operating cash f low and by borrowings under the Japanese revolving credit facilities.
Management believes that cash f low from operations and on hand cash will provide adequate funds for the foreseeable workingcapital needs, planned capital expenditures and the common stock repurchase program. Any future acquisitions, joint ventures orother similar transactions may require additional capital. There can be no assurance that any such capital will be available to Coachon acceptable terms or at all. Coach’s ability to fund its working capital needs, planned capital expenditures and scheduled debtpayments, as well as to comply with all of the f inancial covenants under its debt agreements, depends on its future operating performance and cash f low, which in turn are subject to prevailing economic conditions and to f inancial, business and other factors, some of which are beyond Coach’s control.
Currently, Sara Lee is a guarantor or a party to many of Coach’s leases. Coach has agreed to make efforts to remove Sara Lee fromall of its existing leases, and Sara Lee is not a guarantor or a party to any new or renewed leases. Coach has obtained a letter ofcredit for the benefit of Sara Lee in an amount approximately equal to the annual minimum rental payments under leases trans-ferred to Coach by Sara Lee, but for which Sara Lee retains contingent liability. Coach is required to maintain this letter of credit untilthe annual minimum rental payments under the relevant leases are less than $2.0 million. The initial letter of credit had a faceamount of $20.6 million, and we expect this amount to decrease annually as Coach’s guaranteed obligations are reduced. As ofJuly 2, 2005, the letter of credit was $15.4 million. We expect that we will be required to maintain the letter of credit for at least10 years.
As of July 2, 2005, the scheduled maturities of Coach’s long-term contractual obligations are as follows:
PAYMENTS DUE BY PERIOD pppppppppppppppppppppppppppppppppppppppppppppppppp[pppppppppppppppppppppppppppppppppppppppppppppppppppppppppppppppppppppppppppppppppppppppppppppppppppppppppppppppppppppppppppppppppppppppppppppppppppppppppppppppppppppppppppppppppppppppppppppppppppppppppppppppppppppppppppppppppppppppppppppppppppppppppppppppppppppppp
LESS THAN 1–3 4–5 AF TER 5
(AMOUNTS IN MILL IONS) 1 YEAR YEARS YEARS YEARS TOTALppppppppppppppppppppppppppppppppppppppppppppppppppppppp ppppppppppppppppppppppppppppppppppppppppppppppppppppppp ppppppppppppppppppppppppppppppppppppppppppppppppppppppp ppppppppppppppppppppppppppppppppppppppppppppppppppppppp ppppppppppppppppppppppppppppppppppppppppppppppppppppppp
Operating leases $ 62.6 $ 115.1 $ 102.4 $ 175.0 $ 455.1
Revolving credit facility 12.3 – – – 12.3
Long-term debt including the current portion 0.2 0.4 0.6 2.2 3.4ppppppppppppppppppppppppppppppppppppppppppppppppppppppp ppppppppppppppppppppppppppppppppppppppppppppppppppppppp ppppppppppppppppppppppppppppppppppppppppppppppppppppppp ppppppppppppppppppppppppppppppppppppppppppppppppppppppp ppppppppppppppppppppppppppppppppppppppppppppppppppppppp
Total $ 75.1 $ 115.5 $ 103.0 $ 177.2 $ 470.8pppppppppppppp pppppppppppppp pppppppppppppp pppppppppppppp pppppppppppppp
Coach does not have any off-balance-sheet f inancing or unconsolidated special purpose entities. Coach’s risk management policies prohibit the use of derivatives for trading purposes. The valuation of f inancial instruments that are marked to market arebased upon independent third-party sources.
LO N G -T E R M D E B T
Coach is party to an Industrial Revenue Bond related to its Jacksonville, Florida, facility. This loan has a remaining balance of$3.4 million and bears interest at 8.77%. Principal and interest payments are made semiannually, with the f inal payment due in 2014.
M D A C O N T I N U E D
26
S E A S O N A L I T Y
Because its products are frequently given as gifts, Coach has historically realized, and expects to continue to realize, higher salesand operating income in the second quarter of its f iscal year, which includes the holiday months of November and December. In addition, f luctuations in sales and operating income in any f iscal quarter are affected by the timing of seasonal wholesale ship-ments and other events affecting retail sales. However, over the past several years, we have achieved higher levels of growth in thenonholiday quarters, which has reduced these seasonal f luctuations. We expect that these trends will continue, and we will furtherbalance our year round business.
CR ITICA L ACCOUNTI NG POLICIES AND ESTIMATES
The preparation of f inancial statements in conformity with accounting principles generally accepted in the United States of Americarequires management to make estimates and assumptions. Predicting future events is inherently an imprecise activity and, as such,requires the use of judgment. Actual results may vary from estimates in amounts that may be material to the f inancial statements.The accounting policies discussed below are considered critical because changes to certain judgments and assumptions inherentin these policies could affect the f inancial statements.
In certain instances, accounting principles generally accepted in the United States of America allow for the selection of alternativeaccounting methods. The Company’s signif icant policies that involve the selection of alternative methods are accounting for stockoptions and inventories.
O P E R AT I N G L E A S E S
The Company leases retail stores and off ice space under operating leases. The majority of the Company’s lease agreements provide for tenant improvement allowances, rent escalation clauses and/or contingent rent provisions. In f iscal 2005, the Companyconformed its accounting for operating leases and leasehold improvements to Statement of Financial Accounting Standards(“SFAS”) No. 13 and its related interpretations as clarif ied by the Office of the Chief Accountant of the Securities and ExchangeCommission to the American Institute of Certif ied Public Accountants on February 7, 2005.
Tenant improvement allowances are recorded as a deferred lease credit on the balance sheet and amortized over the lease term,which is consistent with the amortization period for the constructed assets. Historically, the consolidated balance sheets ref lectedthese allowances as a reduction of capital expenditures and the carrying value of f ixed assets and the consolidated statements ofcash f lows ref lected tenant improvement allowances as a reduction of capital expenditures within investing activities. Since theimpact of this change in accounting was not material to any previously reported f iscal year, the cumulative effect was recorded inthe third quarter of f iscal 2005.
In addition to the above, the Company recorded a cumulative, noncash charge in the third quarter of f iscal 2005 to ref lect the impact of recording rent expense prior to the store opening (during the construction buildout period). Previously, the Company recognized the straight-line rent expense for leases beginning on the earlier of the store opening date or lease commencementdate, which generally had the effect of excluding the buildout period of its stores from the calculation of the period over which itexpensed rent. The Company now records rent expense when it takes possession of a store to begin its buildout, which generallyoccurs before the stated commencement of the lease term and is approximately 60 to 90 days prior to the opening of the store. The adjustment resulted in a cumulative, noncash charge to rent expense of approximately $4.8 million during f iscal 2005, of whichapproximately $4.3 million related to prior periods.
S T O C K- B A S E D C O M P E N S AT I O N
Two alternative methods for accounting for stock options are available: the intrinsic value method and the fair value method. TheCompany uses the intrinsic value method of accounting for stock options and, accordingly, no compensation expense has beenrecognized. Under either method, the determination of the pro forma amounts involves several assumptions including option lifeand future volatility. See Note 1 and Note 8 to the Consolidated Financial Statements for expanded disclosures.

Results
CO
AC
H, IN
C. A
R 2
00
5
27`
I N V E N T O R I E S
U.S. inventories are valued at the lower of cost (determined by the f irst-in, f irst-out method) or market. Inventories in Japan are valued at the lower of cost (determined by the last-in, f irst-out method) or market. Inventory costs include material, conversioncosts, freight and duties. Reserves for slow-moving and aged merchandise are provided based on historical experience and current product demand. We evaluate the adequacy of reserves quarterly. A decrease in product demand due to changing customer tastes, buying patterns or increased competition could impact Coach’s evaluation of its slow-moving and aged merchandise.
For more information on Coach’s accounting policies, please refer to the Notes to Consolidated Financial Statements. Other criticalaccounting policies are as follows:
V A L U AT I O N O F LO N G - L I V E D A S S E T S
In accordance with SFAS No.144, “Accounting for the Impairment or Disposal of Long-Lived Assets,” which the Company adoptedeffective with the beginning of f iscal 2002, the Company assesses the carrying value of its long-lived assets for possible impairmentbased on a review of forecasted operating cash f lows and the profitability of the related business. The Company did not record anyimpairment losses in f iscal 2005, f iscal 2004 or f iscal 2003.
R E V E N U E R E C O G N I T I O N
Sales are recognized at the point of sale, which occurs when merchandise is sold in an over-the-counter consumer transaction or, for the wholesale, Internet and catalog channels, upon shipment of merchandise, when title passes to the customer. Allowancesfor estimated uncollectible accounts, discounts, returns and allowances are provided when sales are recorded based upon histori-cal experience and current trends. Royalty revenues are earned through license agreements with manufacturers of other con-sumer products that incorporate the Coach brand. Revenue earned under these contracts is recognized based upon reported netsales from the licensee.
N E W A C C O U N T I N G S TA N D A R D S
In October 2004, the Emerging Issues Task Force (“EITF”) issued its abstract No. 04-1, “Accounting for Preexisting Relationshipsbetween the Parties to a Business Combination.” EITF 04-1 addresses the appropriate accounting treatment for portions of theacquisition costs of an entity that may be deemed to apply to elements of a preexisting business relationship between the acquiringcompany and the target company. EITF 04-1 is effective for combinations consummated after October 2004. The adoption ofEITF 04-1had no effect on historical f inancial statements.
In November 2004, the Financial Accounting Standards Board (“FASB”) issued SFAS No.151, “Inventory Costs – an amendment ofARB. No. 43, Chapter 4.” SFAS 151 is an amendment of Accounting Research Board Opinion No. 43 and sets standards for thetreatment of abnormal amounts of idle facility expense, freight, handling costs and spoilage. SFAS 151 is effective for f iscal yearsbeginning after June15, 2005. We are currently evaluating the impact of SFAS151on our f inancial statements.
In December 2004, the FASB issued Staff Position No. 109-2, “Accounting and Disclosure Guidance for the Foreign EarningsRepatriation Provision within the American Jobs Creation Act of 2004” (“FSP No. 109-2”). FSP No. 109-2 provides guidance underSFAS No. 109, “Accounting for Income Taxes,” with respect to recording the potential impact of the repatriation provisions of theAmerican Jobs Creation Act of 2004 (the “Jobs Act”) on enterprises’ income tax expense and deferred tax liability. FSP109-2 statesthat an enterprise is allowed time beyond the f inancial reporting period of enactment to evaluate the ef fect of the Jobs Act on its plan for reinvestment or repatriation of foreign earnings for purposes of applying SFAS 109. We do not plan to make any divi-dends under this provision, but we are still evaluating the impact of FSP109-2 on our consolidated f inancial statements.
In December 2004, the FASB issued SFAS No.153, “Exchanges of Nonmonetary Assets – an amendment of APB Opinion No. 29,”which eliminates certain narrow dif ferences between Accounting Principles Board (“APB”) 29 and international accounting stan-dards. SFAS 153 is effective for f iscal periods beginning on or after June15, 2005. The adoption of SFAS153 is not expected to havea material impact on our f inancial statements.

28
On December16, 2004, the FASB issued SFAS No.123 (revised 2004), “Share-Based Payment” (“SFAS123R”), which is a revision ofSFAS 123, “Accounting for Stock-Based Compensation.” SFAS 123R supersedes Accounting Principles Board Opinion No. 25,“Accounting for Stock Issued to Employees.” The pronouncement requires an entity to measure the cost of employee servicesreceived in exchange for an award of equity instruments based on the grant-date fair value of the award. That cost will be recognizedover the period during which an employee is required to provide service in exchange for the award – the requisite service period (typically the vesting period). SFAS123R is effective as of the beginning of the first interim or annual reporting period that begins afterJune 15, 2005. We are currently evaluating the effect of SFAS 123R on our f inancial statements with the intent of implementing thisstandard in f iscal 2006.
In March 2005, the SEC issued Staff Accounting Bulletin (“SAB”) No.107, “Share-Based Payment” (“SAB 107”). SAB 107 expressesviews of the SEC staff regarding the interaction between SFAS 123R and certain SEC rules and regulations and provides the staff’sviews regarding the valuation of share-based payments arrangements. Subsequently, the SEC decided to delay the required implementation of SFAS123R to fiscal years beginning after June15, 2005. We are currently evaluating the effect of SFAS 123R andSAB 107 on our f inancial statements with the intent of implementing this standard in f iscal 2006.
In March 2005, the FASB issued SFAS Interpretation No. 47 (“FIN 47”), “Accounting for Conditional Asset Retirement Obligations.”FIN 47 provides clarif ication regarding the meaning of the term “conditional asset retirement obligation” as used in FASB 143,“Accounting for Asset Retirement Obligations.” We are currently evaluating the impact of FIN 47 on our f inancial statements.
In May 2005, the FASB issued SFAS No.154, “Accounting Changes and Error Corrections – a replacement of APB Opinion No. 20and FASB Statement No. 3.” SFAS 154 provides guidance on the accounting for and reporting of accounting changes and error corrections. This statement is effective for accounting changes and corrections of errors made in f iscal years beginning afterDecember15, 2005. Early adoption is permitted. The Company will adopt SFAS154 in the required period.
In June 2005, the EITF reached consensus on EITF 05-6, “Determining the Amortization Period for Leasehold Improvements.”Under EITF 05-6, leasehold improvements placed in service signif icantly after and not contemplated at, or near, the beginning of thelease term, should be amortized over the lesser of the useful life of the assets or a term that includes renewals that are reasonablyassured at the date the leasehold improvements are purchased. EITF 05-6 is effective for periods beginning after June 29, 2005 andis not expected to have a material impact on our consolidated f inancial statements.
M D A C O N T I N U E D

Results
CO
AC
H, IN
C. A
R 2
00
5
29`
Report of Independent Registered Public Accounting Firm
To the Board of Directors and Stockholders of Coach, Inc., New York, New York:
We have audited the accompanying consolidated balance sheets of Coach, Inc. and subsidiaries (the “Company”) as of July 2, 2005and July 3, 2004, and the related consolidated statements of income, stockholders’ equity and cash f lows for each of thethree years in the period ended July 2, 2005. These consolidated f inancial statements are the responsibility of the Company’s man-agement. Our responsibility is to express an opinion on these consolidated f inancial statements based on our audits.
We conducted our audits in accordance with standards of the Public Company Accounting Oversight Board (United States). Thosestandards require that we plan and perform the audit to obtain reasonable assurance about whether the f inancial statements arefree of material misstatement. An audit includes examining, on a test basis, evidence supporting the amounts and disclosures in thefinancial statements. An audit also includes assessing the accounting principles used and signif icant estimates made by manage-ment, as well as evaluating the overall f inancial statement presentation. We believe that our audits provide a reasonable basis forour opinion.
In our opinion, the consolidated financial statements referred to above present fairly, in all material respects, the financial position of theCompany at July 2, 2005 and July 3, 2004, and the consolidated results of their operations and their cash f lows for each of the threeyears in the period ended July 2, 2005 in conformity with accounting principles generally accepted in the United States of America.
We also have audited, in accordance with the standards of the Public Company Accounting Oversight Board (United States), theeffectiveness of the Company’s internal control over f inancial reporting as of July 2, 2005, based on the criteria established inInternal Control – Integrated Framework issued by the Committee of Sponsoring Organizations of the Treadway Commission andour report dated September 9, 2005 expressed an unqualif ied opinion on management’s assessment of the effectiveness of the Company’s internal control over f inancial reporting and an unqualif ied opinion on the effectiveness of the Company’s internal control over f inancial reporting.
Deloitte & Touche LLPNew York, New YorkSeptember 9, 2005

30
Report of Independent Registered Public Accounting Firm
To the Board of Directors and Stockholders of Coach, Inc., New York, New York:
We have audited management’s assessment, included in the accompanying Management’s Report on Internal Control OverFinancial Reporting, that Coach, Inc. and subsidiaries (the “Company”) maintained effective internal control over f inancial reportingas of July 2, 2005, based on criteria established in Internal Control – Integrated Framework issued by the Committee of SponsoringOrganizations of the Treadway Commission. The Company’s management is responsible for maintaining effective internal controlover f inancial reporting and for its assessment of the effectiveness of internal control over f inancial reporting. Our responsibility isto express an opinion on management’s assessment and an opinion on the effectiveness of the Company’s internal control overf inancial reporting based on our audit.
We conducted our audit in accordance with the standards of the Public Company Accounting Oversight Board (United States).Those standards require that we plan and perform the audit to obtain reasonable assurance about whether effective internal con-trol over f inancial reporting was maintained in all material respects. Our audit included obtaining an understanding of internal control over f inancial reporting, evaluating management’s assessment, testing and evaluating the design and operating effective-ness of internal control, and performing such other procedures as we considered necessary in the circumstances. We believe thatour audit provides a reasonable basis for our opinions.
A company’s internal control over financial reporting is a process designed by, or under the supervision of, the company’s principalexecutive and principal financial officers, or persons performing similar functions, and effected by the company’s board of directors,management, and other personnel to provide reasonable assurance regarding the reliability of financial reporting and the preparationof financial statements for external purposes in accordance with generally accepted accounting principles. A company’s internal control over financial reporting includes those policies and procedures that (1) pertain to the maintenance of records that, in reasonabledetail, accurately and fairly reflect the transactions and dispositions of the assets of the company; (2) provide reasonable assurancethat transactions are recorded as necessary to permit preparation of financial statements in accordance with generally acceptedaccounting principles, and that receipts and expenditures of the company are being made only in accordance with authorizations of management and directors of the company; and (3) provide reasonable assurance regarding prevention or timely detection of unauthorized acquisition, use, or disposition of the company’s assets that could have a material effect on the financial statements.
Because of the inherent limitations of internal control over f inancial reporting, including the possibility of collusion or improper man-agement override of controls, material misstatements due to error or fraud may not be prevented or detected on a timely basis.Also, projections of any evaluation of the effectiveness of the internal control over f inancial reporting to future periods are subject to the risk that the controls may become inadequate because of changes in conditions, or that the degree of compliance with thepolicies or procedures may deteriorate.
In our opinion, management’s assessment that the Company maintained effective internal control over f inancial reporting as ofJuly 2, 2005, is fairly stated, in all material respects, based on the criteria established in Internal Control – Integrated Frameworkissued by the Committee of Sponsoring Organizations of the Treadway Commission. Also, in our opinion, the Company maintained,in all material respects, effective internal control over f inancial reporting as of July 2, 2005, based on the criteria established inInternal Control – Integrated Framework issued by the Committee of Sponsoring Organizations of the Treadway Commission.
We have also audited, in accordance with the standards of the Public Company Accounting Oversight Board (United States), theconsolidated f inancial statements as of and for the year ended July 2, 2005 of the Company and our report dated September 9,2005 expressed an unqualif ied opinion on those consolidated f inancial statements.
Deloitte & Touche LLPNew York, New YorkSeptember 9, 2005

Results
CO
AC
H, IN
C. A
R 2
00
5
31`
Consolidated Balance Sheets
(AMOUNTS IN THOUSANDS, E XCEPT SHARE DATA) JULY 2, 2005 JULY 3, 2004ppppppppppppppppppppppppppppppppppppppppppppppppppppppp ppppppppppppppppppppppppppppppppppppppppppppppppppppppp
ASSETS
Cash and cash equivalents $ 154,566 $ 262,720Short-term investments 228,485 171,723Trade accounts receivable, less allowances of $4,124 and $5,456, respectively 65,399 55,724Inventories 184,419 161,913Deferred income taxes 50,820 34,521Prepaid expenses and other current assets 25,671 19,015
ppppppppppppppppppppppppppppppppppppppppppppppppppppppp ppppppppppppppppppppppppppppppppppppppppppppppppppppppp
Total current assets 709,360 705,616
Property and equipment, net 203,862 164,291Long-term investments 122,065 130,000Deferred income taxes 31,520 –Goodwill 238,711 13,605Indefinite life intangibles 9,788 9,788Other noncurrent assets 31,826 21,125
ppppppppppppppppppppppppppppppppppppppppppppppppppppppp ppppppppppppppppppppppppppppppppppppppppppppppppppppppp
Total assets $ 1,347,132 $ 1,044,425pppppppppppppp pppppppppppppp
LIABILITIES AND STOCKHOLDERS’ EQUITY
Accounts payable $ 64,985 $ 44,771Accrued liabilities 185,502 123,647Deferred income taxes 2,851 –Revolving credit facility 12,292 1,699Current portion of long-term debt 150 115
ppppppppppppppppppppppppppppppppppppppppppppppppppppppp ppppppppppppppppppppppppppppppppppppppppppppppppppppppp
Total current liabilities 265,780 170,232
Deferred income taxes 4,512 15,791Long-term debt 3,270 3,420Other liabilities 40,794 32,498Minority interest, net of tax – 40,198
ppppppppppppppppppppppppppppppppppppppppppppppppppppppp ppppppppppppppppppppppppppppppppppppppppppppppppppppppp
Total liabilities 314,356 262,139
Commitments and contingencies (Note 6)Stockholders’ equity
Preferred stock: (authorized 25,000,000 shares; $0.01par value) none issued – –Common stock: (authorized 500,000,000 shares; $0.01par value) issued
and outstanding – 378,429,710 and 379,236,402 shares, respectively 3,784 3,792Capital in excess of par value 465,015 355,130Retained earnings 576,141 430,461Accumulated other comprehensive income 903 2,195Unearned compensation (13,067) (9,292)
ppppppppppppppppppppppppppppppppppppppppppppppppppppppp ppppppppppppppppppppppppppppppppppppppppppppppppppppppp
Total stockholders’ equity 1,032,776 782,286ppppppppppppppppppppppppppppppppppppppppppppppppppppppp ppppppppppppppppppppppppppppppppppppppppppppppppppppppp
Total liabilities and stockholders’ equity $ 1,347,132 $ 1,044,425pppppppppppppp pppppppppppppp
See accompanying Notes to Consolidated Financial Statements

32
Consolidated Statements of Income
F ISCAL YEAR ENDED (AMOUNTS IN THOUSANDS, E XCEPT PER SHARE DATA) JULY 2, 2005 JULY 3, 2004(1) JUNE 28, 2003ppppppppppppppppppppppppppppppppppppppppppppppppppppppp ppppppppppppppppppppppppppppppppppppppppppppppppppppppp ppppppppppppppppppppppppppppppppppppppppppppppppppppppp
Net sales $ 1,710,423 $ 1,321,106 $ 953,226Cost of sales 399,652 331,024 275,797
ppppppppppppppppppppppppppppppppppppppppppppppppppppppp ppppppppppppppppppppppppppppppppppppppppppppppppppppppp ppppppppppppppppppppppppppppppppppppppppppppppppppppppp
Gross profit 1,310,771 990,082 677,429Selling, general and administrative expenses 688,961 545,617 433,667
ppppppppppppppppppppppppppppppppppppppppppppppppppppppp ppppppppppppppppppppppppppppppppppppppppppppppppppppppp ppppppppppppppppppppppppppppppppppppppppppppppppppppppp
Operating income 621,810 444,465 243,762Interest income, net 15,760 3,192 1,059
ppppppppppppppppppppppppppppppppppppppppppppppppppppppp ppppppppppppppppppppppppppppppppppppppppppppppppppppppp ppppppppppppppppppppppppppppppppppppppppppppppppppppppp
Income before provision for income taxes and minority interest 637,570 447,657 244,821Provision for income taxes 235,277 167,866 90,585Minority interest, net of tax 13,641 18,043 7,608
ppppppppppppppppppppppppppppppppppppppppppppppppppppppp ppppppppppppppppppppppppppppppppppppppppppppppppppppppp ppppppppppppppppppppppppppppppppppppppppppppppppppppppp
Net income $ 388,652 $ 261,748 $ 146,628pppppppppppppp pppppppppppppp pppppppppppppp
Net income per shareBasic $ 1.03 $ 0.70 $ 0.41
pppppppppppppp pppppppppppppp pppppppppppppp
Diluted $ 1.00 $ 0.68 $ 0.39pppppppppppppp pppppppppppppp pppppppppppppp
Shares used in computing net income per shareBasic 378,670 372,120 359,116
pppppppppppppp pppppppppppppp pppppppppppppp
Diluted 390,191 385,558 371,684pppppppppppppp pppppppppppppp pppppppppppppp
(1) 53-week f iscal year
See accompanying Notes to Consolidated Financial Statements
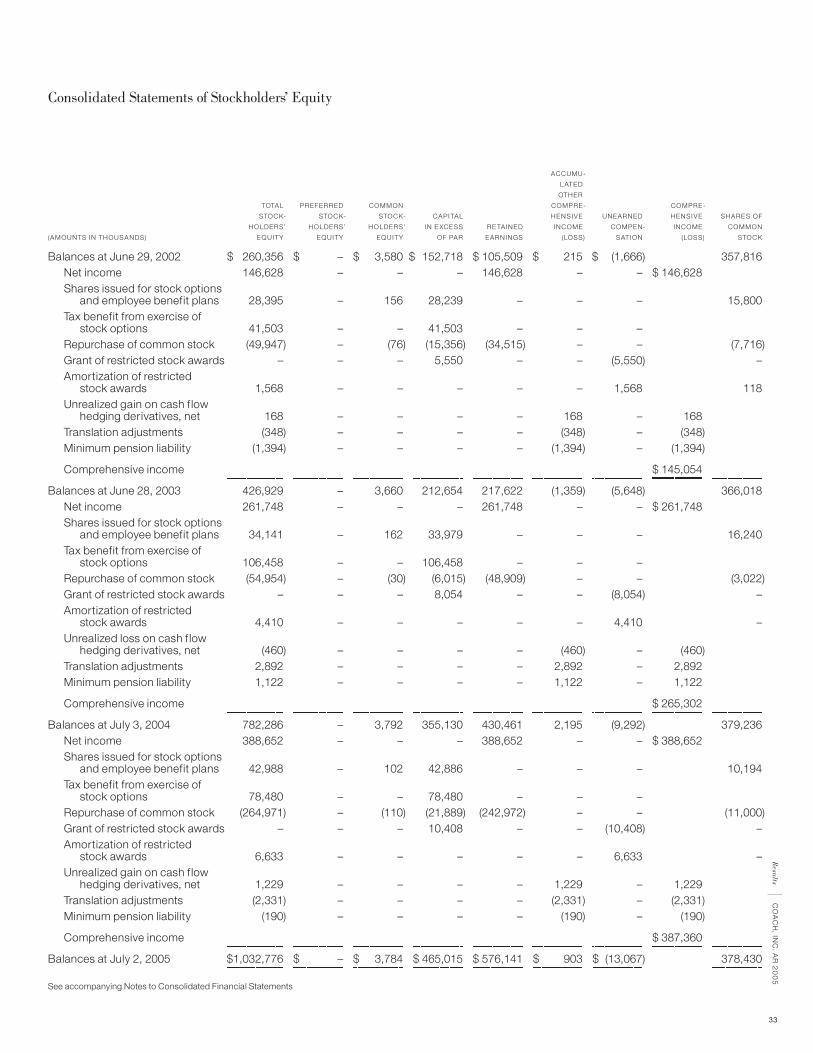
Results
CO
AC
H, IN
C. A
R 2
00
5
33`
Consolidated Statements of Stockholders’ Equity
ACCUMU-
LATED
OTHER
TOTAL PREFERRED COMMON COMPRE- COMPRE-
STOCK- STOCK- STOCK- CAPITAL HENSIVE UNEARNED HENSIVE SHARES OF
HOLDERS’ HOLDERS’ HOLDERS’ IN E XCESS RE TAINED INCOME COMPEN- INCOME COMMON
(AMOUNTS IN THOUSANDS) EQUITY EQUITY EQUITY OF PAR EARNINGS (LOSS) SAT ION (LOSS) STOCKpppppppppppppppppppppppppppppppppppppppppppppppppppp pppppppppppppppppppppppppppppppppppppppppppppp pppppppppppppppppppppppppppppppppppppppppppppp pppppppppppppppppppppppppppppppppppppppppppppp pppppppppppppppppppppppppppppppppppppppppppppp pppppppppppppppppppppppppppppppppppppppppppppp pppppppppppppppppppppppppppppppppppppppppppppp pppppppppppppppppppppppppppppppppppppppppppppp pppppppppppppppppppppppppppppppppppppppppppppp
Balances at June 29, 2002 $ 260,356 $ – $ 3,580 $ 152,718 $ 105,509 $ 215 $ (1,666) 357,816Net income 146,628 – – – 146,628 – – $ 146,628Shares issued for stock options
and employee benefit plans 28,395 – 156 28,239 – – – 15,800Tax benefit from exercise of
stock options 41,503 – – 41,503 – – –Repurchase of common stock (49,947) – (76) (15,356) (34,515) – – (7,716)Grant of restricted stock awards – – – 5,550 – – (5,550) –Amortization of restricted
stock awards 1,568 – – – – – 1,568 118Unrealized gain on cash f low
hedging derivatives, net 168 – – – – 168 – 168Translation adjustments (348) – – – – (348) – (348)Minimum pension liability (1,394) – – – – (1,394) – (1,394)
pppppppppppppppppppppppppppppppppppppppppppppp
Comprehensive income $ 145,054pppppppppppppppppppppppppppppppppppppppppppppppppppp pppppppppppppppppppppppppppppppppppppppppppppp pppppppppppppppppppppppppppppppppppppppppppppp pppppppppppppppppppppppppppppppppppppppppppppp pppppppppppppppppppppppppppppppppppppppppppppp pppppppppppppppppppppppppppppppppppppppppppppp pppppppppppppppppppppppppppppppppppppppppppppp ppppppppppppp pppppppppppppppppppppppppppppppppppppppppppppp
Balances at June 28, 2003 426,929 – 3,660 212,654 217,622 (1,359) (5,648) 366,018Net income 261,748 – – – 261,748 – – $ 261,748Shares issued for stock options
and employee benefit plans 34,141 – 162 33,979 – – – 16,240Tax benefit from exercise of
stock options 106,458 – – 106,458 – – –Repurchase of common stock (54,954) – (30) (6,015) (48,909) – – (3,022)Grant of restricted stock awards – – – 8,054 – – (8,054) –Amortization of restricted
stock awards 4,410 – – – – – 4,410 –Unrealized loss on cash f low
hedging derivatives, net (460) – – – – (460) – (460)Translation adjustments 2,892 – – – – 2,892 – 2,892Minimum pension liability 1,122 – – – – 1,122 – 1,122
pppppppppppppppppppppppppppppppppppppppppppppp
Comprehensive income $ 265,302pppppppppppppppppppppppppppppppppppppppppppppppppppp pppppppppppppppppppppppppppppppppppppppppppppp pppppppppppppppppppppppppppppppppppppppppppppp pppppppppppppppppppppppppppppppppppppppppppppp pppppppppppppppppppppppppppppppppppppppppppppp pppppppppppppppppppppppppppppppppppppppppppppp pppppppppppppppppppppppppppppppppppppppppppppp ppppppppppppp pppppppppppppppppppppppppppppppppppppppppppppp
Balances at July 3, 2004 782,286 – 3,792 355,130 430,461 2,195 (9,292) 379,236Net income 388,652 – – – 388,652 – – $ 388,652Shares issued for stock options
and employee benefit plans 42,988 – 102 42,886 – – – 10,194Tax benefit from exercise of
stock options 78,480 – – 78,480 – – –Repurchase of common stock (264,971) – (110) (21,889) (242,972) – – (11,000)Grant of restricted stock awards – – – 10,408 – – (10,408) –Amortization of restricted
stock awards 6,633 – – – – – 6,633 –Unrealized gain on cash f low
hedging derivatives, net 1,229 – – – – 1,229 – 1,229Translation adjustments (2,331) – – – – (2,331) – (2,331)Minimum pension liability (190) – – – – (190) – (190)
pppppppppppppppppppppppppppppppppppppppppppppp
Comprehensive income $ 387,360pppppppppppppppppppppppppppppppppppppppppppppppppppp pppppppppppppppppppppppppppppppppppppppppppppp pppppppppppppppppppppppppppppppppppppppppppppp pppppppppppppppppppppppppppppppppppppppppppppp pppppppppppppppppppppppppppppppppppppppppppppp pppppppppppppppppppppppppppppppppppppppppppppp pppppppppppppppppppppppppppppppppppppppppppppp ppppppppppppp pppppppppppppppppppppppppppppppppppppppppppppp
Balances at July 2, 2005 $1,032,776 $ – $ 3,784 $ 465,015 $ 576,141 $ 903 $ (13,067) 378,430ppppppppppppppp ppppppppppppp ppppppppppppp ppppppppppppp ppppppppppppp ppppppppppppp ppppppppppppp ppppppppppppp
See accompanying Notes to Consolidated Financial Statements

34
Consolidated Statements of Cash Flows
F ISCAL YEAR ENDED (AMOUNTS IN THOUSANDS) JULY 2, 2005 JULY 3, 2004(1) JUNE 28, 2003ppppppppppppppppppppppppppppppppppppppppppppppppppppppp ppppppppppppppppppppppppppppppppppppppppppppppppppppppp ppppppppppppppppppppppppppppppppppppppppppppppppppppppp
CASH FLOWS FROM OPERATI NG ACTIVITIES
Net income $ 388,652 $ 261,748 $ 146,628Adjustments to reconcile net income to net cash from operating activities:
Depreciation and amortization 57,033 44,510 31,350Minority interest 13,641 18,043 7,608Tax benefit from exercise of stock options 78,480 106,458 41,503(Increase) decrease in deferred taxes (56,247) 11,646 8,778Other noncash credits, net 3,881 3,372 (969)Changes in assets and liabilities:
Increase in trade accounts receivable (9,675) (20,254) (4,545)Increase in inventories (22,506) (18,106) (7,403)Increase in other assets (14,885) (3,861) (10,880)Increase in other liabilities 23,820 7,058 6,242Increase in accounts payable 20,214 18,134 818Increase in accrued liabilities 61,855 25,785 7,239
ppppppppppppppppppppppppppppppppppppppppppppppppppppppp ppppppppppppppppppppppppppppppppppppppppppppppppppppppp ppppppppppppppppppppppppppppppppppppppppppppppppppppppp
Net cash provided by operating activities 544,263 454,533 226,369ppppppppppppppppppppppppppppppppppppppppppppppppppppppp ppppppppppppppppppppppppppppppppppppppppppppppppppppppp ppppppppppppppppppppppppppppppppppppppppppppppppppppppp
CASH FLOWS FROM I NVESTI NG ACTIVITIES
Purchases of property and equipment (94,592) (73,659) (61,857)Acquisition of joint venture (228,431) – –Proceeds from disposition of property and equipment 18 58 27Purchases of investments (379,530) (301,723) –Maturities of investments 330,703 – –
ppppppppppppppppppppppppppppppppppppppppppppppppppppppp ppppppppppppppppppppppppppppppppppppppppppppppppppppppp ppppppppppppppppppppppppppppppppppppppppppppppppppppppp
Net cash used in investing activities (371,832) (375,324) (61,830)ppppppppppppppppppppppppppppppppppppppppppppppppppppppp ppppppppppppppppppppppppppppppppppppppppppppppppppppppp ppppppppppppppppppppppppppppppppppppppppppppppppppppppp
CASH FLOWS FROM FI NANCI NG ACTIVITIES
Repurchase of common stock (264,971) (54,954) (49,947)Distribution of earnings to joint venture shareholders (57,403) – –Repayment of joint venture partner contribution (15,524) – –Repayment of long-term debt (115) (80) (75)Borrowings on revolving credit facility 359,503 168,865 63,164Repayments of revolving credit facility (348,910) (193,637) (70,862)Proceeds from exercise of stock options 46,835 34,141 28,395
ppppppppppppppppppppppppppppppppppppppppppppppppppppppp ppppppppppppppppppppppppppppppppppppppppppppppppppppppp ppppppppppppppppppppppppppppppppppppppppppppppppppppppp
Net cash used in f inancing activities (280,585) (45,665) (29,325)ppppppppppppppppppppppppppppppppppppppppppppppppppppppp ppppppppppppppppppppppppppppppppppppppppppppppppppppppp ppppppppppppppppppppppppppppppppppppppppppppppppppppppp
(Decrease) increase in cash and cash equivalents (108,154) 33,544 135,214Cash and cash equivalents at beginning of period 262,720 229,176 93,962
ppppppppppppppppppppppppppppppppppppppppppppppppppppppp ppppppppppppppppppppppppppppppppppppppppppppppppppppppp ppppppppppppppppppppppppppppppppppppppppppppppppppppppp
Cash and cash equivalents at end of period $ 154,566 $ 262,720 $ 229,176pppppppppppppp pppppppppppppp pppppppppppppp
Cash paid for income taxes $ 162,702 $ 33,136 $ 56,083pppppppppppppp pppppppppppppp pppppppppppppp
Cash paid for interest $ 238 $ 330 $ 679pppppppppppppp pppppppppppppp pppppppppppppp
(1) 53-week f iscal year
See accompanying Notes to Consolidated Financial Statements
Results
CO
AC
H, IN
C. A
R 2
00
5
35`
Notes to Consolidated Financial Statements (DOLLARS AND SHARES IN THOUSANDS, E XCEPT PER SHARE DATA)
1. NATUR E OF OPERATIONS AND SIGNIFICANT ACCOUNTI NG POLICIES
N AT U R E O F O P E R AT I O N S
Coach, Inc. (the “Company”) designs, produces and markets high-quality, modern American classic accessories. The Company’sprimary product offerings, manufactured by third-party suppliers, include handbags, accessories, business cases, outerwear andrelated accessories and weekend and travel accessories. Coach’s products are sold through direct-to-consumer channels, includingCompany-operated retail and factory stores, its online store and its catalogs, as well as through indirect channels, including depart-ment store locations in the United States, international department stores, freestanding retail locations and specialty retailers andretail and factory store locations operated by Coach Japan, Inc.
S I G N I F I C A N T A C C O U N T I N G P O L I C I E S
F I S C A L Y E A R The Company’s f iscal year ends on the Saturday closest to June 30. Unless otherwise stated, references to years inthe f inancial statements relate to f iscal years. The f iscal years ended July 2, 2005 (“f iscal 2005”) and June 28, 2003 (“f iscal 2003”)were each 52-week periods, whereas the f iscal year ended July 3, 2004 (“f iscal 2004”) was a 53-week period.
U S E O F E S T I M AT E S The preparation of f inancial statements in conformity with accounting principles generally accepted in theUnited States of America requires management to make estimates and assumptions that affect the reported amounts of assets andliabilities and disclosure of contingent assets and liabilities at the date of the f inancial statements as well as the reported amounts ofrevenues and expenses during the reporting period. The level of uncertainty in estimates and assumptions increases with thelength of time until the underlying transactions are completed. Actual results could dif fer from estimates in amounts that may bematerial to the f inancial statements.
P R I N C I P L E S O F C O N S O L I D AT I O N The consolidated f inancial statements include the accounts of the Company and all subsidiariesunder the control of the Company, including Coach Japan, Inc. All signif icant intercompany transactions and balances are elimi-nated in consolidation.
C A S H A N D C A S H E Q U I V A L E N T S Cash and cash equivalents consist of cash balances and highly liquid investments with a maturity ofless than 90 days.
I N V E S T M E N T S Investments consist of U.S. government and agency debt securities as well as municipal government and corporatedebt securities. These securities are classif ied as held to maturity, as the Company has both the ability and the intent to hold thesesecurities until maturity. Investments are recorded at amortized cost. Premiums are amortized and discounts are accreted over thelives of the related securities as adjustments to interest income, using the effective interest method. Dividend and interest incomeare recognized when earned.
C O N C E N T R AT I O N O F C R E D I T R I S K Financial instruments that potentially expose Coach to concentration of credit r isk consist primarily of cash investments and accounts receivable. The Company places its cash investments with high-credit quality f inancial institutions and currently invests primarily in U.S. government and agency debt securities, municipal government and corporate debtsecurities, and bank money market funds placed with major banks and financial institutions. Accounts receivable is generally diversif ied due to the number of entities comprising Coach’s customer base and their dispersion across many geographical regions.The Company’s allowance for bad debts, returns and allowances was $4,124 at July 2, 2005 and $5,456 at July 3, 2004. TheCompany believes no significant concentration of credit risk exists with respect to these cash investments and accounts receivable.

N O T E S C O N T I N U E D
36
I N V E N T O R I E S Inventories consist primarily of f inished goods. U.S. inventories are valued at the lower of cost (determined by the f irst-in, f irst-out method (“FIFO”)) or market. Inventories in Japan are valued at the lower of cost (determined by the last-in, f irst-out method (“LIFO”)) or market. At the end of f iscal 2005 and fiscal 2004, inventories recorded at LIFO were $17 lower and$2,409 higher, respectively, than if they were valued at FIFO. Inventories valued under LIFO amounted to $40,861 and $34,508 in f iscal 2005 and 2004, respectively. Inventory costs include material, conversion costs, freight and duties.
P R O P E R T Y A N D E Q U I P M E N T Property and equipment are stated at cost less accumulated depreciation. Depreciation is calculatedon a straight-line basis over the estimated useful lives of the assets. Machinery and equipment are depreciated over lives of f ive toseven years and furniture and f ixtures are depreciated over lives of three to f ive years. Leasehold improvements are amortized overthe shorter of their estimated useful lives or the related lease terms. Maintenance and repair costs are charged to earnings asincurred while expenditures for major renewals and improvements are capitalized. Upon the disposition of property and equipment,the cost and related accumulated depreciation are removed from the accounts.
O P E R AT I N G L E A S E S The Company leases retail stores and off ice space under operating leases. The majority of the Company’slease agreements provide for tenant improvement allowances, rent escalation clauses and/or contingent rent provisions. In f iscal 2005, the Company conformed its accounting for operating leases and leasehold improvements to Statement of FinancialAccounting Standards (“SFAS”) No. 13 and its related interpretations as clarif ied by the Office of the Chief Accountant of theSecurities and Exchange Commission to the American Institute of Certif ied Public Accountants on February 7, 2005.
Tenant improvement allowances are recorded as a deferred lease credit on the balance sheet and amortized over the lease term,which is consistent with the amortization period for the constructed assets. Historically, the consolidated balance sheets ref lectedthese allowances as a reduction of capital expenditures and the carrying value of f ixed assets and the consolidated statements ofcash f lows ref lected tenant improvement allowances as a reduction of capital expenditures within investing activities. Since theimpact of this change in accounting was not material to any previously reported f iscal year, the cumulative effect was recorded inthe third quarter of f iscal 2005.
In addition to the above, the Company recorded a cumulative, noncash charge in the third quarter of f iscal 2005 to ref lect theimpact of recording rent expense prior to the store opening (during the construction buildout period). Previously, the Company recognized the straight-line rent expense for leases beginning on the earlier of the store opening date or lease commencementdate, which generally had the effect of excluding the buildout period of its stores from the calculation of the period over which itexpensed rent. The Company now records rent expense when it takes possession of a store to begin its buildout, which generallyoccurs before the stated commencement of the lease term and is approximately 60 to 90 days prior to the opening of the store. Theadjustment resulted in a cumulative, noncash charge to rent expense of approximately $4,800 during f iscal 2005, of which approxi-mately $4,300 related to prior periods.
G O O D W I L L A N D OT H E R I N TA N G I B L E A S S E T S The Company adopted SFAS No.142, “Goodwill and Other Intangible Assets,” effectivewith the beginning of f iscal 2002. In accordance with SFAS No. 142, the Company’s goodwill account is no longer amortized butrather is evaluated for impairment annually or more frequently if events or changes in circumstances indicate that the asset might beimpaired. Based on this annual evaluation, the Company has concluded that there is no impairment of its goodwill or indefinite lifeintangible assets.
V A L U AT I O N O F LO N G - L I V E D A S S E T S In accordance with SFAS No. 144, “Accounting for the Impairment or Disposal of Long-LivedAssets,” which the Company adopted effective with the beginning of f iscal 2002, the Company assesses the carrying value of itslong-lived assets for possible impairment based on a review of forecasted operating cash f lows and the profitability of the relatedbusiness. The Company did not record any impairment losses in f iscal 2005, f iscal 2004 or f iscal 2003.

Results
CO
AC
H, IN
C. A
R 2
00
5
37`
M I N O R I T Y I N T E R E S T I N S U B S I D I A R Y Minority interest in the statements of income represents Sumitomo Corporation’s share of theearnings in Coach Japan. The minority interest in the consolidated balance sheets as of July 3, 2004 ref lects the original investmentby Sumitomo in that consolidated subsidiary, along with its proportional share of the cumulative income, net of tax. The Companyacquired Sumitomo’s share of the equity in Coach Japan, Inc. on July1, 2005.
R E V E N U E R E C O G N I T I O N Sales are recognized at the point of sale, which occurs when merchandise is sold in an over-the-counterconsumer transaction or, for the wholesale, Internet and catalog channels, upon shipment of merchandise, when title passes to thecustomer. Allowances for estimated uncollectible accounts, discounts and returns are provided when sales are recorded. Royaltyrevenues are earned through license agreements with manufacturers of other consumer products that incorporate the Coachbrand. Revenue earned under these contracts is recognized based upon reported sales from the licensee.
A D V E R T I S I N G Advertising costs, which include media and production, totaled $28,112, $21,574 and $19,885 in f iscal years 2005,2004 and 2003, respectively, and are included in selling, general and administrative expenses. Advertising costs are expensedwhen the advertising f irst appears.
S H I P P I N G A N D H A N D L I N G Shipping and handling costs incurred were $16,188, $13,080 and $11,290 in f iscal years 2005, 2004 and2003, respectively, and are included in selling, general and administrative expenses.
I N C O M E TA X E S The Company accounts for income taxes in accordance with SFAS No.109, “Accounting for Income Taxes.” UnderSFAS No. 109, a deferred tax liability or asset is recognized for the estimated future tax consequences of temporary dif ferencesbetween the carrying amounts of assets and liabilities in the f inancial statements and their respective tax bases. As of the fourthquarter of f iscal 2005, the Company intends to permanently reinvest the controlled foreign corporation’s undistributed earningsoutside the United States. As permitted in the Accounting Principles Board (“APB”) Opinion No. 23, “Accounting for Income Taxes –Special Areas,” the Company does not provide U.S. income taxes on these earnings.
S T O C K- B A S E D C O M P E N S AT I O N The Company’s stock-based compensation plans and the employee stock purchase plan, as morefully described in Note 8, “Stock-Based Compensation,” are accounted for in accordance with APB Opinion No. 25, “Accounting forStock Issued to Employees,” and related Interpretations. Accordingly, no compensation cost is recognized for stock options andreplacement stock options issued under stock-based compensation plans or for shares purchased under the employee stock pur-chase plan. The compensation cost that has been charged against income, ref lecting amortization of restricted stock units, was$6,633, $4,410 and $1,568 in fiscal 2005, 2004 and 2003, respectively. The following illustrates the effect on net income and earningsper share as if the fair value based method of accounting, defined in SFAS No.123, “Accounting for Stock-Based Compensation,”had been applied:
F ISCAL YEAR ENDED JULY 2, 2005 JULY 3, 2004 JUNE 28, 2003ppppppppppppppppppppppppppppppppppppppppppppppppppppppp ppppppppppppppppppppppppppppppppppppppppppppppppppppppp ppppppppppppppppppppppppppppppppppppppppppppppppppppppp
Net income, as reported $ 388,652 $ 261,748 $ 146,628
Deduct:
Total stock-based employee compensation expense determined under
the fair value based method for all awards, net of related tax effects (30,040) (23,799) (15,947)ppppppppppppppppppppppppppppppppppppppppppppppppppppppp ppppppppppppppppppppppppppppppppppppppppppppppppppppppp ppppppppppppppppppppppppppppppppppppppppppppppppppppppp
Pro forma net income $ 358,612 $ 237,949 $ 130,681pppppppppppppp pppppppppppppp pppppppppppppp
Earnings per share:
Basic – as reported $ 1.03 $ 0.70 $ 0.41pppppppppppppp pppppppppppppp pppppppppppppp
Basic – pro forma $ 0.95 $ 0.64 $ 0.36pppppppppppppp pppppppppppppp pppppppppppppp
Diluted – as reported $ 1.00 $ 0.68 $ 0.39pppppppppppppp pppppppppppppp pppppppppppppp
Diluted – pro forma $ 0.92 $ 0.62 $ 0.35pppppppppppppp pppppppppppppp pppppppppppppp

N O T E S C O N T I N U E D
38
FA I R V A L U E O F F I N A N C I A L I N S T R U M E N T S The fair value of the revolving credit facility at July 2, 2005 and July 3, 2004 approximatedits carrying value due to its f loating interest rates. The Company has evaluated its Industrial Revenue Bond and believes, based onthe interest rate, related term and maturity, that the fair value of such instrument approximates its carrying amount. As of July 2,2005 and July 3, 2004, the carrying values of cash and cash equivalents, investments, trade accounts receivable, accounts payableand accrued liabilities approximated their values due to the short-term maturities of these accounts. See Note 7, “Investments,” forthe fair values of the Company’s investments as of July 2, 2005.
Coach, through Coach Japan, enters into foreign currency forward contracts that hedge certain U.S. dollar denominated inventoryrisk, that have been designated for hedge accounting. The fair value of these contracts is recognized in other comprehensiveincome. The fair value of the foreign currency derivative is based on its market value as determined by an independent party.However, considerable judgment is required in developing estimates of fair value. Accordingly, the estimates presented herein arenot necessarily indicative of the amounts that Coach could settle in a current market exchange. The use of dif ferent marketassumptions or methodologies could affect the estimated fair value.
F O R E I G N C U R R E N C Y The functional currency of the Company’s foreign operations is the applicable local currency. Assets and lia-bilities are translated into U.S. dollars using the current exchange rates in effect at the balance sheet date, while revenues andexpenses are translated at the weighted-average exchange rates for the period. The resulting translation adjustments are recordedas a component of accumulated other comprehensive income (loss) within stockholders’ equity. Translation adjustment losses in f iscal 2005 were $2,331 compared to translation adjustment gains in f iscal 2004 of $2,892. Translation adjustment losses in f iscal 2003 were $348.
N E T I N C O M E P E R S H A R E Basic net income per share was calculated by dividing net income by the weighted-average number ofshares outstanding during the period. Diluted net income per share was calculated similarly but includes potential dilution from theexercise of stock options and stock awards.
S T O C K S P L I T In May 2002, Coach’s Board of Directors authorized a two-for-one split of the Company’s stock, to be effected in theform of a special dividend of one share of the Company’s common stock for each share outstanding. The additional shares issuedas a result of the stock split were distributed on July 3, 2002 to stockholders of record on June19, 2002.
In August 2003, Coach’s Board of Directors authorized a two-for-one split of the Company’s common stock, to be effected in theform of a special dividend of one share of the Company’s common stock for each share outstanding. The additional shares issuedas a result of the stock split were distributed on October 1, 2003 to stockholders of record on September17, 2003.
In January 2005, Coach’s Board of Directors authorized a two-for-one stock split of the Company’s common stock, to be effected inthe form of a special dividend of one share of the Company’s common stock for each share outstanding. The additional sharesissued as a result of the stock split were distributed on April 4, 2005 to stockholders of record on March 21, 2005.
The effect of these stock splits on the number of shares and earnings per share was retroactively applied to all periods presented.
R E C E N T A C C O U N T I N G P R O N O U N C E M E N T S In October 2004, the Emerging Issues Task Force (“EITF”) issued its abstract No. 04-1“Accounting for Preexisting Relationships between the Parties to a Business Combination.” EITF 04-1 addresses the appropriateaccounting treatment for portions of the acquisition costs of an entity that may be deemed to apply to elements of a preexistingbusiness relationship between the acquiring company and the target company. EITF 04-1 is effective for combinations consum-mated after October 2004. The adoption of EITF 04-1had no effect on historical f inancial statements.
In November 2004, the Financial Accounting Standards Board (“FASB”) issued SFAS No.151, “Inventory Costs – an amendment ofARB No. 43, Chapter 4.” SFAS151 is an amendment of Accounting Research Board Opinion No. 43 and sets standards for the treat-ment of abnormal amounts of idle facility expense, freight, handling costs and spoilage. SFAS 151 is effective for f iscal years begin-ning after June15, 2005. The Company is currently evaluating the impact of SFAS151on the f inancial statements.

Results
CO
AC
H, IN
C. A
R 2
00
5
39`
In December 2004, the FASB issued Staff Position No. 109-2, “Accounting and Disclosure Guidance for the Foreign EarningsRepatriation Provision within the American Jobs Creation Act of 2004” (“FSP No. 109-2”). FSP No. 109-2 provides guidance underSFAS No. 109, “Accounting for Income Taxes,” with respect to recording the potential impact of the repatriation provisions of theAmerican Jobs Creation Act of 2004 (the “Jobs Act”) on enterprises’ income tax expense and deferred tax liability. FSP109-2 statesthat an enterprise is allowed time beyond the f inancial reporting period of enactment to evaluate the effect of the Jobs Act on itsplan for reinvestment or repatriation of foreign earnings for purposes of applying SFAS 109. The Company does not plan to makeany dividends under this provision but is still evaluating the impact of FSP109-2 on its consolidated f inancial statements.
In December 2004, the FASB issued SFAS No.153, “Exchanges of Nonmonetary Assets – an amendment of APB Opinion No. 29,”which eliminates certain narrow differences between APB 29 and international accounting standards. SFAS 153 is effective for fiscalperiods beginning on or after June 15, 2005. The adoption of SFAS 153 is not expected to have a material impact on the Company’s consolidated financial statements.
On December16, 2004, the FASB issued SFAS No.123 (revised 2004), “Share-Based Payment” (“SFAS 123R”), which is a revision ofSFAS 123, “Accounting for Stock-Based Compensation.” SFAS 123R supersedes APB 25, “Accounting for Stock Issued toEmployees.” The pronouncement requires an entity to measure the cost of employee services received in exchange for an award ofequity instruments based on the grant-date fair value of the award. That cost will be recognized over the period during which anemployee is required to provide service in exchange for the award – the requisite service period (typically the vesting period). SFAS123R is effective as of the beginning of the f irst interim or annual reporting period that begins after June 15, 2005. The Company iscurrently evaluating the effect of SFAS 123R on its f inancial statements with the intent of implementing this standard in f iscal 2006.
In March 2005, the SEC issued Staff Accounting Bulletin (“SAB”) No. 107, “Share-Based Payment.” SAB 107 expresses views of theSEC staff regarding the interaction between SFAS 123R and certain SEC rules and regulations and provides the staff’s viewsregarding the valuation of share-based payments arrangements. Subsequently, the SEC decided to delay the required implemen-tation of SFAS123R to f iscal years beginning after June15, 2005. The Company is currently evaluating the effect of SFAS 123R andSAB107 on its f inancial statements with the intent of implementing this standard in f iscal 2006.
In March 2005, the FASB issued Statement of Financial Accounting Standards Interpretation No. 47 (“FIN 47”), “Accounting forConditional Asset Retirement Obligations.” FIN 47 provides clarif ication regarding the meaning of the term “conditional asset retire-ment obligation” as used in FASB 143, “Accounting for Asset Retirement Obligations.” The Company is currently evaluating theimpact of FIN 47 on the f inancial statements.
In May 2005, the FASB issued SFAS No.154, “Accounting Changes and Error Corrections – a replacement of APB Opinion No. 20and FASB Statement No. 3.” SFAS 154 provides guidance on the accounting for and reporting of accounting changes and error corrections. This statement is effective for accounting changes and corrections of errors made in f iscal years beginning afterDecember15, 2005. Early adoption is permitted. The Company will adopt SFAS154 in the required period.
In June 2005, the EITF reached consensus on EITF 05-6, “Determining the Amortization Period for Leasehold Improvements.”Under EITF 05-6, leasehold improvements placed in service signif icantly after and not contemplated at, or near, the beginning of thelease term, should be amortized over the lesser of the useful life of the assets or a term that includes renewals that are reasonablyassured at the date the leasehold improvements are purchased. EITF 05-6 is effective for periods beginning after June 29, 2005 andis not expected to have a material impact on the consolidated f inancial statements.
R E C L A S S I F I C AT I O N S Certain prior year amounts have been reclassif ied to conform with the current year presentation.

N O T E S C O N T I N U E D
40
2. BA LANCE SH EET COMPONENTS
The components of certain balance sheet accounts are as follows:
JULY 2, 2005 JULY 3, 2004ppppppppppppppppppppppppppppppppppppppppppppppppppppppp ppppppppppppppppppppppppppppppppppppppppppppppppppppppp
PROPERTY AND EQUIPMENT
Machinery and equipment $ 7,618 $ 8,346
Furniture and f ixtures 148,252 140,005
Leasehold improvements 243,784 212,000
Construction in progress 21,428 11,522
Less: accumulated depreciation (217,220) (207,582)ppppppppppppppppppppppppppppppppppppppppppppppppppppppp ppppppppppppppppppppppppppppppppppppppppppppppppppppppp
Total property and equipment, net $ 203,862 $ 164,291pppppppppppppp pppppppppppppp
ACCRUED LIABILITIES
Income and other taxes $ 49,180 $ 16,699
Payroll and employee benefits 65,653 54,291
Operating expenses 70,669 52,657ppppppppppppppppppppppppppppppppppppppppppppppppppppppp ppppppppppppppppppppppppppppppppppppppppppppppppppppppp
Total accrued liabilities $ 185,502 $ 123,647pppppppppppppp pppppppppppppp
3. I NCOME TAXES
The provisions for income taxes computed by applying the U.S. statutory rate to income before taxes as reconciled to the actualprovisions were:
F ISCAL YEAR ENDED JULY 2, 2005 JULY 3, 2004 JUNE 28, 2003pppppppppppppppppppppppppppppppppppppppppppppppppppppppppppppppppppppppppppppppppppppppppppppppppppppppppppppppppppppppp pppppppppppppppppppppppppppppppppppppppppppppppppppppppppppppppppppppppppppppppppppppppppppppppppppppppppppppppppppppppp pppppppppppppppppppppppppppppppppppppppppppppppppppppppppppppppppppppppppppppppppppppppppppppppppppppppppppppppppppppppp
AMOUNT PERCENTAGE AMOUNT PERCENTAGE AMOUNT PERCENTAGEppppppppppppppppppppppppppppppppppppppppppppppppppppppp ppppppppppppppppppppppppppppppppppppppppppppppppppppppp ppppppppppppppppppppppppppppppppppppppppppppppppppppppp ppppppppppppppppppppppppppppppppppppppppppppppppppppppp ppppppppppppppppppppppppppppppppppppppppppppppppppppppp ppppppppppppppppppppppppppppppppppppppppppppppppppppppp
Income (loss) before provision for
income taxes and minority interest:
United States $ 584,695 91.7%$ 388,862 86.9%$ 224,380 91.7%
Foreign 52,875 8.3 58,795 13.1 20,441 8.3ppppppppppppppppppppppppppppppppppppppppppppppppppppppp ppppppppppppppppppppppppppppppppppppppppppppppppppppppp ppppppppppppppppppppppppppppppppppppppppppppppppppppppp ppppppppppppppppppppppppppppppppppppppppppppppppppppppp ppppppppppppppppppppppppppppppppppppppppppppppppppppppp ppppppppppppppppppppppppppppppppppppppppppppppppppppppp
Total income before provision for
income taxes and minority interest $ 637,570 100.0%$ 447,657 100.0%$ 244,821 100.0%pppppppppppppp pppppppppppppp pppppppppppppp pppppppppppppp pppppppppppppp pppppppppppppp
Tax expense at U.S. statutory rate $ 223,150 35.0%$ 156,680 35.0%$ 85,687 35.0%
State taxes, net of federal benefit 33,279 5.2 16,179 3.6 10,358 4.2
Reversal of deferred U.S. taxes on
foreign earnings (16,247) (2.5) – – – –
Nontaxable foreign sourced income (4,458) (0.7) (5,182) (1.2) (2,069) (0.8)
Other, net (447) (0.1) 189 0.0 (3,391) (1.3)ppppppppppppppppppppppppppppppppppppppppppppppppppppppp ppppppppppppppppppppppppppppppppppppppppppppppppppppppp ppppppppppppppppppppppppppppppppppppppppppppppppppppppp ppppppppppppppppppppppppppppppppppppppppppppppppppppppp ppppppppppppppppppppppppppppppppppppppppppppppppppppppp ppppppppppppppppppppppppppppppppppppppppppppppppppppppp
Taxes at effective worldwide rates $ 235,277 36.9%$ 167,866 37.5%$ 90,585 37.0%pppppppppppppp pppppppppppppp pppppppppppppp pppppppppppppp pppppppppppppp pppppppppppppp

Results
CO
AC
H, IN
C. A
R 2
00
5
41`
Current and deferred tax provisions (benefits) were:
F ISCAL YEAR ENDED JULY 2, 2005 JULY 3, 2004 JUNE 28, 2003pppppppppppppppppppppppppppppppppppppppppppppppppppppppppppppppppppppppppppppppppppppppppppppppppppppppppppppppppppppppp pppppppppppppppppppppppppppppppppppppppppppppppppppppppppppppppppppppppppppppppppppppppppppppppppppppppppppppppppppppppp pppppppppppppppppppppppppppppppppppppppppppppppppppppppppppppppppppppppppppppppppppppppppppppppppppppppppppppppppppppppp
CURRENT DEFERRED CURRENT DEFERRED CURRENT DEFERREDppppppppppppppppppppppppppppppppppppppppppppppppppppppp ppppppppppppppppppppppppppppppppppppppppppppppppppppppp ppppppppppppppppppppppppppppppppppppppppppppppppppppppp ppppppppppppppppppppppppppppppppppppppppppppppppppppppp ppppppppppppppppppppppppppppppppppppppppppppppppppppppp ppppppppppppppppppppppppppppppppppppppppppppppppppppppp
Federal $ 184,318 $ (29,744) $ 128,449 $ (7,314) $ 67,432 $ 1,728
Puerto Rico – – – – 31 (1,182)
Foreign 28,228 1,276 2,302 19,538 402 6,239
State 60,849 (9,650) 25,468 (577) 13,942 1,993ppppppppppppppppppppppppppppppppppppppppppppppppppppppp ppppppppppppppppppppppppppppppppppppppppppppppppppppppp ppppppppppppppppppppppppppppppppppppppppppppppppppppppp ppppppppppppppppppppppppppppppppppppppppppppppppppppppp ppppppppppppppppppppppppppppppppppppppppppppppppppppppp ppppppppppppppppppppppppppppppppppppppppppppppppppppppp
Total current and deferred tax
provisions (benefits) $ 273,395 $ (38,118) $ 156,219 $ 11,647 $ 81,807 $ 8,778pppppppppppppp pppppppppppppp pppppppppppppp pppppppppppppp pppppppppppppp pppppppppppppp
The following are the components of the deferred tax provisions (benefits) occurring as a result of transactions being reported in dif ferent years for f inancial and tax reporting:
F ISCAL YEAR ENDED JULY 2, 2005 JULY 3, 2004 JUNE 28, 2003ppppppppppppppppppppppppppppppppppppppppppppppppppppppp ppppppppppppppppppppppppppppppppppppppppppppppppppppppp ppppppppppppppppppppppppppppppppppppppppppppppppppppppp
DEFERRED TAX PROVISIONS (BENEFITS)
Depreciation $ (9,546) $ (3) $ 2,269
Employee benefits (2,945) (3,267) 1,048
Advertising accruals 2 (280) 348
Nondeductible reserves (6,681) (5,228) (2,025)
Earnings of foreign subsidiaries (9,226) 23,920 9,296
Other, net (9,722) (3,495) (2,158)ppppppppppppppppppppppppppppppppppppppppppppppppppppppp ppppppppppppppppppppppppppppppppppppppppppppppppppppppp ppppppppppppppppppppppppppppppppppppppppppppppppppppppp
Total deferred tax provisions (benefits) $ (38,118) $ 11,647 $ 8,778pppppppppppppp pppppppppppppp pppppppppppppp
The deferred tax assets and liabilities at the respective year-ends were as follows:
F ISCAL YEAR ENDED JULY 2, 2005 JULY 3, 2004ppppppppppppppppppppppppppppppppppppppppppppppppppppppp ppppppppppppppppppppppppppppppppppppppppppppppppppppppp
DEFERRED TAX ASSETS
Reserves not deductible until paid $ 45,978 $ 31,060
Pension and other employee benefits 11,289 7,041
Property, plant and equipment 21,456 11,499
Other 3,617 5,212ppppppppppppppppppppppppppppppppppppppppppppppppppppppp ppppppppppppppppppppppppppppppppppppppppppppppppppppppp
Total deferred tax assets $ 82,340 $ 54,812pppppppppppppp pppppppppppppp
DEFERRED TAX LIABILITIES
Earnings of foreign subsidiaries $ – $ 29,578
Equity adjustments 2,644 –
Other 4,719 6,504ppppppppppppppppppppppppppppppppppppppppppppppppppppppp ppppppppppppppppppppppppppppppppppppppppppppppppppppppp
Total deferred tax liabilities $ 7,363 $ 36,082pppppppppppppp pppppppppppppp
Net deferred tax assets $ 74,977 $ 18,730pppppppppppppp pppppppppppppp
The Company has received tax benefit from the exercise of stock options. This benefit is ref lected as a credit to stockholders’equity and not ref lected in the provision for income taxes. The amount of this benefit was $78,480, $106,458 and $41,503 in f iscal 2005, 2004 and 2003, respectively.

N O T E S C O N T I N U E D
42
On July 1, 2005, the Company acquired the minority interest that it had not previously owned in Coach Japan, Inc., becoming the100% owner of the Japanese operation. The Company currently does not intend to distribute to the United States the earnings of the Japanese company, but will reinvest such earnings offshore. As a result, the excess provision for the tax that would have beendue upon the distribution of the Japanese company’s earnings accumulated through July 2, 2005 was reversed. The impact of thisreversal on the current year provision for income taxes was a reduction of $16,247.
The American Jobs Creation Act of 2004 was signed into law on October 22, 2004. The Act included a special one-time 85%dividends-received deduction (the “Repatriation Provision”) on the repatriation of certain foreign earnings to a U.S. taxpayer provided that specif ied conditions and restrictions are satisf ied. As Coach does not intend to repatriate the foreign earnings, theCompany expects that the Repatriation Provision will have no effect on its f inancial statements.
Signif icant judgment is required in determining the worldwide provision for income taxes, and there are many transactions forwhich the ultimate tax outcome is uncertain. It is the Company’s policy to establish provisions for taxes that may become payable infuture years as a result of an examination by tax authorities. The Company establishes the provisions based upon management’sassessment of exposure associated with permanent tax dif ferences and tax credits. The provisions are analyzed periodically andadjustments are made as events occur that warrant adjustments to those provisions.
4. DEBT
R E V O LV I N G C R E D I T FA C I L I T I E S On October 16, 2003, Coach, certain lenders and Bank of America, N.A., as primary lender andadministrative agent, renewed the $100,000 senior unsecured three-year revolving credit facility (the “Bank of America facility”),extending the facility expiration to October16, 2006. At Coach’s request, the Bank of America facility can be expanded to $125,000.On June 23, 2005, this facility was extended for one additional year, to October16, 2007. This facility is available for seasonal work-ing capital requirements or general corporate purposes and may be prepaid without penalty or premium.
During f iscal 2005 and 2004, there were no borrowings under the Bank of America facility. As of July 2, 2005, there were no outstanding borrowings under the Bank of America facility.
Coach pays a commitment fee of 10 to 25 basis points based on any unused amounts of the Bank of America facility. The initial commitment fee was15 basis points. At July 2, 2005, the commitment fee was12.5 basis points. The initial LIBOR margin under theBank of America facility was 62.5 basis points. At July 2, 2005, the LIBOR margin was 55 basis points, ref lecting an improvement inour f ixed-charge coverage ratio.
The Bank of America facility prohibits Coach from paying dividends while the credit facility is in place, with certain exceptions. Anyfuture determination to pay cash dividends will be at the discretion of Coach’s Board of Directors and will be dependent upon Coach’sfinancial condition, operating results, capital requirements and such other factors as the Board of Directors deems relevant.
The Bank of America facility contains various covenants and customary events of default. The Company has been in compliancewith all covenants since its inception.
To provide funding for working capital and general corporate purposes, Coach Japan entered into credit facilities with severalJapanese f inancial institutions. These facilities allow a maximum borrowing of 8.6 billion yen, or approximately $77,000, at July 2,2005. Interest is based on the Tokyo Interbank rate plus a margin of up to 50 basis points.
These facilities contain various covenants and customary events of default. Coach Japan has been in compliance with allcovenants since their inception. These facilities include automatic renewals based on compliance with the covenants. Coach, Inc.is not a guarantor on any of these facilities.

Results
CO
AC
H, IN
C. A
R 2
00
5
43`
During fiscal 2005 and 2004, the peak borrowings under the Japanese credit facilities were $50,461 and $36,084, respectively. As of July 2, 2005 and July 3, 2004, outstanding borrowings under the Japanese credit facilities were $12,292 and $1,699, respectively.
LO N G -T E R M D E B T Coach is party to an Industrial Revenue Bond related to its Jacksonville, Florida, facility. This loan bears interest at8.77%. Principal and interest payments are made semiannually, with the f inal payment due in 2014. As of July 2, 2005 and July 3,2004, the remaining balance on the loan was $3,420 and $3,535, respectively. Future principal payments under the IndustrialRevenue Bond are as follows:
F ISCAL YEAR AMOUNTppppppppppppppppppppppppppppppppppppppppppppppppppppppp
2006 $ 150
2007 170
2008 235
2009 285
2010 335
Subsequent to 2010 2,245ppppppppppppppppppppppppppppppppppppppppppppppppppppppp
Total $ 3,420pppppppppppppp
5. LEASES
Coach leases certain off ice, distribution and retail facilities. The lease agreements, which expire at various dates through 2019, aresubject, in some cases, to renewal options and provide for the payment of taxes, insurance and maintenance. Certain leases contain escalation clauses resulting from the pass-through of increases in operating costs, property taxes and the effect on costsfrom changes in consumer price indices. Certain rentals are also contingent upon factors such as sales. Rent-free periods andscheduled rent increases are recorded as components of rent expense on a straight-line basis over the related terms of suchleases. Contingent rentals are recognized when the achievement of the target (i.e., sales levels), which triggers the related payment,is considered probable. Rent expense for the Company’s operating leases consisted of the following:
F ISCAL YEAR ENDED JULY 2, 2005 JULY 3, 2004 JUNE 28, 2003ppppppppppppppppppppppppppppppppppppppppppppppppppppppp ppppppppppppppppppppppppppppppppppppppppppppppppppppppp ppppppppppppppppppppppppppppppppppppppppppppppppppppppp
Minimum rentals $ 73,283 $ 55,352 $ 47,098
Contingent rentals 12,101 7,555 4,885ppppppppppppppppppppppppppppppppppppppppppppppppppppppp ppppppppppppppppppppppppppppppppppppppppppppppppppppppp ppppppppppppppppppppppppppppppppppppppppppppppppppppppp
Total rent expense $ 85,384 $ 62,907 $ 51,983pppppppppppppp pppppppppppppp pppppppppppppp
Future minimum rental payments under noncancelable operating leases are as follows:
F ISCAL YEAR AMOUNTppppppppppppppppppppppppppppppppppppppppppppppppppppppp
2006 $ 62,597
2007 57,900
2008 57,173
2009 53,846
2010 48,538
Subsequent to 2010 175,000ppppppppppppppppppppppppppppppppppppppppppppppppppppppp
Total minimum future rental payments $ 455,054pppppppppppppp
Certain operating leases provide for renewal for periods of three to f ive years at their fair rental value at the time of renewal. In thenormal course of business, operating leases are generally renewed or replaced by new leases.
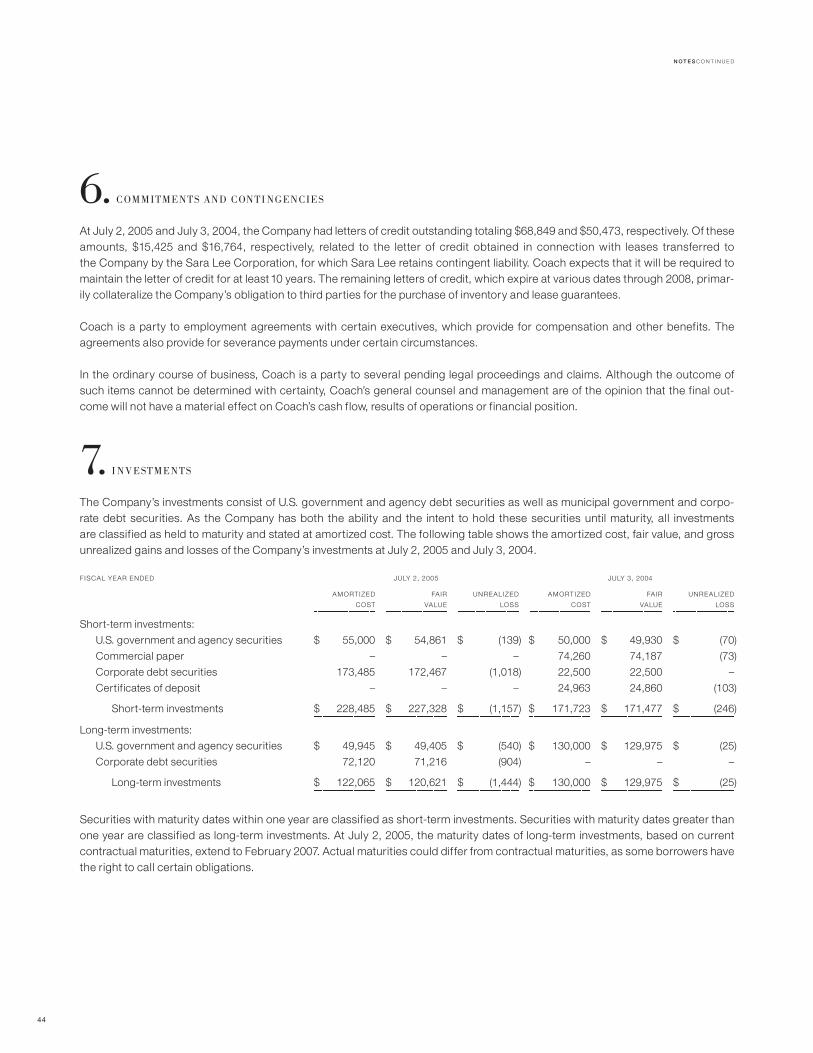
N O T E S C O N T I N U E D
44
6. COMMITMENTS AND CONTI NGENCIES
At July 2, 2005 and July 3, 2004, the Company had letters of credit outstanding totaling $68,849 and $50,473, respectively. Of theseamounts, $15,425 and $16,764, respectively, related to the letter of credit obtained in connection with leases transferred to the Company by the Sara Lee Corporation, for which Sara Lee retains contingent liability. Coach expects that it will be required to maintain the letter of credit for at least 10 years. The remaining letters of credit, which expire at various dates through 2008, primar-ily collateralize the Company’s obligation to third parties for the purchase of inventory and lease guarantees.
Coach is a party to employment agreements with certain executives, which provide for compensation and other benefits. Theagreements also provide for severance payments under certain circumstances.
In the ordinary course of business, Coach is a party to several pending legal proceedings and claims. Although the outcome ofsuch items cannot be determined with certainty, Coach’s general counsel and management are of the opinion that the f inal out-come will not have a material ef fect on Coach’s cash f low, results of operations or f inancial position.
7. I NVESTMENTS
The Company’s investments consist of U.S. government and agency debt securities as well as municipal government and corpo-rate debt securities. As the Company has both the ability and the intent to hold these securities until maturity, all investments are classif ied as held to maturity and stated at amortized cost. The following table shows the amortized cost, fair value, and gross unrealized gains and losses of the Company’s investments at July 2, 2005 and July 3, 2004.
F ISCAL YEAR ENDED JULY 2, 2005 JULY 3, 2004ppppppppppppppppppppppppppppppppppppppppppppppppppppppppppppppppppppppppppppppppppppppppppppppppppppppppppppppppppppppppppppppppppppppppppppppppppppppppppppppppppppppppppppppppppppppppp ppppppppppppppppppppppppppppppppppppppppppppppppppppppppppppppppppppppppppppppppppppppppppppppppppppppppppppppppppppppppppppppppppppppppppppppppppppppppppppppppppppppppppppppppppppppppp
AMORT IZED FAIR UNREALIZED AMORT IZED FAIR UNREALIZED
COST VALUE LOSS COST VALUE LOSSppppppppppppppppppppppppppppppppppppppppppppppppppppppp ppppppppppppppppppppppppppppppppppppppppppppppppppppppp ppppppppppppppppppppppppppppppppppppppppppppppppppppppp ppppppppppppppppppppppppppppppppppppppppppppppppppppppp ppppppppppppppppppppppppppppppppppppppppppppppppppppppp ppppppppppppppppppppppppppppppppppppppppppppppppppppppp
Short-term investments:
U.S. government and agency securities $ 55,000 $ 54,861 $ (139) $ 50,000 $ 49,930 $ (70)
Commercial paper – – – 74,260 74,187 (73)
Corporate debt securities 173,485 172,467 (1,018) 22,500 22,500 –
Certif icates of deposit – – – 24,963 24,860 (103)ppppppppppppppppppppppppppppppppppppppppppppppppppppppp ppppppppppppppppppppppppppppppppppppppppppppppppppppppp ppppppppppppppppppppppppppppppppppppppppppppppppppppppp ppppppppppppppppppppppppppppppppppppppppppppppppppppppp ppppppppppppppppppppppppppppppppppppppppppppppppppppppp ppppppppppppppppppppppppppppppppppppppppppppppppppppppp
Short-term investments $ 228,485 $ 227,328 $ (1,157) $ 171,723 $ 171,477 $ (246)pppppppppppppp pppppppppppppp pppppppppppppp pppppppppppppp pppppppppppppp pppppppppppppp
Long-term investments:
U.S. government and agency securities $ 49,945 $ 49,405 $ (540) $ 130,000 $ 129,975 $ (25)
Corporate debt securities 72,120 71,216 (904) – – –ppppppppppppppppppppppppppppppppppppppppppppppppppppppp ppppppppppppppppppppppppppppppppppppppppppppppppppppppp ppppppppppppppppppppppppppppppppppppppppppppppppppppppp ppppppppppppppppppppppppppppppppppppppppppppppppppppppp ppppppppppppppppppppppppppppppppppppppppppppppppppppppp ppppppppppppppppppppppppppppppppppppppppppppppppppppppp
Long-term investments $ 122,065 $ 120,621 $ (1,444) $ 130,000 $ 129,975 $ (25)pppppppppppppp pppppppppppppp pppppppppppppp pppppppppppppp pppppppppppppp pppppppppppppp
Securities with maturity dates within one year are classif ied as short-term investments. Securities with maturity dates greater thanone year are classif ied as long-term investments. At July 2, 2005, the maturity dates of long-term investments, based on currentcontractual maturities, extend to February 2007. Actual maturities could dif fer from contractual maturities, as some borrowers havethe right to call certain obligations.

Results
CO
AC
H, IN
C. A
R 2
00
5
45`
The dif ference between amortized cost and fair value is the result of unrealized gains and losses, caused primarily by interest ratef luctuations. The securities to which the unrealized losses relate have been in a continuous loss position for less than 12 months.The Company does not consider these investments to be other-than-temporarily impaired at July 2, 2005, as the Company hasboth the ability and the intent to hold these investments until a recovery of fair value, which may be at maturity.
8. STOCK-BASED COMPENSATION
C O A C H S T O C K- B A S E D P L A N S Coach maintains the 2000 Stock Incentive Plan, the 2000 Non-Employee Director Stock Plan and the2004 Stock Incentive Plan to award stock options and other forms of equity compensation to certain members of Coach manage-ment and the outside members of its Board of Directors. The 2000 Stock Incentive Plan and the 2000 Non-Employee Director StockPlan were approved by Coach’s stockholders during f iscal 2002. The 2004 Stock Incentive Plan was approved by Coach’s stock-holders during f iscal 2005. The exercise price of each stock option equals 100% of the market price of Coach’s stock on the date ofgrant and generally has a maximum term of 10 years. Options generally vest ratably over three years.
For options granted under Coach’s stock option plans prior to July 1, 2003, an active employee can receive a replacement stockoption equal to the number of shares surrendered upon a stock-for-stock exercise. The exercise price of the replacement option is100% of the market value at the date of exercise of the original option and will remain exercisable for the remaining term of the original option. Replacement stock options generally vest six months from the grant date. Replacement stock options of 7,029,11,264, and 7,360 were granted in f iscal 2005, 2004 and 2003, respectively.
A summary of options held by Coach employees under the Coach option plans is as follows:
NUMBER OF WE IGHTED- WE IGHTED-
COACH AVERAGE AVERAGE
OUTSTANDING E XERCISE E XERCISABLE E XERCISE
OPT IONS PRICE SHARES PRICE ppppppppppppppppppppppppppppppppppppppppppppppppppppppp ppppppppppppppppppppppppppppppppppppppppppppppppppppppp ppppppppppppppppppppppppppppppppppppppppppppppppppppppp ppppppppppppppppppppppppppppppppppppppppppppppppppppppp
Outstanding at June 29, 2002 40,040 $ 3.49 6,368 $ 3.41
Granted 19,040 7.67
Exercised (20,352) 3.76
Canceled/expired (3,668) 3.95ppppppppppppppppppppppppppppppppppppppppppppppppppppppp
Outstanding at June 28, 2003 35,060 $ 5.56 5,748 $ 5.43
Granted 22,748 16.55
Exercised (24,120) 8.12
Canceled/expired (1,004) 6.87ppppppppppppppppppppppppppppppppppppppppppppppppppppppp
Outstanding at July 3, 2004 32,684 $ 11.28 5,278 $ 6.52
Granted 14,927 23.20
Exercised (15,184) 12.74
Canceled/expired (873) 12.84ppppppppppppppppppppppppppppppppppppppppppppppppppppppp
Outstanding at July 2, 2005 31,554 $ 16.17 11,178 $ 16.48pppppppppppppp

N O T E S C O N T I N U E D
46
The following table summarizes information about stock options under the Coach option plans at July 2, 2005.
OPT IONS OUTSTANDING OPT IONS E XERCISABLEppppppppppppppppppppppppppppppppppppppppppppppppppppppppppppppppppppppppppppppppppppppppppppppppppppppppppppppppppppppppppppppppppppppppppppppppppppppppppppppppppppppppppppppppppppppppp ppppppppppppppppppppppppppppppppppppppppppppppppppppppppppppppppppppppppppppppppppppppppppppppppppppppppppppppppppppppppp
WEIGHTED-
AVERAGE WE IGHTED- WE IGHTED-
NUMBER REMAINING AVERAGE NUMBER AVERAGE
OUTSTANDING AT CONTRACTUAL E XERCISE E XERCISABLE AT E XERCISE
RANGE OF E XERCISE PRICES JULY 2, 2005 L IFE ( YEARS) PRICE JULY 2, 2005 PRICEppppppppppppppppppppppppppppppppppppppppppppppppppppppp ppppppppppppppppppppppppppppppppppppppppppppppppppppppp ppppppppppppppppppppppppppppppppppppppppppppppppppppppp ppppppppppppppppppppppppppppppppppppppppppppppppppppppp ppppppppppppppppppppppppppppppppppppppppppppppppppppppp
$ 2.00– 5.00 2,418 5.12 $ 3.66 2,418 $ 3.66
$ 5.01–10.00 4,756 6.98 6.38 1,685 6.82
$10.01–20.00 16,108 8.47 15.52 1,727 13.72
$20.01–35.00 8,272 5.63 26.74 5,348 26.21ppppppppppppppppppppppppppppppppppppppppppppppppppppppp ppppppppppppppppppppppppppppppppppppppppppppppppppppppp
31,554 7.24 $ 16.17 11,178 $ 16.48pppppppppppppp pppppppppppppp
The fair value of each Coach option grant is estimated on the date of grant using the Black-Scholes option pricing model and the following weighted-average assumptions:
F ISCAL YEAR ENDED JULY 2, 2005 JULY 3, 2004 JUNE 28, 2003ppppppppppppppppppppppppppppppppppppppppppppppppppppppp ppppppppppppppppppppppppppppppppppppppppppppppppppppppp ppppppppppppppppppppppppppppppppppppppppppppppppppppppp
Expected lives (years) 1.4 1.6 1.5
Risk-free interest rate 2.6% 1.6% 1.7%
Expected volatility 29.2% 32.4% 35.2%
Dividend yield –% –% –%
The weighted-average fair values of individual options granted during f iscal 2005, 2004 and 2003 were $3.10, $2.45 and$1.23, respectively.
E M P L O Y E E S T O C K P U R C H A S E P L A N Under the Employee Stock Purchase Plan, full-time Coach employees are permitted to purchase a limited number of Coach common shares at 85% of market value. Under this plan, Coach sold 159, 200 and 268 sharesto employees in f iscal 2005, 2004 and 2003, respectively. Pro forma compensation expense is calculated for the fair value ofemployees’ purchase rights using the Black-Scholes model and the following weighted-average assumptions:
F ISCAL YEAR ENDED JULY 2, 2005 JULY 3, 2004 JUNE 28, 2003ppppppppppppppppppppppppppppppppppppppppppppppppppppppp ppppppppppppppppppppppppppppppppppppppppppppppppppppppp ppppppppppppppppppppppppppppppppppppppppppppppppppppppp
Expected lives (years) 0.5 0.5 0.5
Risk-free interest rate 2.8% 1.2% 1.2%
Expected volatility 27.6% 28.8% 38.3%
Dividend yield –% –% –%
The weighted-average fair value of the purchase r ights granted during f iscal 2005, 2004 and 2003 was $6.24, $4.85 and$2.60, respectively.

Results
CO
AC
H, IN
C. A
R 2
00
5
47`
S T O C K U N I T AW A R D S Restricted stock unit awards of Coach common stock have been granted to employees as retention awards.The value of retention awards is determined based upon the fair value of Coach stock at the grant date. Stock awards are restrictedand subject to forfeiture until the retention period is completed. The retention period is generally three years. As of July 2, 2005,retention awards of 1,861 shares were outstanding. This value is initially recorded as unearned compensation and is charged to earnings over the retention period. The amortization expense related to these awards was $6,633, $4,410 and $1,568 for f iscal 2005, 2004 and 2003, respectively.
D E F E R R E D C O M P E N S AT I O N Under the Coach, Inc. Executive Deferred Compensation Plan, executive officers and certain employeesat or above the senior director level may elect to defer all or a portion of their annual bonus or annual base salary into the plan. Underthe Coach, Inc. Deferred Compensation Plan for Non-Employee Directors, Coach’s outside directors may similarly defer their direc-tor’s fees. Amounts deferred under these plans may, at the participants’ election, be either represented by deferred stock units, whichrepresent the right to receive shares of Coach common stock on the distribution date elected by the participant, or placed in aninterest-bearing account to be paid on such distribution date. The amounts accrued under these plans at July 2, 2005 and July 3, 2004were $4,777 and $4,263, respectively, and are included in other noncurrent liabilities in the consolidated balance sheets.
The following table summarizes share and exercise price information about Coach’s equity compensation plans as of July 2, 2005.
NUMBER OF
NUMBER OF WE IGHTED- SECURIT IES
SECURIT IES TO AVERAGE REMAINING
BE ISSUED UPON E XERCISE AVAILABLE
E XERCISE OF PRICE OF FOR FUTURE
OUTSTANDING OUTSTANDING ISSUANCE
OPT IONS, OPT IONS, UNDER EQUITY
WARRANTS WARRANTS COMPENSAT ION
PLAN CATEGORY OR RIGHTS AND RIGHTS PLANSppppppppppppppppppppppppppppppppppppppppppppppppppppppp ppppppppppppppppppppppppppppppppppppppppppppppppppppppp ppppppppppppppppppppppppppppppppppppppppppppppppppppppp
Equity compensation plans approved by security holders 33,415 $15.27 30,384
Equity compensation plans not approved by security holders 768 $ 4.52 3,073ppppppppppppppppppppppppppppppppppppppppppppppppppppppp ppppppppppppppppppppppppppppppppppppppppppppppppppppppp
Total 34,183 33,457pppppppppppppp pppppppppppppp
9. R ETIR EMENT PLANS
Coach maintains the Coach, Inc. Savings and Profit Sharing Plan, which is a defined contribution plan. Employees who meet certaineligibility requirements and are not part of a collective bargaining agreement may participate in this program. The annual expenseincurred by Coach for this defined contribution plan was $8,621, $7,620 and $5,308 in fiscal 2005, 2004 and 2003, respectively.
Coach also sponsors a noncontributory defined benefit plan, The Coach, Inc. Supplemental Pension Plan, for individuals who arepart of collective bargaining arrangements. The plan provides benefits based on years of service.
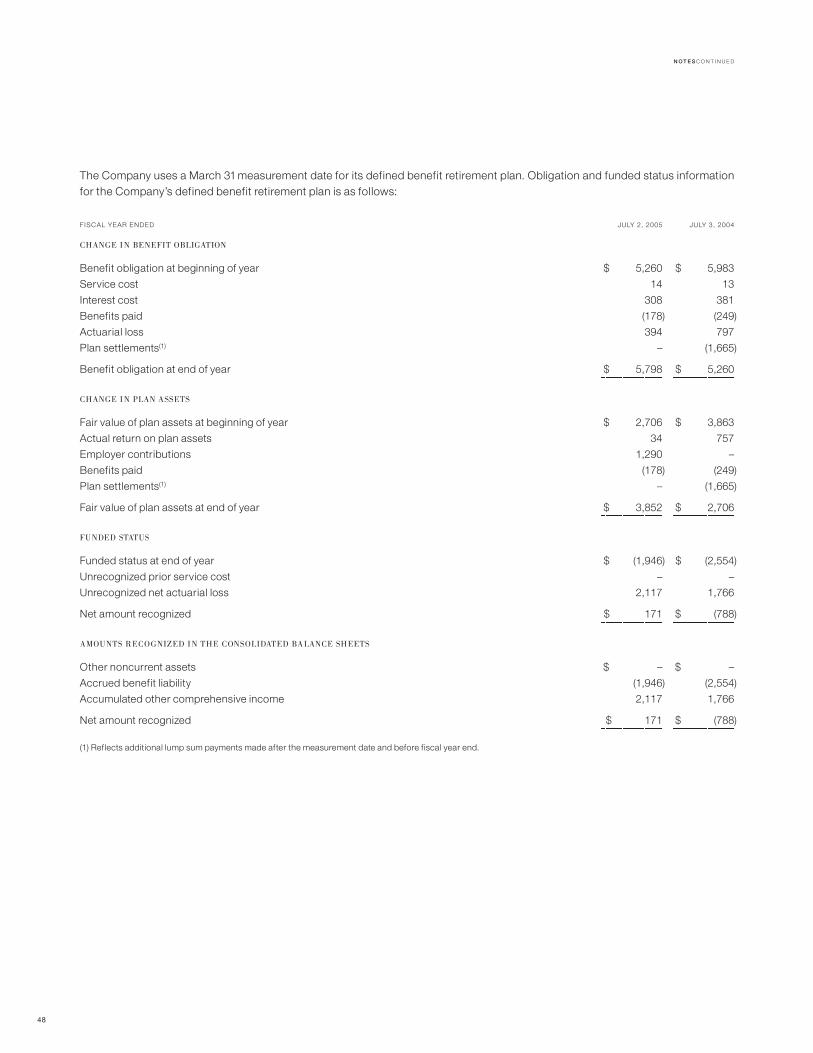
N O T E S C O N T I N U E D
48
The Company uses a March 31 measurement date for its defined benefit retirement plan. Obligation and funded status informationfor the Company’s defined benefit retirement plan is as follows:
F ISCAL YEAR ENDED JULY 2, 2005 JULY 3, 2004ppppppppppppppppppppppppppppppppppppppppppppppppppppppp ppppppppppppppppppppppppppppppppppppppppppppppppppppppp
CHANGE I N BENEFIT OBLIGATION
Benefit obligation at beginning of year $ 5,260 $ 5,983
Service cost 14 13
Interest cost 308 381
Benefits paid (178) (249)
Actuarial loss 394 797
Plan settlements(1) – (1,665)ppppppppppppppppppppppppppppppppppppppppppppppppppppppp ppppppppppppppppppppppppppppppppppppppppppppppppppppppp
Benefit obligation at end of year $ 5,798 $ 5,260pppppppppppppp pppppppppppppp
CHANGE I N PLAN ASSETS
Fair value of plan assets at beginning of year $ 2,706 $ 3,863
Actual return on plan assets 34 757
Employer contributions 1,290 –
Benefits paid (178) (249)
Plan settlements(1) – (1,665)ppppppppppppppppppppppppppppppppppppppppppppppppppppppp ppppppppppppppppppppppppppppppppppppppppppppppppppppppp
Fair value of plan assets at end of year $ 3,852 $ 2,706pppppppppppppp pppppppppppppp
FUNDED STATUS
Funded status at end of year $ (1,946) $ (2,554)
Unrecognized prior service cost – –
Unrecognized net actuarial loss 2,117 1,766ppppppppppppppppppppppppppppppppppppppppppppppppppppppp ppppppppppppppppppppppppppppppppppppppppppppppppppppppp
Net amount recognized $ 171 $ (788)pppppppppppppp pppppppppppppp
AMOUNTS RECOGNIZED I N THE CONSOLIDATED BALANCE SHEETS
Other noncurrent assets $ – $ –
Accrued benefit liability (1,946) (2,554)
Accumulated other comprehensive income 2,117 1,766ppppppppppppppppppppppppppppppppppppppppppppppppppppppp ppppppppppppppppppppppppppppppppppppppppppppppppppppppp
Net amount recognized $ 171 $ (788)pppppppppppppp pppppppppppppp
(1) Ref lects additional lump sum payments made after the measurement date and before f iscal year end.

Results
CO
AC
H, IN
C. A
R 2
00
5
49`
The accumulated benefit obligation for the defined benefit pension plan was $5,798 and $5,260 at July 2, 2005 and July 3,2004, respectively.
F ISCAL YEAR ENDED JULY 2, 2005 JULY 3, 2004ppppppppppppppppppppppppppppppppppppppppppppppppppppppp ppppppppppppppppppppppppppppppppppppppppppppppppppppppp
I NFORMATION FOR PENSION PLANS WITH AN ACCUMULATED BENEFIT OBLIGATION I N EXCESS OF PLAN ASSETS
Projected benefit obligation $ 5,798 $ 5,260
Accumulated benefit obligation 5,798 5,260
Fair value of plan assets 3,852 2,706
ADDITIONAL I NFORMATION
Increase in minimum liability included in other comprehensive income $ 350 $ (479)
WEIGHTED-AVERAGE ASSUMPTIONS USED TO DETERMI NE BENEFIT OBLIGATIONS
Discount rate 5.75% 6.00%
Rate of compensation increase N/A N/A
WEIGHTED-AVERAGE ASSUMPTIONS USED TO DETERMI NE NET PER IODIC BENEFIT COST
Discount rate 6.00% 6.50%
Expected long-term return on plan assets 6.75% 7.50%
Rate of compensation increase N/A N/A
To develop the expected long-term rate of return on plan assets assumption, the Company considered the current level of expectedreturns on risk-free investments (primarily government bonds), the historical level of the risk premium associated with the otherasset classes in which the portfolio is invested and the expectations for future returns of each asset class. The expected return foreach asset class was then weighted based on the target asset allocation to develop the expected long-term rate of return on planassets assumption for the portfolio. This resulted in the selection of the 6.75% assumption for f iscal 2005.
F ISCAL YEAR ENDED JULY 2, 2005 JULY 3, 2004 JUNE 28, 2003ppppppppppppppppppppppppppppppppppppppppppppppppppppppp ppppppppppppppppppppppppppppppppppppppppppppppppppppppp ppppppppppppppppppppppppppppppppppppppppppppppppppppppp
COMPONENTS OF NET PER IODIC BENEFIT COST
Service cost $ 14 $ 13 $ 15
Interest cost 308 381 370
Expected return on plan assets (181) (281) (381)
Amortization of prior service cost – – 1
Amortization of net actuarial loss 190 246 46
Settlement loss – 559 –ppppppppppppppppppppppppppppppppppppppppppppppppppppppp ppppppppppppppppppppppppppppppppppppppppppppppppppppppp ppppppppppppppppppppppppppppppppppppppppppppppppppppppp
Net periodic benefit cost $ 331 $ 918 $ 51pppppppppppppp pppppppppppppp pppppppppppppp

N O T E S C O N T I N U E D
50
The Company’s pension plan weighted-average asset allocations, by asset category, as of the measurement dates, are as follows:
PLAN ASSE TSppppppppppppppppppppppppppppppppppppppppppppppppppppppppppppppppppppppppppppppppppppppppppppppppppppppppppppppppppppppppp
F ISCAL 2005 F ISCAL 2004ppppppppppppppppppppppppppppppppppppppppppppppppppppppp ppppppppppppppppppppppppppppppppppppppppppppppppppppppp
ASSET CATEGORY
Domestic equities 62.4% 69.0%
International equities 4.5 4.1
Fixed income 20.9 25.1
Cash equivalents 12.2 1.8ppppppppppppppppppppppppppppppppppppppppppppppppppppppp ppppppppppppppppppppppppppppppppppppppppppppppppppppppp
Total 100.0% 100.0%pppppppppppppp pppppppppppppp
The goals of the investment program are to fully fund the obligation to pay retirement benefits in accordance with the Coach,Inc. Supplementa l Pens ion P lan and to prov ide returns that, a long w i th appropr iate f unding f rom Coach, maintain an asset/liability ratio that is in compliance with all applicable laws and regulations and assures timely payment of retirementbenefits. The target allocation range of percentages for each major category of plan assets, on a weighted-average basis, are as follows:
LOW TARGE T HIGHppppppppppppppppppppppppppppppppppppppppppppppppppppppp ppppppppppppppppppppppppppppppppppppppppppppppppppppppp ppppppppppppppppppppppppppppppppppppppppppppppppppppppp
Equity securities 30% 45% 60%
Fixed income 25% 40% 55%
Cash equivalents 5% 15% 25%
The equity securities category includes common stocks, preferred stocks, and commingled funds of approved securities. The target allocation of securities is a maximum of 5% of equity assets in any one individual common or preferred stock and a maximumof15% in any one mutual fund.
The Company expects to contribute $442 to its defined benefit pension plan during the year ending July1, 2006.
The following benefit payments, which ref lect expected future service, as appropriate, are expected to be paid:
F ISCAL YEAR PENSION BENEF ITSpppppppppppppppppppppppppppppppppppppppppppppppppppppppppppppppp
2006 $ 274
2007 293
2008 307
2009 319
2010 338
2011–2015 1,956
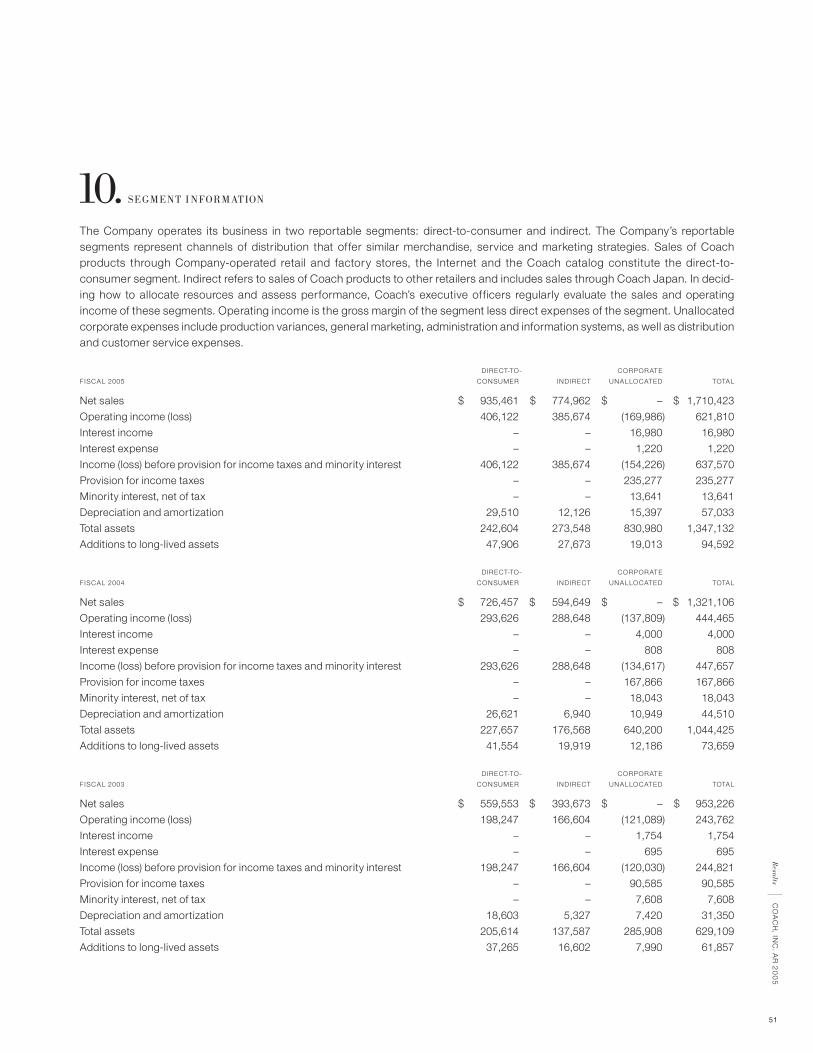
Results
CO
AC
H, IN
C. A
R 2
00
5
51`
10. SEGMENT I NFORMATION
The Company operates its business in two reportable segments: direct-to-consumer and indirect. The Company’s reportable segments represent channels of distribution that offer similar merchandise, service and marketing strategies. Sales of Coach products through Company-operated retail and factory stores, the Internet and the Coach catalog constitute the direct-to-consumer segment. Indirect refers to sales of Coach products to other retailers and includes sales through Coach Japan. In decid-ing how to allocate resources and assess performance, Coach’s executive off icers regularly evaluate the sales and operatingincome of these segments. Operating income is the gross margin of the segment less direct expenses of the segment. Unallocatedcorporate expenses include production variances, general marketing, administration and information systems, as well as distributionand customer service expenses.
DIRECT-TO- CORPORATE
F ISCAL 2005 CONSUMER INDIRECT UNALLOCATED TOTALppppppppppppppppppppppppppppppppppppppppppppppppppppppp ppppppppppppppppppppppppppppppppppppppppppppppppppppppp ppppppppppppppppppppppppppppppppppppppppppppppppppppppp ppppppppppppppppppppppppppppppppppppppppppppppppppppppp
Net sales $ 935,461 $ 774,962 $ – $ 1,710,423
Operating income (loss) 406,122 385,674 (169,986) 621,810
Interest income – – 16,980 16,980
Interest expense – – 1,220 1,220
Income (loss) before provision for income taxes and minority interest 406,122 385,674 (154,226) 637,570
Provision for income taxes – – 235,277 235,277
Minority interest, net of tax – – 13,641 13,641
Depreciation and amortization 29,510 12,126 15,397 57,033
Total assets 242,604 273,548 830,980 1,347,132
Additions to long-lived assets 47,906 27,673 19,013 94,592
DIRECT-TO- CORPORATE
F ISCAL 2004 CONSUMER INDIRECT UNALLOCATED TOTALppppppppppppppppppppppppppppppppppppppppppppppppppppppp ppppppppppppppppppppppppppppppppppppppppppppppppppppppp ppppppppppppppppppppppppppppppppppppppppppppppppppppppp ppppppppppppppppppppppppppppppppppppppppppppppppppppppp
Net sales $ 726,457 $ 594,649 $ – $ 1,321,106
Operating income (loss) 293,626 288,648 (137,809) 444,465
Interest income – – 4,000 4,000
Interest expense – – 808 808
Income (loss) before provision for income taxes and minority interest 293,626 288,648 (134,617) 447,657
Provision for income taxes – – 167,866 167,866
Minority interest, net of tax – – 18,043 18,043
Depreciation and amortization 26,621 6,940 10,949 44,510
Total assets 227,657 176,568 640,200 1,044,425
Additions to long-lived assets 41,554 19,919 12,186 73,659
DIRECT-TO- CORPORATE
F ISCAL 2003 CONSUMER INDIRECT UNALLOCATED TOTALppppppppppppppppppppppppppppppppppppppppppppppppppppppp ppppppppppppppppppppppppppppppppppppppppppppppppppppppp ppppppppppppppppppppppppppppppppppppppppppppppppppppppp ppppppppppppppppppppppppppppppppppppppppppppppppppppppp
Net sales $ 559,553 $ 393,673 $ – $ 953,226
Operating income (loss) 198,247 166,604 (121,089) 243,762
Interest income – – 1,754 1,754
Interest expense – – 695 695
Income (loss) before provision for income taxes and minority interest 198,247 166,604 (120,030) 244,821
Provision for income taxes – – 90,585 90,585
Minority interest, net of tax – – 7,608 7,608
Depreciation and amortization 18,603 5,327 7,420 31,350
Total assets 205,614 137,587 285,908 629,109
Additions to long-lived assets 37,265 16,602 7,990 61,857

N O T E S C O N T I N U E D
52
The following is a summary of the common costs not allocated in the determination of segment performance.
F ISCAL YEAR ENDED JULY 2, 2005 JULY 3, 2004 JUNE 28, 2003ppppppppppppppppppppppppppppppppppppppppppppppppppppppp ppppppppppppppppppppppppppppppppppppppppppppppppppppppp ppppppppppppppppppppppppppppppppppppppppppppppppppppppp
Production variances $ 11,028 $ 12,581 $ 6,755
Advertising, marketing and design (70,234) (56,714) (48,491)
Administration and information systems (75,970) (63,521) (51,843)
Distribution and customer service (34,810) (30,155) (27,510)ppppppppppppppppppppppppppppppppppppppppppppppppppppppp ppppppppppppppppppppppppppppppppppppppppppppppppppppppp ppppppppppppppppppppppppppppppppppppppppppppppppppppppp
Total corporate unallocated $ (169,986) $ (137,809) $ (121,089)pppppppppppppp pppppppppppppp pppppppppppppp
G E O G R A P H I C A R E A I N F O R M AT I O N Geographic revenue information is based on the location of our customer. Geographic long-livedasset information is based on the physical location of the assets at the end of each period. As of July 2, 2005, Coach operated193 retail stores and 82 factory stores in North America. Indirectly, through Coach Japan, Coach operates 103 department storeshop-in-shops and retail and factory store locations in Japan. Coach operates distribution, product development and quality con-trol locations in the United States, Italy, Hong Kong, China and South Korea.
OTHER
F ISCAL 2005 UNITED STATES JAPAN INTERNAT IONAL(1) TOTALppppppppppppppppppppppppppppppppppppppppppppppppppppppp ppppppppppppppppppppppppppppppppppppppppppppppppppppppp ppppppppppppppppppppppppppppppppppppppppppppppppppppppp ppppppppppppppppppppppppppppppppppppppppppppppppppppppp
Net sales $ 1,242,004 $ 372,326 $ 96,093 $ 1,710,423
Long-lived assets 314,919 288,338 2,995 606,252
OTHER
F ISCAL 2004 UNITED STATES JAPAN INTERNAT IONAL(1) TOTALppppppppppppppppppppppppppppppppppppppppppppppppppppppp ppppppppppppppppppppppppppppppppppppppppppppppppppppppp ppppppppppppppppppppppppppppppppppppppppppppppppppppppp ppppppppppppppppppppppppppppppppppppppppppppppppppppppp
Net sales $ 982,668 $ 278,011 $ 60,427 $ 1,321,106
Long-lived assets 280,938 55,487 2,384 338,809
OTHER
F ISCAL 2003 UNITED STATES JAPAN INTERNAT IONAL(1) TOTALppppppppppppppppppppppppppppppppppppppppppppppppppppppp ppppppppppppppppppppppppppppppppppppppppppppppppppppppp ppppppppppppppppppppppppppppppppppppppppppppppppppppppp ppppppppppppppppppppppppppppppppppppppppppppppppppppppp
Net sales $ 735,890 $ 177,821 $ 39,515 $ 953,226
Long-lived assets 138,708 31,966 785 171,459
(1) Other International sales reflect shipments to third-party distributors primarily in East Asia.
11. DER IVATIVE I NSTRU MENTS AND H EDGI NG ACTIVITIES
Substantially all purchases and sales involving international parties are denominated in U.S. dollars, the majority of which are nothedged using any derivative instruments. However, the Company is exposed to market risk from foreign currency exchange ratef luctuations with respect to Coach Japan as a result of its U.S. dollar-denominated inventory purchases. Coach Japan enters intocertain foreign currency derivative contracts, primarily foreign exchange forward contracts, to manage these risks. In addition, theCompany is exposed to foreign currency exchange rate f luctuations related to the euro-denominated expenses of its Italian sourcingoff ice. During the third quarter of f iscal 2003, the Company began a program to enter into certain foreign currency derivative contracts, primarily foreign exchange forward contracts, in order to manage these f luctuations. However, during the second quarterof f iscal 2004, the Company reassessed this program and determined, based on current business conditions, that the Companywould discontinue hedging against the euro.

Results
CO
AC
H, IN
C. A
R 2
00
5
53`
The foreign currency contracts entered into by the Company have durations no greater than 12 months. The fair values of open foreign currency derivatives included in accrued liabilities at July 2, 2005 and July 3, 2004 were $0 and $486, respectively. The fair values of open foreign currency derivatives included in current assets at July 2, 2005 and July 3, 2004 were $1,535 and $0, respectively. As of July 2, 2005, open foreign currency forward contracts designated as hedges with a notional amount of $46,900 were fair valued, resulting in an increase to equity as a benefit to other comprehensive income of $1,229, net of taxes. As of July 3, 2004, open foreign currency forward contracts designated as hedges with a notional amount of $63,600 were fair valued, resulting in a reduction to equity as a charge to other comprehensive income of $460, net of taxes.
12. GOODWILL
Changes in the carrying amounts of net goodwill for the years ended July 2, 2005 and July 3, 2004 are as follows:
DIRECT-TO-
CONSUMER INDIRECT TOTALppppppppppppppppppppppppppppppppppppppppppppppppppppppp ppppppppppppppppppppppppppppppppppppppppppppppppppppppp ppppppppppppppppppppppppppppppppppppppppppppppppppppppp
Balance at June 28, 2003 $ 3,408 $ 9,601 $ 13,009
Foreign exchange impact – 596 596ppppppppppppppppppppppppppppppppppppppppppppppppppppppp ppppppppppppppppppppppppppppppppppppppppppppppppppppppp ppppppppppppppppppppppppppppppppppppppppppppppppppppppp
Balance at July 3, 2004 $ 3,408 $ 10,197 $ 13,605
Acquisition – 225,263 225,263
Foreign exchange impact – (157) (157)ppppppppppppppppppppppppppppppppppppppppppppppppppppppp ppppppppppppppppppppppppppppppppppppppppppppppppppppppp ppppppppppppppppppppppppppppppppppppppppppppppppppppppp
Balance at July 2, 2005 $ 3,408 $ 235,303 $ 238,711pppppppppppppp pppppppppppppp pppppppppppppp
On July 1, 2005, Coach completed the purchase of Sumitomo’s 50% interest in Coach Japan. See Note 17, “Acquisition of CoachJapan, Inc.,” for more information on the acquisition.
13. BUSI NESS I NTERRUPTION I NSURANCE
As a result of the September 11, 2001 attack, the World Trade Center store was completely destroyed. Losses relating to theCompany’s business interruption coverage were f iled with the insurers. Coach has held discussions with its insurance carriers andexpects to fully recover these losses.
During f iscal 2005, 2004 and 2003, Coach received payments of $2,644, $2,657 and $1,484, respectively, under its business interruption coverage. These amounts are included as a reduction to selling, general and administrative expenses.

N O T E S C O N T I N U E D
54
14. EARNI NGS PER SHAR E
The following is a reconciliation of the weighted-average shares outstanding and calculation of basic and diluted earnings per share:
F ISCAL YEAR ENDED JULY 2, 2005 JULY 3, 2004 JUNE 28, 2003ppppppppppppppppppppppppppppppppppppppppppppppppppppppp ppppppppppppppppppppppppppppppppppppppppppppppppppppppp ppppppppppppppppppppppppppppppppppppppppppppppppppppppp
Net earnings $ 388,652 $ 261,748 $ 146,628pppppppppppppp pppppppppppppp pppppppppppppp
Total basic shares 378,670 372,120 359,116
Dilutive securities:
Employee benefit and stock award plans 2,784 2,578 1,840
Stock option programs 8,737 10,860 10,728ppppppppppppppppppppppppppppppppppppppppppppppppppppppp ppppppppppppppppppppppppppppppppppppppppppppppppppppppp ppppppppppppppppppppppppppppppppppppppppppppppppppppppp
Total diluted shares 390,191 385,558 371,684pppppppppppppp pppppppppppppp pppppppppppppp
Earnings per share:
Basic $ 1.03 $ 0.70 $ 0.41pppppppppppppp pppppppppppppp pppppppppppppp
Diluted $ 1.00 $ 0.68 $ 0.39pppppppppppppp pppppppppppppp pppppppppppppp
15. STOCK R EPURCHASE PROGRAM
On September17, 2001, the Coach Board of Directors authorized the establishment of a common stock repurchase program. Underthis program, up to $80,000 may be utilized to repurchase common stock through September 2004. On January 30, 2003, theCoach Board of Directors approved an additional common stock repurchase program to acquire up to $100,000 of Coach’s outstanding common stock through January 2006 and extended the duration of Coach’s existing repurchase program throughJanuary 2006. On May 11, 2005, the Coach Board of Directors approved a common stock repurchase program to acquire up to$250,000 of Coach’s outstanding common stock. Purchases of Coach stock may be made from time to time, subject to market conditions and at prevailing market prices, through open market purchases. Repurchased shares will become authorized but unissued shares and may be issued in the future for general corporate and other uses. The Company may terminate or limit thestock repurchase program at any time.
During f iscal 2005, 2004 and 2003, the Company repurchased and retired 11,000, 3,022 and 7,716 shares of common stock at anaverage cost of $24.09, $18.18 and $6.48 per share, respectively. As of July 2, 2005, Coach had approximately $250,000 remainingin the stock repurchase program.
16. R ELATED-PARTY TRANSACTION
On July 26, 2001, Coach made a loan to Reed Krakoff, its President, Executive Creative Director, in the principal amount of $2,000.The loan bore interest at a rate of 5.12% per annum, compounded annually. The loan amount and applicable accrued interest, lesspayments received, was recorded as a component of other noncurrent assets in the accompanying balance sheets. Included in theloan agreement was a repayment schedule requiring full repayment on or before July 26, 2006.
On November 7, 2002, Mr. Krakoff paid Coach the f irst principal payment of $400 under the loan agreement. On March 11, 2004,Mr. Krakoff made an accelerated payment to retire the full outstanding principal and interest under the loan agreement.

Results
CO
AC
H, IN
C. A
R 2
00
5
55`
17. ACQU ISITION OF COACH JA PAN, I NC.
On July1, 2005, Coach completed the purchase of Sumitomo’s 50% interest in Coach Japan, Inc. for $228,431, including transactioncosts, plus undistributed profits and paid-in capital of $72,927. Coach Japan was a joint venture established between Coach andSumitomo Corporation, to operate and expand the Coach business in Japan. Coach Japan is accounted for as a consolidated sub-sidiary. Coach recorded the 50% interest in the assets and liabilities of Coach Japan acquired through this acquisition at their fairvalues as follows: trade accounts receivable of $15,369, inventory of $43,089, property and equipment of $21,848, customer list of$250, goodwill of $225,263, other assets of $24,969 and liabilities of $30,672. The results of operations for Coach Japan, Inc. fromJuly1, 2005 are included in our consolidated results of operations for the f iscal year ended July 2, 2005.
The following unaudited pro forma information assumes the Coach Japan, Inc. acquisition had occurred on July 4, 2004. The proforma information, as presented below, is not indicative of the results that would have been obtained had the transaction occurredJuly 4, 2004, nor is it indicative of our future results. The f inal purchase price allocation and the resulting effect on net income maydif fer signif icantly from the unaudited pro forma amounts included herein.
F ISCAL YEAR ENDED JULY 2, 2005 JULY 3, 2004ppppppppppppppppppppppppppppppppppppppppppppppppppppppp ppppppppppppppppppppppppppppppppppppppppppppppppppppppp
(UNAUDITED) (UNAUDITED)
Net revenue $ 1,710,423 $ 1,321,106
Net income 402,293 279,791
Net income per share – Basic 1.06 0.75
Net income per share – Diluted 1.03 0.73
18. SHAR EHOLDER R IGHTS PLAN
On May 3, 2001, Coach declared a “poison pill” dividend distribution of rights to buy additional common stock, to the holder of eachoutstanding share of Coach’s common stock.
Subject to limited exceptions, these rights may be exercised if a person or group intentionally acquires 10% or more of theCompany’s common stock or announces a tender offer for10% or more of the common stock on terms not approved by the CoachBoard of Directors. In this event, each right would entitle the holder of each share of Coach’s common stock to buy one additionalcommon share of the Company at an exercise price far below the then-current market price. Subject to certain exceptions, Coach’sBoard of Directors will be entitled to redeem the rights at $0.001 per right at any time before the close of business on the tenth dayfollowing either the public announcement that, or the date on which a majority of Coach’s Board of Directors becomes aware that,a person has acquired 10% or more of the outstanding common stock. As of the end of f iscal 2005, there were no shareholderswhose common stock holdings exceeded the 10% threshold established by the rights plan.

N O T E S C O N T I N U E D
56
19. SUBSEQU ENT EVENT
On August 22, 2005, Coach, Inc. entered into three-year extensions to the employment agreements of three key executives: LewFrankfort, Chairman and Chief Executive Officer; Reed Krakoff, President and Executive Creative Director; and Keith Monda,President and Chief Operating Officer. These amendments extend the terms of the executives’ employment agreements fromJuly 2008 through August 2011.
20. QUARTERLY FI NANCIA L DATA (UNAUDITED)
F IRST SECOND THIRD FOURTH TOTAL
QUARTER QUARTER QUARTER QUARTER F ISCAL YEARppppppppppppppppppppppppppppppppppppppppppppppppppppppp ppppppppppppppppppppppppppppppppppppppppppppppppppppppp ppppppppppppppppppppppppppppppppppppppppppppppppppppppp ppppppppppppppppppppppppppppppppppppppppppppppppppppppp ppppppppppppppppppppppppppppppppppppppppppppppppppppppp
F ISCAL 2005
Net sales $ 344,065 $ 531,759 $ 415,939 $ 418,660 $ 1,710,423
Gross profit 258,174 402,968 324,673 324,956 1,310,771
Net income 67,725 134,123 89,239 97,565 388,652
Earnings per common share:
Basic $ 0.18 $ 0.35 $ 0.24 $ 0.26 $ 1.03
Diluted $ 0.17 $ 0.34 $ 0.23 $ 0.25 $ 1.00
FISCAL 2004
Net sales(1) $ 258,375 $ 411,513 $ 313,073 $ 338,145 $ 1,321,106
Gross profit 187,909 305,143 237,517 259,513 990,082
Net income 42,329 95,438 58,311 65,670 261,748
Earnings per common share:
Basic $ 0.12 $ 0.26 $ 0.16 $ 0.17 $ 0.70
Diluted $ 0.11 $ 0.25 $ 0.15 $ 0.17 $ 0.68
FISCAL 2003
Net sales $ 192,791 $ 308,523 $ 220,396 $ 231,516 $ 953,226
Gross profit 131,224 216,842 159,807 169,556 677,429
Net income 22,480 62,431 31,853 29,864 146,628
Earnings per common share:
Basic $ 0.06 $ 0.18 $ 0.09 $ 0.08 $ 0.41
Diluted $ 0.06 $ 0.17 $ 0.09 $ 0.08 $ 0.39
(1) Fiscal 2004 fourth quarter and total f iscal year net sales include week 53 sales of $19,500.
The sum of the quarterly earnings per common share may not equal the full-year amount, since the computations of the weighted-average number of common-equivalent shares outstanding for each quarter and the full year are made independently.

Results
CO
AC
H, IN
C. A
R 2
00
5
57`
Corporate Information
L E W F R A NK F ORT
Chairman and Chief Executive Officer, Coach, Inc.
J OSEPH EL L IS
Limited Partner,Goldman, Sachs & Co.
S A L LY F R A ME K A S AK S
Marketing and Retail Consultant,ISTA Incorporated
G AR Y LOV E M A N
Chief Executive Officer and President,Harrah’s Entertainment, Inc.
I VA N ME NE ZE S
President and Chief Executive Officer,Diageo North America
IRE NE MIL L E R
Chief Executive Officer,Akim, Inc.
K E I T H M O NDA
President and Chief Operating Officer,Coach, Inc.
MI CH AEL E. MURPH Y
Retired Vice Chairman and Chief Administrative Officer,Sara Lee Corporation
L E W F R A NK F ORT
Chairman and Chief Executive Officer
K E I T H M O NDA
President and Chief Operating Officer
MI CH AEL F. DE V INE, I I I
Senior Vice President and Chief Financial Off icer
MI CH AEL T U CCI
President,North American Retail Division
REE D K R AKO F F
President, Executive Creative Director
C ARO L E P. S ADL E R
Senior Vice President,General Counsel and Secretary
F EL I CE SCHUL A NE R
Senior Vice President, Human Resources
I A N B I C K L E Y
President, Japan
T H O M A S BRI T T
Senior Vice President,Chief Information Officer
DAV ID DUPL A N T IS
Senior Vice President, Retail Merchandise Planning
PE T E R E M ME RSO N
President,International
J OA NN K USS
Senior Vice President, Worldwide Merchandising
A NDREA L A L IBE RT E
Senior Vice President, Distribution and Customer Service
A NGUS MCR AE
Senior Vice President,Operations
K AT HE RINE NE D OROST EK
President, U.S. Wholesale
GE ORGE NUNN O
Senior Vice President,Design
MI CHEL L E ADA MS
Vice President,Production,Women’s Handbags and Accessories
J IM A LT IE R I
Vice President,Operations Finance
L AUR A F. BO OT H
Vice President,Compensation, Benefits and HRIS
F R A NCINE DEL L A B ADI A
Vice President,Merchandising
K AT H Y DY DE N SBORG
Vice President,Merchandise Planning
MI CH AEL F E R NB ACHE R
Vice President,Architecture
F RE D F R IE SE NH AHN
Vice President, Leather Management
A N T H O N Y G A LV IN
Vice President,Real Estate and Construction
SHE IL A H ARDING
Vice President,Production,Women’s Handbags and Accessories
R A NDEE JAC K SO N
Vice President, Retail Stores
MI CH AEL K INGSTO N
Vice President,Corporate Systems
WA LK E R MA CWIL L I A M
Vice President, Men’s Design
J O N M AROTO
Vice President,Design Support
SE RGE MIN A SS I A N
Vice President,Information Systems
GIUL I A M O L IN I
Vice President, Coach European Services
RI CH ARD MYE RS
Vice President, Logistics and Planning
JA ME S O F F U T T
Vice President,Factory Stores
M AR Y LY NN PH IL L IPS
Vice President,Retail Finance and Store Operations
A NDREA SH AW RE SN I C K
Vice President, Investor Relations
G A BRIEL S AC A
Vice President, Global Sourcing
JA NE T S A NDIF E R
Vice President,International Wholesale
PAUL SP I T ZBE RG
Vice President,Special Markets
J OSEPH STA F IN I AK
Vice President, General Manager – Footwear
MI CH AEL TODD
Vice President,Leather
N A NC Y WA LSH
Vice President, Treasurer
EXECUTIVE OFFICERS OF TH E COMPANY
BOARD OF DIR ECTORS
SENIOR MANAGEMENT OF COACH, I NC.

58
Shareholder Information
COMPANY H EADQUARTERS
Coach, Inc.516 West 34th StreetNew York, New York10001212-594-1850
ANN UA L MEETI NG OF SHAR EHOLDERS
Wednesday, November 2, 20059:00 a.m.Coach, Inc.516 West 34th Street, 4th f loorNew York, New York10001
TRANSF ER AGENT AND R EGISTRAR
Please direct communications regarding individual stockrecords and address changes to:Mellon Investor Services Overpeck Centre85 Challenger RoadRidgefield Park,New Jersey 07660 or call 1-800-851-9677www.melloninvestor.com
I NVESTOR/FI NANCIA L MEDIA CONTACT
Securities analysts, investors and the f inancial media should contact Andrea Shaw Resnick, Vice President, Investor Relations,at the Company’s headquarters, or by calling 212-629-2618.
I NFORMATION UPDATES
Coach’s quarterly f inancial results and other important informa-tion are available by calling the Investor Relations Department at212-629-2618 or by accessing our website at www.coach.com.
ANN UA L R EPORT AND FORM 10 -K
Shareholders may obtain, without charge, a copy of theCompany’s 2005 Annual Report and Form 10-K as filed with theSecurities and Exchange Commission by writing to Daniel Ross,Associate Counsel, at the Company’s headquarters.
I NDEPENDENT PUBLIC ACCOUNTANTS
Deloitte and Touche LLPTwo World Financial CenterNew York, New York 10281
CATALOGS
To request a Coach catalog, please call 1-800-223-8647.
MARKET AND DIVIDEND I NFORMATION
Coach’s common stock is l isted on the New York StockExchange and is traded under the symbol “COH.” The follow-ing table sets forth, for the f iscal year 2005, the high and lowclosing prices per share of Coach’s common stock as reportedon the New York Stock Exchange Composite Tape.
QUARTER ENDED HIGH LOWppppppppppppppppppppppppppppppppppppppppppppppppppppppp ppppppppppppppppppppppppppppppppppppppppppppppppppppppp
October 2, 2004 $ 23.03 $ 18.06
January1, 2005 28.53 19.83
April 2, 2005 29.75 26.41
July 2, 2005 33.92 25.22
Closing price at July1, 2005 $ 33.55
Coach has never declared or paid any cash dividends on itscommon stock. Coach currently intends to retain future earn-ings, if any, for use in its business and is presently not planning to pay regular cash dividends in its common stock. The Bank ofAmerica facility prohibits Coach from paying dividends while thecredit facility is in place, with certain exceptions. Any futuredetermination to pay cash dividends will be at the discretion ofCoach’s Board of Directors and will be dependent upon Coach’sfinancial condition, operating results, capital requirements andsuch other factors as the Board of Directors deems relevant.
©20
05 C
oach
, Inc
. ®C
oach
, the
Coa
ch ta
g, th
e C
oach
loze
nge
and
Coa
ch S
igna
ture
©ar
e re
gist
ered
trad
emar
ks o
f Coa
ch.

2 F I N A N C I A L H I G H L I G H T S
3 C H A I R M A N ’ S L E T T E R
4 T H E C O A C H B R A N D
7 R O A D M A P F O R G R O W T H
8 I N C R E A S E D I S T R I B U T I O N
1 1 M A X I M I Z E P R O D U C T I V I T Y
1 3 P R O D U C T I N N O V AT I O N A N D R E L E V A N C E
1 4 C O A C H S E R V I C E
1 6 T H E C O A C H R E S U LT S
59246_L01PIFCv1 8/30/05 11:58 PM Page 1

516 West 34th Street, New York, New York 10001
CO
AC
H A
NN
UA
L R
EP
OR
T 2
00
5
ANNUAL REPORT 2005
59246_L01POBCv5.qxd 9/12/05 10:12 PM Page 1