Embed Size (px)
Citation preview
S1
CO2-stimulated vesicle-to-lamella transition of ABC miktoarm star
terpolymer assemblies
Meng Huoa,b
, Haotian Dua, Min Zeng
a, Long Pan
c, Tommy Fang
a, Xuming Xie
c, Yen Wei*
b and Jinying
Yuan*a
aKey Lab of Organic Optoelectronics and Molecular Engineering of Ministry of Education, Department of Chemistry, Tsinghua University, Beijing
100084, P. R. China. E-mail: [email protected]
bKey Lab of Bioorganic Phosphorus Chemistry & Chemical Biology of Ministry of Education, Department of Chemistry, Tsinghua University, Beijing
100084, P. R. China. E-mail: [email protected]
cDepartment of Chemical Engineering, Tsinghua University, Beijing 100084, P. R. China
Electronic Supplementary Material (ESI) for Polymer Chemistry.This journal is © The Royal Society of Chemistry 2017
S2
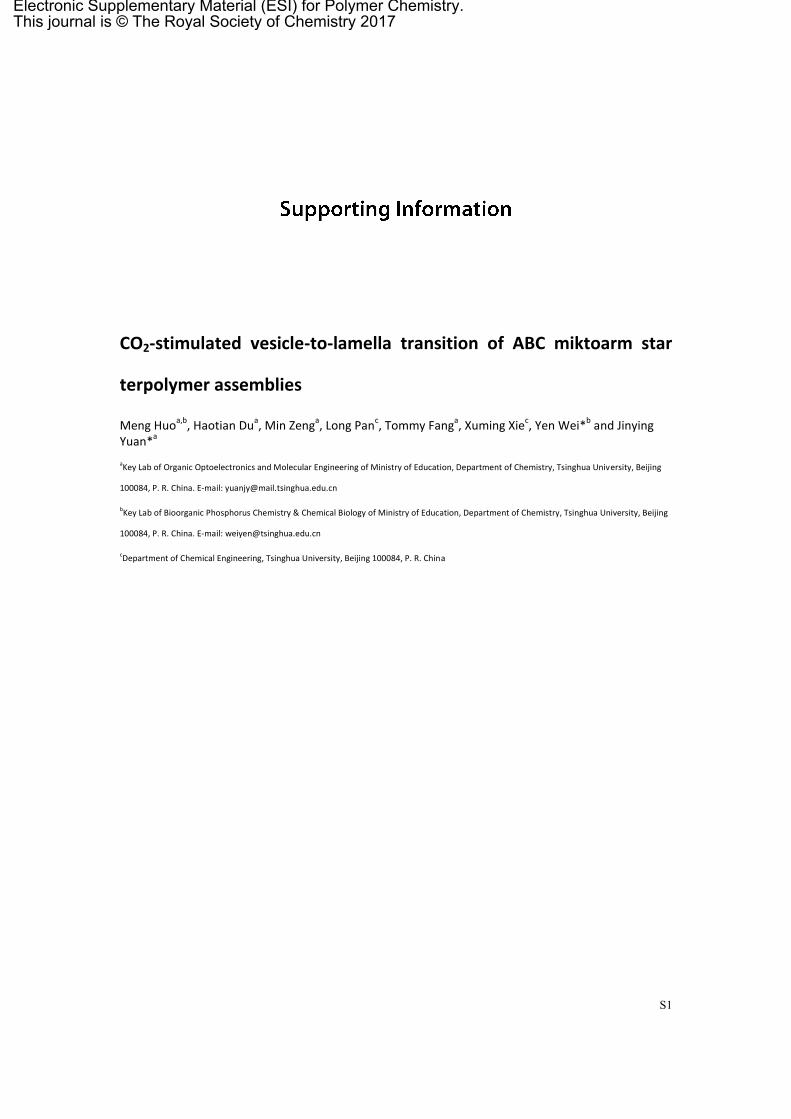
Fig. S1 1H NMR spectra of a) PEG-(OH)-N3, b) PS-NEt2, c) PEG-(OH)-PS, d) μ-PEG-PS-PDEAa.
aThe DP of PDEA was calculated using the integration of the peak a and peak f in Fig. S1d according to the following equation:
DP𝑃𝐷𝐸𝐴 =45 × 4
2×
𝐼𝑓
𝐼𝑎
where If represents the integration of the peak f and Ia represents the integration of the peak a.
According to the calculation the DPs of PDEA of μ-PEG-PS-PDEA were 18 (μ-PEG-PS-PDEA3.3k), 37 (μ-PEG-PS-PDEA6.8k), 50 (μ-PEG-PS-PDEA9.3k), 66
(μ-PEG-PS-PDEA12.2k), and 135 (μ-PEG-PS-PDEA25.0k), respectively.
S3
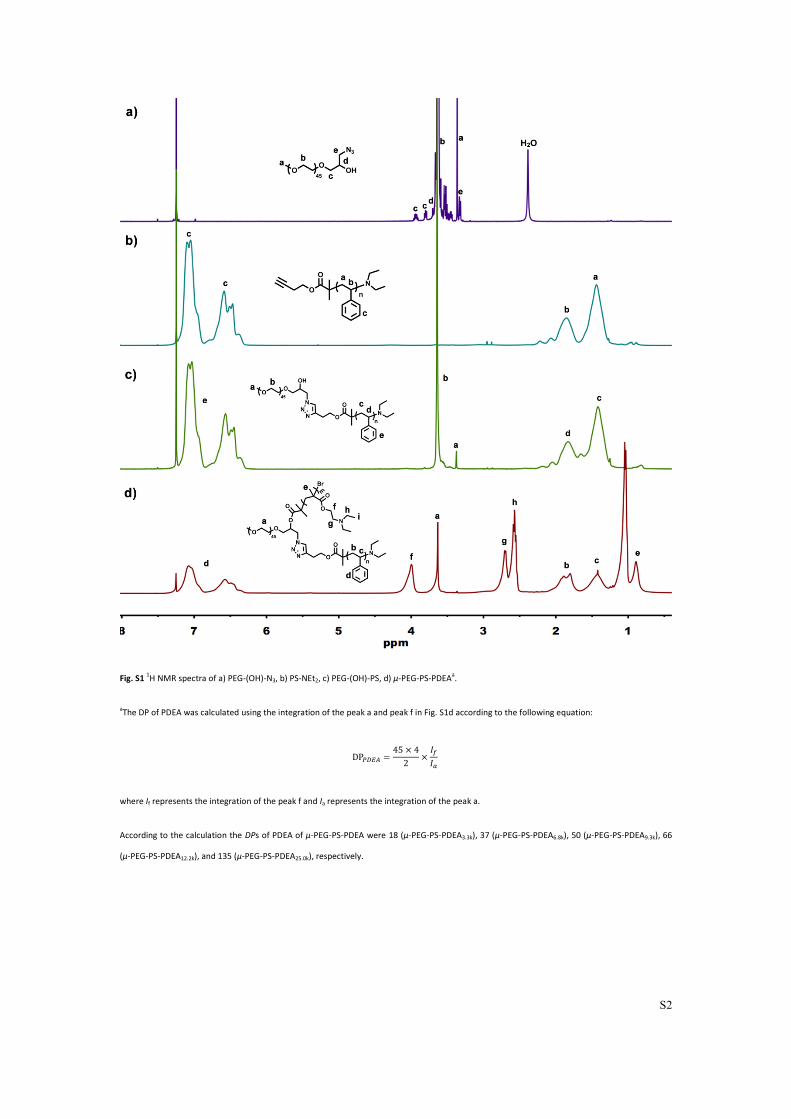
Fig. S2 GPC traces of PEG-(OH)-N3, PS-NEt2 and PEG-(OH)-PS.
Fig. S3 GPC traces of PEG-(Br)-PS and μ-PEG-PS-PDEA with different PDEA chain lengths.
Fig. S4 DLS characterization of μ-PEG-PS-PDEA9.3k before and after CO2 purging.
S4
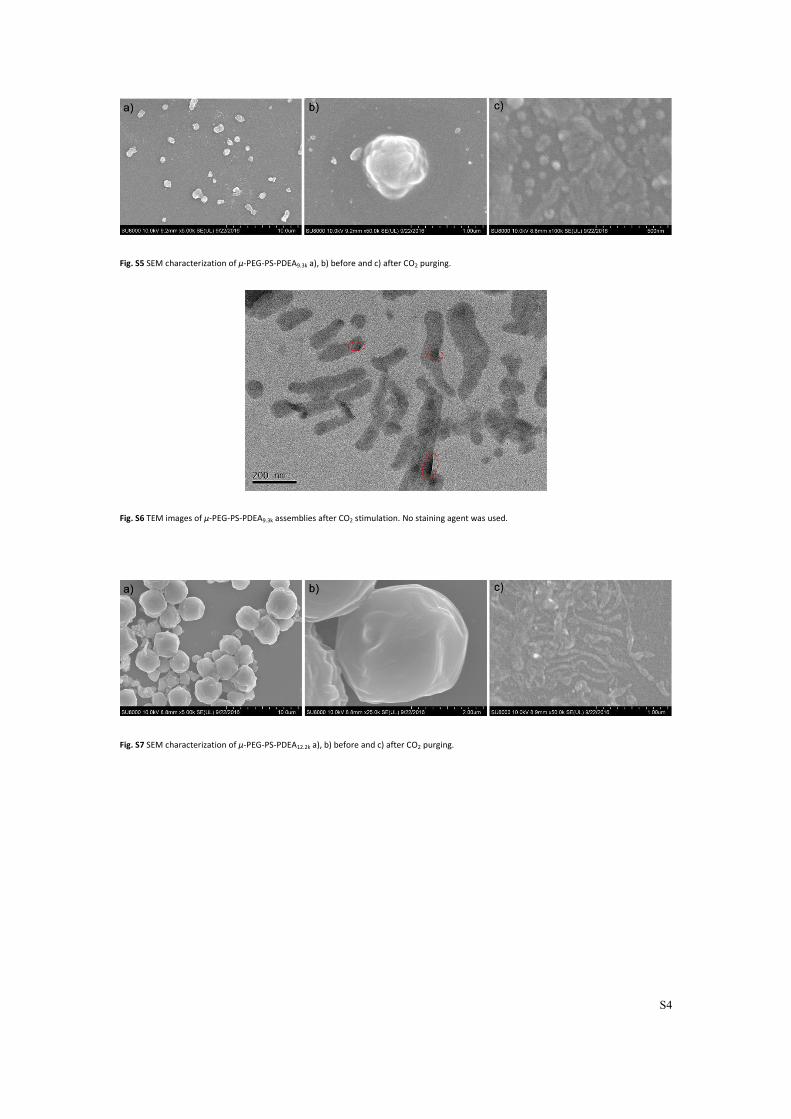
Fig. S5 SEM characterization of μ-PEG-PS-PDEA9.3k a), b) before and c) after CO2 purging.
Fig. S6 TEM images of μ-PEG-PS-PDEA9.3k assemblies after CO2 stimulation. No staining agent was used.
Fig. S7 SEM characterization of μ-PEG-PS-PDEA12.2k a), b) before and c) after CO2 purging.
S5
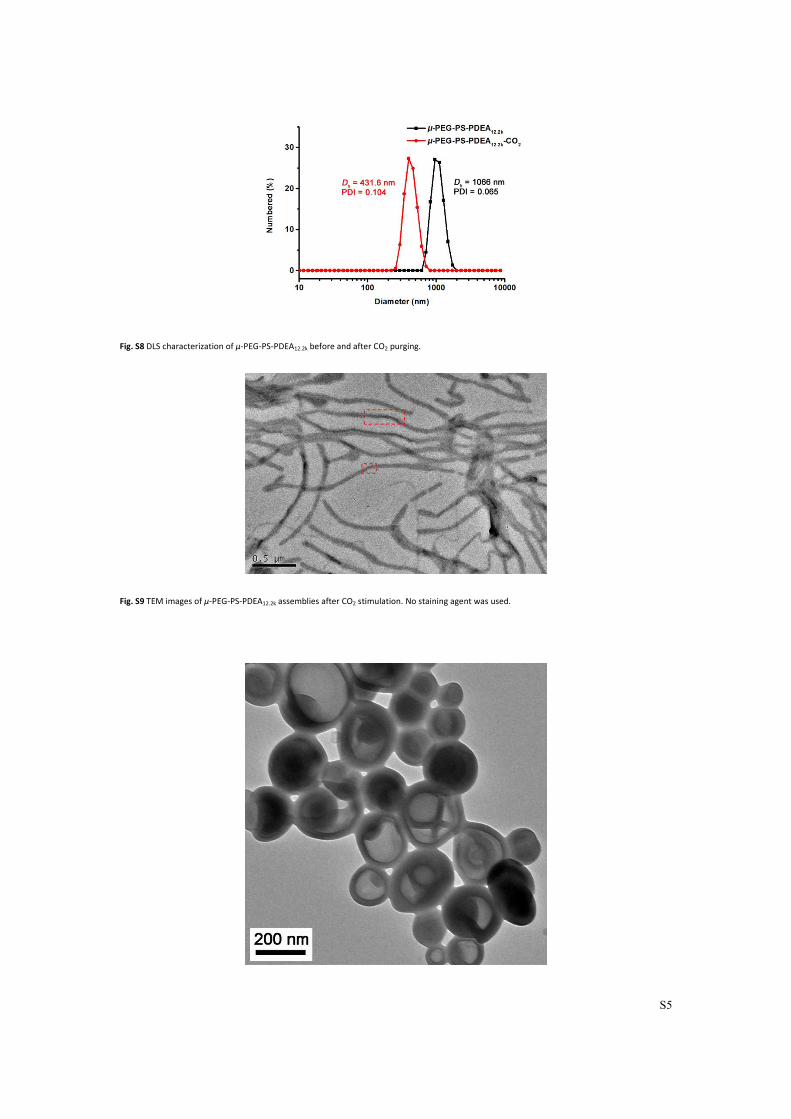
Fig. S8 DLS characterization of μ-PEG-PS-PDEA12.2k before and after CO2 purging.
Fig. S9 TEM images of μ-PEG-PS-PDEA12.2k assemblies after CO2 stimulation. No staining agent was used.
S6
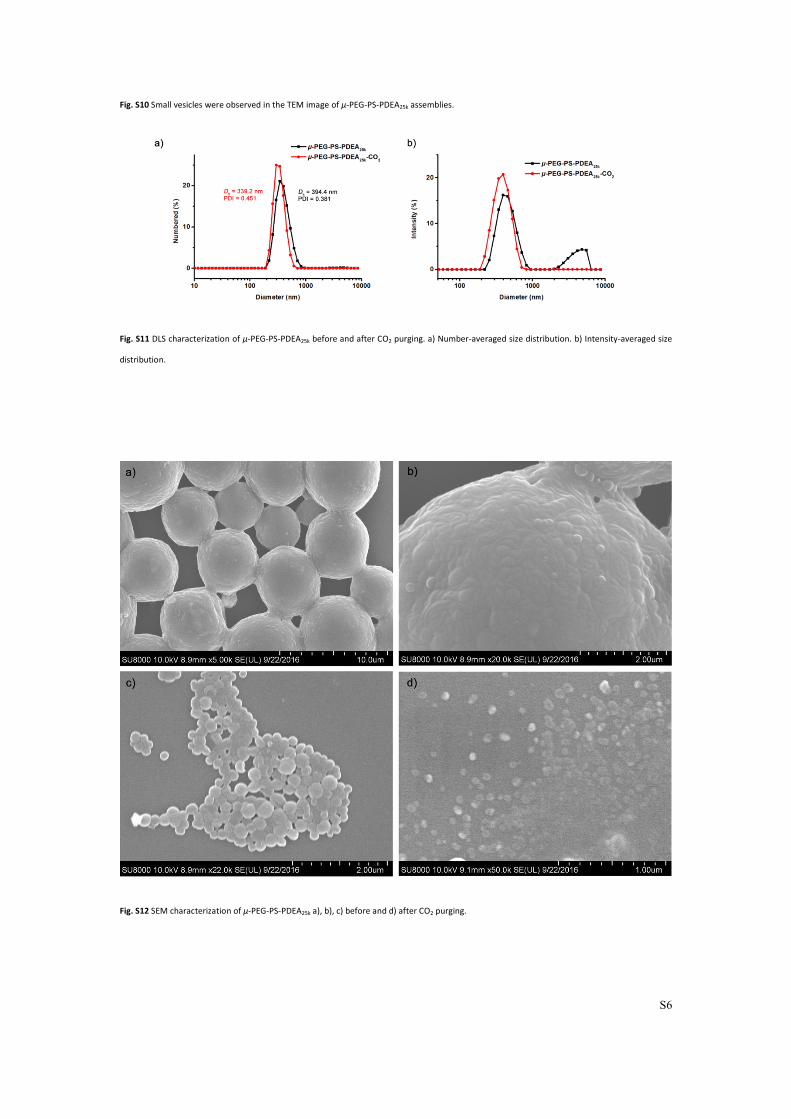
Fig. S10 Small vesicles were observed in the TEM image of μ-PEG-PS-PDEA25k assemblies.
Fig. S11 DLS characterization of μ-PEG-PS-PDEA25k before and after CO2 purging. a) Number-averaged size distribution. b) Intensity-averaged size
distribution.
Fig. S12 SEM characterization of μ-PEG-PS-PDEA25k a), b), c) before and d) after CO2 purging.
S7
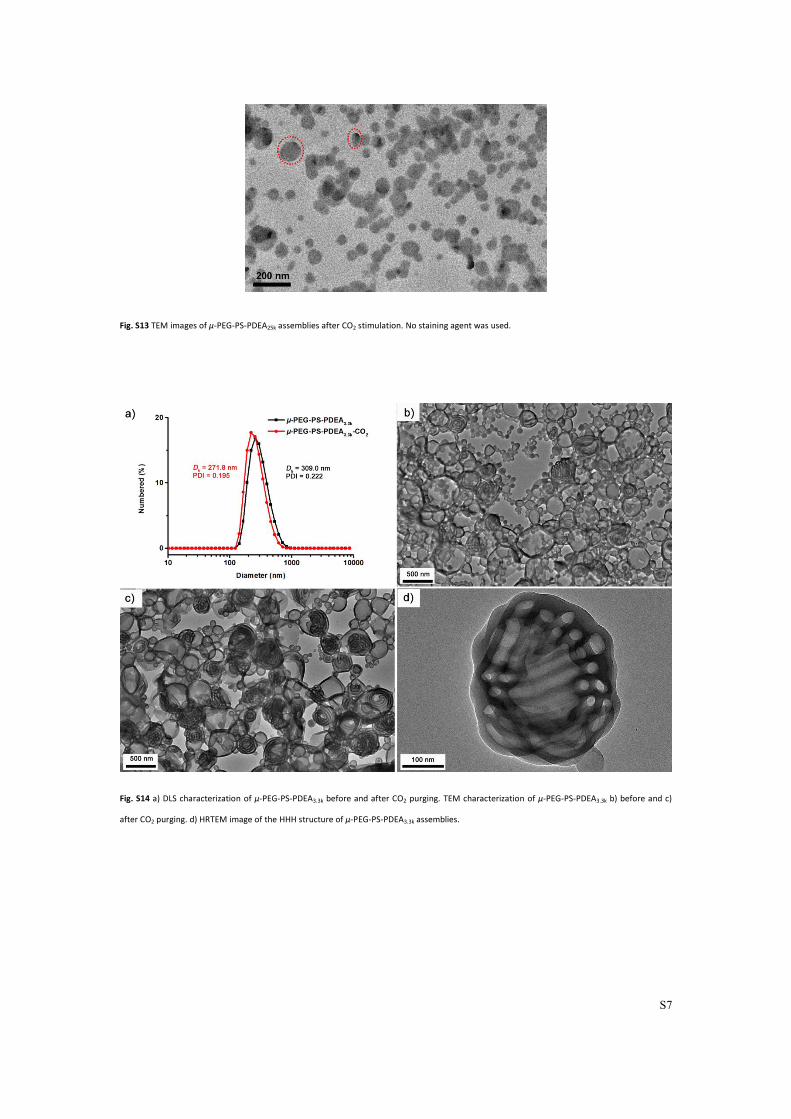
Fig. S13 TEM images of μ-PEG-PS-PDEA25k assemblies after CO2 stimulation. No staining agent was used.
Fig. S14 a) DLS characterization of μ-PEG-PS-PDEA3.3k before and after CO2 purging. TEM characterization of μ-PEG-PS-PDEA3.3k b) before and c)
after CO2 purging. d) HRTEM image of the HHH structure of μ-PEG-PS-PDEA3.3k assemblies.
S8
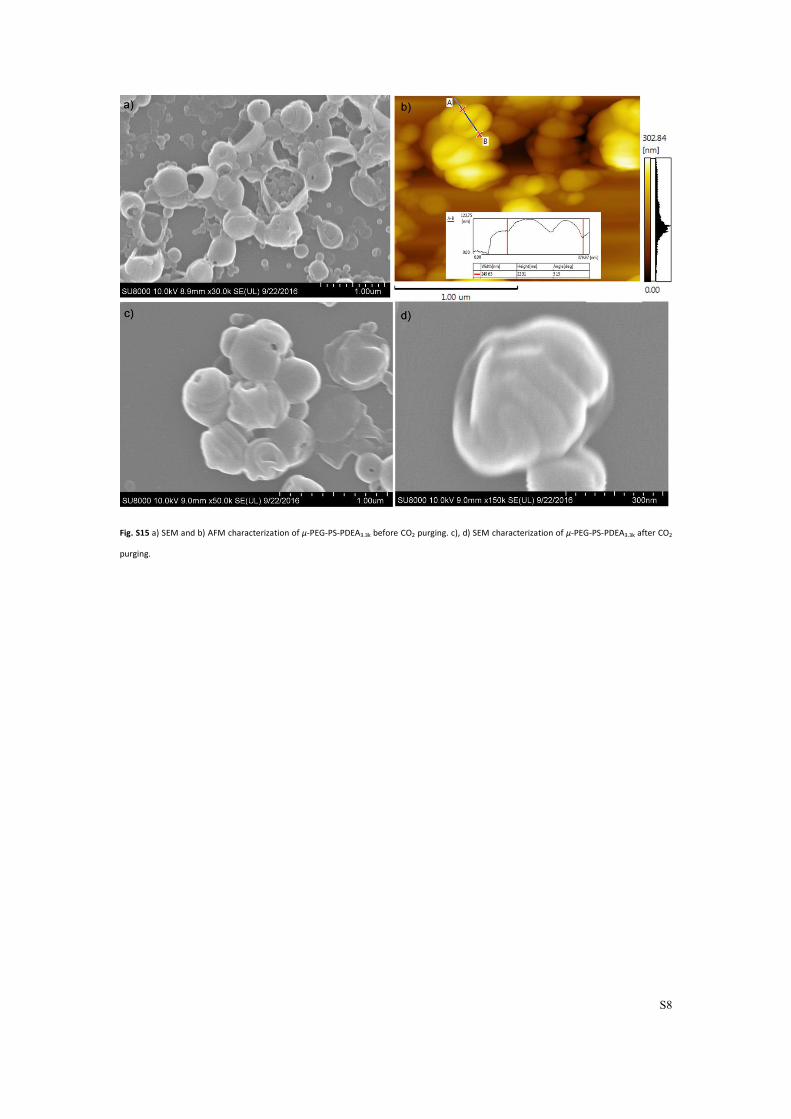
Fig. S15 a) SEM and b) AFM characterization of μ-PEG-PS-PDEA3.3k before CO2 purging. c), d) SEM characterization of μ-PEG-PS-PDEA3.3k after CO2
purging.
S9
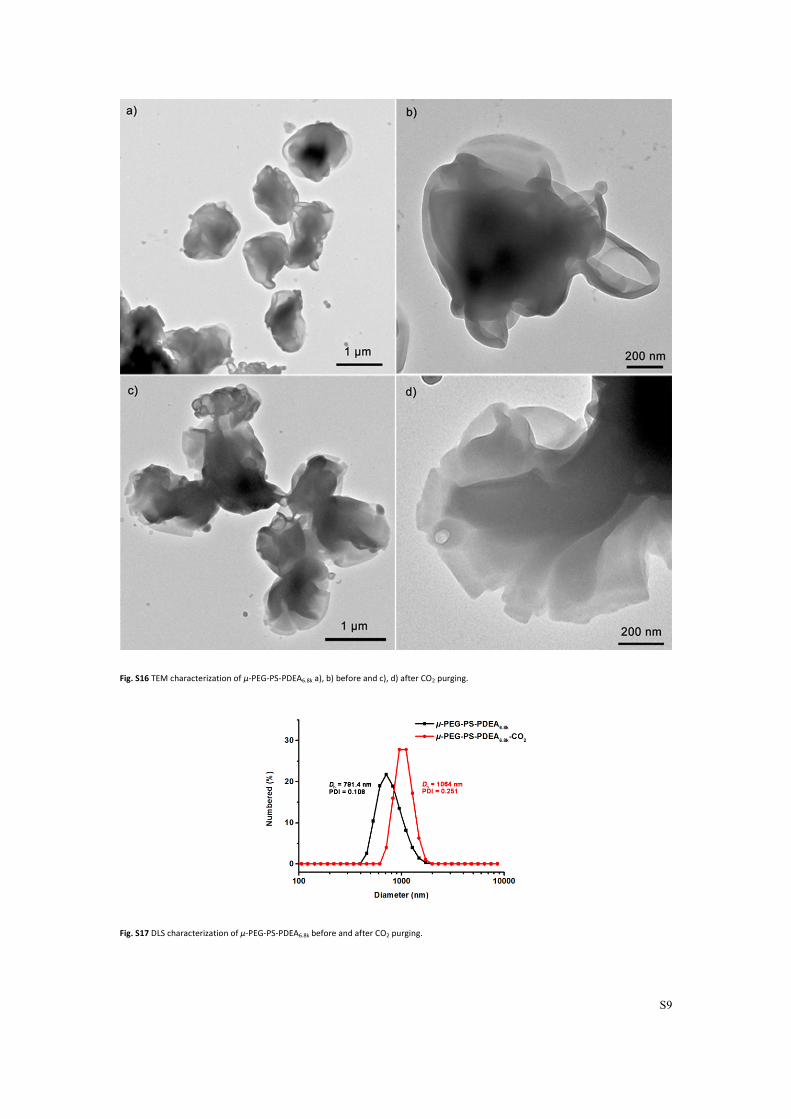
Fig. S16 TEM characterization of μ-PEG-PS-PDEA6.8k a), b) before and c), d) after CO2 purging.
Fig. S17 DLS characterization of μ-PEG-PS-PDEA6.8k before and after CO2 purging.
S10
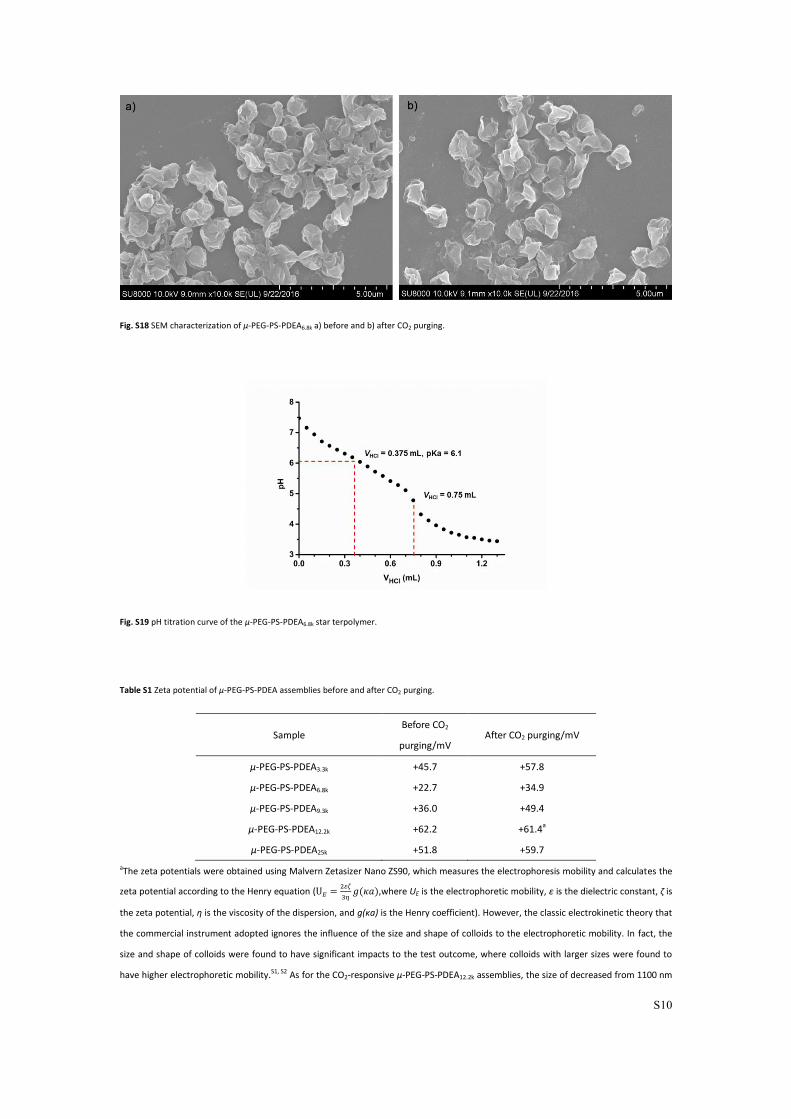
Fig. S18 SEM characterization of μ-PEG-PS-PDEA6.8k a) before and b) after CO2 purging.
Fig. S19 pH titration curve of the μ-PEG-PS-PDEA6.8k star terpolymer.
Table S1 Zeta potential of μ-PEG-PS-PDEA assemblies before and after CO2 purging.
Sample Before CO2
purging/mV After CO2 purging/mV
μ-PEG-PS-PDEA3.3k +45.7 +57.8
μ-PEG-PS-PDEA6.8k +22.7 +34.9
μ-PEG-PS-PDEA9.3k +36.0 +49.4
μ-PEG-PS-PDEA12.2k +62.2 +61.4a
μ-PEG-PS-PDEA25k +51.8 +59.7
aThe zeta potentials were obtained using Malvern Zetasizer Nano ZS90, which measures the electrophoresis mobility and calculates the
zeta potential according to the Henry equation (U𝐸 =2𝜀𝜁
3𝜂𝑔(𝜅𝑎),where UE is the electrophoretic mobility, ε is the dielectric constant, ζ is
the zeta potential, η is the viscosity of the dispersion, and g(κa) is the Henry coefficient). However, the classic electrokinetic theory that
the commercial instrument adopted ignores the influence of the size and shape of colloids to the electrophoretic mobility. In fact, the
size and shape of colloids were found to have significant impacts to the test outcome, where colloids with larger sizes were found to
have higher electrophoretic mobility.S1, S2 As for the CO2-responsive μ-PEG-PS-PDEA12.2k assemblies, the size of decreased from 1100 nm
S11
to 400 nm after purging with CO2, and their morphology evolved from sphere to nano-ribbon, which accounts for the inconspicuous
zeta potential trend observed.
References
S1. L. Vorwerg, M. Antonietti and K. Tauer, Colloids Surf., A, 1999, 150, 129–135.
S2. M. T. Roy, M. Gallardo and J. Estelrich, J. Colloid Interface Sci., 1998, 206, 512–517.