Embed Size (px)
Citation preview

Coastal Waters Research Synergy Framework
Co-ReSyF RA lecture: Bathymetry SAR Alberto Azevedo, Francisco Sancho and Florent Birrien (LNEC)
Paulo Pinto and Luísa Lamas (IH)
This project has received
funding from the European
Union’s Horizon 2020 Research
and Innovation Programme under
grant agreement no 687289

Lecture outline
Aim of this lecture
Introduction
SAR-Bathymetry estimation
Satellite sensors
Example applications
Take home message
Contact us
2

Why should we develop methodologies based on EO data to determine coastal bathymetry?
How can we use SAR satellite sensors to determine
bathymetry?
How the Co-ReSyF platform can be used to
retrieve bathymetry with SAR satellite images?
Example applications…
3Aim of this lecture

What is bathymetry?
The term "bathymetry" originally referred to the
ocean's depth relative to sea level, although it has
come to mean “submarine topography,” or the
depths and shapes of underwater terrain.
4Introduction

Traditional methods for bathymetry detection
Echo Sounders
5Introduction
Single-Beam
courtesy of the Kongsberg Maritime
Multi-Beam

Who are the users?
Research Institutions
Harbour and Coastal Management Authorities
Military Forces
Consultancy Companies
6Introduction

7SAR-Bathymetry estimation
The SAR-imagery bathymetry application provides the
coastal bathymetry underneath a given coastal area
sensed remotely by a Synthetic Aperture Radar (SAR)
satellite sensor, at a given time of acquisition.
Region of application is the continental shelf, bounded
at the coast by the wave breaking region, and at the
sea by the continental shelf break.
The output of the algorithm consists in a DEM for the
target area.

direct estimate of water depth
linear wave dispersion
relationship
Measurement of the ocean
swell wavelength and wave direction
8SAR-Bathymetry estimation
PRINCIPLE
Algorithms initially developed for TerraSAR-X images1:
1 (Brusch et al., 2011; Lehner et al., 2012)

Step 1. Get SAR satellite images over AOI and
retrieved from platform catalogue.
9Co-ReSyF processing chain
Tilt modulation (Robinson, 2004)
Hydrodynamic modulation (Robinson, 2004)
How are swell signatures
generated in a SAR image?
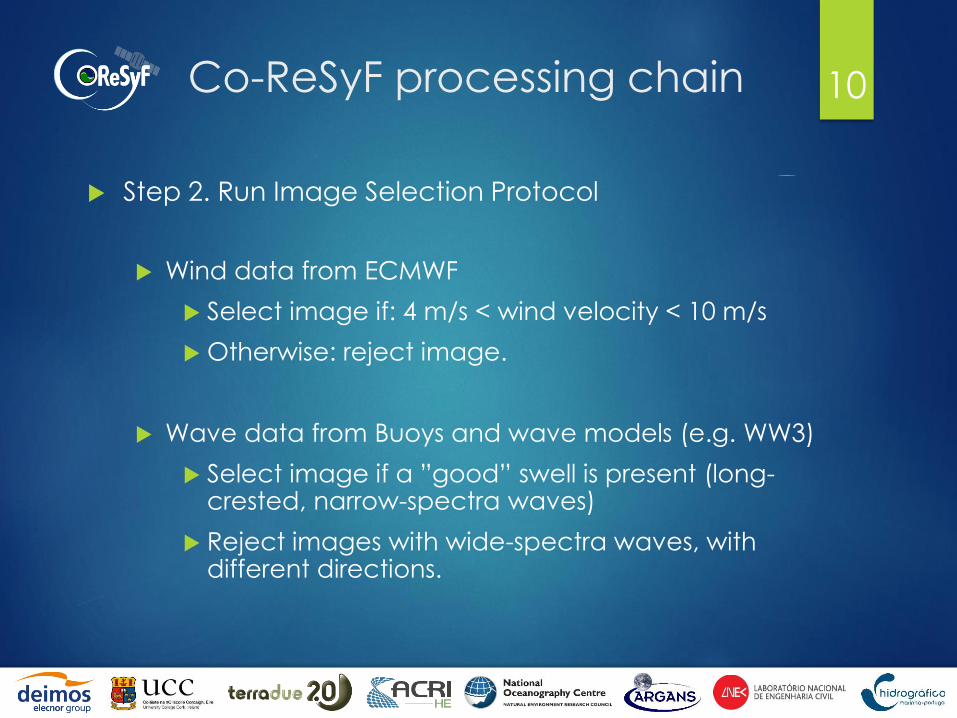
Step 2. Run Image Selection Protocol
Wind data from ECMWF
Select image if: 4 m/s < wind velocity < 10 m/s
Otherwise: reject image.
Wave data from Buoys and wave models (e.g. WW3)
Select image if a ”good” swell is present (long-crested, narrow-spectra waves)
Reject images with wide-spectra waves, with different directions.
10Co-ReSyF processing chain

Step 1. Get SAR satellite images over AOI and
retrieved from platform catalogue.
Step 2. Run Image Selection Protocol
Step 3. Apply radiometric and geometric
corrections to the selected images (e.g.
georeferencing, sigma0, speckel reduction, etc.).
Step 4. 2D-FFT for each sub-image and
identification of peak wave length and direction
Step 5. Inversion of the dispersion relationship.
Step 6. Create final DEM GeoTiFF file.
11Co-ReSyF processing chain

12SAR-Bathymetry estimationWave
Dispersion𝜔2 = 𝑘 𝑔 𝑡𝑎𝑛ℎ 𝑘 𝑑
Wave number (k) → wavelength (L)
Period (T) → Frequency (⍵)
(e.g. model)
Depth (d): 10m < d < 60m
250m < L
𝑘 = 𝑘𝑥2 + 𝑘𝑦
2𝑘 =
2𝜋
𝐿
𝑑 =𝐿
2𝜋𝑎𝑟𝑐𝑡𝑎𝑛ℎ
𝜔2𝐿
2𝜋𝑔
𝜔 =2𝜋
𝑇

13SAR-Bathymetry estimation
1. Choice of SAR Image
2. Definition of AOI and grid
3. 2D-FFT for each sub-image and
identification of peak wave length
and direction
4. Inversion of the dispersion relationship

14
SAR-Bathymetry flowchartS1/K5/TSXDataset
Land mask
BuoysDatabase
or WW3 model
Pre-processing of the
selected SAR images:
Radiometric, Speckle,
Sigma0, crop
For each image
Output
If image is adequate for the
application of the algorithm
FFT calculation: • Definition of the boxes• Determination of the
wavelength and direction of the swell for each FFT box
For each point of the
grid
Otherwise, STOP processing for this image
Visual check
and definition
of bathymetry
AOI
(SNAP, QGIS)
Inversion of the wave dispersion relation
(Wavelength => Depth)
Final productquality check:
Final annotation (QGIS)
Image selectionprotocol
Winddatabase
Definition of the bathymetric grid
Write output files (shp, netcdf, ascii,
etc.)
Topography or Coastlinedatabase
Parallel cloud
computing
Emodnetdatabase

15Ancillary data
Buoys data URL: http://www.hidrografico.pt/boias-ondografo.php
WaveWatch 3 URL 1: http://polar.ncep.noaa.gov/waves/wavewatch/URL 2: http://ariel.lnec.pt/node/17
EMODnetURL: http://www.emodnet.eu
European Centre for Medium-Range Weather
Forecasts URL: https://www.ecmwf.int

16SAR-Bathymetry estimation
On-going
aproaches: ...
using the original
ray-tracing method

The Co-ReSyF SAR-Bathymetry RA is prepared to work with SAR images from the following satellites:
TerraSAR-X (with 1m and 3 m resolution)URL 1: http://www.dlr.de/dlr/en/desktopdefault.aspx/tabid-10377/565_read-436/#/gallery/350
URL 2: https://centaurus.caf.dlr.de:8443/eoweb-ng/template/default/welcome/entryPage.vm
Sentinel-1 (IW-GRD with 10m resolution)URL 1: https://sentinel.esa.int/web/sentinel/missions/sentinel-1
URL 2: https://scihub.copernicus.eu/dhus/#/home
17Satellite sensors

Numerical modeling:
Hydrodynamic, Wave, Storm-Surges and
Morphodynamic modeling.
Coastal management
Dredging activities
Harbour constructions
Coastal erosion studies
Support to military operations abroad
18Example applications

The Co-ReSyF platform:
will incorporate EO data use into multi-disciplinary
research activities by simplifying the process.
takes advantage of state-of-the-art computational
infrastructures and abstracts the users from their
usage complexity.
will have implemented several applications and
toolboxes focused on coastal research.
EO-data methodologies are low-cost, cover a
wider area and easier to obtain when compared
with the traditional methods.
19Take home message

Presently we are developing a new methodology to improve the determination of the wavelength
with 2D-FFT and spectrum analysis.
20Take home message
Applying a 2D-ellipsoid Butterworth filter
Raw spectrum Filter spectrum Filtered spectrum

Laboratório Nacional de Engenharia Civil - Francisco Sancho (Co-ReSyF LNEC’s Coordinator)Email: [email protected]
- Alberto AzevedoEmail: [email protected]
- Florent BirrienEmail: [email protected]
Instituto Hidrográfico- José Paulo PintoEmail: [email protected]
- Luísa LamasEmail: [email protected]
21Contact us