Embed Size (px)
Citation preview
CO-REGULATION OF THE ELECTRON TRANSPORT AND CARBON
ASSIMILATION IN C3 AND C4 PLANTS: THE ROLE OF CFO-CF1 ATP SYNTHASE
By
OLAVI KIIRATS
A dissertation submitted in partial fulfillment of the requirements for the degree of
DOCTOR OF PHILOSOPHY
WASHINGTON STATE UNIVERSITY School of Biological Sciences
MAY 2009

To the Faculty of Washington State University:
The members of the Committee appointed to examine the dissertation of
OLAVI KIIRATS find it satisfactory and recommend that it be accepted.
___________________________________
Gerald E. Edwards, Ph.D., Chair
___________________________________
David M. Kramer, Ph.D.
___________________________________
Alan R. Black, Ph.D.
ii

ACKNOWLEDGMENT
I am very grateful to my advisor Prof. Gerald E. Edwards who was kind enough to
take the time for extensive discussions of the theoretical and experimental aspects of the
thesis as well as provided help in finalizing it in a logical readable form. I would like to thank
my co-adviser Prof. David Kramer. His ideas made this thesis possible. Help provided by Dr.
Jeffrey Cruz in measurements of electrochromic shift in leaves is greatly appreciated. I
would also like to thank Dr. Agu Laisk and Dr. Vello Oja from University of Tartu who gave
me my first guidance into the world of science after graduation from the University of Tartu.
I would like to acknowledge financial support from Washington State University’s
School of Biological Sciences through a teaching assistantship during my Ph.D. program,
and support to participate in conferences from Higinbotham awards.
iii
CO-REGULATION OF THE ELECTRON TRANSPORT AND CARBON
ASSIMILATION IN C3 AND C4 PLANTS: THE ROLE OF CFO-CF1 ATP SYNTHASE
Abstract
by Olavi Kiirats, Ph.D. Washington State University
May 2009
Chair: Gerald E. Edwards
Photosynthetic electron transport and Calvin cycle reactions need to be co-regulated
in order to provide optimal flux into end product and minimize the formation of reactive
oxygen species leading to photo-inhibition. An important means of dissipating excess energy
is mediated by an increased acidification in the lumen of thylakoid membranes of the
chloroplast which has been proposed to occur through increased photochemistry through
cyclic electron flow (CEF) via photosystem (PS) I, or by linear electron flow in the Mehler
reaction. We have shown that decreases in the thylakoid membrane ATP synthase
conductance to protons is an important component in this dissipation of excess energy and
photoprotection. It is universal and it takes place in C3 plants, as well as in all three
biochemical subtypes of C4 plants. C4 plants showed a similar pattern of ATP synthase
regulation to C3 plants despite the differences in photosynthetic carbon metabolism. Down-
regulation of ATP synthase proton conductivity at low CO2 and high light increases
intrathylakoid H+ concentration which activates the energy dissipation mechanism, thus
protecting PS II. Three mutants were tested which provided support for this hypothesis: one
in photochemistry (related to CEF), one in CO2 fixation (Rubisco = ribulose 1,5-
bisphosphate carboxylase oxygenase), and one in carbohydrate biosynthesis (starch-less). A
iv
possible mechanism of regulating ATP-synthase conductance to protons is through the levels
of inorganic phosphate (Pi) in the chloroplast stroma, since this is a substrate for the enzyme.
We tested this hypothesis using a starch-less mutant. This mutant is limited in utilizing the
products of photosynthesis and is considered to cause a build-up of organic-P, a depletion of
Pi and feedback inhibition of photosynthesis. ATP synthase conductivity closely followed the
change in activity of carbon fixation reactions, which supports the hypothesis that Pi is a
regulator of ATP synthase. The low Rubisco mutant of tobacco and a mutant of Arabidopsis
which affects CEF also provided support for regulation of ATP synthase conductance having
a key role in photoprotection and dissipation of excess energy.
v

TABLE OF CONTENTS
Page
ACKNOWLEDGEMENTS................................................................................................ iii
ABSTRACT.........................................................................................................................iv
TABLE OF CONTENTS.....................................................................................................vi
LIST OF FIGURES .............................................................................................................ix
LIST OF ABBREVIATIONS............................................................................................. xi
GENERAL INTRODUCTION………………………………………………………..……1
CHAPTER 1 Feedback limitation of leaf photosynthesis induces non-photochemical
quenching and down-regulates electron transport activity by decreasing proton conductivity
of CFo-CF1 ATP synthase………..……………………………………………..………....12
Abstract .......................................................................................................................12 Introduction ................................................................................................................13 Methods.......................................................................................................................16 Results ……………………………………………………………………………….20 Discussion ...................................................................................................................31 References....................................................................................................................37
CHAPTER 2 Co-regulation of dark and light reactions in three subtypes of C4
species……………………………………………………………..………………………46
Abstract .......................................................................................................................46 Introduction ................................................................................................................47 Methods.......................................................................................................................50 Results ………………………………………………………………………...…….52 Discussion ...................................................................................................................63 References....................................................................................................................67
CHAPTER 3 The use of photosynthetic mutants to elucidate the mechanism of regulation of
photosynthesis by ATP synthase under variable climatic conditions.................................72
vi

Abstract .......................................................................................................................72 Introduction ................................................................................................................73 Methods.......................................................................................................................75 Results and Discussion ………………………………..………………………….....77 References...................................................................................................................91 APPENDIX Other research contributions during Ph.D. studies…….………………..…95
vii

Dedication
This dissertation is dedicated to my mother Aili who provided moral support for my
education and who helped me financially during my undergraduate years at Tartu University.
viii

LIST OF FIGURES
Figure 1. Typical steady state CO2 response curve. .......................................................... 4
Figure 1.1. Measurements in wild type and starchless mutant N. sylvestris of the CO2
assimilation rates (A), gross rates of O2 evolution (JO2), electrochromic shift (ECSt), ATP
synthase proton conductivity (gH+) and fluorescence parameters (qE and 1-qL) with changes
in intercellular levels of CO2…………………………………………………………….... 21
Figure 1.2. Relationship between vc+vo and JO2.……………………………………….....23
Figure 1.3 Steady state electron transport parameters at 2 vs. 21% O2 in wild type and
starchless mutant of N. sylvestris at 2000 µbar CO2 and 800 µmol m-2s-1 PFD, and 25oC.26
Figure 1.4. Illustration of the transient change, and inhibition of the rate of CO2 assimilation,
when the O2 concentration was changed from 21% to 2% in the starchless mutant of N.
sylvestris at 2000 µbar CO2, 800 µmol m-2s-1 absorbed PFD, and 32 °C………………….28
Figure 1.5. The effect of varying levels of O2 on photosynthetic parameters in the starchless
mutant of N. sylvestris…………………………………………………………………… 29
Figure 1.6. The scheme of Pi effects on electron transport and energy dependent exiton
quenching…………….................................................................………..….. …. . … 37
Figure 2.1. Light response of photosynthesis parameters for three C4 subtypes: Sorghum
bicolor (NADP-ME), Amaranthus edulis (NAD-ME) and Panicum texanum (PEP-CK)..53
Figure 2.2. Plots of data from figure 2.1 to show the relationships among different
parameters…………………………………………………………………………………55
Figure 2.3. The response of multiple photosynthetic parameters to varying CO2 for the three
C4 subtype species…………………………………………………………………………59
ix

Figure 2.4. Plots of gross rates of O2 evolution (JO2, PS II electron transport rate per 4 e-)
against proton conductivity and against proton steady state flux (data from experiment Fig.
2.3) for the three C4 subtype species…………………..…………………………………….61
Figure 2.5. The response of leaf ECSt (ΔA520) and thylakoid proton conductivity (gH+) to
increasing O2 in CO2 free gas and at 20, 40 and 80 µbar CO2 in the C4 species Sorghum
bicololor…………………………………………………………………………………… .62
Figure 3.1. Arabidopsis pgr5 mutant and wild type used in the experiments ………….....78
Figure 3.2. Light response of Arabidopsis pgr5 mutant (A, B) compared to wild type (C, D)
photosynthetic parameters at 1000 µbar CO2, 2% O2, and 24 oC………………………….79
Figure 3.3. CO2 response of Arabidopsis pgr5 mutant (A, B, C) compared to wild type (D, E,
F)…………………………………………………………………………………..……… 80
Figure 3.4. Response of photosynthetic parameter to changes in CO2 in tobacco Rubisco
antisense mutant at 240 (opened symbols) and 840 (closed symbols) µmol quanta m-2s-1 light,
21% O2, (A, B, C) and 2% O2 (D, E, F) at 24 oC……………………………………….....85
Figure 3.5. Relationship between linear electron transport rates (expressed as gross rates of
oxygen evolution rate JO2) relative to proton efflux rate vH+ (arbitrary values) at two light
intensities 240 (panel A) and 840 µmol m-2s-1 (panel B) and two oxygen concentrations 2 and
21% (data from figure 3, vH+= ECSt*gH
+)……………………………………………… . 87
Figure 3.6. CO2 response of tobacco Rubisco anti-sense mutant photosynthetic parameters at
380 µmol m-2s-1 APFD, 21% O2 and 23oC.………………………………………………. 88
Figure 3.7. RuBP content in leaves of the Rubisco anti-sense mutant of tobacco as a function
of the CO2 partial pressure on the leaf surface (Ca)……………………………………… 90
x

LIST OF ABBREVIATIONS
A net rate of CO2 fixation (µmol m-2s-1)
AC assimilatory charge (post-illumination uptake of CO2), (µmol m-2)
AGP ADP-glucose pyrophosphorylase
APFD absorbed photosynthetic quantum flux density (µmol m-2s-1)
CET cyclic electron transport
CFoCF1 ATP synthase thylakoid membrane ATP synthase
ECS electrochromic shift
ECSt total electrochromic shift ~ pmf, (ΔA520)
ΦPSII PS II quantum yield (Fv/FM’)
ΦPSI PS I quantum yield
Fd ferredoxin
gH+ ATP synthase proton conductance (s-1)
JO2 gross rate of O2 evolution from PSII (µmol m-2s-1)
JPS1 PS I electron transport rate (µmol electrons m-2s-1/4)
LED light emitting diode
LEF linear electron flow (µmol m-2s-1)
LHC light harvesting complex
NDH NAD(P)H dehydrogenase
NPQ non-photochemical quenching
qE non-photochemical energy dependent quenching (heat dissipation)
1-qL reductive state of plastoquinone pool
Pi inorganic phosphate, ortho-phosphate
xi

PFD incident photosynthetic quantum flux density (µmol m-2s-1)
PS I photosystem I
PS II photosystem II
pmf proton motive force
RD rate of dark-type mitochondrial respiration (µmol m-2s-1)
Rubisco ribulose 1,5-bisphosphate carboxylase oxygenase
TPU triose-phosphate utilization
vc velocity of (Rubisco) carboxylase (µmol m-2s-1)
vo velocity of (Rubisco) oxygenase (µmol m-2s-1)
vc + vo rate of RuBP utilization by Rubisco (µmol m-2s-1)
vH+ proton flux
xii
GENERAL INTRODUCTION
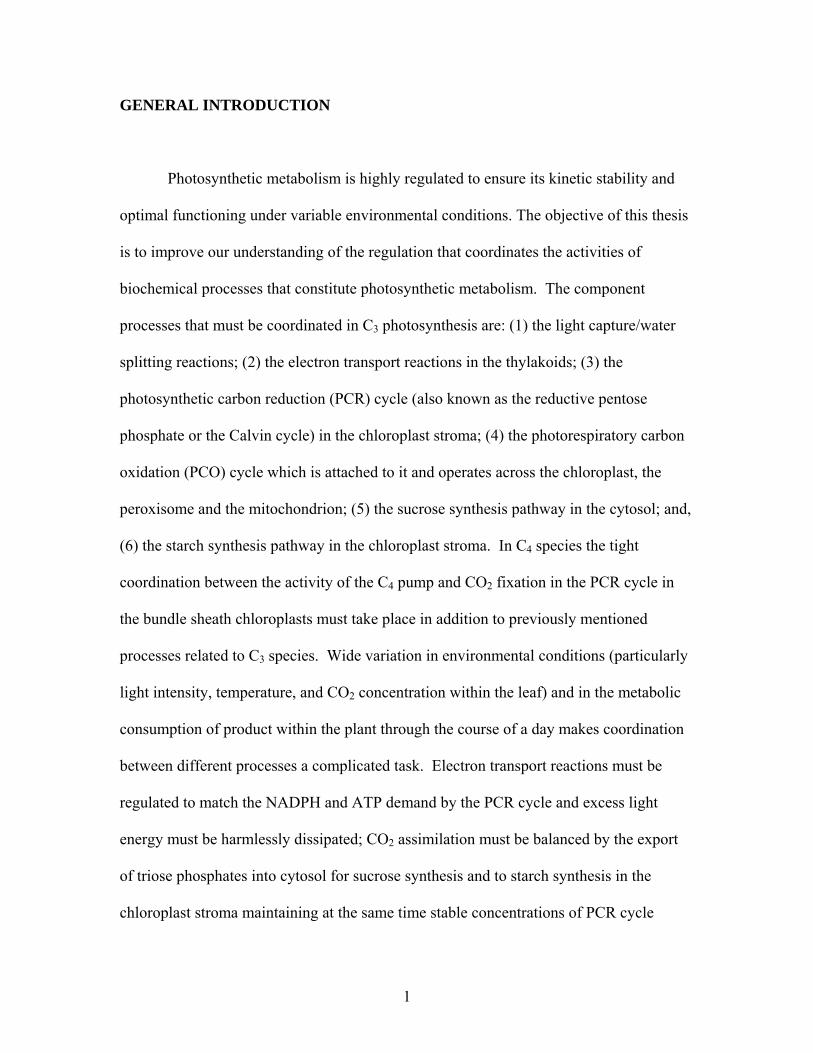
Photosynthetic metabolism is highly regulated to ensure its kinetic stability and
optimal functioning under variable environmental conditions. The objective of this thesis
is to improve our understanding of the regulation that coordinates the activities of
biochemical processes that constitute photosynthetic metabolism. The component
processes that must be coordinated in C3 photosynthesis are: (1) the light capture/water
splitting reactions; (2) the electron transport reactions in the thylakoids; (3) the
photosynthetic carbon reduction (PCR) cycle (also known as the reductive pentose
phosphate or the Calvin cycle) in the chloroplast stroma; (4) the photorespiratory carbon
oxidation (PCO) cycle which is attached to it and operates across the chloroplast, the
peroxisome and the mitochondrion; (5) the sucrose synthesis pathway in the cytosol; and,
(6) the starch synthesis pathway in the chloroplast stroma. In C4 species the tight
coordination between the activity of the C4 pump and CO2 fixation in the PCR cycle in
the bundle sheath chloroplasts must take place in addition to previously mentioned
processes related to C3 species. Wide variation in environmental conditions (particularly
light intensity, temperature, and CO2 concentration within the leaf) and in the metabolic
consumption of product within the plant through the course of a day makes coordination
between different processes a complicated task. Electron transport reactions must be
regulated to match the NADPH and ATP demand by the PCR cycle and excess light
energy must be harmlessly dissipated; CO2 assimilation must be balanced by the export
of triose phosphates into cytosol for sucrose synthesis and to starch synthesis in the
chloroplast stroma maintaining at the same time stable concentrations of PCR cycle
1

intermediates. In this work we focus on coordination between carbon assimilation
reactions and regulation of light harvesting and electron transport.
General overview of the regulation of light reactions
During photosynthesis light is absorbed by light harvesting complexes and light
energy is harnessed by photochemical reactions to generate NADPH and proton motive
force (pmf). The latter includes the proton concentration difference across the thylakoid
membrane (ΔpH) and electrical potential difference (ΔΨ), both of which are used to drive
synthesis of ATP catalyzed by the proton translocating CFoCF1 ATP synthase of the
thylakoid membrane. The excess light is dissipated by means of non-photochemical
processes in order to avoid over-reduction of the electron transport chain and formation
of highly reactive oxygen radicals. Initiation of energy dependent quenching (qE)
involves activation (via protonation) of violaxanthin de-epoxidase and PsbS, a
component of the photosystem II (PS II) antenna complex, as a result of lumen
acidification driven by photosynthetic electron transfer (reviewed by Miller et al., 2001;
Horton et al., 1996; Niyogi et al. 2005).
Electron transport chain in thylakoid membranes is sometimes described as a
molecular conveyer belt for electrons (Critchley, 1988). Electrons are pulled from water
and transferred from the PS II reaction center (P680) to a downhill energy gradient through
pheophytin, QA and QB to plastoquinone. Plastoquinone diffuses in the thylakoid
membrane. It picks up two protons from chloroplast stroma and reacts with the
cytochrome b6f complex passing one electron through the Rieske protein and cytochrome
f to plastocyanin and the other into the Q cycle. Plastocyanin passes electrons to PS I
(P700+) which eventually reduces ferredoxin. Electrons from ferredoxin can be used in
2

multiple ways but the main path is to NADPH that is used mostly as a reductant in Calvin
cycle. The rate-limiting reaction in the thylakoid linear electron transport is the oxidation
of plastoquinol by cytochrome b6f complex and it is controlled by the concentration of
plastoquinol and by the pH of the thylakoid lumen (Stiehl and Witt, 1969; Joliot and
Joliot, 1992).
It has been recognized that for high rates of carbon assimilation NADPH and ATP
need to be produced in correct stoichiometry, ATP/ADP, NADPH/NADP and ΔpH needs
to be kept within a certain range. The latter is achieved through regulation on many levels
including cyclic and psudocyclic photophosphorylation, feed-forward regulation of
Calvin cycle via the thioredoxin system, regulation of the NADPH/ATP ratio with NADP
malate dehydrogenase (“malate valve”), and regulation of Calvin cycle by metabolite
levels and allosteric interactions (reviewed Baker et al., 2007). Many details and
quantitative relationships of the regulation still need to be discovered. One of the
questions studied in this work is how coordination between PCR/PCO cycles and light
reactions is established when CO2 assimilation is restricted by lack of substrate or by
stressful conditions at high light?
Limiting reactions and regulation of photosynthetic carbon metabolism
Response of the photosynthesis rate to CO2 usually reveals a so called Blackman
type curve (Blackman, 1905): the initial increase of the CO2 assimilation rate levels off
and becomes insensitive to further increase of the substrate (Fig. 1). The reason for such
kinetic behavior is the presence of several potentially limiting reactions in the system that
limit the flux of carbon under different conditions. With increasing CO2 under light
saturation the initial rise in CO2 assimilation is limited by Rubisco activity in C3 plants
3
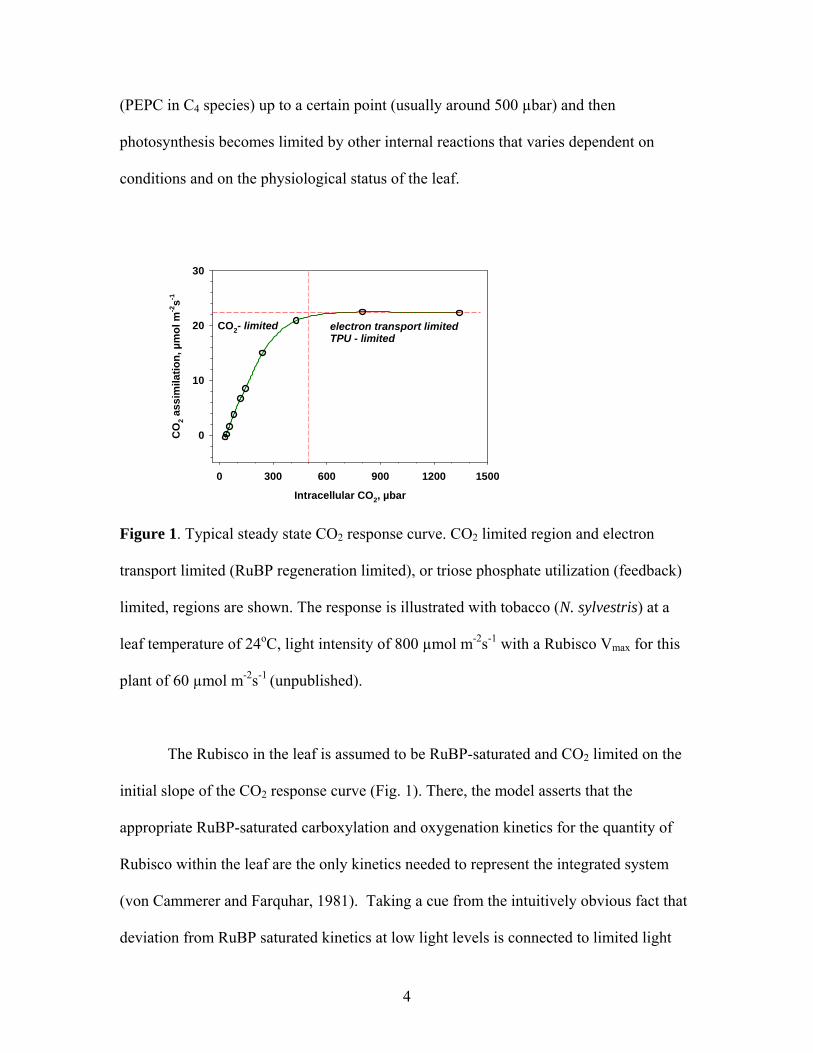
(PEPC in C4 species) up to a certain point (usually around 500 µbar) and then
photosynthesis becomes limited by other internal reactions that varies dependent on
conditions and on the physiological status of the leaf.
Intracellular CO2, µbar
0 300 600 900 1200 1500
CO
2 ass
imila
tion,
µm
ol m
-2s-1
0
10
20
30
CO2- limited electron transport limitedTPU - limited
Figure 1. Typical steady state CO2 response curve. CO2 limited region and electron
transport limited (RuBP regeneration limited), or triose phosphate utilization (feedback)
limited, regions are shown. The response is illustrated with tobacco (N. sylvestris) at a
leaf temperature of 24oC, light intensity of 800 µmol m-2s-1 with a Rubisco Vmax for this
plant of 60 µmol m-2s-1 (unpublished).
The Rubisco in the leaf is assumed to be RuBP-saturated and CO2 limited on the
initial slope of the CO2 response curve (Fig. 1). There, the model asserts that the
appropriate RuBP-saturated carboxylation and oxygenation kinetics for the quantity of
Rubisco within the leaf are the only kinetics needed to represent the integrated system
(von Cammerer and Farquhar, 1981). Taking a cue from the intuitively obvious fact that
deviation from RuBP saturated kinetics at low light levels is connected to limited light
4

capture/electron transport activity, Farquhar et al. (1980) presumed that the deviation
from RuBP-saturated Rubisco kinetics at high light and CO2 was a result of a limited
capacity for electron transport. There is experimental evidence that the capacity of the
light reactions may exceed that required to support maximum rates of CO2 assimilation
(Dietz and Heber, 1984; Stitt, 1986). A more recent view considers that CO2 saturated
rates of photosynthesis is a compromise between the light reactions, Calvin cycle activity
(RuBP regeneration) and feedback influences from limited capacity for starch and
sucrose synthesis (TPU, triose-phosphate utilization) (Woodrow and Berry, 1988). The
details of how the potential for the CO2 saturated, and the light-saturated, rate of
photosynthesis is determined and regulated still needs to be discovered.
Feedback regulation of photosynthesis
High levels of CO2 or low temperatures at ambient conditions sometimes lead to
so called “feedback limitation” where capacity for end product synthesis, sucrose and
starch, becomes limiting. Considerable evidence has accumulated that feedback
limitations represent the situation in which the fraction of total chloroplast ortho-
phosphate (Pi) free to enter new fixation reactions becomes limiting. As the rate of end
product synthesis determines the rate at which Pi recycles back to Calvin cycle and
becomes available for ATP synthesis reactions in chloroplast stroma triose phosphate
utilization can effectively limit photosynthesis. Specifically, under feedback conditions
the availability of Pi is believed to limit the production of ATP (Sharkey, 1985).
Feedback conditions can occur at elevated CO2 and saturating light due to a
limitation on utilization of triose-P, the product of CO2 assimilation. This is
characterized by oxygen insensitivity of CO2 assimilation (Cornic and Louason, 1980),
5

or by an increase in the rate of CO2 assimilation by oxygen (McVetty and Canvin, 1981;
Viil et al., 1972), as opposed to oxygen inhibition at low CO2 due to photorespiration
caused by oxygen competition with CO2 for reaction with RuBP. Since the availability of
Pi has been suggested to be limiting under feedback conditions, the inhibition of
photosynthesis by low O2 has been explained by reduction in Pi availability (Sharkey,
1985; Sharkey and Vassey, 1989).
When photosynthesis is limited under high light by either the availability of CO2,
or by feedback due to limited utilization of triose-P, electron transport is considered to be
limited from the carbon side of photosynthesis, resulting in an increased need to
harmlessly dissipate excess absorbed light energy. The question is how this requirement
to dissipate energy is signaled to light reactions and how the protective mechanisms are
activated? One possible answer emphasizes on activation of cyclic electron flow or
electron flow to O2 (Mehler reaction) under these conditions signaled by an increase in
the reduction state of the system (Heber and Walker, 1992). Cyclic electron flow and
Mehler reaction activity are relevant to our project as they both pump protons but do not
produce reducing equivalents for the Calvin cycle. Recent work with the Arabidopsis
PGR5 mutant, which possibly blocks cyclic electron transport (around PS I) (Munekage
et al., 2004; Munekage et al., 2002), suggests that cyclic electron flow needs to be
present for efficient photoprotection.
Kramer and coworkers (Kanazawa and Kramer, 2002; Kramer et al., 2003;
Kramer et al., 2004) have demonstrated a strong decrease in ATP synthase conductivity
and increased modulation of qE when the CO2 and O2 concentrations are lowered. This
has led to a hypothesis that ATP synthase activity modulation is the major regulatory
6
point, and that it is controlled at the substrate level by the availability of Pi in the stroma
of the chloroplast.
Pi hypothesis for regulation of ATP synthase and intrathylakoid pH
The important property of the photosynthesis system is the constancy of stromal
inorganic and esterified phosphate, at least in the short term. The movement of phosphate
between cytosol and chloroplast stroma via the phosphate translocator does not have a net
phosphate flux (Fleige et al., 1978; Flügge, 1991). This property not only ties free Pi
concentration in chloroplast stroma to the rate of Pi recycling from starch and sucrose
synthesis; but, also to Pi partitioning between free Pi and esterification in pools of Calvin
cycle intermediates. The other property of photosynthesis is the relatively high KM for Pi
for (~0.9 mM) for ATP synthase (Grotjohann and Gräber, 2002). Taking together these
phenomena makes Pi a good candidate as a regulator of ATP synthesis. Whether or not
our results are consistent with, or support, this hypothesis were evaluated in this thesis.
ATP synthase may be allosterically regulated to modulate non-photochemical
quenching in changing environmental conditions. There is evidence for thiol modulation
of the enzyme by reductive conditions (Bald et al., 2001), recently the regulatory protein
(14-3-3 protein) has been described as having an effect of ATP synthase activity (Bunney
et al., 2001) and multiple phosphorylation sites have been reported (del Riego et al.,
2006).
Chapter 1 of the thesis is a study of changes in photosynthetic parameters and
regulation under feedback inhibition utilizing a wild-type and starch deficient mutant of
tobacco. Chapter 2 is a study of the regulation of photosynthesis during C4
photosynthesis utilizing representative species for the three types of C4 cycle. C4 plants,
7
in comparison to C3 plants, have low rates of photorespiration, photosynthetic
coordination of photosynthesis between two photosynthetic cell types, and differences in
the requirement for ATP/NADPH per CO2 fixed. Chapter 3 is a study to evaluate
different possible mechanisms of regulation of light harvesting and electron transport by
ATP synthase using photosynthetic mutants.
REFERENCES
Bald D, Noji H, Yoshida M, Hirono-Hara Y, and Hisabori T (2001) Redox
Regulation of the Rotation of F1-ATP Synthase. J. Biol. Chem. 276: 39505–39507.
Baker NR, Harbinson J, Kramer DM (2007) Determining the limitations and
regulation of photosynthetic energy transduction in leaves. Plant, Cell and Environment
30: 1107-1125.
Critchley C (1988) The chloroplast thylakoid membrane system is a molecular conveyor
belt. Photosynthesis Research 19: 265-276.
Blackman, FF (1905) Optima and limiting factors. Ann. Bot. 19: 281-295.
Cammerer von S and Farquhar GD (1981) Some relationships between the
biochemistry of photosynthesis and the gas exchange of leaves. Planta 153: 376-387.
Bunney TD, van Walraven HS and de Boer AH (2001) 14-3-3 protein is a regulator of
the mitochondrial and chloroplast ATP synthase. PNAS 98: 4249-54.
Cornic G, Louason G (1980) The effects of O2 on net photosynthesis at low temperature
(5oC). Plant, Cell Environ. 3: 147-157.
Dietz K-J and Heber U (1984) Rate-limiting factors in leaf photosynthesis. I. Carbon
fluxes in the Calvin cycle. Bochim. Biophys. Acta 767: 432-443.
8

Farquhar GD, von Caemmerer S, and Berry JA (1980) A biochemical model of
photosynthetic CO2 assimilation in leaves of C3 species. Planta 149: 78-90.
Fliege, R, Flügge, UI, Werdan K, Heldt H (1978) Specific transport of inorganic
phosphate, 3-phosphoglycerate and triose phosphates across the inner membrane of the
envelope of spinach chloroplasts. Biochim. Biophys. Acta 502: 232-247.
Flügge, U-I (1991) Metabolite translocators of the chloroplast envelope. Annu. Rev.
Plant Physiol. Plant Mol. Biol. 42: 129-144.
Grotjohann I and Gräber P (2002) The H+-ATPase from chloroplasts: effect of
different reconstruction procedures on ATP synthase activity and on phosphate
dependence of ATP synthesis. Biochim. Biophys. Acta 1556: 208-216.
Heber U, Walker D (1992) Concerning a dual function of coupled cyclic electron
transport in leaves. Plant Physiol. 100: 1621-1626.
Horton P, Ruban AV, Walters RG (1996) Regulation of light harvesting in green
plants. Annu. Rev. Plant Physiol. Plant Mol. Biol. 47: 655-684.
Joliot P and Joliot A (1992) Electron transfer between Photosystem II and the
cytochrome b/f complex: mechanistic and structural implications. Biochim. Biophys.
Acta 1102: 53-61.
Kanazawa A, Kramer DM (2002) In vivo modulation of nonphotochemical exciton
quenching (NPQ) by regulation of the chloroplast ATP synthase. PNAS 99: 12789-
12794.
Kramer DM, Avenson T, Edwards GE (2004) Dynamic flexibility in the light reactions
governed by both electron and proton transfer reactions. Trends in Plant Science 8: 349-
357.
9

McCauley S and Melis A (1986) Quantitation of plastoquinone photoreduction in
spinach chloroplasts. Photosynthesis Research 8: 3-16.
McVetty PBE, Canvin DT (1981) Inhibition of photosynthesis by low oxygen
concentrations. Can. J. Bot. 59: 721-725.
Miller P, Li X-P, Niyogi KK (2001) Non-photochemical quenching: A response to
excessive light energy. Plant Physiol. 125: 1558-1566.
Munekage Y, Hoyo M, Meurer J, Endo T, Tasaka M (2002) PGR5 is involved in
cyclic electron flow around photosystem I and is essential for photoprotection in
Arabidopsis. Cell 110: 361-371.
Munekage Y, Hashimoto M, Miyake C, Tomizawa K-I, Endo T, Tasaka M,
Shikanai T (2004) Cyclic electron flow around photosystem I is essential for
photosynthesis. Nature 429: 579-582.
Niyogi KK, Li XP, Rosenberg V, Jung HS (2005). Is PsbS the site of non-
photochemical quenching in photosynthesis? J. Exp. Bot. 56: 375-382.
del Riego G, Casano LM, Martín M, Sabater B (2006) Multiple phosphorylation
sites in the β subunit of thylakoid ATP synthase. Photosynthesis Research 89: 11-18.
Sage RF (1990) A model describing the regulation of ribulose-1,5-bisphosphate
carboxylase, electron transport, and triose phosphate use in response to light intensity and
CO2 in C3 plants. Plant Physiol. 94: 1728 - 1734.
Sharkey TD (1985) Photosynthesis in intact leaves of C3 plants: physics, physiology and
rate limitations. Bot. Rev. 51: 53-106.
Sharkey TD (1989) Evaluating the role of Rubisco regulation in photosynthesis of C3
plants. Phil. Trans. R. Soc. Lond. 323: 435-448.
10

Sharkey TD and Vassey TL (1989) Low oxygen inhibition of photosynthesis is caused
by inhibition of starch synthesis. Plant Physiol. 90: 385-387.
Stiehl HH, Witt HT (1969) Quantitative treatment of the function of plastoquinone in
photosynthesis. Z Naturforsch 24b: 1588–1598.
Stitt M (1986) Limitation of photosynthesis by carbon metabolism. I. Evidence for
excess electron transport capacity in leaves carrying out photosynthesis in saturating light
and CO2. Plant Physiol. 81: 1115-1122.
Viil J, Laisk A, Oja V, Pärnik T (1972) The stimulating effect of oxygen on
photosynthesis. Dokl. Bot. Sci. 204: 86-88.
Woodrow IE and Berry JA (1988) Enzymatic regulation of photosynthetic CO2 fixation
in C3 plants. Annu. Rev. Plant Physiol. Plant Mol. Biol. 39: 533-594.
11

CHAPTER ONE
Feedback limitation of leaf photosynthesis induces non-photochemical quenching
and down-regulates electron transport activity by decreasing proton conductivity of
CFo-CF1 ATP synthase
ABSTRACT
The transthylakoid proton motive force (pmf) is an essential intermediate in
photosynthesis, driving the synthesis of ATP at the thylakoid ATP synthase as well as
acting as a central feedback regulatory signal, activating the photoprotection of
chloroplasts from excess light via the qE-response, and down-regulating electron transfer
through the cytochrome b6f complex. The extent of pmf is regulated in part by the
activity of the ATP synthase, resulting in changes to the proton conductance of the
thylakoid membrane (gH+). A low gH
+ retards proton efflux from the lumen increasing
pmf. It has been proposed that the ATP synthase, and thus gH+, may be controlled by the
availability of inorganic phosphate (Pi) in the stroma. In particular, Pi is considered to be
limiting when photosynthesis is controlled by feedback due to limited capacity to utilize
triose-P. We studied changes in gH+, CO2 assimilation, antenna regulation and
cytochrome b6f activity under feedback conditions in wild type and, a starchless mutant
of Nicotiana sylvestris (NS 458) defective of plastid phosphoglucomutase. When
feedback occurs in the starchless mutant there is a marked reversal of O2 sensitivity, a
phenomenon which we exploited to modulate feedback limitation under high CO2.
Measurements of the magnitude of gH+ and pmf were made in vivo, while Rubisco
12

oxygenation (vo) and carboxylation (vc) rates, and O2 evolution from PSII (JO2), were
calculated from simultaneous measurements of leaf CO2 exchange and fluorescence
yield. It was shown that gH+ increases proportionally with an increase in vc+vo, and with
an increase in JO2, when O2 was increased from 0-40% under CO2-saturated
photosynthesis. Increasing O2 under high levels of CO2 also caused an increase in the
RuBP and ATP pool size. The data support the hypothesis that feedback-limited
conditions control photosynthesis via effects on the ATP synthase, which regulates the
light reactions via its control of the proton gradient. Because previous experiments have
linked Pi levels to feedback limitations, our results are also consistent with a role for Pi,
either directly or indirectly, at the ATP synthase in the co-regulation of the light and dark
reactions.
INTRODUCTION
Higher plant photosynthesis is finely regulated to prevent photodamage when
light absorption exceeds the capacity of the plant to use it. A key intermediate in this
regulation is the thylakoid proton motive force (pmf) which is generated by light-driven
electron transfer and used to drive ATP synthesis at the thylakoid ATP synthase (Boyer,
1997). The pmf also regulates both light capture, by activating the qE-response (Horton
et al., 1996; Niyogi, 2000), and the cytochrome b6f complex, thus preventing the
accumulation of highly-reducing intermediates in the electron transfer chain (Hope et al.,
1994; Kramer et al. 1999; Takizawa et al., 2008). Photosynthesis can be limited by
different factors depending on conditions. Under low light there is limited capacity for
generating assimilatory power and regenerating RuBP. Under low CO2, Rubisco exerts a
13
high degree of control with limited carboxylase activity and enhanced oxygenase activity
and photorespiration. With ample CO2 and high light, the flux through the Benson-Calvin
cycle is controlled by the capacity for RuBP regeneration (e.g. capacity of
photochemistry to provide energy for regeneration), by the capacity to utilize triose-P for
synthesis of end products (e.g. starch and sucrose), or export of sucrose which if limited
can result in “feedback regulation” (Woodrow and Berry, 1988).
With feedback inhibition of photosynthesis, the capacity of Rubisco to fix CO2
exceeds the capacity of triose-P to be converted into carbohydrates, or the capacity to
utilize carbohydrates (Sharkey et al., 1986; Sage and Sharkey, 1987). Feedback is more
likely to occur under high light, high leaf conductance for CO2 from the atmosphere to
Rubisco, and moderate to low temperatures where the capacity for Rubisco to function as
a carboxylase can exceed capacity for synthesis of carbohydrates (starch and sucrose)
(Sage and Sharkey, 1987; Sharkey et al., 1995; Leegood and Edwards, 1996; Sun et al.,
1999a). The potential for feedback is increased under high light with CO2 enrichment
which decreases photorespiration and increases capacity for carboxylation over a wider
temperature range. Feedback caused by limitations on triose-P utilization becomes
especially evident when starch synthesis is impaired by mutations in ADPG
pyrophosphorylase (Neuhaus and Stitt, 1990; Sun et al., 1999b), and plastid
phosphoglucoisomerase activity (Hanson and McHale, 1988; Peterson and Hanson,
1991; Hanson, 1990; Hanson, 1992; Huber and Hanson, 1992; Eichelmann and Laisk,
1994; Sharkey et al., 1995) or sucrose synthesis by mutants of cytosolic fructose-1,6-
biphosphatase activity (Sharkey et al., 1988).
14

It has been proposed that the light reactions of photosynthesis are regulated by
modulating the activity of the ATP synthase, possible by altering the concentration of Pi
in the stroma (Woodrow and Berry, 1988; Kanazawa and Kramer, 2002).
It is generally accepted that the concentration of Pi in the chloroplast stroma is an
important regulator of processes in photosynthesis. The total chloroplast stromal
phosphate pool (which includes Pi and the organic phosphates of the Benson-Calvin cycle
intermediates) is conserved, at least over the short term. The uptake of Pi by the
chloroplast in exchange for export of triose-P, on the phosphate translocator, for sucrose
synthesis is necessary to maintain synthesis of ATP and carbon fixation (Flügge and
Heldt, 1984).
Under feedback conditions, limitation on utilizing triose-P for sucrose synthesis
can result in a decrease in Pi and an increase in the 3-phosphoglycerate/Pi ratio in the
chloroplasts which up-regulates ADPG pyrophosphorylase and starch synthesis (Preiss,
1991). In this case, Pi is not thought to be recycled at sufficient rates by triose-P
metabolism to carbohydrate so that organic-P turnover and Pi become limiting for ATP
synthesis and the regeneration of RuBP (Sharkey, 1990). Thus, under feedback
conditions the rate of photosynthesis is considered limited by reactions which regenerate
Pi from organic-P. Under photosynthesis without feedback, Pi is continuously being
regenerated by metabolism of triose-P to starch and sucrose, by metabolism in the
Benson-Calvin cycle through fructose 1,6-bisphosphatase, sedoheptulose 1,7-
bisphosphatase, and GAP-dehydrogenase, and in photorespiration by glycolate
phosphatase.
15

In the current work, we test the involvement of ATP synthase as a key component
of feedback regulation of the light reactions. It is known that limiting CO2 causes a
decrease in the proton conductivity of the chloroplast ATP synthase (gH+) (Kanazawa and
Kramer, 2002) which and the resulting retardation of proton efflux increases the steady-
state proton motive force , activating qE-type non-photochemical dissipation of
excitation energy. This in vivo regulation of ATP synthase has been documented using
non-invasive optical methods (Kramer et al., 2004); but, the mechanism controlling gH+ is
not clear. One possibility is that ATP synthase activity is regulated by limitations in
stromal inorganic phosphate (Pi) (Robinson and Giersch, 1987; Sharkey, 1990; Kanazawa
and Kramer, 2002; Takizawa et al., 2008).
METHODS
Plants of Nicotiana sylvestris were grown in Econair (Winnipeg, Canada) growth
chambers in fertilized potting soil in 8 L pots (one plant per pot), with a 14/10 h day/night
cycle at 28/22 °C, 50% relative humidity, 380 µbar CO2, and an incident photosynthetic
quantum flux density (PFD) of 800 µmol m-2 s-1. The wild type, and the plastid
phosphoglucomutase deficient mutant of N. sylvestris, NS 458, created by Hanson (1988)
were used. The NS 458 mutant tested negative for iodine staining for starch.
Measurments of electrochromic shift (ECSt) and proton conductance (gH+) of thylakoid
membranes.
Steady state light-driven pmf and gH+ were estimated by following the absorbance
16

changes attributable to ECS, at 520 nm, with rapid light to dark transitions using a leaf
spectrophotometer based on those constructed earlier (Kramer and Sacksteder, 1998;
Sacksteder et al., 2001), but adapted with a 1 cm2 area gas-tight leaf chamber. A small
air space (3 mm thickness) was left on the lower side of the leaf, and gas with known
humidity, O2 and CO2 content (mixed with the FastEst system, Tartu, Estonia; Laisk et
al., 2002) was constantly passed over the lower leaf surface at a rate of 10 cm3 s-1. The
window was illuminated by actinic diffuse red LED light. The modulated measurement
light at 520 nm was provided by another set of LED-s. A similar system, described in
Kohzuma et al. (2008), was used for measurement cytf reduction kinetics under
essentially identical conditions. The device lacks temperature control and leaf
temperature was dependent on room temperature (~24oC).
Leaf gas exchange and fluorescence yield measurements
For each experiment in which measurement of ECS, gas exchange and
chlorophyll fluorescence analyses were measured under the same conditions on
equivalent leaf material using the FastEst gas system (Tartu, Estonia, described in detail
in (Laisk et al., 2002). The system was equipped with a Li-Cor 6251 (Lincoln, Nebraska)
CO2 analyzer, and Applied Electrochemistry Inc. (Sunnyvale, California) S-3A O2
analyzer. Leaf gas exchange characteristics, net rates of CO2 fixation (A), Ci, APFD and
leaf temperature were determined as in (Laisk and Loreto, 1996). The photosynthetic
parameters: Rubisco oxygenation (vo) and carboxylation (vc) rates, and PS II electron
transport (JO2), were calculated from simultaneous measurements of leaf CO2 exchange
and fluorescence yield as in (Kiirats et al., 2002).
17

Rubisco vc and vo were calculated according to Farquhar, Berry and van
Caemmerer model (Farquhar et al., 1980) using the measured CO2 assimilation rate (A),
measured dark respiration rate (Rd) and the following equations:
A = vc – 0.5vo – Rd
)/1( occc
ccc KOKC
CVv++
⋅=
)/1( ccoc
coo KCKO
OVv++
⋅=
SCV oc
c ⋅− OKOKCRA
cc
ccd
/5.0)/1(()( +⋅−
=+
SKKVV
c
oCo ⋅
⋅=
where Vc , Vo = maximum carboxylation and oxygenation velocities, respectively, Kc , Ko
= carboxylation and oxygenation Michaelis constants, respectively, Cc, Oc = CO2 and O2
concentrations at Rubisco active sites, respectively, and S = Rubisco specificity for CO2
relative to O2. The mitochondrial CO2 evolution rate at light (Rd) was taken as 5% of CO2
and light saturated CO2 net assimilation rate (Amax), Kc, Ko and S at 25oC 11µM, 300µM
and 88 corrected to temperature as in (Woodrow, Berry, 1988) were used.
18

The yield of PSII was measured by chlorophyll fluorescence using a Walz PAM
101 fluorometer (Effeltrich, Germany). The gross rate of O2 evolution from PSII (JO2)
was calculated as:
JO2 = APFD·YII·(Fm'-Fs)/Fm' )/4
where (Fm'-Fs)/Fm' is the yield of PS II, Fs is fluorescence yield of steady state
photosynthesis, Fm' is maximal fluorescence yield by exposure to a 1 s pulse of 15,000
µmol m-2s-1 light, YII is the relative optical cross-section of PSII (the fraction of light
absorbed by PSII) as determined in (Laisk et al., 2002) from light response curves for
leaf O2 evolution under a low O2 background. APFD is the absorbed photosynthetic
photon flux density at steady state which was calculated with absorption coefficient of
0.85 (Genty et al., 1989; Krall and Edwards, 1992). NPQ and 1-qL were calculated as in
Kramer et al. (2004). NPQ for all experiments represents the energy dependent
component, qE, where Fm was measured after 15 min of darkness. The assimilatory
charge (AC) during photosynthesis in the light was determined at a given time as
described in (Laisk et al., 2002) by measuring the magnitude of the post-illumination
uptake of CO2.
Measurements of RuBP and ATP pool sizes
FasEst leaf gas exchange system was used to record leaf net CO2 uptake and
fluorescence yield. After reaching steady-state photosynthesis under defined conditions,
leaves were killed by fast-filling the leaf chamber with cooled 95% ethanol (~ -80 °C).
The frozen leaf piece (5 cm2) was ground to a fine powder in liquid N2 in a mortar
(previously cooled with liquid N2) followed by extraction for 15 min in 3 ml 1N HClO4
19

in a small beaker. The extract was centrifuged 2 min at 5000 g. The supernatant was
neutralized with 5 M KOH. Insoluble KHClO4 was removed by centrifugation and RuBP
and ATP contents were determined (either immediately, or the extract was stored in
liquid N2 for later analysis).
RuBP content was measured as in (Wirtz et al., 1980) by measuring 14C
incorporation into acid stable product with purified Rubisco. ATP was assayed using the
luciferin/luciferase assay method (Strehler and McElroy, 1957); 50 µL of the leaf extract,
diluted 1 to 10 with assay buffer, was injected into a 100 µL assay medium in
luminometer chamber (Aminco Chemo-Glow Photometer, American Instrument Co.,
USA). The assay medium contained 75 mM Hepes/KOH at pH 7.5, 5 mM MgSO4, 1 mM
Na2HAsO4, 1 mM mercaptoethanol, 0.2 mM Luciferin (Sigma), and 13 x 103 Light Units
of Luciferase (Sigma). The initial peak of the luminescence signal was proportional to
ATP content.
RESULTS
1. ATP synthase proton conductivity under variable O2 and CO2 conditions at light
saturation in wild type and starchless mutant of Nicotiana sylvestris.
20

Intercellular CO2, µbar0 500 1000 1500 2000 2500
A, J
O2 ,
µmol
m-2
s-1
0
10
20
30
40
A 2%O2
A 21%O2
JO2 2%O2
JO2 21%O2
Intercellular CO2, µbar0 500 1000 1500 2000 2500
g H+,
s-1
0
20
40
60
80
100
- ΔA 52
0* 1
03 (EC
S t)
1.5
2.0
2.5
3.0
3.5
JO2 , µmol m-2s-1
0 5 10 15 20 25 30 35 40
g H+,
s-1
0
20
40
60
80
100
2% O2
21% O2
Intercellular CO2, µbar0 500 1000 1500 2000 2500
qE
0.5
1.0
1.5
2.0
2.5
3.0
3.5
4.0
1-qL
0.0
0.2
0.4
0.6
0.8
1.0
gH+
ECSt
1-qL
qE
A
B
C
D
Wild type
Intercellular CO2, µbar0 500 1000 1500 2000 2500
A, J
O2 ,
µmol
m-2
s-1
0
10
20
30
40
A 2%O2
A 21%O2
JO2 2%O2
JO2 21%O2
Intercellular CO2, µbar0 500 1000 1500 2000 2500
g H+,
s-1
0
20
40
60
80
100
- ΔA 52
0* 1
03 (EC
S t)
1.5
2.0
2.5
3.0
3.5
JO2 , µmol m-2s-1
0 5 10 15 20 25 30 35 40
g H+,
s-1
0
20
40
60
80
100
2% O2
21% O2
Intercellular CO2, µbar0 500 1000 1500 2000 2500
qE
0.5
1.0
1.5
2.0
2.5
3.0
3.5
4.0
1-qL
0.0
0.2
0.4
0.6
0.8
1.0
Starchless
H
G
F
E
ECSt
gH+
1-qL
qE
21

Figure 1.1. Measurements in wild type and starchless mutant N. sylvestris of the CO2
assimilation rates (A), gross rates of O2 evolution (JO2), electrochromic shift (ECSt), ATP
synthase proton conductivity (gH+) and fluorescence parameters (qE and 1-qL) with
changes in intercellular levels of CO2. Leaf temperature was 24°C and absorbed PFD
970 µmol m-2 s-1. Black symbols represent 2% O2, white symbols represent 21% O2. In
panel A. symbols for JO2 are Δ = 21% O2, ▲ = 2% O2 and symbols for A are ○ = 21% O2,
● = 2% O2. JO2 was calculated from the measured fluorescence yields (see Methods).
Measurements were made first under varying CO2 with 21% O2, and then on the same
leaf under varying CO2 at 2% O2. The data points represent steady state values that was
defined as relatively constant A and fluorescence yield under given conditions. The data
represent measurements on one leaf but the experiments were repeated 3 times with the
same results.
Fig. 1.1 shows results from measuring electrochromic shift parameters (gH+ and
ECSt) (see Avenson et al. 2005; Cruz et al. 2005; Baker 2008, on the methods) in parallel
with leaf CO2 assimilation rates (A) and gross rates of O2 evolution (JO2) at saturating
PFD (970 µmol m-2 s-1) and 2% versus 21% O2 in wild type N. sylvestris. Fig. 1.1A and
B show the response of A and JO2 versus intercellular level of CO2 (Ci). Under limiting
[CO2] we observed an inhibition of A by 21% O2, whereas under CO2 saturated
conditions O2 sensitivity was reversed with a slight stimulation of A by 21% O2. Under
2% O2 we observed a close relationship between A and JO2; whereas under 21% O2, JO2
was much higher than A under limiting CO2 (Fig. 1.1A, B). From measurements of CO2
22
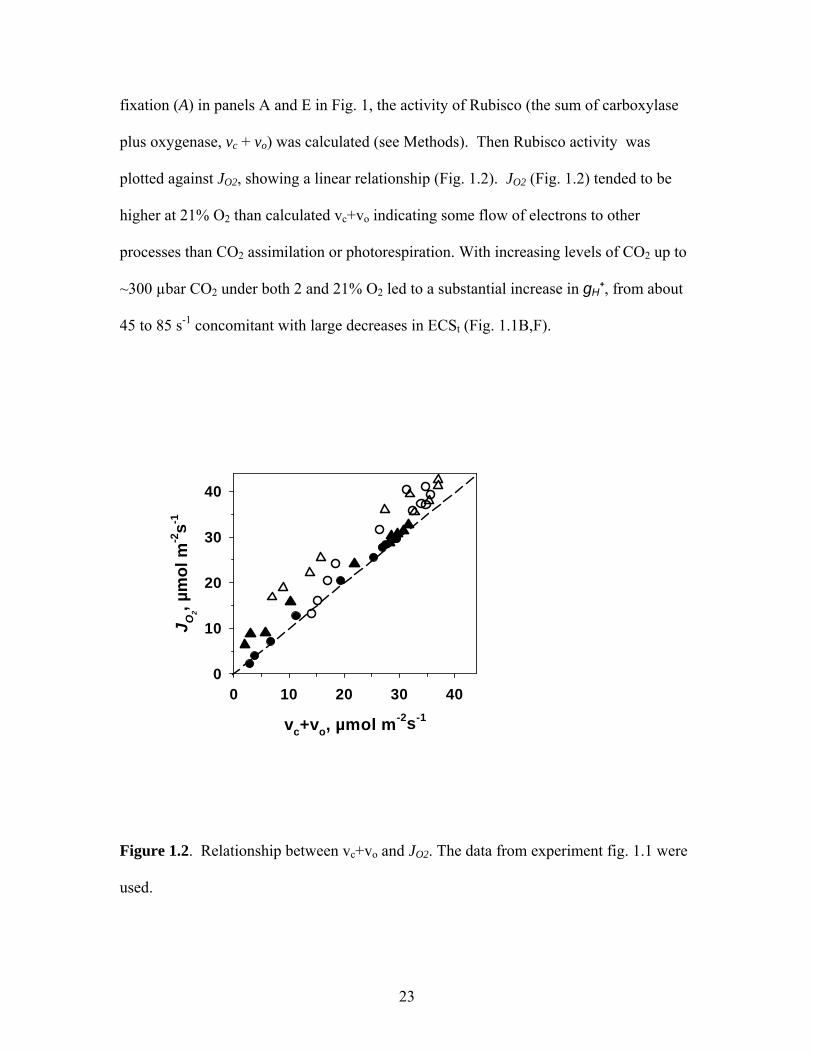
fixation (A) in panels A and E in Fig. 1, the activity of Rubisco (the sum of carboxylase
plus oxygenase, vc + vo) was calculated (see Methods). Then Rubisco activity was
plotted against JO2, showing a linear relationship (Fig. 1.2). JO2 (Fig. 1.2) tended to be
higher at 21% O2 than calculated vc+vo indicating some flow of electrons to other
processes than CO2 assimilation or photorespiration. With increasing levels of CO2 up to
~300 µbar CO2 under both 2 and 21% O2 led to a substantial increase in gH+, from about
45 to 85 s-1 concomitant with large decreases in ECSt (Fig. 1.1B,F).
vc+vo, µmol m-2s-1
0 10 20 30 40
J O2, µ
mol
m-2
s-1
0
10
20
30
40
Figure 1.2. Relationship between vc+vo and JO2. The data from experiment fig. 1.1 were
used.
23
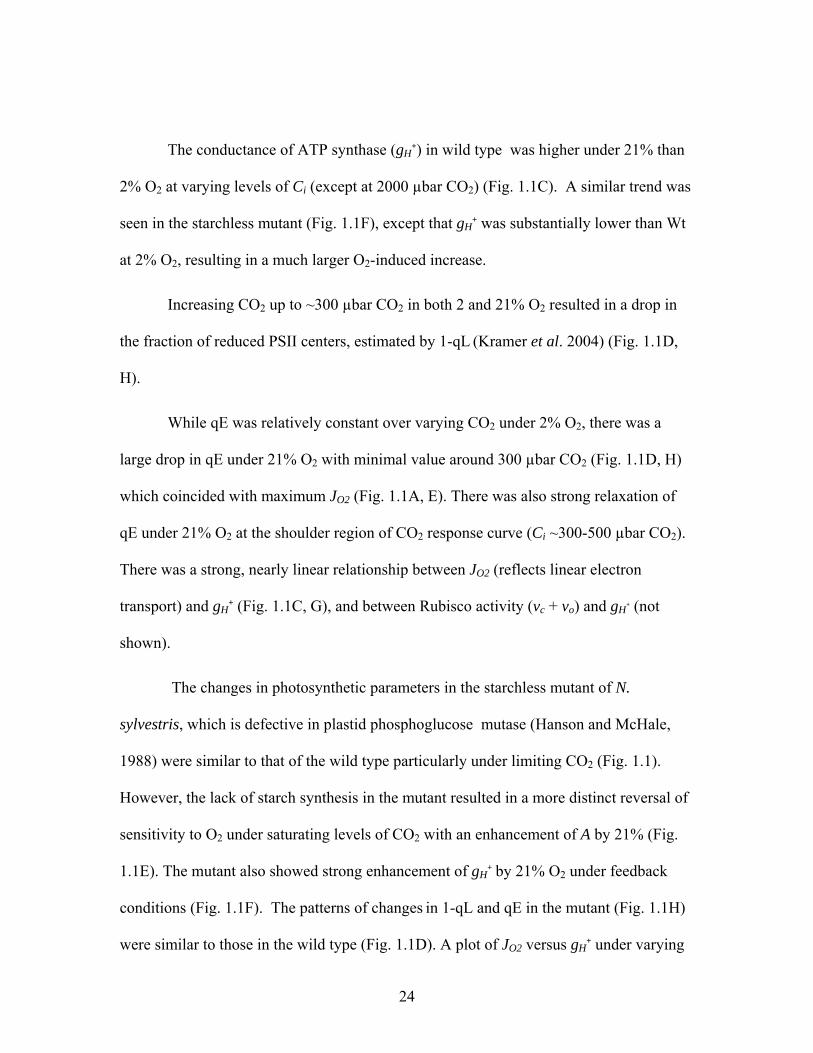
The conductance of ATP synthase (gH+) in wild type was higher under 21% than
2% O2 at varying levels of Ci (except at 2000 µbar CO2) (Fig. 1.1C). A similar trend was
seen in the starchless mutant (Fig. 1.1F), except that gH+ was substantially lower than Wt
at 2% O2, resulting in a much larger O2-induced increase.
Increasing CO2 up to ~300 µbar CO2 in both 2 and 21% O2 resulted in a drop in
the fraction of reduced PSII centers, estimated by 1-qL (Kramer et al. 2004) (Fig. 1.1D,
H).
While qE was relatively constant over varying CO2 under 2% O2, there was a
large drop in qE under 21% O2 with minimal value around 300 µbar CO2 (Fig. 1.1D, H)
which coincided with maximum JO2 (Fig. 1.1A, E). There was also strong relaxation of
qE under 21% O2 at the shoulder region of CO2 response curve (Ci ~300-500 µbar CO2).
There was a strong, nearly linear relationship between JO2 (reflects linear electron
transport) and gH+ (Fig. 1.1C, G), and between Rubisco activity (vc + vo) and gH+ (not
shown).
The changes in photosynthetic parameters in the starchless mutant of N.
sylvestris, which is defective in plastid phosphoglucose mutase (Hanson and McHale,
1988) were similar to that of the wild type particularly under limiting CO2 (Fig. 1.1).
However, the lack of starch synthesis in the mutant resulted in a more distinct reversal of
sensitivity to O2 under saturating levels of CO2 with an enhancement of A by 21% (Fig.
1.1E). The mutant also showed strong enhancement of gH+ by 21% O2 under feedback
conditions (Fig. 1.1F). The patterns of changes in 1-qL and qE in the mutant (Fig. 1.1H)
were similar to those in the wild type (Fig. 1.1D). A plot of JO2 versus gH+ under varying
24

CO2 and O2 under both CO2 limited and CO2 saturated conditions with 2 versus 21% O2
shows there is a linear relationship in both mutant and wild type (Fig. 1.1D). Also, the
relationship reveals RuBP oxygenation and carboxylation affect gH+ equally.
2. ATP synthase proton conductivity changes under feedback conditions lead to
the regulation of qE, and Cyt b6f complex in Nicotiana sylvestris
The hypothesis that feedback limitation of CO2 assimilation slow electron transfer
reactions of photosynthesis via effects on the ATP synthase was tested by comparing
parameters of photochemistry, including Cyt b6f complex, at 2 and 21% O2 and 2000
µbar CO2 and 25oC in N. sylvestris wild type and starchless mutant. Compared to the
wild type, the starchless mutant showed reduced turnover rates for the Cyt b6f (Fig.
1.3A), as well as decreased gH+ (Fig. 1.3B) and JO2 (Fig. 1.3C), while having higher ECSt
(Fig. 1.3D) and qE (Fig. 1.3D) under 2% O2 and 2000 µbar CO2.When we switched from
2 to 21% O2 caused a substantial stimulation of the rate constant for Cyt b6f (Fig. 1.3A),
in gH+ (Fig. 1.3B) and JO2 (Fig. 1.3C) in the mutant, with less effect in the wild type.
25

g H+,
s-1
0
50
100
150
200
21% 2% 21% 2%
sl
wtA
ECS t,
- ΔA
*103
0
2
4
6
8
wtsl B
21% 2% 21% 2%
cyt f k
eff,
s-1
0
50100150200
250
21% 2% 21% 2%
wt
sl
C
LEF,
µm
ol m
-2s-1
0
50
100
150
200
250
21% 2% 21% 2%
wtsl
D
qE
0.0
0.4
0.8
1.2
1.6
wt
sl E
21% 2% 21% 2%
26

Figure 1.3 Steady state electron transport parameters at 2 vs. 21% O2 in wild type (wt)
and starchless (sl) mutant of N. sylvestris at 2000 µbar CO2 and 800 µmol m-2s-1 PFD,
and 25oC. Measurements include ATP synthase proton conductivity (gH+), electrochromic
shift (ECSt), cyt f effective kinetic constant, and gross rates of O2 evolution (JO2).
Measurements were made first at 21% O2, then ~15 min after switching to 2% O2.
Results are representative of two separate experiments.
3. Effect of varying O2 levels, under saturating CO2 and light, on ATP synthase
conductivity, photosynthesis and assimilatory charge in the starchless mutant of
Nicotiana sylvestris.
Changes in photosynthetic parameters over a range of O2 levels were studied in
the starch-less mutant. Figure 1.4 shows the effects on the kinetics of inhibition of
photosynthesis by switching from 21% to 2% O2 under high CO2 (2000 µbar). Following
a reduction in O2 concentration to 2%, A decreased rapidly to a low level (much more
than in wild type, not shown), after which there was a relatively flat minimum which
lasted for about 400 s, followed by a transitory increase (Fig. 1.4). There was some rise
in A; but, after reaching steady-state rates remained lower than under 21% O2 (not
shown).
The effects of increasing O2 under feedback conditions in the starchless mutant
(1800 µbar CO2, 750 PFD and 32oC) on CO2 assimilation rate, leaf fluorescence
parameters and parameters derived from electrochromic shift measurement (gH+ and
ECSt) were studied (Fig. 1.5). The O2 concentration was changed from steady state
photosynthesis at 1800 µbar CO2 and 21% O2 to different O2 concentrations between 0
27

and 40%. Based on results of Fig. 1.4, measurements were made ~5 min after changing
O2 concentrations to obtain the initial maximum effect of O2 on photosynthesis
Time, s0 200 400 600 800 1000 1200
CO
2 ass
imila
tion,
µm
ol m
-2s-1
0
10
20
30 21% O2 2%O2
Figure 1.4. Illustration of the transient change, and inhibition of the rate of CO2
assimilation, when the O2 concentration was changed from 21% to 2% in the starchless
mutant of N. sylvestris at 2000 µbar CO2, 800 µmol m-2s-1 absorbed PFD, and 32 °C.
28

Intracellular O2, µM
0 100 200 300 400 500
A, v
c+v o,
J O2, µ
mol
m-2
s-1
15
20
25
30
35
40
45
Intracellular O2, µM
0 100 200 300 400 500
g H+,
s-1, A
C, µ
mol
m-2
0
20
40
60
80
100
ECS t,
- ΔA 52
0 * 1
03
0.0
0.4
0.8
1.2
1.6
JO2, µmol m-2s-1
10 20 30 40 50
g H+,
s-1
20
40
60
80
100
Intracellular O2, µM
0 100 200 300 400 500
qE
0.0
0.5
1.0
1.5
2.0
1-qL
0.0
0.2
0.4
0.6
0.8
1.0
A
vc+vo
JO2
C D
A B
ECSt
gH+
AC
qE
1-qL
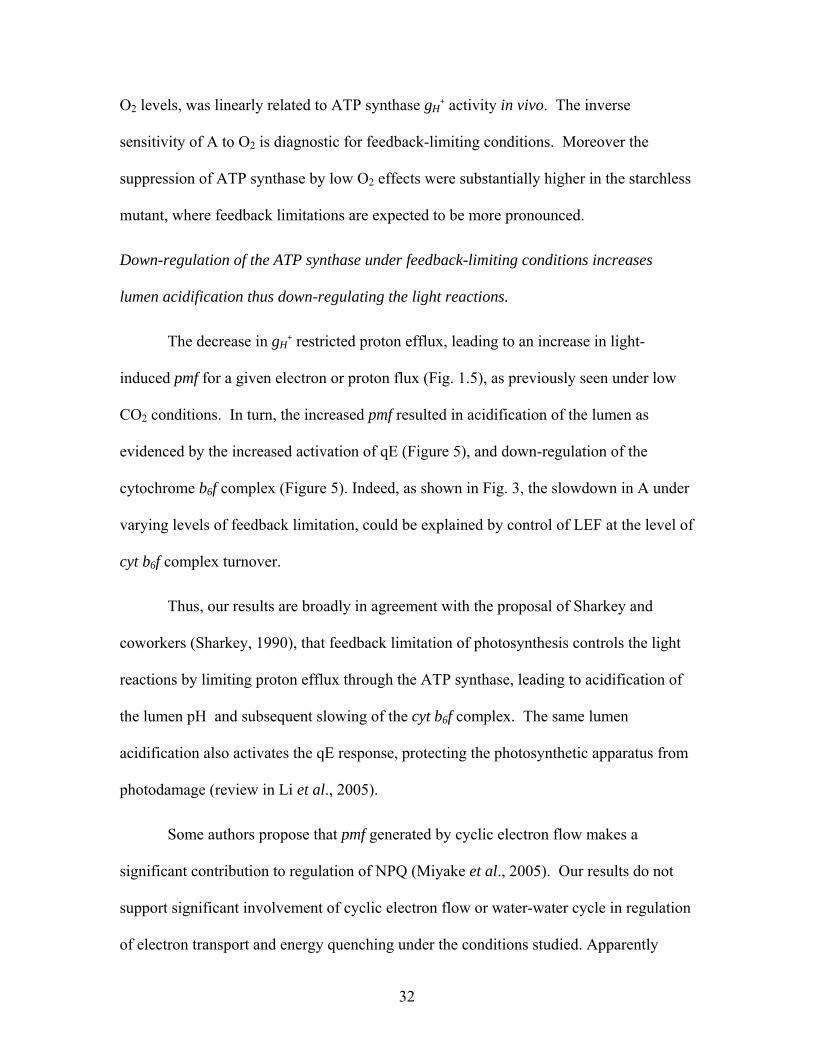
Figure 1.5. The effect of varying levels of O2 on photosynthetic parameters in the
starchless mutant of N. sylvestris. Measurements were made at 1800 µbar CO2, 750 µmol
m-2 s-1 absorbed PPFD, and leaf temperature of 32 °C. CO2 assimilation rates (A), gross
rates of O2 evolution (JO2), electrochromic shift (ECSt), ATP synthase proton
conductivity (gH+) and fluorescence parameters (qE and 1-qL). Measurements were made
at 21% O2 (reference point), 5 min after switching to another O2 level, at 21% O2, 5 min
after switching to another O2 level, etc. The results represent one experiment, three
replicate experiments gave the same result. It suggests that the factor regulating
29

Sun et al. (1999a) have shown that this immediate effect of O2 is linearly related
to the effect of O2 after reaching steady-state (which is presumably caused by effects of
the availability of free Pi).
Under feedback conditions in the starchless mutant, there was a near linear
increase in PSII activity (JO2) and A with increasing O2 concentration (Fig. 1.5A). Also,
the calculated values of vc+vo that represent Rubisco activity and JO2 were very close at
all O2 concentrations (Fig. 1.5A). The enhancement of gross rates of O2 evolution (JO2)
with increasing O2 was linearly related to changes in gH+ (Fig. 1.5B).
ECSt and qE decreased with increasing O2 concentration, while gH+ increased (Fig.
1.5C, D). There was little change in the fraction of closed centers (1-qL) with increasing
O2 (Fig. 1.5D).
An indirect estimate of the RuBP pool size, which exists during photosynthesis
under a given condition, can be made by measuring the post-illumination CO2 uptake
under low O2, called the “assimilatory charge” (AC) (Laisk et al., 2002). With increasing
O2 under feedback conditions there was a parallel increase in AC (Fig. 1.5B) with
enhancement of A which indicates O2 enhancement of A is associated with an increase in
the RuBP pool.
5. Effect of O2 on RUBP and ATP pools under feedback conditions in the starchless
mutant of Nicotiana sylvestris.
Table 1.1. Measurements of the pool sizes of ATP and RuBP during steady state
photosynthesis in the starchless mutant of N. sylvestris under feedback conditions.
30

Measurements were made after reaching steady-state under 2% O2, and then 5 min after
switching to 21% O2. The conditions were 1800 µbar CO2, 800 µmol m-2s-1 absorbed
PPFD, 32 °C, and 2 versus 21% O2, n=3.
O2 level A
µmol m-2 s-1
RuBP
µmol m-2
ATP
µmol m-2
2 % O2 8.5 ± 2.0
55.5 ± 6.8
21.1 ± 3.2
21% O2 14.3 ± 1.9
81.2 ± 5.8
39.5 ± 7.5
The pool sizes of RuBP and ATP were estimated in the starchless mutant under
feedback conditions by freeze-fixing the leaf under 2% versus 21% O2 (Table 1.1).
Measurements under 2% O2 were made 5 min after switching from 21 to 2%. Rates of A
and pool sizes were much higher under 21% than under 2% O2, RuBP (~1.5 fold), ATP
(1.9 fold) and A (1.7 fold).
DISCUSSION
The ATP synthase is down-regulated under feedback limiting conditions.
The first goal of this work was to test a key postulate of the Pi feedback model:
that regulation of the ATP synthase activity is involved in regulation of the light reactions
under feedback limiting conditions. Our results show this to be true. Strikingly, the
extent of feedback limitation, as seen during progressive release upon gradually increased
31
O2 levels, was linearly related to ATP synthase gH+ activity in vivo. The inverse
sensitivity of A to O2 is diagnostic for feedback-limiting conditions. Moreover the
suppression of ATP synthase by low O2 effects were substantially higher in the starchless
mutant, where feedback limitations are expected to be more pronounced.
Down-regulation of the ATP synthase under feedback-limiting conditions increases
lumen acidification thus down-regulating the light reactions.
The decrease in gH+ restricted proton efflux, leading to an increase in light-
induced pmf for a given electron or proton flux (Fig. 1.5), as previously seen under low
CO2 conditions. In turn, the increased pmf resulted in acidification of the lumen as
evidenced by the increased activation of qE (Figure 5), and down-regulation of the
cytochrome b6f complex (Figure 5). Indeed, as shown in Fig. 3, the slowdown in A under
varying levels of feedback limitation, could be explained by control of LEF at the level of
cyt b6f complex turnover.
Thus, our results are broadly in agreement with the proposal of Sharkey and
coworkers (Sharkey, 1990), that feedback limitation of photosynthesis controls the light
reactions by limiting proton efflux through the ATP synthase, leading to acidification of
the lumen pH and subsequent slowing of the cyt b6f complex. The same lumen
acidification also activates the qE response, protecting the photosynthetic apparatus from
photodamage (review in Li et al., 2005).
Some authors propose that pmf generated by cyclic electron flow makes a
significant contribution to regulation of NPQ (Miyake et al., 2005). Our results do not
support significant involvement of cyclic electron flow or water-water cycle in regulation
of electron transport and energy quenching under the conditions studied. Apparently
32

some water-water cycle activity occurs at 21% O2 (Fig. 2); but, it appears to be a rather
constant proportion of electron flow without regulatory significance. Joliot and Joliot
(2006) showed involvement of PSI cyclic electron flow during induction of
photosynthesis in dark to light transitions. Free Pi concentration in dark adapted leaves
increases due to decrease in organic pools. The Calvin cycle phosphorylated intermediate
pools start building up slowly after onset of illumination. ATP-synthase conductance is
expected to be high during this period due to increased Pi and cyclic
photophosphorylation may be needed to build up organic-P pools, rather than to generate
high ΔpH and NPQ.
ATP synthase regulation is consistent with the Pi-regulatory hypothesis. The Pi-
feedback regulation hypothesis states that, under feedback-limiting conditions, stromal Pi
drops below its KM at the ATP synthase, slowing its turnover. We have confirmed the
slowing of the ATP synthase, and subsequent consequences for control of LEF, as
described in the previous section. In this section we discuss the possibility that this
alteration in ATP synthase activity can be ascribed to decreased stromal Pi levels.
In principle, the ATP synthase can be regulated at several levels, both
allosterically e.g. via thioredoxin-modulation (Scheibe, 1991) or phosphorylation
(Bunney et al., 2001; del Riego et al., 2006), or by latering substrate (ADP or Pi) levels.
The KM for ADP at the ATP synthase is about 30 µM while that for Pi is 0.5-0.9 mM
(Grotjohann and Graber, 2002; Pänke and Rumberg 1999). Stromal ADP content was
measured at ~0.5 mmol/L in the light (Stitt et al., 1982). If this ADP level reflects free
concentrations, it will be well above its KM at the ATP synthase, and thus not limiting.
33

In order to explain our results solely by Pi limitation, the stromal Pi in intact
leaves must be in the range of the KM for Pi for ATP synthase (~0.5 – 1 mM). The Pi
concentration in the chloroplast stroma in leaves is difficult to measure due to relatively
high concentration of Pi (~20 times) in vacuoles (Wirtz et al., 1980). Photosynthesis was
found to be saturated in the stroma of isolated chloroplasts at a concentration of the active
form of Pi at 2 – 2.5 mM (Robinson and Giersch, 1987). These authors also concluded
that the stromal concentration of Pi in isolated chloroplast is 1.5 – 2.0 mM during
photosynthesis with optimal concentrations of Pi in the reaction medium. It has also been
demonstrated that limitation of Pi supply to chloroplasts leads to a decrease in stromal Pi
to a point where ATP synthesis may become Pi limited (Giersch and Robinson, 1987). It
is proposed the same occurs under feedback limitation in leaves (Sharkey and
Vanderveer, 1989; Paul and Foyer, 2001). Mannose feeding experiments into the leaves
showed strong inhibition of photosynthesis explained by mimicking feedback by
sequestering cytosolic free Pi (Harris et al., 1983; Morison and Batten, 1986). This effect
was shown to be related to slowing of the ATP synthase (Takizawa et al., 2008).
It is possible that chloroplasts in vitro at high light do not fully recover the levels
of Calvin cycle phosphorylated intermediates seen in intact leaves which would result in
a higher Pi pool size in isolated chloroplasts. For example RuBP concentrations in leaves
can be as high as 10 mM (Woodrow and Berry, 1988) such that only small changes in
RuBP concentration could have a major effect on Pi concentration. Also, the active
concentration of Pi is likely much lower than the measured total Pi due to binding to cell
structures.
34

Possibly at low CO2 that Pi is partitioned strongly into organic phosphates, mainly
hexose phosphates, RuBP and PGA. The free Pi pool size increases in parallel to
photosynthesis rate due to a balance in Pi fluxes.
Regarding oxygen enhancement effect on the rate of photosynthesis at elevated
CO2 (see Figs. 1.4, 1.5), our results are consistent with multiple hypotheses for the basis
of sink limitation (triose phosphate utilization limited) and Pi fluxes (Sharkey, 1985;
Sharkey and Vassey, 1989; Harley and Sharkey, 1991). The thylakoid ATP synthase
proton conductivity (gH+) increases with increasing O2 in parallel with increases in
photosynthesis (Fig. 1.5) suggesting an increase in the rate of synthesis of ATP by
increased rate of supply of Pi which leads to an increase in assimilatory charge, RuBP
pool size and carboxylation rate (Fig. 1.5, Table 1.1).
The rate of increase of photorespiration in changing from 2 to 21% O2 as an
additional carbon sink at 1800 µbar CO2 is not sufficient to explain enhancement of
photosynthesis in starchless mutant (Fig. 1.4, 1.5). Rather it is expected that the increase
in photosynthesis by increasing O2 should be linked to an increase in synthesis of
carbohydrates or rate of translocation of sucrose through some mechanism if its
accumulation causes feedback. Some flux of carbon through the glycolate pathway may
increase mitochondrial production of ATP (using NADH generated from glycine
decarboxylase), which could support increased biosynthesis of sucrose in the cytosol.
Hanson (1992) found that light saturated photosynthesis under low O2 and high CO2 in
the starchless mutant of N. sylvestris was especially sensitive to oligomycin, an inhibitor
of mitochondrial respiration.
35
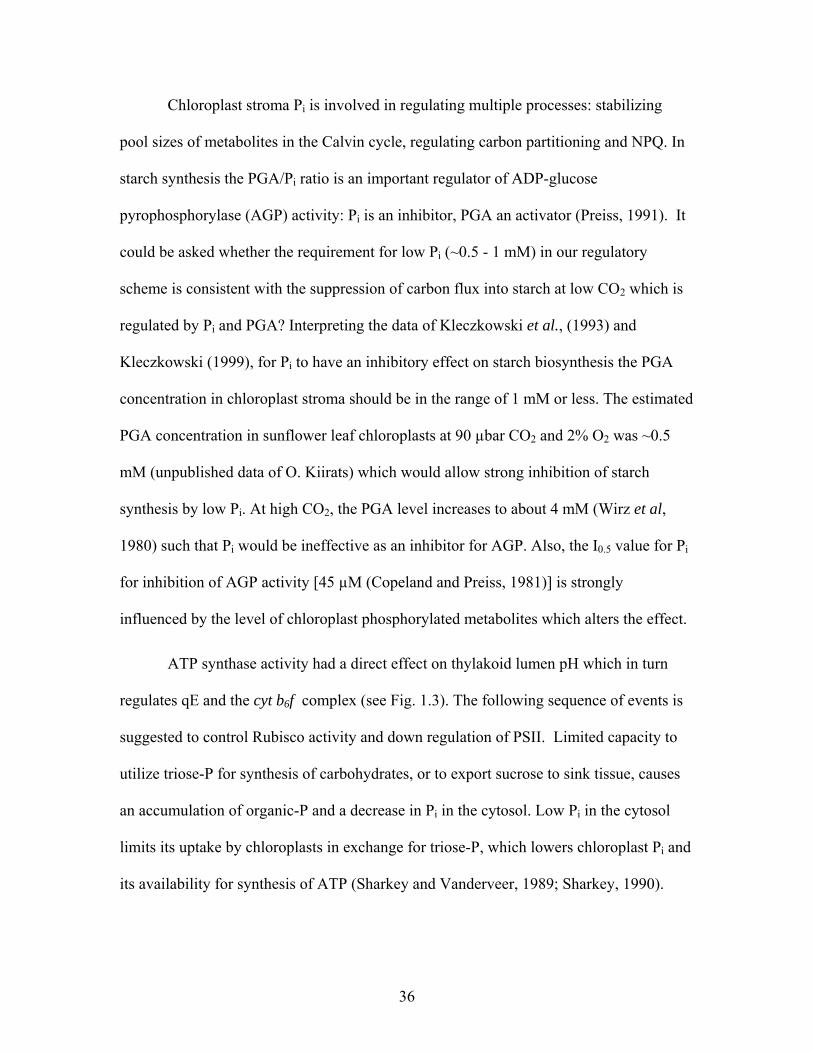
Chloroplast stroma Pi is involved in regulating multiple processes: stabilizing
pool sizes of metabolites in the Calvin cycle, regulating carbon partitioning and NPQ. In
starch synthesis the PGA/Pi ratio is an important regulator of ADP-glucose
pyrophosphorylase (AGP) activity: Pi is an inhibitor, PGA an activator (Preiss, 1991). It
could be asked whether the requirement for low Pi (~0.5 - 1 mM) in our regulatory
scheme is consistent with the suppression of carbon flux into starch at low CO2 which is
regulated by Pi and PGA? Interpreting the data of Kleczkowski et al., (1993) and
Kleczkowski (1999), for Pi to have an inhibitory effect on starch biosynthesis the PGA
concentration in chloroplast stroma should be in the range of 1 mM or less. The estimated
PGA concentration in sunflower leaf chloroplasts at 90 µbar CO2 and 2% O2 was ~0.5
mM (unpublished data of O. Kiirats) which would allow strong inhibition of starch
synthesis by low Pi. At high CO2, the PGA level increases to about 4 mM (Wirz et al,
1980) such that Pi would be ineffective as an inhibitor for AGP. Also, the I0.5 value for Pi
for inhibition of AGP activity [45 µM (Copeland and Preiss, 1981)] is strongly
influenced by the level of chloroplast phosphorylated metabolites which alters the effect.
ATP synthase activity had a direct effect on thylakoid lumen pH which in turn
regulates qE and the cyt b6f complex (see Fig. 1.3). The following sequence of events is
suggested to control Rubisco activity and down regulation of PSII. Limited capacity to
utilize triose-P for synthesis of carbohydrates, or to export sucrose to sink tissue, causes
an accumulation of organic-P and a decrease in Pi in the cytosol. Low Pi in the cytosol
limits its uptake by chloroplasts in exchange for triose-P, which lowers chloroplast Pi and
its availability for synthesis of ATP (Sharkey and Vanderveer, 1989; Sharkey, 1990).
36

In conclusion, our observations can be explained with a simple model
(Fig. 1.6).
Figure 1.6. The scheme of Pi effects on electron transport and energy dependent exiton
quenching.
Under feedback conditions, a decrease in Pi has a direct effect on the kinetics of the ATP
synthase causing a decrease in its conductivity to protons, which in turn increases the
pmf; the build-up of pmf increases excition quenching (qE), and decreases the rate
constant for cyt b6f.
REFERENCES
Avenson TJ, Kanazawa A, Cruz JA, Takizawa K, Ettinger WE, Kramer DM. (2005)
Integrating the proton circuit into photosynthesis: Progress and challenges. Plant Cell
Environ. 28:97-109.
Baker NR (2008) Chlorophyyll fluorescence: A probe of photosynthesis in vivo. Annu.
Rev. Plant Biol. 59:89-113.
Boyer PD (1997) The ATP synthase – a splendid molecular machine. Annu. Rev.
Biochem. 66: 717-749.
37

Bunney, T.D., H.S. van Walraven and A.H. de Boer (2001) 14-3-3 protein is a
regulator of the mitochondrial and chloroplast ATP synthase. PNAS 98: 4249-54.
Copeland L and Preiss J (1981) Purification of Spinach leaf ADP-glucose
pyrophosphorylase. Plant Physiol. 68:996-1001.
Cruz JA, Sacksteder CA, Kanazawa A, Kramer DM (2001) Contribution of electric
field (Δ ψ) to steady-state transthylakoid proton motive force (pmf) in vitro and in vivo.
Control of pmf parsing into Δ ψ and by ΔpH by ionic strength. Biochemistry 40: 1226-
1237.
Cruz JA, Avenson TJ, Kanazawa A, Takizawa K, Edwards GE, and Kramer DM
(2005) Plasticity in light reactions of photosynthesis for energy production and
photoprotection. J. Exp. Bot. 56: 395-406.
Edwards GE, Walker DA (1983) C3, C4: Mechanisms, and Cellular and Environmental
Regulation, of Photosynthesis. Blackwell Scientific Publications, Oxford, UK
Eichelmann H, Laisk A (1994) CO2 uptake and electron transport rates in wild-type and
a starchless mutant of Nicotiana sylvestris: The role and regulation of starch synthesis at
saturating CO2 concentrations. Plant Physiology 106: 679-687.
Farquhar GD, von Caemmerer S, Berry JA (1980) A biochemical model of
photosynthetic CO2 assimilation in leaves of C3 species. Planta 149: 78-90.
Flügge UI, Heldt H (1984) The phosphate-triosephosphate-phosphoglycerate
translocator of the chloroplast. Trends Biochem. Sci. 9: 533-535.
Genty B, Briantais J, Baker NR (1989) The relationship between the quantum yield of
photosynthetic electron transport and quenching of chlorophyll fluorescence. Biochim.
Biophys. Acta 990: 87-92.
38

Giersch C, Robinson SP (1987) Regulation of photosynthetic carbon metabolism during
phosphate limitation of photosynthesis in isolated spinach chloroplasts. Photosynthesis
Research 14: 211-227.
Grotjohann I, Graber P (2002) The H+-ATPase from chloroplasts: effect of different
reconstruction procedures on ATP synthase activity and on phosphate dependence of
ATP synthesis. Biochim. Biophys. Acta 1556: 208-216.
Hanson KR (1990) Steady-state and oscillating photosynthesis by a starchless mutant of
Nicotiana sylvestris. Plant Physiol. 93: 1212-1218.
Hanson KR (1992) Evidence for mitochondrial regulation of photosynthesis by a
starchless mutant of Nicotiana sylvestris. Plant Physiology 99: 276-283.
Hanson KR, McHale NA (1988) A starchless mutant of Nicotiana sylvestris containing
a modified plastid glucomutase. Plant Physiol 93: 1212-1218.
Harley PC, Sharkey TD (1991) An improved model of C3 photosynthesis at high CO2 -
reversed O2 sensitivity explained by lack of glycerate reentry into the chloroplast.
Photosynthesis Research 27: 169-178.
Harris GC, Cheesebrough JK, Walker DA (1983) Effects of mannose on
photosynthetic gas exchange in spinach leaf discs. Plant Physiology 71: 108-111.
Hope AB, Valente P, Matthews DB (1994) Effects of pH on the kinetics of redox
reaction in and around the cytochrome bf complex in an isolated system. Photosynthesis
Research 42:111-120.
Horton P, Ruban AV, Walters RG (1996) Regulation of light harvesting in green
plants. Annu. Rev. Plant Physiol. Plant Mol. Biol. 47: 655-684
39

Huber SC, Hanson KR (1992) Carbon partitioning and growth of a starchless mutant of
Nicotiana sylvestris. Plant Physiology 99: 1449-1454.
Joliot P, Joliot A (2006) Cyclic electron flow in C3 plants. Biochim. Biophys. Acta
1757: 362-368.
Kanazawa A, Kramer DM (2002) In vivo modulation of nonphotochemical exciton
quenching (NPQ) by regulation of the chloroplast ATP synthase. PNAS 99: 12789-
12794.
Kiirats O, Lea PJ, Franceschi VR, Edwards GE (2002) Bundle sheath diffusive
resistance to CO2 and effectiveness of C4 photosynthesis and refixation of photorespired
CO2 in a C4 cycle mutant and wild-type Amaranthus edulis. Plant Physiology 130: 964-
976.
Kleczkowski LA, Villand P, Preiss J, Olsen O-A (1993) Kinetic mechanism and
regulation of ADP-glucose pyrophosphorylase from barley (Hordeum vulgare) leaves. J.
Biol. Chem. 268: 6228-6233.
Kleczkowski LA (1999) A phosphoglycerate to inorganic phosphate ratio is the major
factor controlling starch levels in chloroplasts via ADP-glucose pyrophosphorylase
regulation. FEBS Letters 448: 153-156.
Krall JP, Edwards GE (1992) Relationship between photosystem II activity and CO2
fixation in leaves. Physiologia Plantarum 86: 180-187.
Kramer DM, Avenson TJ, Edwards GE (2004) Dynamic flexibility in the light
reactions of photosynthesis governed by both electron and proton reactions. Trends in
Plant Science 9: 349-357.
40

Kramer DM, Sacksteder CA, Cruz JA (1999) How acidic is the lumen? Photosynthesis
Research 60: 151-163.
Kramer DM, Johnson G, Kiirats O, Edwards GE (2004) New fluorescence parameters
for the determination of QA redox state and excitation energy fluxes. Photosynthesis
Research 79: 209-218.
Kramer DM and Sacksteder CA (1998) A diffused-optics flash kinetic spectrophometer
(DOFS) for measurements of absorbance changes in intact plants in the steady-state.
Photosynthesis Research 56: 103–112.
Laisk A, Loreto F (1996) Determining photosynthetic parameters from leaf CO2
exchange and chlorophyll fluorescence. Plant Physiology 110: 903-912.
Laisk A, Oja V, Rasulov B, Ramma H, Eichelmann H, Kasparova I, Pettai H, Padu
E, Vapaavuori E (2002) A computer-operated routine of gas exchange and optical
measurements to diagnose photosynthetic apparatus in leaves. Plant Cell and
Environment 25: 923-943.
Leegood RC, Edwards G (1996) Carbon metabolism and photorespiration: temperature
dependence in relation to other environmental factors. In NR Baker, ed, Photosynthesis
and the environment. Kluwer Academic Publishers, The Netherlands, pp 191-221.
Leegood RC, Furbank RT (1986) Stimulation of photosynthesis by 2% oxygen at low
temperatures is restored by phosphate. Planta 108: 84-93.
Miyake C, Miyata M, Shinzaki Y, Tomizawa K-I (2005) Response of cyclic electron
flow around PSI (CEF-PSI) in tobacco leaves – relative electron fluxes through PSI and
PSII determine the magnitude of non-photochemical quenching (NPQ) of Chl
fluorescence. Plant Cell Physiol. 46: 629-637.
41

Morison JIL, Batten GD (1986) Regulation of mesophyll photosynthesis in intact wheat
leaves by cytoplasmic phosphate concentrations. Planta 168: 200-206.
Neuhaus EH, Stitt M (1990) control analysis of photosynthate partitioning. Impact of
reduced activity of ADP-glucose pyrophosphorylase or plastid phosphoglucomutase on
the fluxes to starch and sucrose in Arabidopsis thaliana (L.) Heynh. Planta 182: 445-454.
Niyogi KK (2000) Safety valves for photosynthesis. Current Opinion in Plant Biology 3:
455-460.
Pammenter NW, Loreto F, Sharkey TD (1993) End product feedback on
photosynthetic electron transport. Photosynthesis Research 35: 5-14.
Pänke O, Rumberg B (1999) Kinetic modeling of rotary CFoF1-ATP synthase: storage
of elastic energy during energy transduction. Biochimica et Biophysica Acta 1412: 118-
128.
Peterson RB, Hanson KR (1991) Changes in photochemical and fluorescence yields in
leaf tissue from normal and starchless Nicotiana sylvestris with increasing irradiance.
Plant Science 76: 143-151.
Preiss J (1991) Biology and molecular biology of starch synthesis and regulation. In BJ
Miflin, ed, Oxford Surveys of Plant Molecular and Cellular Biology, Vol 7. Oxford
University Press, Oxford, pp 59-114.
del Riego G, Casano LM, Martín M, Sabater B (2006) Multiple phosphorylation
sites in the β subunit of thylakoid ATP synthase. Photosynthesis Research 89: 11-18.
Robinson SP, Giersch C (1987) Inorganic phosphate concentration in the stroma of
isolated chloroplasts and its influence on photosynthesis. Aust. J. Plant Physiol. 14: 451-
462.
42

Sacksteder CA, Jacoby ME, Kramer DM (2001) A portable, non-focusing optics
spectrophotometer (NoFOSpec) for measurements of steady-state absorbance changes in
intact plants. Photosynthesis Research 70: 231–240.
Sacksteder CA, Kramer DM (2000) Dark-interval relaxation kinetics (DIRK) of
absorbance changes as a quantitative probe of steady-state electron transfer.
Photosynthesis Research 66: 145–158.
Sage RF, Sharkey TD (1987) The effect of temperature on the occurrence of O2 and
CO2 insensitive photosynthesis in field grown plants. Plant Physiology 84: 658-664.
Scheibe R (1991) Redox-modulation of chloroplast enzymes. Plant Physiol. 96: 1-3.
Sharkey DJ, Vanderveer PJ (1989) Stromal phosphate concentration is low during
feedback limited photosynthesis. Plant Physiol. 91: 679-684
Sharkey TD (1985) O2 -insensitive photosynthesis in C3 plants. Plant Physiol. 78: 71-75.
Sharkey TD (1985) Photosynthesis in intact leaves of C3 plants: Physics, physiology and
rate limitations. The Botanical Review 51: 53-105.
Sharkey TD (1990) Feedback limitation of photosynthesis and the physiological role of
ribulose bisphosphate carboxylase carbamylation. Botanical Magazine, Tokyo 2: 87-105.
Sharkey TD, Laporte MM, Micallef BJ, Shewmaker CK, Oakes JV (1995) Sucrose
synthesis, temperature, and plant yield. In P Mathis, ed., Photosynthesis: from Light to
Biosphere, Vol V. Kluwer Academic Publishers, Dordrecht, pp 635-640.
Sharkey TD, Stitt M, Heineke D, Gerhardt R, Raschke K, Heldt HW (1986)
Limitation of photosynthesis by carbon metabolism. Plant Physiol. 81: 1123-1129
Sharkey TD, Vassey TL (1989) Low oxygen inhibition of photosynthesis is caused by
inhibition of starch synthesis. Plant Physiol. 90: 385-387
43
Strehler BL, McElroy WC (1957) Assay of adenosine triphosphate. Methods of
Enzymology 3: 871-873.
Sun J, Edwards GE, Okita TW (1999) Feedback inhibition of photosynthesis in rice
measured by O2 dependent transients. Photosynthesis Research 59: 187-200.
Sun J, Okita TW, Edwards GE (1999) Modification of carbon partitioning,
photosynthetic capacity, and O2 sensitivity in Arabidopsis plants with low ADP-glucose
pyrophosphorylase activity. Plant Physiol. 119: 267-276.
Takizawa K, Kanazawa A, Kramer DM (2008) Depletion of stromal Pi induces high ‘
energy dependent’ antenna exiton quenching (qE) by decreasing proton conductivity at
CF0-CF1 ATP synthase. Plant, Cell and Environment 31: 235-243.
Usuda H, Edwards GE (1982) Influence of varying CO2, O2 and orthophosphate
concentrations on rates of photosynthesis, and synthesis of glycolate and
dihydroxyacetone phosphate by wheat chloroplasts. Plant Physiol. 69: 469-473.
Viil J, Laisk A, Oja V, Parnik T (1972) The stimulating effect of oxygen on
photosynthesis. Dokl. Bot. Sci. 204: 86-88.
von Caemmerer S, Edmondson DL (1986) Relationship between steady-state gas
exchange, in vivo Ribulose bisphosphate carboxylase activity and some carbon reduction
cycle intermediates in Raphanus sativus. Australian Journal of Plant Physiology 13: 669-
688.
Walker D, Sivak MN (1986) Photosynthesis and phosphate, a cellular affair? Trends
Biochem Sci 11: 176-179.
Winter H, Robinson DG, Heldt HW (1994) Subcellular volumes and metabolite
concentrations in spinach leaves. Planta 193: 530-535.
44
Wirtz W, Stitt M, Heldt HW (1980) Enzymic determination of metabolites in the
subcellular compartments of spinach protoplasts. Plant Physiol. 66: 187-193.
Woodrow IE, Berry JA (1988) Enzymatic regulation of photosynthetic CO2 fixation in
C3 plants. Annu. Rev. Plant Physiol. Plant Mol. Biol. 39: 533-594.
45

CHAPTER TWO
Co-regulation of dark and light reactions in three biochemical subtypes of C4 species
ABSTRACT
Regulation of light harvesting in response to changes in light intensity, CO2 and
O2 concentration was studied in C4 species representing three different metabolic
subtypes: Amaranthus edulis (NAD-malic enzyme), Sorghum bicolor (NADP-malic
enzyme) and Panicum texanum (PEP-carboxykinase). Several photosynthetic parameters
were measured on an intact leaf in order to describe PS I and PS II activities, thylakoid
proton circuit, O2 evolution and CO2 assimilation rates. The C4 subtypes had similar
energy requirements for photosynthesis since there were no significant differences in
maximal quantum efficiencies for gross rates of O2 evolution (average value = 0.072
O2/quanta absorbed, ~14 quanta per O2 evolved). The PS I activity (calculated from A830
nm signal) was slightly more than twice the PS II electron flux in the malic enzyme
species, suggesting that the extra ATP required to support C4 photosynthesis can be
produced by cyclic electron flow with a ratio of 2H+/e-. Generally a linear relationship
was observed between PS I and PS II rates, as well as between PS II flux and proton flux.
At excess light, ATP synthase conductance responded strongly to changes in electron
flow, decreasing almost linearly when photosynthesis was suppressed with low CO2. It is
proposed that ATP synthase conductance is controlled at the substrate level by Pi
46

availability. The results suggest that NPQ development is controlled by ATP synthase
conductance rather than by generation of pmf by cyclic or pseudocyclic electron flow.
INTRODUCTION
C4 plants effectively concentrate CO2 at the site of RuBP carboxylation, thus
inhibiting photorespiration, but it comes with a significant energy cost through the C4
cycle. Beyond the requirement for 3 ATP and 2 NADPH per CO2 fixed by Rubisco, the
additional energy requirements depend on assimilatory power used in the 3 types of C4
pathways found among C4 species. The calculated theoretical minimum energy
requirements per CO2 fixed in NADP-malic enzyme (NADP-ME) and NAD-malic
enzyme (NAD-ME) type plants is 5 ATP and 2 NADPH, while in PEP-carboxykinase
(PEP-CK) type species it is 3.6 ATP and 2.3 NADPH (Kanai and Edwards, 1999). In C4
plants extra ATP may be generated through cyclic or pseudocyclic photophosphorylation;
in NADP-ME type C4 plants additional ATP is provided by cyclic photophosphorylation
in bundle sheath chloroplasts (Kanai and Edwards, 1999). In C3 plants the need for
cyclic electron transport and the cyclic pathways are currently being extensively debated
and experimentally evaluated (Kramer et al. 2004; Johnson 2005; Joliot and Joliot, 2006).
In C4 plants there are two suggested pathways of cyclic electron flow around
photosystem I: ferredoxin:plastoquinone oxidoreductase (Fd/PQ) dependent and
NAD(P)H dehydrogenase (NAD(P)H -plastoquinone reductase) (NDH) dependent flow
(Takabayashi et al., 2005; Ivanov et al. 2007; Majeran and van Wijk, 2009).
47

An additional possible contributor to ATP generation in C4 and C3 plants is the
photoreduction of oxygen in photosystem I by the Mehler reaction, water-water cycle
(Asada, 1999). The contribution of the water-water cycle to ATP production is likely to
be relatively small in C4 plants (Laisk and Edwards, 1998; Badger et al., 2000).
In C4 plants, photosynthetic electron transport, Calvin cycle reactions, and the C4
cycle, need to be co-regulated in order to provide optimal flux into end products, and
minimize the formation of reactive oxygen species which can lead to photo-inhibition. In
C3 plants various processes have been proposed to function to dissipate excess energy
including the chloroplast membrane malate/oxaloacetate shuttle, cyclic electron flow, the
Mehler reaction, and activation of nonphotochemical quenching (NPQ) by increased
thylakoid lumen acidification. We have shown in studies on C3 plants that the
intrathylakoid proton concentration is sensitive to ATP synthase conductance and this is
considered to play a key role in controlling thylakoid lumen pH and NPQ (Kanazawa and
Kramer, 2002; Kramer et al., 2004). Down-regulation of ATP synthase proton
conductivity under high light and limiting CO2 increases the intrathylakoid H+
concentration, which in turn activates the NPQ mechanism and protects PS II.
It has been proposed that cyclic electron flow can increase the concentration of
protons in the lumen and induce NPQ. In a putative mutant having altered cyclic electron
flow (Arabidopsis mutant PGR5), leaves were unable to build up a high proton gradient
even under low CO2, and the plant suffered from photo-inhibition under increasing light
(Munekage et al., 2005). The inability of PGR5 mutants to build up a proton gradient was
shown to be at least partially a result of very high thylakoid proton conductivity in these
mutants (Avenson et al., 2005), but there was no increase in ATP synthase content in
48

PGR5 leaves compared to wild type.
It is not clear what controls induction of NPQ in C4 plants through increased
acidification of the lumen, e.g. proton pumping by cyclic electron flow and/or regulation
of ATP synthase proton conductance, and whether there are significant differences in
comparison to C3 plants. Since cyclic photophosphorylation is considered to be more
active in C4 plants to meet needs for additional ATP, it might also be involved in
induction of NPQ under excess light. There are also differences in ATP and NADPH
consumption per CO2 fixed between the C4 subtypes due to different ATP demands and
differences in ratios of PS I and II between mesophyll and bundle sheath chloroplasts
(Edwards and Walker, 1983; Edwards and Voznesenskaya, in press). Also, the CO2
pump gives C4 plants some advantage over C3 species allowing higher electron transport
at high light and current ambient CO2 concentrations which results in less over-reduction
of the electron transport chain.
A proposed mechanism for regulation of ATP-synthase activity is through
changes in the level of inorganic phosphate (Pi) in the chloroplast stroma; i.e. limiting Pi
as one of the substrates would directly lower conductance of ATP synthase (Kramer et
al., 2004). In addition, changes in free energy (ΔG) of ATP synthesis reaction may affect
the ATP synthase activity. The increase of some phosphorylated intermediates with
increased assimilation rate to support the required metabolite gradients for transport
between mesophyll and bundle sheath cells in C4 plants may also have an effect on the Pi
status in chloroplasts (Leegood and Walker, 1999; Laisk and Edwards, 2000).
In this work we measure optical parameters of PSI and PSII, leaf gas-exchange
and leaf absorbance change at 520 nm upon light-dark transition (electrochromic shift
49
signal) of species representing the three C4 subtypes in order to evaluate the possible
regulatory mechanisms controlling NPQ.
METHODS
Amaranthus edulis [NAD-ME], Panicum texanum [PEP-CK] and Sorghum
bicolor [NADP-ME]), were grown in Econair (Winnipeg, Canada) growth chambers in
fertilized potting soil in 8 L pots (one plant per pot), with a 14/10 h day/night cycle at
28/22 oC, 50% relative humidity, ~380 µbar CO2, and an incident photosynthetic
quantum flux density (PFD) of 800 µmol m-2 s-1.
Leaf gas exchange fluorescence yield and ΔA830 measurements
Leaf gas exchange and fluorescence yield were measured with the FastEst gas
system (Tartu, Estonia, Laisk and Oja, 1998). The system was equipped with a LiCor
6251 (Lincoln, Nebraska) CO2 analyzer, Walz PAM101 fluorometer (Effeltrich,
Germany) and Applied Electrochemistry Inc. (Sunnyvale, California) S-3A oxygen
analyzer. Leaf gas exchange characteristics A, Ci, PFD and leaf temperature were
calculated as in Laisk and Loreto (1996). The true O2 evolution rate from PSII was
calculated as
JO2 = APFD·YII·(Fm'-Fs)/Fm' )/4
and PS I rate per four electrons as
JPSI = APFD·YI·(P/Pm)/4
Where Fs is fluorescence yield of steady state photosynthesis, Fm' is maximal
fluorescence yield by exposure to a 1 s pulse of 15,000 µmol m-2s-1 light, APFD is the
50

absorbed photosynthetic quantum flux density at steady state. The absorption coefficient
of leaves was measured using integrating sphere (Labsphere, North Sutton, NH). YII and
YI = fractions of light absorption by PSII and PSI, (Fm'-Fs)/Fm' = quantum yield of PSII
(Genty et al., 1989) and P/Pm quantum yield of PSI according to the saturating pulse
method (Klughammer and Schreiber, 1994). Pm represents leaf 830 nm maximum
absorbance change (from dark level to the level of Far red combined with saturating
flash) and P represents maximum absorbance change during illumination with saturating
flash. 50 ms 10 000 µmol m-2 s-1 saturating flash was used.
For the estimate of YII, the method proposed by Laisk and Loreto (1996) was
used. The relative proportion of absorbed light associated with linear electron transport
(Y) was found as the slope of the plot Fv/Fm’ (1-Fs/Fm') versus 4 times quantum yield of
O2 evolution at low oxygen background (0.025 %) and high CO2 (3%) measured at
different light intensities. 5% of light was considered absorbed by other leaf structures,
Mehler reaction and other possible losses. The remaining proportion of light was taken as
absorbed by PS I. NPQ and qL were calculated as in Kramer et al. (2004). NPQ (Fm/Fm’-
1) for all experiments represents the energy dependent component of NPQ (= qE) where
Fm was measured after 15 min of darkness.
Measurments of electrochromic shift (ECSt) and proton conductance (gH+) of thylakoid
membranes.
Steady state light-driven pmf and gH+ were estimated by following the absorbance
changes attributable to ECS, at 520 nm, with rapid light to dark transitions. The diffused-
optics spectrophotometer, which was constructed in-house (Kramer and Sacksteder,
1998; Sacksteder et al., 2001) has a 1 cm2 window that was clamped on the leaf. A small
51
air space (3 mm thickness) was left on the lower side of the leaf and gas with known
humidity, O2 and CO2 content (mixed with the FastEst system) was constantly passed
over the lower leaf surface at a rate of 10 cm3 s-1. The window was illuminated by actinic
diffuse red LED light. The modulated measurement light at 520 nm was provided by
another set of LED-s. Most experiments were done at room temperature 24 oC.
RESULTS
Light response.
Light response curves were measured under near atmospheric levels of CO2 (360
µbar) under 21% O2, as well as under high CO2 (0.15% and 3%) conditions to ensure
both CO2 cycles (C4 pump and Calvin cycle in bundle sheath chloroplasts) are CO2
saturated. The results under 0.15% and 3% CO2 were very similar to results under 360
µbar CO2 (not shown), indicating very high CO2 had no special effects on
photochemistry and CO2 fixation.
From optical measurements of PSI and PSII, rates of flux per 4 electrons through
each photosystem were estimated, JPS1 and JO2, respectively. There was a continuous rise
in rates of photochemistry in all three C4 subtypes with increasing PPFD up to the
equivalent of full sunlight (~2000 PFD). The maximum quantum efficiency of O2
evolution (the initial slope of the light response curve) was similar in all three species.
The average maximum quantum efficiencies for O2 evolution obtained from multiple
experiments were: 0.072 ± 0.0066 (SD, n = 13) for S. bicolor, 0.073 ± 0.005 (SD, n =
20) for A. edulis and 0.075 ± 0.01 (SD, n = 14) for P. texanum. In the NADP-ME type
species S. bicolor and the NAD-ME type species A. edulis, the estimated flux through
52

PSI was about two-fold higher than through PSII, while in the PEP-CK type species P.
texanum the estimated flux through PSI was about 1.6 fold higher than through PSII.
From analyses of electrochromic shift measurements with increasing PFD, there was
little change in conductance of ATP synthase (gH+) in S. bicolor and A. edulis while in P.
texanum there was some initial rise in gH+
with increasing PFD. In all 3 species
APFD, µmol m-2s-1
0 500 1000 1500 2000 2500
0
20
40
60
80
APFD, µmol m-2s-1
0 200 400 600 800 10000
30
60
90
120
150
0.0
0.5
1.0
1.5
2.0
Panicum texanum
0 500 1000 1500 2000
O2 e
volu
tion,
µm
ol m
-2s-1
0
20
40
60
80
Amaranthus edulis
0 500 1000 1500 2000 2500
0
20
40
60
80
Sorghum bicolor
ECSt
gH+
0 200 400 600 800 1000
g H+ ,
s-1
0
30
60
90
120
150
ΔA
520 *
103 (E
CS t)
0.0
0.5
1.0
1.5
2.0
0 200 400 600 800 10000
30
60
90
120
150
0.0
0.5
1.0
1.5
2.0
JO2
JO2
JO2
gH+
ECSt
ECSt
gH+
JPS1
JPS1
JPS1
A
B
C
D
E
F
53

Figure 2.1. Light response of photosynthesis parameters for three C4 subtypes: Sorghum
bicolor (NADP-ME), Amaranthus edulis (NAD-ME) and Panicum texanum (PEP-CK).
For panels A, B, C light response of O2 evolution was measured at 3% CO2 (30 mbar)
CO2 and low oxygen (0.02%) (white circles). JO2 at 3% CO2 (white triangles) was
matched with O2 evolution rate (white circles) by adjusting YII. This YII was used to
calculate relative light absorption by PS I and JPS1 (black triangles). Left panels (C,D,E)
describe light response of thylakoid membrane proton conductivity (gH+, black circles)
and leaf light to dark transient absorbance change at 520 nm (ECSt, white circles). Leaf
temperature was 29 oC.
54

APFD, µmol m-2s-1
0 500 1000 1500 2000
qE
0.0
0.5
1.0
1.5
2.0
ΔA520*103 (ECSt)0.0 0.5 1.0 1.5 2.0
qE
0.0
0.2
0.4
0.6
0.8
1.0
JO2, µmol m-2s-1
0 10 20 30 40
v H+ (
arbi
trary
)
0
50
100
150
200
250
S. bicolorP. texanumA. edulis
JO2, µmol m-2s-1
0 10 20 30 40 50
J PS1,
µmol
m-2
s-1
020406080
100120
A
B
C
D
Figure 2.2. Plots of data from figure 2.1 to show the relationships among different
parameters. Panel A shows the relationship between activities of the two photosystems
per four electrons in response to changes in light intensity. Panel B compares PS II
activity with the proton flux (vH+, determined from the initial rate of ECSt decay during
the light-dark transient). Included are data for qE versus APFD (panel C) and a plot
showing an increase in qE with increasing pmf (ECSt, panel D).
55
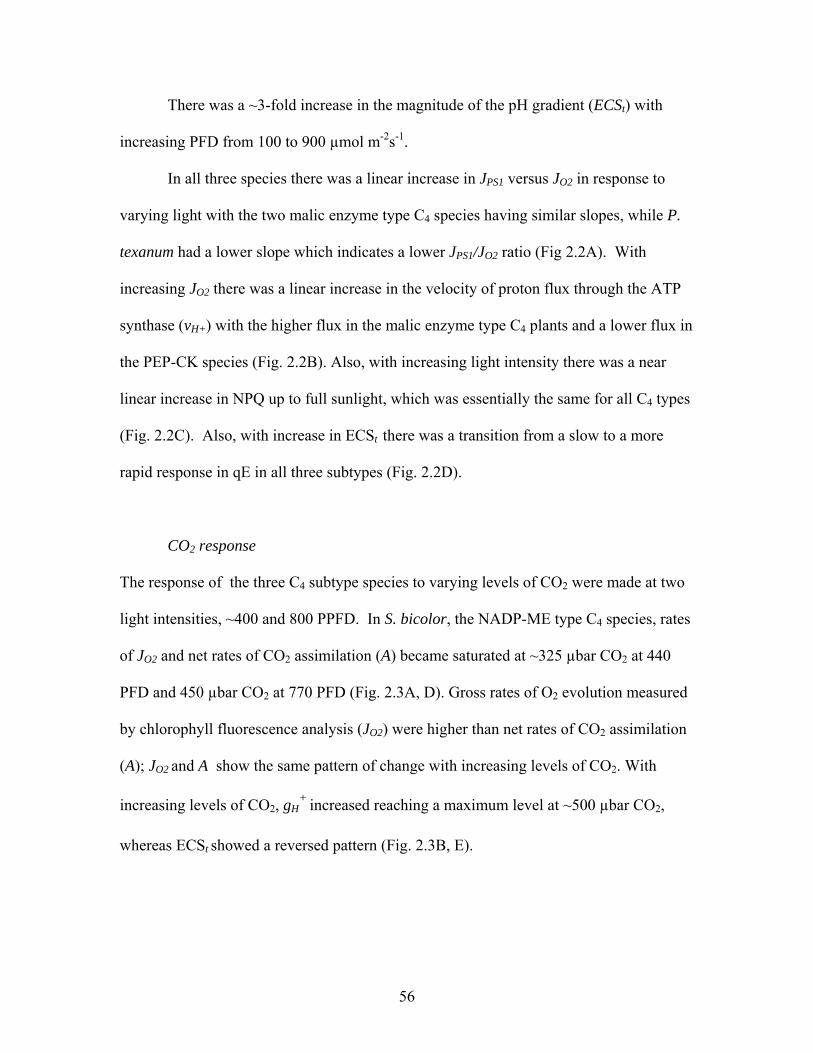
There was a ~3-fold increase in the magnitude of the pH gradient (ECSt) with
increasing PFD from 100 to 900 µmol m-2s-1.
In all three species there was a linear increase in JPS1 versus JO2 in response to
varying light with the two malic enzyme type C4 species having similar slopes, while P.
texanum had a lower slope which indicates a lower JPS1/JO2 ratio (Fig 2.2A). With
increasing JO2 there was a linear increase in the velocity of proton flux through the ATP
synthase (vH+) with the higher flux in the malic enzyme type C4 plants and a lower flux in
the PEP-CK species (Fig. 2.2B). Also, with increasing light intensity there was a near
linear increase in NPQ up to full sunlight, which was essentially the same for all C4 types
(Fig. 2.2C). Also, with increase in ECSt there was a transition from a slow to a more
rapid response in qE in all three subtypes (Fig. 2.2D).
CO2 response
The response of the three C4 subtype species to varying levels of CO2 were made at two
light intensities, ~400 and 800 PPFD. In S. bicolor, the NADP-ME type C4 species, rates
of JO2 and net rates of CO2 assimilation (A) became saturated at ~325 µbar CO2 at 440
PFD and 450 µbar CO2 at 770 PFD (Fig. 2.3A, D). Gross rates of O2 evolution measured
by chlorophyll fluorescence analysis (JO2) were higher than net rates of CO2 assimilation
(A); JO2 and A show the same pattern of change with increasing levels of CO2. With
increasing levels of CO2, gH+ increased reaching a maximum level at ~500 µbar CO2,
whereas ECSt showed a reversed pattern (Fig. 2.3B, E).
56

0 500 1000 1500 2000
A, J
O2, µ
mol
m-2
s-1
0
10
20
30
40
A 2% O2
JO2 2%
A 21% O2
JO2 21%
0 500 1000 1500 2000
g H+,
s-1
0
50
100
150
200
ΔA52
0*10
3 ( EC
S t)
0.0
0.5
1.0
1.5
2.0
2.5
3.0gH+
ECSt
0 500 1000 1500 2000A
, JO
2, µm
ol m
-2s-1
0
10
20
30
40
0 500 1000 1500 2000
g H+,
s-1
0
50
100
150
ΔA52
0*10
3 ( EC
S t)
0.0
0.5
1.0
1.5
2.0
2.5
3.0
PFD=770 µmol m-2s-1
A
E
PFD=440 µmol m-2s-1
B
D
Sorghum bicolor
ECSt
gH+
CO2 pressure , µbar
0 500 1000 1500 2000
qE, 1
-qL
0.0
0.5
1.0
1.5
2.0
CO2 pressure , µbar
0 500 1000 1500 2000
qE, 1
-qL
0.0
0.5
1.0
1.5
2.0
qEqE
1-qL 1-qL
C F
Figure 2.3 continued.
57

0 500 1000 1500 2000
A, J
O2, µ
mol
m-2
s-1
0
10
20
30
A 2% O2
JO2 2%
A 21% JO2
21%
0 500 1000 1500 2000
g H+,
s-1
0
50
100
ΔA 52
0*10
3 (EC
S t)
0
1
2
3gH+
ECSt
0 500 1000 1500 2000
A, J
O2, µ
mol
m-2
s-1
0
10
20
30
0 500 1000 1500 2000
g H+,
s-1
0
50
100
150
ΔA 52
0*10
3 (EC
S t)
0
1
2
3
PFD=770 µmol m-2s-1
A
C
PFD=440 µmol m-2s-1
B
D
Panicum texanum
ECSt
gH+
CO2 pressure , µbar
0 500 1000 1500 2000
qE, 1
-qL
0.0
0.5
1.0
1.5
2.0
CO2 pressure , µbar
0 500 1000 1500 2000
qE, 1
-qL
0.0
0.5
1.0
1.5
2.0
qE
1-qL1-qL
qE
E
F
Figure 2.3 continued.
58

0 500 1000 1500 2000
A, J
O2, µ
mol
m-2
s-1
0
5
10
15
20
A 21% O2
JO2 21%
0 500 1000 1500 2000
g H+,
s-1
0
25
50
75
100
ΔA
520 *
103 (E
CS t)
0.0
0.5
1.0
1.5
2.0
2.5gH+
ECSt
0 500 1000 1500 2000A
, JO
2, µm
ol m
-2s-1
0
5
10
15
0 500 1000 1500 2000
g H+,
s-1
0
25
50
75
100
ΔA
520 *
103 (E
CS t)
0.0
0.5
1.0
1.5
2.0
2.5
A
B
D
C
Amaranthus edulis
PFD=770 µmol m-2s-1 PFD=440 µmol m-2s-1
gH+
ECSt
CO2 pressure , µbar
0 500 1000 1500 2000
qE, 1
-qL
0.0
0.5
1.0
1.5
2.0
CO2 pressure , µbar
0 500 1000 1500 2000
qE, 1
-qL
0.0
0.5
1.0
1.5
2.0
E
FqE
1-qL
qE
1-qL
Figure 2.3. The response of multiple photosynthetic parameters to varying CO2 for the
three C4 subtype species. The data were collected at two light intensities 770 and 440
µmol m-2s-1 (absorbed light) and two O2 concentrations 21% (black symbols) versus 2%
(white symbols). Leaf temperature was 24.4oC for all experiments.
59

The parameters qE and 1-qL which relate to exiton quenching (Fig. 2.3 C, F),
increased in parallel with a decrease in CO2 levels and CO2 assimilation, with qE
reaching a maximum at very low CO2 values. The plants with lower CO2 assimilation
capacity, P. texanum and A. edulis, had higher qE values at CO2 saturation. For the
parameters studied, there was little or no difference between 21% versus 2% O2. With
increasing levels of CO2 there was a linear increase in JO2 versus gH+ with values
coinciding at the two light levels (Fig. 4 left panels). The relationship between PS II
electron flux represented by JO2 (from fluorescence yield measurements) and proton flux
vH+ (where vH
+= gH+*ECSt) was essentially linear considering the experimental errors
(Fig. 4 right panels). There may be some increase in proton flux relative to linear
electron flux at low CO2 concentrations which might be explained by over-estimating the
value of ECSt at low CO2 concentrations, or some increase in over-cycling of the C4
pump could occur at low CO2.
1. Oxygen response
Oxygen had a very similar effect on the electron transport rates at low levels of CO2
in all three species. Most of extra electron transport with respect to CO2 assimilation at
low CO2 can be explained by re-assimilation of respiratory CO2 and Mehler reaction.
Photorespiration seems to be effectively suppressed even at very low CO2 concentrations
in C4 plants.
60

Sorghum bicolor
0 10 20 30 400
50
100
150
200
0 10 20 30 400
50
100
150
200
Panicum texanum
0 10 20 30
g H+,
s-1
0
50
100
150
0 10 20 30
v H+,
(arb
itrar
y)
0
50
100
150
200
Amaranthus edulis
JO2, µmol m-2s-1
0 5 10 15 200
50
100
150
JO2, µmol m-2s-1
0 5 10 15 200
50
100
150
200
Figure 2.4. Plots of gross rates of O2 evolution (JO2) against proton conductivity and
proton steady state flux (data from experiment Fig. 2.3) for the three C4 subtype species.
The panels combine the data from two O2 concentrations (2% O2 – white symbols, 21%
61
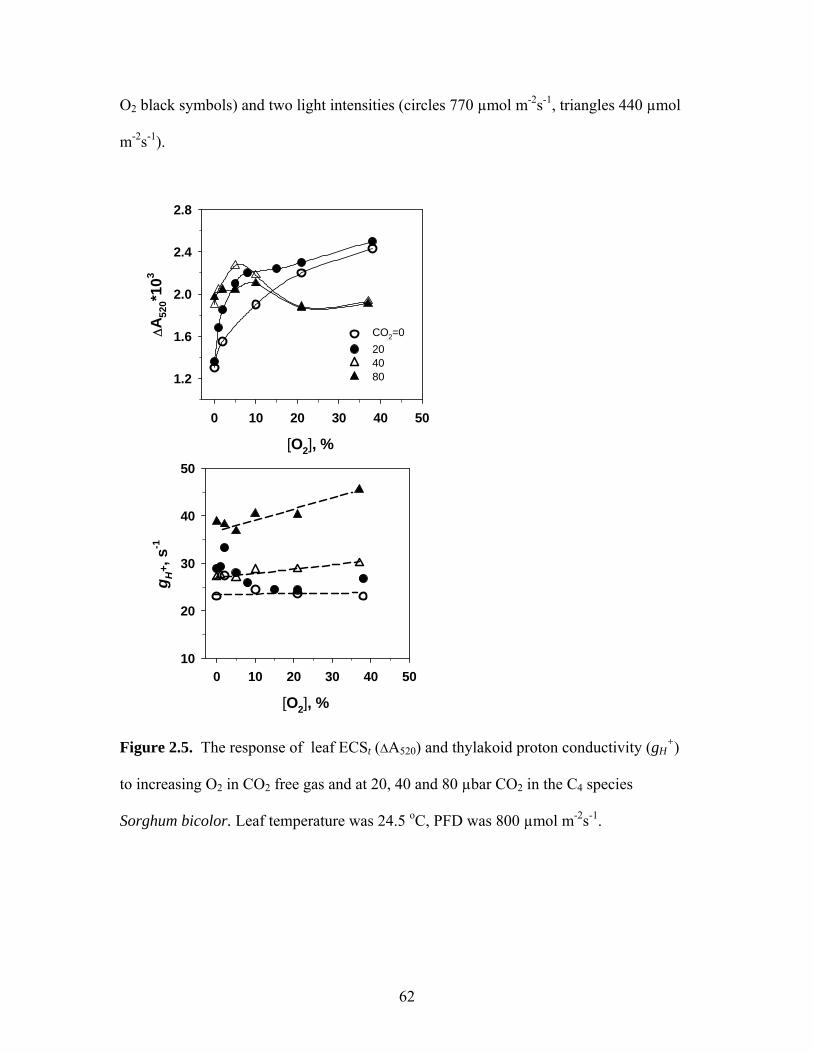
O2 black symbols) and two light intensities (circles 770 µmol m-2s-1, triangles 440 µmol
m-2s-1).
[O2], %
0 10 20 30 40 50
g H+,
s-1
10
20
30
40
50
CO2=0204080
[O2], %
0 10 20 30 40 50
ΔA
520*
103
1.2
1.6
2.0
2.4
2.8
Figure 2.5. The response of leaf ECSt (ΔA520) and thylakoid proton conductivity (gH+)
to increasing O2 in CO2 free gas and at 20, 40 and 80 µbar CO2 in the C4 species
Sorghum bicolor. Leaf temperature was 24.5 oC, PFD was 800 µmol m-2s-1.
62
It can be seen from Fig. 2.3 (panel E for Sorghum bicolor and Panicum texanum) that
the ECSt signal drops significantly when there is very low CO2 combined with low
oxygen concentration. This occurs in all three C4 subtypes (not shown for A. edulis). This
decrease in ESCt was not accompanied by a decrease in qE. Previously, a similar
phenomenon was reported for C3 plants (Avenson et al., 2004), and a decrease in the ratio
of the thylakoid membrane electrical potential relative to the proton concentration
gradient was found (ECSt measures the electrical component of the total pmf only).
With Sorghum bicolor, and analysis was made of the effect of increasing O2 from 0 to
40% in CO2 free nitrogen and at three low CO2 levels on ECSt and gH+. There was
measurable proton conductivity (about 15% compared to maximum at high CO2) in CO2
and oxygen free gas. Addition of either CO2 or oxygen eliminated the initial decrease of
ECSt. It can be seen (Fig. 2.5) that the initial drop in ECSt can be eliminated by adding
either 40 µbar CO2, or 21% O2, in a N2 background. For S. bicolor, either 40 µbar CO2 or
21% O2 in N2 produced about equal rates of JO2 (5 µmol O2 m-2 s-1). We conclude that
this level of electron flow is required to prevent the above described phenomenon. Thus,
this electron flow can be coupled to either RuBP carboxylase or RuBP oxygenase
activity. The Mehler reaction potentially could be involved in some capacity; but it is not
necessary for ECSt recovery as adding CO2 has the same effect as O2.
DISCUSSION
The mesophyll chloroplasts and bundle sheath chloroplasts in C4 plants differ by
their pigment composition. Also, the special arrangement differs; the mesophyll
chloroplasts are more scattered while bundle sheath chloroplasts are concentrated close to
63
the vascular tissue bundles. The heterogeneity of the system raises the question if the
optical measurements adequately reflect the rates of the electron transport processes. It
has been shown that PS II electron flow calculations using the C4 leaf fluorescence yield
data and Genty et al. (1989) formulas adequately predict CO2 assimilation rates (Edwards
and Baker, 1993, Oberhuber et al., 1993). This adds confidence that PS I rates can be
predicted as well using P700 absorption.
It is generally agreed that the extra ATP needed in C4 plants for CO2 concentrating
mechanism is provided by cyclic photophosphorylation related to PS I activity (Kanai
and Edwards, 1999). The details and the efficiency of cyclic electron transport around PS
I are not fully established. The measurement of the maximum quantum yield of C4
photosynthesis helps to differentiate between different possible mechanisms. It has been
suggested that NDH pathway as opposed to Fd/PQ pathway is involved. Takabayashi et
al. (2005) found that NDH was highly expressed in mesophyll cells in the NAD-ME
species and in bundle sheath cells in NADP-ME species that coincides with the locations
where the extra ATP is needed. Considering the electron transport model where Q-cycle
is fully engaged NDH cyclic pathway would carry 2H+ per e- (Heber et al., 1995). With
linear electron flow 3H+/e- we need to run PS I twice as fast to provide 5 ATP per one O2
evolved (4 e-) assuming 4 H+ per ATP. If the ATP production requires 4.66 H+ per ATP
(Kramer et al. 2004) the cyclic process must run 2.8 times faster than linear electron
flow. There are also extra costs of ATP related to glycosidic bond formation in starch and
sucrose synthesis and C4 cycle “over-cycling” due to the leakage of bundle sheath cell
walls. Furbank et al. (1990) estimate the ATP expense for polysaccharide synthesis to be
0.17 moles ATP per mol of CO2 fixed and the C4 cycle needs to run about 25% faster
64

than the net rate of photosynthesis to compensate CO2 losses through leakage. The
measured quantum efficiencies for O2 evolution 0.072-0.075 (~13.5 quanta per O2
evolved) and PS I rate slightly more than 2 times linear electron flow (Fig. 2.1) would
require H+/e- ratio higher than 2 for cyclic process or ATP synthase H+/ATP 4 instead of
4.66 to satisfy above mechanism.
The linear relationship between electron fluxes of PS II and PS I and PS II and
proton flux through ATP synthase (Fig. 2.2) are expected as there is no possibility for
CO2 limitation at 3% CO2 and both the Calvin cycle and C4 pump mechanism are only
limited by light availability. The range of light intensities that was used for ECS
measurements was limited to 100- 800 µmol m-2s-1 due to the limitations of equipment
used. The relationship between ECSt and NPQ is similar to C3 response but Fig. 2.2
covers only raising part of the typical S-shaped curve recorded for C3 species (Takizawa
et al., 2007) due to limited range of illumination used. The fit of the data points from
different species on almost the same line should be considered coincidental as ECS signal
is not calibrated and it depends on the content of carotenoids in thylakoid membranes and
on optical properties of the leaves.
CO2 response of all three species show slightly higher PS II activity in compared
to net CO2 fixation (Fig. 2.3). It can be explained by dark respiration and some relatively
small Mehler reaction. The data agree with relatively small role of Mehler type reaction
in ATP production in C4 species (Laisk and Edwards, 1998). ATP synthase proton
conductivity followed closely linear electron transport rate at both light intensities used
(Fig. 2.3) and there was a linear correlation between linear electron transport rate
(represented by JO2) and gH+. This relationship between JO2 and gH
+ closely resembles
65

the same in C3 species (see Chapter 1 and 2). The explanation we provided for C3 species
was that ATP synthase under these conditions is limited from chloroplast stroma side and
mostly by the availability of the substrate Pi while ADP is essentially saturating and ΔG
for ATP synthesis does not change substantially in the range of conditions used. The
decrease of ATP synthase conductance at low CO2 helps to maintain high proton pool
size inside thylakoid lumen necessary for excess energy dissipation via NPQ mechanism.
Previously it has been argued that the proton pumping via PS I cyclic pathway is
necessary for NPQ development at CO2 limitation (Heber and Walker, 1992). Being part
of the proton pumping mechanism the cyclic photophosphorylation has importance in pH
gradient generation. It can be argued that as a regulator ATP synthase conductance
variation has more importance. It is supported by the relatively unchanged
NADPH/NADP ratio on CO2 response curve (need to check the reference).
The apparent decrease in ECSt at very low CO2 and O2 can be overcome if the
electron flow is increased either with adding CO2 or O2 (Fig. 2.5). About 5 µmol m-2s-1
O2 evolution rate was sufficient to eliminate the effect. The ECSt decrease could be
explained by some proton leakage that can be overcome if more pumping activity is
increased. At very high PQ reduction (1-qL in Fig. 2.3) about 90% Q-cycle may be not
fully operational as well (Heber and Walker, 1992). The proton flux with 21% O2 added
at 0 CO2 background creates O2 oxygenation activity about equal to 40 µbar CO2 at 0 O2
background. Both eliminate the observed ECSt decrease. Therefore Meler type proton
pumping is not necessary in this case.
The ECSt drop at very low CO2 and O2 occurs also in C3 plants. It has been shown
(Avenson et al., 2005) that there is no drop in actual proton pool size but pmf distribution
66
between electrical and H+ concentration component changes toward concentration
component that creates ECSt decrease as ECS records only electrical component. This is
also in agreement with the observation that there is no corresponding change in NPQ that
would decrease with proton concentration drop. The mechanism of electrical component
decrease is not clear.
REFERENCES
Asada K (1999) The water-water cycle in chloroplasts: scavenging of active oxygens and
dissipation of excess photons. Annu. Rev. Plant Physiol. Plant Mol. Biol. 50: 601-639.
Avenson TJ, Cruz JA, Kramer DA (2004) Modulation of energy-dependent quenching
of exitons in antennae of higher plants. PNAS 101: 5530-5535.
Avenson TJ, Cruz JA, Kanazawa A, Kramer DA (2005) Regulating the proton budget
of higher plant photosynthesis. PNAS 102: 9709-9713.
Badger MR, von Caemmerer S, Ruuska S, Nakano H (2000) Electron flow to oxygen
in higher plants and algae: rates and control of direct photoreduction (Mehler reaction)
and rubisco oxygenase. Phil. Trans. R. Soc. Lond. B 355: 1433-46.
Genty B, Briantais J, Baker NR (1989) The relationship between the quantum yield of
photosynthetic electron transport and quenching of chlorophyll fluorescence. Biochim.
Biophys. Acta 990: 87-92.
Edwards Gen Baker NR (1993) Can CO2 assimilation in maize leaves be predicted
accurately from chlorophyll fluorescence analysis? Photosynthesis Research 37: 89-102.
Edwards GE, Walker DA (1983) 'C3, C4: Mechanisms, and Cellular and Environmental
Regulation, of Photosynthesis.' (Blackwell Scientific Publications: Oxford, UK)
67

Furbank, RT, Jenkins, CLD and Hatch, MD (1990) C4 photosynthesis: Quantum
requirement, C4 acid overcycling and Q-cycle involvement. Aust. J. Plant Physiol. 17: 1-
7.
Heber U, Walker D (1992) Concerning a dual function of coupled cyclic electron
transport in leaves. Plant Physiol. 100: 1621-1626.
Heber U, Bukhov NG, Neimanis S, Kobayashi Y (1995) Maximum H+/η PSI
stoichiometry of proton transport during cyclic electron flow in intact chloroplasts is at
least two, but probably higher than two. Plant Cell Physiol. 36: 1639-1647.
Ivanov B, Asada K, Edwards GE (2007) Analysis of donors of electrons to
photosystem I and cyclic electron flow by redox kinetics of 700 in chloroplasts of
isolated bundle sheath strands of maize. Photosynthesis Research 92, 65-74.
Johnson G.N. (2005) Cyclic electron transport in C3 plants: fact or artifact? Journal of
Experimental Botany 56: 407-416.
Joliot P, Joliot A. (2006) Cyclic electron flow in C3 plants. Biocim. et Biophys. Acta
1757: 362-368.
Kanai R, Edwards GE (1999) The biochemistry of C4 photosynthesis. In 'C4 plant
biology'. (Eds RF Sage and RK Monson) pp. 49-87. (Academic Press: New York).
Kanazawa A, Kramer DM (2002) In vivo modulation of nonphotochemical exiton
quenching (NPQ) by regulation of the chloroplast ATP synthase. PNAS 99: 12789-94.
Klughammer C, Schreiber U (1994) An improved method, using saturating light pulses,
for the determination of photosystem I quantum yield via P700+ absorbance changes at
830 nm. Planta 192: 261-268.
68

Kramer DM, Avenson TJ, Edwards GE (2004) Dynamic flexibility in the light
reactions of photosynthesis governed by both electron and proton reactions. Trends in
Plant Science 9: 349-357.
Kramer DM, Johnson G, Kiirats O, Edwards GE (2004) New fluorescence parameters
for the determination of QA redox state and excitation energy fluxes. Photosynthesis
Research 79: 209-218.
Kramer DM, Sacksteder CA (1998) A diffused-optics flash kinetic spectrophotometer
(DOFS) for measurements of absorbance changes in intact plants in the steady-state.
Photosynthesis Research 56: 103–112.
Kubicki A, Funk E, Westhoff P, Steinmüller K (1996) Differential expression of
plastome-encoded ndh genes in mesophyll and bundle sheath chloroplasts of the C4 plant
Sorghum bicolor indicates that the complex I-homologous NAD(P)H-plastoquinone
oxidoreductase is involved in cyclic electron transport. Planta 199: 276-281.
Laisk A, Edwards GE (1998) Oxygen and electron flow in C4 photosynthesis: Mehler
reaction, photorespiration and CO2 concentration in the bundle sheath. Planta 205: 632-
645.
Laisk A, Loreto F (1996) Determining photosynthetic parameters from leaf CO2
exchange and chlorophyll fluorescence. Plant Physiol. 110: 903-912.
Laisk A, Oja V. (1998) Dynamics of leaf photosynthesis. CSIRO Publishing,
Collingwood, Australia, 160 pp.
Laisk A, Edwards GE (2000) A mathematical model of C4 photosynthesis: The
mechanism of concentrating CO2 in NADP-malic enzyme type species. Photosynthesis
Research 66, 199-224.
69

Leegood RC, Walker RP (1999) Regulation of the C4 pathway. In 'C4 plant biology'.
(Eds. RF Sage and RK Monson) pp. 89-131. (Academic Press: New York)
Majeran W, van Wijk KJ (2009) Cell-type-specific differentiation of chloroplasts in C4
plants. Trends in Plant Science 14: 100-109.
Munekage Y, Hojo M, Meurer J, Endo T, Tasaka M, Shikanai T (2002) PGR5 is
involved in cyclic electron flow around photosystem I and is essential for photoprotection
in Arabidopsis. Cell 110: 361-371.
Oberhuber W, Dai ZY, Edwards G (1993) Light dependence of quantum yields of
photosystem II to CO2 fixation in C4 and C3 plants. Photosynthesis Research 35: 265–
274.
Sacksteder CA, Jacoby ME, Kramer DM (2001) A portable, non-focusing optics
spectrophotometer (NoFOSpec) for measurements of steady-state absorbance changes in
intact plants. Photosynthesis Research 70: 231–240.
Takabayashi A, Kishine M, Asada K, Endo T, Sato F (2005) Differential use of two
cyclic electron flows around photosystem I for driving CO2-concentration mechanism in
C4 photosynthesis. PNAS 102: 16898-903.
Takizawa K, Cruz JA, Kanazawa A, Kramer DA (2007) The thylakoid proton motive
force in vivo. Quantitative, non-invasive probes, energetics, and regulatory consequences
of light-induced pmf. Biochim. Biophys. Acta 1767: 1233-1244.
Usuda H (1988) Adenine nucleotide levels, the redox state of the NADP system, and
assimilatory force in nonaqueously purified mesophyll chloroplasts from maize leaves
under different light intensities. Plant Physiol. 88: 1461–1468.
70
Woodrow IE, JA Berry (1988) Enzymatic regulation of photosynthetic CO2 fixation in
C3 plants. Annu. Rev. Plant Physiol. Plant Mol. Biol. 39: 533-94.
71

CHAPTER 3
The use of photosynthetic mutants to elucidate the mechanism of regulation of
photosynthesis by ATP synthase under variable climatic conditions
ABSTRACT
The chloroplast thylakoid membrane CF0-CF1 ATP synthase participates in co-
regulation of the electron transport reactions and dark reactions in plant photosynthesis. It
has been shown that the proton conductivity of the enzyme varies depending on
environmental conditions. Proton conductivity of the ATP synthase modulates non-
photochemical exciton quenching by directly affecting the steady state proton pool size
(pH) inside the thylakoid lumen. The mechanism of dynamic change of ATP synthase
conductance has not yet been conclusively established.
This work included measurements of rates of CO2 exchange, photosystem II
activity and gross rates of O2 evolution (by chlorophyll fluorescence analysis) and non-
photochemical dissipation of energy as heat (qE). Thylakoid membrane proton
conductivity was measured using the carotenoid electrochromic shift signal. Analysis of
the post-illumination CO2 uptake signal allowed us to determine the status of the Calvin
cycle RuBP pool sizes. We used two photosynthetic mutants which were compared to
wild type plants: the Arabidopsis pgr5 protein deficient mutant which affects the capacity
for cyclic electron transport, and the tobacco low Rubisco antisense mutant. The above
mentioned photosynthetic parameters were measured under different light, CO2 and O2
72
conditions. The Arabidopsis pgr5 mutant, compared to wild type, had similar CO2 uptake
rates and RuBP pool sizes; but, in the mutant the steady state proton concentration in the
thylakoids was reduced along with lower NPQ levels. The lower pool of protons in the
thylakoids in the mutant was fully compensated by an increase in ATP synthase proton
conductivity; so, that the photosynthetic rates did not differ much between mutant and
wild type Arabidopsis. The lower maximum quantum efficiency for CO2 assimilation for
the pgr5 mutant (0.063) compared to wild type (0.072) was explained by photo-inhibition
in the mutant. The data are discussed relative to possible models for regulation of ATP
synthase.
INTRODUCTION
While pmf is the driving force for ATP synthesis, its ΔpH component serves at the
same time as an essential part of the non-photochemical energy dissipating mechanism.
Intrathylakoid proton concentration holds the central role in this regulatory process by
activating conversion of violaxanthin to zeaxanthin in the xanthophyll cycle, and by
modifying protonation of certain PS II LHC proteins involved in the process (Demmig-
Adams and Adams, 1996, Horton et al., 1996). Under stressful conditions where CO2
assimilation is restricted by low intracellular levels of CO2, by cold temperatures, or other
factors under excess light, increased acidification of the thylakoid lumen (resulting in a
high pH gradient, pmf) is needed in order to induce high non-photochemical dissipation
of the light energy. To achieve this, the proton conductance (gH+) of the ATP-synthase
must be reduced. Kanazawa and Kramer (2002) described the process of modulating gH+
under several CO2 and light levels and proposed a model that includes modulation of
73

ATP-synthase activity on the stromal side by change in metabolite pools with inorganic
phosphate (Pi) being the most likely limiting factor. As Pi is a regulator for several other
processes (starch synthesis, triose phosphate export from the chloroplasts, Paul and
Foyer, 2001), this finding has important consequences for general understanding of the
regulation of photosynthesis as a whole. Besides regulation by Pi there are other
possibilities for regulation of ATP synthase activity. It may also be controlled by free
energy change (ΔG) of ATP synthesis in the chloroplast stroma or by direct allosteric
regulation of ATP synthase activity (Bunney et al., 2001).
The alternative explanations offered for NPQ regulation under low CO2 and
stressful situations and excess light is increasing activities of cyclic or pseudocyclic
electron transport, which could potentially increase pmf and acidification of the lumen
(Heber and Walker, 1992; Ott et al., 1999; Miyake et al., 2005).
There is potential to increase understanding of the mechanisms of excess energy
dissipation during photosynthesis by testing how mutations in photochemistry and carbon
assimilation affect ATP synthase and energy dissipation. We used two mutants in this
study, one affecting photochemistry, Arabidopsis pgr5 mutant with altered cyclic electron
transport (Munekage et al., 2002); and, the other affecting capacity for carbon fixation
(low Rubisco mutant, Hudson et al., 1992). Due to an imbalance between light and dark
reactions capacity, there is a possibility of activating PS I cyclic or Mehler type electron
transport pathways as a means of inducing energy dissipation. The Pgr5 mutant interferes
with the ferredoxin-plastoquinone oxidoreductase catalyzed cyclic pathway. A feature of
this mutant is up-regulated ATP synthase proton conductivity which results in low pmf
and reduced non-photochemical quenching mediated by violaxanthin/zeaxanthin cycle
74

(Munekage et al., 2002; Munekage et al., 2004). The association of an elevated ATP
synthase proton conductivity with decreased NPQ clearly provides support for function
of ATP synthase in regulation of NPQ. The mechanism of how regulation of ATP
synthase occurs is still uncertain.
METHODS
Tobacco low Rubisco activity (~15% of wt) mutant (Hudson et al., 1992) and
Arabidopsis pgr5 mutant with modified cyclic electron transport (low ΔpH and increased
NPQ, Munekage et al., 2002) were used. Plants of Nicotiana tabacum were grown in
Econair (Winnipeg, Canada) growth chambers in fertilized potting soil in 8 L pots (one
plant per pot), with a 14/10 h day/night cycle at 28/22 °C, 50% relative humidity, 380
µbar CO2, and an incident photosynthetic quantum flux density (PFD) of 800 µmol m-2 s-
1. Arabidopsis plants were grown with a 14/10 h day/night cycle at 24/18 °C, 50%
relative humidity, 380 µbar CO2, and PFD of 350 µmol m-2 s-1 in 1 L pots (one plant per
pot).
The following leaf photosynthetic parameters were measured: A, rate of CO2
fixation; AC, assimilatory charge-RuBP pool (post-illumination uptake of CO2); qE, non-
photochemical quenching; 1-qL, reductive state of the plastoquinone pool; gH+, ATP
synthase conductance; ECSt, electrochromic shift a pmf.
Leaf photosynthetic parameters were recorded with the FastEst gas system
(described in detail in Laisk and Oja, 1998). The system is equipped with a Li-Cor 6251
(Lincoln, Nebraska) CO2 analyzer, Applied Electrochemistry Inc. (Sunnyvale,
California) S-3A O2 ceramic heated zirconium oxide analyzer and Walz PAM 101
75

(Effeltrich, Germany) flurometer that can be used to measure fluorescence yield
associated with PSII or A820 measurements associated with PSI. The true rates of O2
evolution from PSII (JO2) were calculated as:
JO2 = APFD·YII·(Fm'-Fs)/Fm' )/4
where (Fm'-Fs)/Fm' is the yield of PSII, Fs is fluorescence yield of steady state
photosynthesis, Fm' is maximal fluorescence yield by exposure to a 1 s pulse of 15,000
µmol m-2s-1 light and APFD is the absorbed photosynthetic quantum flux density at
steady state (Genty et al., 1989). YII is the relative optical cross-section of PSII (the
fraction of light absorbed by PSII) as determined in (Laisk et al., 2002) from light
response curves for leaf O2 evolution under a low O2 background. Absorbed
photosynthetic quantum flux density (APFD) was calculated with absorption coefficient
determined by using an integrating sphere (Labsphere, North Sutton, NH). qE and qL
were calculated as in Kramer et al. (2004). qE for all experiments represents the energy
dependent component of NPQ where for NPQ calculations Fm was measured after 15
min of darkness.
The rate of PS I per four electrons transported was calculated as
JPSI = APFD·YI·(P/Pm)/4.
P/Pm is quantum yield of PS I according to the saturating pulse method (Klughammer and
Schreiber, 1994). Pm represents leaf 830 nm maximum absorbance change (from dark
level to the level obtained under Far red light combined with a saturating flash of white
light) and P represents maximum absorbance change during illumination with a
saturating flash for 50 ms at 10,000 µmol quanta m-2 s-1. The absorbance change during
the saturating flash (P) represents PS I centers that are efficient in electron transport. The
76

centers have reduced donor side and oxidized acceptor side (Klughammer and Schreiber,
1994).
YI was calculated as 1-(YII-0.05) assuming 5% of light is being absorbed by non-
photosynthesizing components of the leaf.
The assimilatory charge (AC) during photosynthesis in the light was determined
at a given time as described in (Laisk et al., 2002) by measuring the magnitude of the
post-illumination uptake of CO2.
Steady state light-driven pmf and gH+ were estimated by following the absorbance
changes attributable to ECS, at 520 nm, with rapid light to dark transitions. The diffused-
optics spectrophotometer, which was constructed in-house (Kramer and Sacksteder,
1998; Sacksteder et al., 2001) has a 1 cm2 window that was clamped on the leaf. A small
air space (3 mm thickness) was left on the lower side of the leaf and gas with known
humidity, O2 and CO2 content (mixed with the FastEst system) was constantly passed
over the lower leaf surface at a rate of 10 cm3 s-1. The window was illuminated by actinic
diffuse red LED light. The modulated measurement light at 520 nm was provided by
another set of LEDs. The experiments for measurements of ECS were performed at room
temperature 24 oC.
RESULTS AND DISCUSSION
Regulation of ATP synthase conductance in pgr5 mutant of Arabidopsis
The Pgr5 mutant of Arabidopsis was initially considered to have impaired cyclic
electron transport (CET) due to the PGR5 protein being direct involved in the mechanism
(Munekage et al., 2002; Munekage et al., 2004). This view was challenged by Nadha et
al. (2007) who showed PGR5 protein participates not directly in CET; but, rather in a
77

regulatory capacity. Low CET was suggested to be the result of high reduction state of
electron transport carriers. They suggested that the low pmf in pgr5 mutant was a result of
reduced CET.
Figure 3.1. Arabidopsis pgr5 mutant and wild type (left) used in the experiments.
It has been shown that the thylakoid ATP synthase conductance is high in pgr5
mutant (Avenson et al., 2005), for unknown reasons. We were interested in this
phenomenon, since high thylakoid membrane proton conductivity could be the sole
reason for reduced pmf and qE.
Under the growth conditions used, the pgr5 mutants grew only slightly slower
than wild type plants. The chlorophyll content of pgr5 was significantly reduced: 135
µmol m-2 versus 248 µmol m-2 in the wild type. The aim of this set of experiments was to
analyze possible reasons for the high proton conductivity in the mutants. Either partial
uncoupling of ATP synthase or proton leakage across thylakoid membranes should cause
a low quantum efficiency under limiting light. Hypothetical models for pmf regulation
78
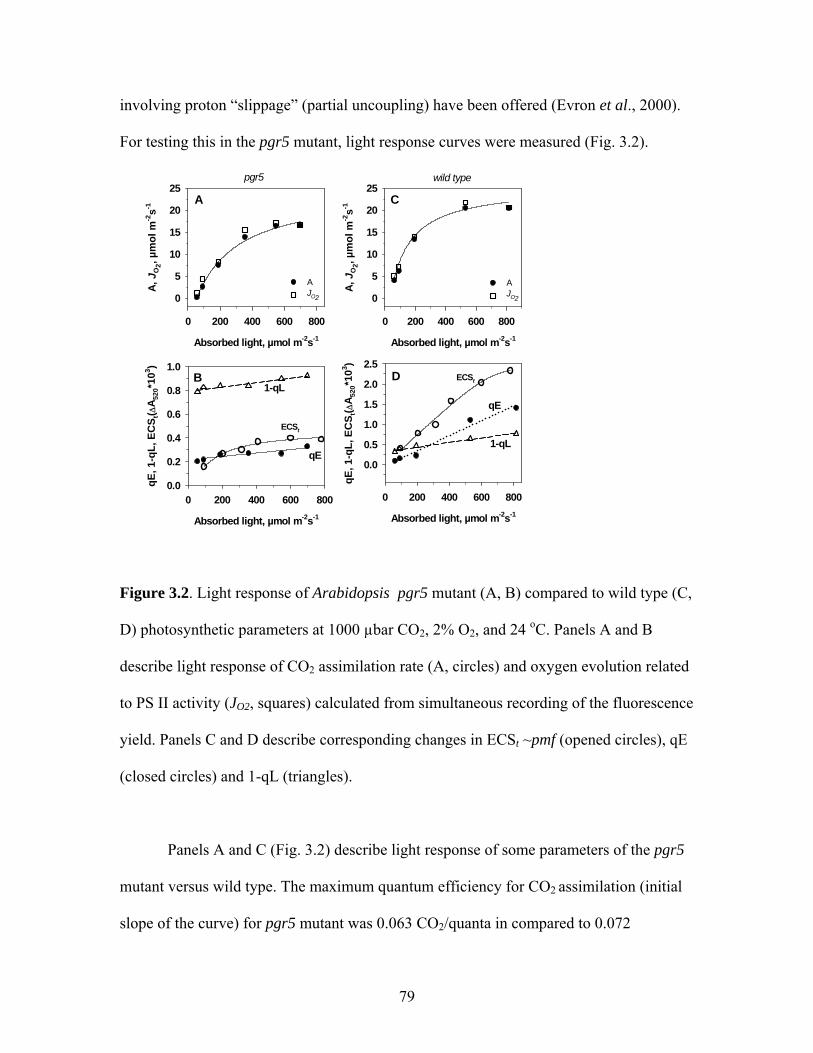
involving proton “slippage” (partial uncoupling) have been offered (Evron et al., 2000).
For testing this in the pgr5 mutant, light response curves were measured (Fig. 3.2).
pgr5
Absorbed light, µmol m-2s-1
0 200 400 600 800
A, J
O2, µ
mol
m-2
s-1
0
5
10
15
20
25
AJO2
Absorbed light, µmol m-2s-1
0 200 400 600 800
qE, 1
-qL,
EC
S t( Δ
A 520
*103 )
0.0
0.2
0.4
0.6
0.8
1.0
wild type
Absorbed light, µmol m-2s-1
0 200 400 600 800
A, J
O2, µ
mol
m-2
s-1
0
5
10
15
20
25
AJO2
Absorbed light, µmol m-2s-1
0 200 400 600 800
qE, 1
-qL,
EC
S t( Δ
A 520
*103 )
0.0
0.5
1.0
1.5
2.0
2.5
A
B
C
D1-qL
ECSt
qE
qE
ECSt
1-qL
Figure 3.2. Light response of Arabidopsis pgr5 mutant (A, B) compared to wild type (C,
D) photosynthetic parameters at 1000 µbar CO2, 2% O2, and 24 oC. Panels A and B
describe light response of CO2 assimilation rate (A, circles) and oxygen evolution related
to PS II activity (JO2, squares) calculated from simultaneous recording of the fluorescence
yield. Panels C and D describe corresponding changes in ECSt ~pmf (opened circles), qE
(closed circles) and 1-qL (triangles).
Panels A and C (Fig. 3.2) describe light response of some parameters of the pgr5
mutant versus wild type. The maximum quantum efficiency for CO2 assimilation (initial
slope of the curve) for pgr5 mutant was 0.063 CO2/quanta in compared to 0.072
79

CO2/quanta in the wild type. This 12% decrease in quantum efficiency in the mutant can
be accounted for by photo-inhibition, rather than by a decrease in efficiency of use of
pmf.
The additional panels B and D in Figure 3.2 show with increasing light, the
mutant in comparison to wild type does not build up a substantial pmf (measured as ECSt)
and as a result it does not develop qE as light intensity increases. In addition the mutant
has a highly reduced plastoquinone pool (based on 1 – qL), even at low light intensities.
pgr5 mutant
Intercellular CO2, µbar0 200 400 600 800 1000
A, J
O2, µ
mol
m-2
s-1
0
5
10
15
20
25
AC, µ
mol
m-2
0
40
80
120
160
Intercellular CO2, µbar0 200 400 600 800 1000
g H+,
s-1
0
50
100
150
200
ECS t
, (ΔA 5
20*1
03 )
0.0
0.2
0.4
0.6
0.8
1.0
wild type
Intercellular CO2, µbar0 200 400 600 800 1000
A, J
O2, µ
mol
m-2
s-1
05
1015202530
AC, µ
mol
m-2
0
40
80
120
160
Intercellular CO2, µbar0 200 400 600 800
g H+,
s-1
0
25
50
75
100
ECS t
, (ΔA 5
20*1
03 )
1.2
1.6
2.0
2.4
2.8
Intercellular CO2, µbar0 200 400 600 800 1000
qE, 1
-qL
0.0
0.2
0.4
0.6
0.8
1.0
Intercellular CO2, µbar0 200 400 600 800
qE, 1
-qL
0.0
0.5
1.0
1.5
2.0
A
B
C
D
E
F
AC
A
JO2JO2
AAC
gH+
ECSt
ECSt
gH+
1-qL
qE
qE
1-qL
80

Figure 3.3. CO2 response of Arabidopsis pgr5 mutant (A, B, C) compared to wild type
(D, E, F). Photosynthetic parameters were measured at 360 µmol m-2s-1 APFD, 2% O2,
and 24 oC. Panels A and B describe light response of CO2 assimilation rate (A, circles)
and oxygen evolution related to PS II activity (JO2, squares) calculated from simultaneous
recording of the fluorescence yield. Panels C and D describe corresponding changes in
ECSt ~pmf (opened circles), qE (closed circles) and 1-qL (triangles).
One of the hypotheses offered (Avenson et al., 2005) to explain the high proton
conductivity in pgr5 has been that it may have an unusually high level of inorganic
phosphate (Pi) in the chloroplast stroma which allows high ATP synthase turnover rates.
High Pi levels may also cause high levels of organic-P in the Calvin cycle, as it could
inhibit utilization of triose-P for starch synthesis (Pi is a negative effector for AGP
pyrophosphorylase), and efflux of triose-P from chloroplasts through the phosphate
translocator. We used a gas-exchange parameter “assimilatory charge” (determined from
the post-illumination CO2 uptake) as a measure of RuBP pool size (Viil et al., 1986;
Laisk et al., 2002). Figure 3.3, panels A and D, show that the rates of CO2 uptake, oxygen
evolution and assimilatory charge over the range of CO2 concentrations used are similar
between pgr5 and wild type. The small differences may be explained by variability in
plant material. Panels B and E (Fig. 3.3) describe corresponding changes in ECSt ~pmf
and proton conductivity gH+ as a response to change in levels of CO2. Proton conductivity
in the mutant under a given condition was about 2.5 times higher than in the wild type. It
is noteworthy that there was still regulation of proton conductivity in the mutant as it
increased with increasing CO2 assimilation. There was only a small change in pmf in the
81

mutant in response to CO2 change, which was reduced about 3-fold compared to wild
type.
With decreasing CO2 to low levels, the non-photochemical quenching in the
mutant increased only very slightly compared to wild type which developed a high qE.
The PQ reduction state (1-qL) was high in the mutant, and it increased even further at
low CO2 reaching 95%, while in wild type 1-qL increased only moderately at low CO2
(Fig. 3.3, panels C and F).
A possible explanation for the high ATP synthase conductance in the mutant is a
higher pool of Pi which is a substrate for the ATP synthase reaction. High levels of Pi
could occur if there is a reduction in the levels of organic-P, e.g. RuBP. The assimilatory
charge was similar in mutant and wild type, suggesting the higher ATP synthase
conductance in the mutant may not be due to high levels of Pi. However, detailed
chloroplast metabolite profiling is needed to test the high Pi hypothesis as an explanation
for high ATP synthase activity in the mutant. Another possible explanation of the high
thylakoid proton conductance in the mutant is that it has higher levels of ATP synthase
than the wild type; however, this has been tested and shown not to be the case (Avenson
et al., 2005). There is also a possibility that ATP synthase operates in a higher activity
form in the mutant compared to wild type. Different activation forms of ATP synthase
have been demonstrated in experiments with isolated thylakoids (Schwartz and
Strotmann, 1998).
Regulation of ATP synthase conductance in low Rubisco activity mutant of Nicotiana
tabacum
82

A tobacco mutant having low Rubisco activity (Rubisco small subunit antisense,
Hudson et al., 1992) with about six times reduced Rubisco content were used. A direct
Rubisco assay from freeze-clamped leaves under growth conditions gave Rubisco activity
14.8±1.7µmol/m2 s (SD, n=3) and a Rubisco activation state of 75%±3.2% compared to
wild type tobacco grown in parallel under the same conditions with activity of 85.0±4.8
µmol/m2 s (SD, n=3) and activation state of 86%±2.7% . The mutant plants grew slowly
at ambient CO2 conditions at 28oC; however, plants appeared healthy except that
chlorophyll content was reduced (158 µmol/m2) in comparison to wild type (287
µmol/m2). The specific aim of the studies with this mutant was to evaluate possible
mechanisms of regulation of ATP synthase regulation when there are restrictions on the
side of utilization of assimilatory power. One might propose there would be high ratios of
ATP/ADP and NADPH/NADP in the mutant as the capacity of Calvin cycle is reduced
relative to electron transport/ATP synthesis capacity. A high reduction state of NADP
and the electron transport chain is favorable for occurrence of the Mehler type (pseudo-
cyclic) and cyclic electron transport.
Electron transport rates were estimated independently, using fluorescence yield
for analysis of PSII and steady state A830 measurements for analysis of PSI, and
compared to CO2 assimilation rates. In addition, measurements were made of qE and 1-
qL which reflect the state of energy dissipation and state of reduction of the electron
transport chain on the acceptor side of PSII, and electrochromic shift parameters (ECSt,
and gH+) which reflect pmf and ATP synthase proton conductivity. Figure 3.4 shows
responses to changes in levels of CO2 in the Rubisco anti-sense tobacco mutant. Linear
electron transport (shown as JO2) is higher than vc+vo especially at 21% O2 (Fig. 3.4 A,
83

D). Part of this difference can be explained by dark respiration; but, it is also possible that
some Mehler type electron transport occurs. Electrochromic shift related parameters
(ECSt and gH+) and exciton quenching parameters (qE, 1-qL) were measured at two light
intensities in order to provide information on interaction between light and CO2. The
lower light intensity (240 µmol m-2s-1) was partially limiting at the higher CO2
concentrations and it is reflected in an increase in gH+ while ECSt decreases which is
accompanied by a decrease in qE. Panels B and E show clearly that gH+ is changing in
parallel with the CO2 assimilation rate (panels A, D) indicating a tight regulation of ATP
synthase activity
84
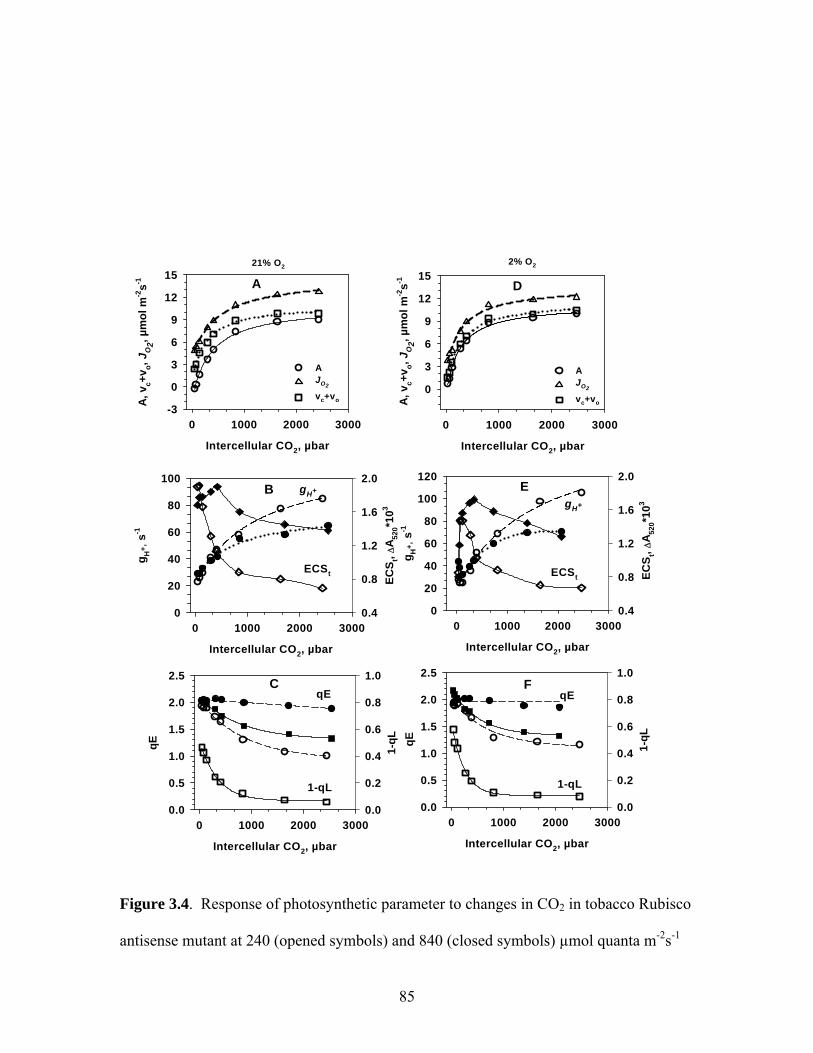
Intercellular CO2, µbar
0 1000 2000 3000
A, v
c+v o,
J O2, µ
mol
m-2
s-1
-3
0
3
6
9
12
15
AJO2
vc+vo
Intercellular CO2, µbar
0 1000 2000 3000
A, v
c+v o,
J O2, µ
mol
m-2
s-10
3
6
9
12
15
AJO2
vc+vo
Intercellular CO2, µbar
0 1000 2000 3000
g H+ ,
s-1
0
20
40
60
80
100
ECS t,
ΔA 52
0*10
3
0.4
0.8
1.2
1.6
2.0
Intercellular CO2, µbar
0 1000 2000 3000
g H+ ,
s-1
0
20
40
60
80
100
120
ECS t,
ΔA 52
0*10
3
0.4
0.8
1.2
1.6
2.0
Intercellular CO2, µbar
0 1000 2000 3000
qE
0.0
0.5
1.0
1.5
2.0
2.5
1-qL
0.0
0.2
0.4
0.6
0.8
1.0
Intercellular CO2, µbar
0 1000 2000 3000
qE
0.0
0.5
1.0
1.5
2.0
2.5
1-qL
0.0
0.2
0.4
0.6
0.8
1.0
21% O2 2% O2
gH+
gH+
ECSt ECSt
1-qL 1-qL
qE qE
A
B
C
D
E
F
Figure 3.4. Response of photosynthetic parameter to changes in CO2 in tobacco Rubisco
antisense mutant at 240 (opened symbols) and 840 (closed symbols) µmol quanta m-2s-1
85

light, 21% O2, (A, B, C) and 2% O2 (D, E, F) at 24 oC. Panels A and D represent leaf CO2
assimilation rate (A, circles), O2 evolution rate (JO2, triangles) and calculated sum of
RuBP carboxylation and oxygenation rates (vc+vo) at APFD 240 µmol m-2s-1 and two O2
concentrations (2 and 21%). Panels B and E represent thylakoid membrane proton
conductivity (gH+, circles) and pmf measured as ECSt (fast light-dark ΔA520nm), closed
symbols (APFD=840 µmol m-2s-1); opened symbols (APFD=240 µmol m-2s-1). Panels C
presents corresponding changes in PS II energy dependent exciton non-photochemical
quenching (qE) and panel F photochemical quenching constant 1-qL which describes
relative reduction state of the plastoquinone pool in thylakoid membrane.
In order to evaluate the possibility that cyclic electron flow may be involved in
energy dissipation, the data from Fig. 3.4 were plotted as linear electron flux (represented
as JO2) versus proton flux (vH+= ECSt*gH
+) (Fig. 3.5). The proton flux units are arbitrary.
Under 21% O2 and high light there is an increase in proton flux relative to PSII activity
(Fig. 3.5B), which suggests some activation of proton pumping via cyclic electron flow.
The same parameters measured at light limited conditions (panel C and D) reveal a
relatively good linear fit that suggests deviation from 2% and 21% under high light may
in fact reflect some cyclic electron transport activity. The replicate experiment gave the
same result.
86

JO2, µmol m-2s-1
0 3 6 9 12 15
v H+
0
20
40
60
80
100
2% O2
21% O2
JO2, µmol m-2s-1
0 3 6 9 12 15
v H+
0
20
40
60
80
100
2% O2
21% O2
APFD, µmol m-2s-1
0 200 400 600 800 1000
A, J
O2, µ
mol
m-2
s-1
0
3
6
9
12
15
18
JO2, µmol m-2s-1
0 5 10 15 20
v H+
0
20
40
60
80
2% O2
21% O2
A B
C D
APFD=240 APFD=840
Figure 3.5. Relationship between linear electron transport rates (expressed as gross rates
of oxygen evolution rate JO2) relative to proton efflux rate vH+ (arbitrary values) at two
light intensities 240 (panel A) and 840 µmol m-2s-1 (panel B) and two oxygen
concentrations 2 and 21% (data from figure 3, vH+= ECSt*gH
+). Panel C represents light
response curve of leaf CO2 assimilation rates at 2800 µbar CO2 and 2% O2 (circles) with
corresponding O2 evolution rates (from fluorescence yield measurements). Panel D
describes relationship between electron flux (JO2 = 4 e-) and proton flux vH+ (arbitrary
units).
87

Intercellular CO2, µbar
0 1000 2000 3000 4000 5000 6000
A, v
c+v o,
JO
2, JPS
1/4, µ
mol
m-2
s-1
0
5
10
15
20
Avc+vo
JO2
JPS1/4
Figure 3.6. CO2 response of tobacco Rubisco anti-sense mutant photosynthetic
parameters at 380 µmol m-2s-1 APFD, 21% O2 and 23oC. The figure compares CO2
assimilation rate (A, circles), calculated sum of RuBP carboxylation and oxygenation
rates vc+ vo (squares), O2 evolution rate, JO2 (triangles) and the rate of PS I turnover per 4
electrons (JPS1, diamonds).
In order to further test possible increases in cyclic relative to linear electron
transport activity in the low Rubisco activity mutant, PS I electron transport rates were
calculated by measuring steady state changes in the A830 signal as described in the
Methods section. Elevated PS I electron transport activity relative to linear electron
88

transport appears to occur (Fig. 3.6), especially on the shoulder region of the A/Ci curve.
The method for measuring PS I flux has known difficulties to reliably reflect the true
absolute quantum efficiencies of PSI (reviewed in Baker et al., 2007); so, the reliability
of the results may be questioned. However, from the results in Fig. 3.6, together with the
experiment showing extra proton flux relative to PSII activity at 21% O2 compared to 2%
(Fig. 3.5), we consider this as evidence for occurrence of PS I cyclic
photophosphorylation in the Rubisco antisense mutant under 21% O2.
The PS I acceptor side reduction was small (3 – 5% of total centers) over most
part of the CO2 response curve; but, it increased sharply at low CO2 and O2
concentrations when light was saturating and JO2 fell below 5 µmol m-2s-1 (data not
shown). This situation was accompanied by a decrease in ECSt signal ( Fig. 3.4 E). It has
been shown that the decrease in ECSt under these conditions is not a reflection of
decreased pmf; rather there is increased partitioning from the electrical to the ΔpH
component of pmf (ECSt reflects electrical component only). Since under these
conditions the electron transport chain becomes highly reduced (indicated by high 1-qL
in Fig. 3.4 F), it can be considered as evidence of an additional mechanism for achieving
qE without an increase in the total pmf under stressful conditions (Cruz et al, 2004).
In the Rubisco antisense mutant, ATP synthase conductance (measured as gH+)
follows essentially the same pattern as in wild type tobacco and C4 plants (Ch. 1, 2), that
is decreasing as CO2 assimilation becomes reduced. The relationship between Calvin
cycle activity (vc+vo) and gH+ was close to a linear relationship (not shown). It shows
tight regulation of ATP synthase activity with Rubisco activity which is the major use of
assimilatory power. Rubisco activity appears to be a major factor for regulating steady
89

state ΔpH and qE, while the contribution from CET and the Mehler reaction appears
small. A low level of Mehler reaction activity in this Rubisco antisense mutant has also
been demonstrated by Ruuska et al. (2000).
CO2 pressure, Ca, µbar
0 500 1000 1500 2000 2500
Leaf
RuB
P co
nten
t, µm
ol m
-2
0
40
80
120
160
Figure 3.7. RuBP content in leaves of the Rubisco anti-sense mutant of tobacco as a
function of the CO2 partial pressure on the leaf surface (Ca). RuBP was measured from
freeze clamped leaves using 14C incorporation method with purified Rubisco (according
to Wirtz et al., 1980). O2 concentration was 2%, leaf temperature was 24 oC.
ATP synthase can be regulated by Pi level in the chloroplast stroma. When
capacity of Rubisco is limiting, there is potential for a high ΔG for the ATP synthesis
reaction.
The RuBP content in the mutant at light saturation (Fig. 3.7) was measured to test
for Pi involvement in ATP synthase regulation. The RuBP concentration decreases with
increasing CO2 concentration. The decrease in RuBP with increasing CO2 may result in
90

an incr se in
low
Rubisco mutant of tobacco, provides further evidence that regulation of ATP synthase
conductance has a key role in photoprotection and dissipation of excess energy.
t
N, Harbinson J, Kramer DM (2007) determining the limitations and regulation
hip between steady state gas
ards GE, Kramer DM (2005)
ea the Pi pool, which could explain increased ATP synthase proton
conductance in Fig. 3.4.
In this chapter, a mutant of Arabidopsis which affects CEF, and a
REFERENCES
Avenson TJ, Kanazawa A, Cruz JA, Kramer DM (2005) Regulating the proton budge
of higher plant photosynthesis. PNAS 102: 9709-9713.
Baker
of photosynthetic energy transduction in leaves. Plant, Cell and Environment 30: 1107-
1125.
Bunney, TD, van Walraven HS, de Boer AH (2001) 14-3-3 protein is a regulator of
the mitochondrial and chloroplast ATP synthase. PNAS 98: 4249-54.
von Caemmerer, S, Edmondson D (1986) The relations
exchange in vivo, RuP2 carboxylase activity and some carbon cycle intermediates in
Rhaphanus sativus. Aust. J. Plant Physiol. 13: 669-688.
Cruz JA, Avenson TJ, Kanazawa A, Takizawa K, Edw
Plasticity in light reactions of photosynthesis for energy production and photoprotection.
Journal of Experimental Botany 56: 395-406.
91
Demmig-Adams, B, Adams-III WW (1996) The role of xanthophyll cycle carotenoid
in the protection of photosynthesis. Trends Plant Sci. 1: 21-26.
s
er NR (1989) The relationship between the quantum yield of
)
.
a A, Kramer DM (2002) In vivo modulation of nonphotochemical exciton
(1994) An improved method, using saturating light pulses,
ges at
dwards GE (2004a) New fluorescence
parameters for the determination of QA redox state and excitation energy fluxes.
Photosynthesis Research 79: 209-218.
Evron Y, Johnson EA and McCarty RE (2000) Regulation of proton flow and ATP
synthesis in chloroplasts. Journal of Bioenergetics and Biomembranes 32: 501-506.
Genty B, Briantis JM, Bak
photosynthetic electron transport and quenching of chlorophyll fluorescence. Biochim.
Biophys. Acta 990: 87-92.
Horton P, Ruban A, Walters R (1996) Regulation of light harvesting in green plants,
Annu. Rev. Plant Physiol. Plant Mol. Biol. 47: 655-684.
Heber, U., and Walker, D. (1992) Concerning a dual function of coupled cyclic electron
transport in leaves. Photosynthesis Research 27: 169-178.
Hudson GS, Evans JR, von Caemmerer S, Arvidsson YBC, and Andrews TJ (1992
Reduction of ribulose-1,5-bisphosphate carboxylase/oxygenase content by antisense
RNA reduces photosynthesis in transgenic tobacco plants. Plant Physiol. 98: 294-302
Kanazaw
quenching (NPQ) by regulation of the chloroplast ATP synthase. PNAS 99: 12789–
12794.
Klughammer C, Schreiber U
for the determination of photosystem I quantum yield via P700+ absorbance chan
830 nm. Planta 192: 261-268.
Kramer DM, Johnson G, Kiirats O, E
92

Kramer DM, Sacksteder CA (1998) A diffused-optics flash kinetic spectrophotometer
(DOFS) for measurements of absorbance changes in intact plants in the steady-state.
Photosynthesis Research 56: 103-112.
Laisk A, Oja V (1998) Dynamics of leaf photosynthesis. CSIRO Publishing, Australia,
160 pp.
Laisk A, Oja V, Rasulov B, Ramma H, Eichelmann H, Kasparova I, Pettai H, Padu
E, Vapaavuori E (2002) A computer-operated routine of gas exchange and optical
measurements to diagnose photosynthetic apparatus in leaves. Plant Cell and
Environment 25: 923-943.
Miyake C, Miyta M, Shinzaki Y, Tomizawa K-I (2005) CO2 response of cyclic
electron flow around PSI (CEF-PSI) in tobacco leaves – Relative electron fluxes through
PSI and PSII determine the magnitude of non-photochemical quenching (NPQ) of Chl
fluorescence. Plant Cell Physiol 46: 629-637.
Munekage, Y, Hashimoto, M, Miyake, C, Tomizawa, K, Endo, T, Tasaka, M, and
Shikanai, T (2004) Cyclic electron flow around photosystem I is essential for
photosynthesis. Nature 429: 579-82.
Munekage Y, Hojo M, Meurer J, Endo T, Tasaka M, and Shikanai T (2002) PGR5 is
involved in cyclic electron flow around photosystem I and is essential for photoprotection
in Arabidopsis. Cell 110: 361-71.
Nandha B, Finazzi G, Joliot P, Hald S, Johnson G (2007) The role of PGR5 in the
redox poising of photosynthetic electron transport. Biochim. Biophys. Acta 1767: 1252-
1259.
93

Ott T, Clarke J, Birks K, Johnson G (1999) Regulation of the photosynthetic electron
transport chain. Planta 209: 250-258.
Porra RJ, Thompson WA, Kriedemann PE (1989) Determination of accurate
extinction coefficients and simultaneous equations for assaying chlorophyll a and b with
four different solvents: verifications of the concentrations of chlorophyll standards by
atomic absorption spectroscopy. Biochim. Biophys. Acta 975: 384-394.
Ruuska S, Badger M, Andrews T, von Caemmerer S (2000) Photosynthetic electron
sinks in transgenic tobacco with reduced amounts of Rubisco: little evidence for
significant Mehler reaction. J. Exp. Bot. 51: 357-368
Sacksteder CA, Jacoby ME, Kramer DM (2001) A portable, non-focusing optics
spectrometer (NOFOSpec) for measurements of steady-state absorbance changes in intact
plants. Photosynthesis Reseaech 70: 231-240.
Schwarz O, Strotmann H (1998) Control of chloroplast ATP synthase (CFoCF1)
activity by ΔpH. Photosynthsis Research 57: 287-295.
Viil JA, Ivanov KN and Pärnik TR (1986) Determination of ribulose-1,5-bisphosphate
concentration in the leaf from post-illumination CO2 fixation. Fiziologia Rastenii 33: 29-
34 (In Russian).
Wirtz W, Stitt M, Heldt HW (1980) Enzymic determination of metabolites in the
subcellular compartments of spinach protoplasts. Plant Physiology 66: 187-193.
94

APPENDIX
Other research contributions during Ph.D. studies
1. Kramer DM, G Johnson, O Kiirats and GE Edwards (2004) New fluorescence
parameters for the determination of QA redox status and excitation energy fluxes.
Photosynthesis Research 79:209-218.
I contributed the experimental work in the paper and to discussions involving
development of a new parameter for analyzing the reductive state of photosystem II by
chlorophyll fluorescence.
2. Voznesenskaya EV, SDX Chuong, O Kiirats, VR Franceschi, GE Edwards (2005)
Evidence that C4 species in genus Stipagrostis, family Poaceae, is NADP-malic enzyme
subtype with nonclassical type of Kranz anatomy (Stipagrostoid). Plant Science 168: 731-
739.
I contributed to discovery of a new photosynthetic form of C4 in family Poaceae
through enzymatic analysis of photosynthetic enzymes.
3. Boyd, CN, VR Franceschi, SDX Chuong, H Akhani, O Kiirats, M Smith and GE
Edwards (2007) Flowers of Bienertia cycloptera and Suaeda aralocaspica
(Chenopodiaceae) complete the life cycle performing single-cell C4 photosynthesis.
95

Special Issue in Memory of Vincent R. Franceschi. Functional Plant Biology 34: 268-
281.
I contributed to demonstration of single-cell C4 photosynthesis in flowers of two
chenopod species through assay of 14CO2 fixation.
4. Sickler, CM, GE Edwards, O Kiirats, Z Gao and W Loescher (2007) Response of
mannitol-producing Arabidopsis thaliana to abiotic stress. Special Issue in Memory of
Vincent R. Franceschi. Functional Plant Biology 34: 382-391.
I contributed to the understanding of mechanism of tolerance to salinity in
Arabidopsis plants transformed to produce mannitol by analysis of rates of
photosynthesis and stomatal conductance.
5. Maricle, BR, RW Lee, CE Hellquist, O Kiirats, GE Edwards (2007) Effects of
salinity on chlorophyll fluorescence and CO2 fixation in C4 estuarine grasses.
Photosynthetica 45: 433-440.
I contributed to a study of salinity tolerance in C4 estuarine grasses by
collaborating on analyses of photochemistry by chlorophyll fluorescence, and CO2
exchange.
6. Edwards, GE, E Voznesenskaya, M Smith, N Koteyeva, Y Park, J-H Park, O
Kiirats, TW Okita and SDX Chuong (2007) Breaking the Kranz paradigm in terrestrial
C4 plants: Does it hold promise for C4 rice? In: Charting New Pathways to C4 Rice.
96
(Sheehy JE, Mitchell PL and Hardy B, editors). International Rice Research Institute,
Makati City, Philippines, pp.249-273.
I contributed to studies on the mechanism of single-cell C4 photosynthesis by
analyzing the diffusive resistance which is required to minimize CO2 leakage in the C4
cycle.
7. Voznesenskaya, EV, H Akhani, NK Koteyeva, SDX Chuong, EH Roalson, O
Kiirats, VR Franceschi and GE Edwards (2008) Structural, biochemical and
physiological characterization of photosynthesis in C3 and C4 species of the genus
Tecticornia (family Chenopodiaceae) and a phylogenetic placement of the photosynthetic
types. Journal of Experimental Botany Special Issue on CAM and C4 photosynthesis 59:
1715-1734.
I contributed to understanding the mechanism of C4 photosynthesis in subfamily
Salicornioideae by collaborations and gas exchange analyses.
97