Embed Size (px)
Citation preview
CO-PRODUCING THE NATURE-BASED ADVENTURE TOURISM EXPERIENCE:
TOURIST, ENVIRONMENT AND MANAGEMENT CONTRIBUTIONS
BY
XIAOJUAN YU
DISSERTATION
Submitted in partial fulfillment of the requirements for the degree of Doctor of Philosophy in Recreation, Sport and Tourism
in the Graduate College of the University of Illinois at Urbana-Champaign, 2012
Urbana, Illinois
Doctoral Committee:
Associate Professor Lynn A. Barnett Morris, Chair Associate Professor Zvi Schwartz, Director of Research, Virginia Tech Professor William P. Stewart Associate Professor Assata Zerai
ii
ABSTRACT
This dissertation research explored factors and processes that influence tourists’
experience and satisfaction, guided by the view that the tourist experience and satisfaction is co-
produced by tourist, environment, and management. A review of the satisfaction research in
marketing, tourism, and recreation found that the existing satisfaction models were based on the
performance of product or service or destination attributes, which are managerial or
environmental determinants. This research proposed and empirically tested three models of
satisfaction and examined the role of the tourist in the context of nature-based adventure tourism
and recreation.
First, the Norm Disturbance Model proposed that visitors compare their perceptions of
backcountry conditions to their backcountry recreation norms. The comparison results in a sense
of disturbance, which in turn influences satisfaction. This model synthesized research on the
influences of different backcountry conditions that have been separately addressed in the outdoor
recreation literature, including environmental impacts, social encounters (crowding), and diverse
activities. Further, tourist trip motives were modeled as moderators of the impact of these
conditions on tourist experience.
Second, the Basic Psychological Needs Expression Model proposed that tourist trip
motives influence satisfaction depending on whether the motives express the basic psychological
needs specified in Self-Determination Theory. This model added to the literature on tourist
motivation and satisfaction by providing a theoretical explanation for their relationship.
Third, the Risk-Competence Balance Model proposed that how tourists combine their
risk taking tendency and their competence, (1) at the motivational level, and (2) as objectively
assessed, influence the attainment of optimal experience and then satisfaction.
iii
These three models were empirically tested in one multiple regression model using a
dataset from the Grand Canyon Backcountry Visitor Study (N = 1021) and were generally
supported by the results. The research thus broadened the theoretical understanding of the factors
and processes that influence tourist experience and satisfaction, and clarified the role of the
tourist therein. The practical implications are that satisfactory experience may be co-produced by
tourists and tourism managers (1) by eliminating disturbances in the tourism environment, (2) by
encouraging tourist motives that express the basic psychological needs, and (3) by optimally
combining situational risks and tourist competence.
iv
To My Father and Mother,
My Sister and Brother
v
ACKNOWLEDGEMENTS
This research project would not have been possible without the support of many people.
Many thanks to my advisor, Zvi Schwartz, who read my numerous revisions and helped me
evolve through the dissertation process into a more matured researcher. Also thanks to my
committee members, Lynn Barnett Morris, William Stewart, and Assata Zerai, who offered me
invaluable guidance and support. Further thanks to William Stewart, who generously allowed me
to use the dataset from the Grand Canyon Backcountry Visitor Study. Thanks to my many
friends at the University of Illinois and elsewhere, who shared my ups and downs. And finally,
thanks to my parents, my sister and brother, who endured this long process with me, always
offering unconditional love and support.
vi
TABLE OF CONTENTS
CHAPTER 1: INTRODUCTION: CO-PRODUCING THE NATURE-BASED ADVENTURE
TOURISM EXPERIENCE ............................................................................................................. 1
CHAPTER 2: DISTURBANCES IN THE BACKCOUNTRY AND TOURIST
SATISFACTION .......................................................................................................................... 14
CHAPTER 3: TOURIST MOTIVES AND SATISFACTION .................................................... 25
CHAPTER 4: RISK TAKING, COMPETENCE, AND TOURIST SATISFACTION ............... 43
CHAPTER 5: METHOD .............................................................................................................. 54
CHAPTER 6: RESULTS .............................................................................................................. 66
CHAPTER 7: DISCUSSION AND CONCLUSION ................................................................... 71
FIGURES AND TABLES ............................................................................................................ 82
REFERENCES ............................................................................................................................. 96
APPENDIX A: SUMMARY TABLES FOR LITERATURE REVIEW ................................... 106
APPENDIX B: FIGURES FOR DATA ANALYSIS ................................................................. 116
1
CHAPTER 1
INTRODUCTION: CO-PRODUCING THE NATURE-BASED ADVENTURE TOURISM
EXPERIENCE
This dissertation research explored factors and processes that influence tourists’
experience and satisfaction in the context of nature-based adventure tourism and recreation, and
more specifically for backcountry backpackers. The research was guided by the view that the
tourist experience and satisfaction is co-produced by tourist, environment, and management. The
concept of co-production and the importance of tourists themselves in producing satisfactory
experience have been recognized in the recreation and tourism field in particular (Brown, 1988;
Ellis and Rossman, 2008), and in service management and marketing in general (Zeithaml and
Bitner, 2003). However, research attention so far has largely been focused on management
determinants and environmental determinants that are manageable. For example, in the endeavor
to identify and formulate indicators that help define the quality of outdoor recreation experience,
one criterion for “good” indicators is that they should be manageable (Manning, 2011). In other
words, they should respond to, and reflect, the effectiveness of management actions. While this
general focus on manageable determinants has produced actionable frameworks and standards
for outdoor recreation management, there is a relative lack of understanding of how the tourist
contributes to this co-production.
This study addressed this question: How do tourists contribute to a satisfactory
experience in addition to, and in interaction with, environment and management determinants?
The question is approached in the following steps. First, alternative models of satisfaction in both
the marketing and tourism/recreation field are briefly reviewed. These models are found to be
2
formulated around product/service performance (Oliver, 2010), i.e., a focus on management
determinants. The Expectancy Disconfirmation Model, which is the most popular one, is used
here as an example for comparison purposes and is shown in Figure 1.1 (all figures and tables are
presented at the end of text, starting from page 81).
Second, three additional models of tourist experience and satisfaction are proposed based
on research and theories in outdoor recreation and psychology. They are the Norm Disturbance
Model, the Basic Psychological Needs Expression Model, and the Challenges-Skills Balance
Model (and its adaption to the adventure setting: the Risk-Competence Balance Model) as shown
in Figure 1.1. These theoretical models are briefly introduced in this Chapter in comparison to
the Expectancy Disconfirmation Model, and are fully elaborated in Chapters 2 to 4, respectively.
Third, the empirical tests of this study use an existing dataset from the Grand Canyon
Backcountry Visitor Study (Stewart, McDonald and Schwartz, 2003), presented in Chapter 5.
The tested models are slightly different from the theoretical models for two reasons. One is
theoretical (the Basic Psychological Needs Expression Model), which will be explained later.
The other is due to unavailability of measures in the dataset for some constructs (the other two
models), which is a limitation of this study. Despite the absence of these constructs, the tested
models are still deemed appropriate and their empirical test will add to the understanding of
tourist experience and satisfaction.
Fourth, the results from the empirical test are presented in Chapter 6. Lastly, Chapter 7
discusses the theoretical and empirical contribution, implications, and limitations of this study, as
well as directions for future research.
3
1.1 EXISTING MODELS OF SATISFACTION
This study examined the co-production of tourists’ experience, and satisfaction was used
as a proxy of the quality of experience. Satisfaction is important for both consumers and product
or service providers (Oliver, 2010). For consumers, satisfaction is a self-evident pursuit or goal
to be obtained from using products or patronizing services. For providers, satisfaction has both
short-term effects and long-term impacts. In the short term, satisfaction may lead to
complementary and positive word of mouth, while dissatisfaction may lead to complaining,
negative word of mouth, third-party action, and subterfuge. In the long term, satisfaction is
important for customer loyalty and ultimately the profitability of a business. In tourism, studies
have repeatedly found satisfaction to be related to positive behavioral intention, including
intentions to revisit the destination and to recommend it to others, and destination loyalty (see
Table A1 in Appendix A, for a review of tourist studies that examined the consequences of
satisfaction).
The importance of satisfaction for both tourists and tourism businesses and destinations
motivates further research on determinants of satisfaction. The literature on satisfaction in
marketing and in tourism and recreation is first briefly summarized here as a review of the
current status of knowledge. Oliver (2010) provides the most comprehensive and updated
presentation of the state of art of consumer satisfaction research, and therefore is used as a basis
for the review. As defined by Oliver (2010):
Satisfaction is the consumer’s fulfillment response. It is a judgment that a product/service
feature, or the product or service itself, provided (or is providing) a pleasurable level of
consumption related fulfillment, including levels of under- or overfulfillment (p. 8).
4
While this definition may seem too simplistic in defining satisfaction as a response and a
judgment, researchers have proposed that satisfaction is a complex phenomenon that has both
cognitive and affective elements (Oliver, 2010). However, it is not in the scope of this study to
further discuss the definition of satisfaction. Rather, what is important to note here is the focus of
this definition of satisfaction on product and service, which will be explained in the following.
One most widely used model for understanding satisfaction is the Expectancy
Disconfirmation Model (Oliver, 2010), which is shown in Figure 1.1. This model is an
improvement on the traditional Performance-only Model that explains satisfaction as a function
of the perceived performance of a list of product or service attributes (e.g., Rivera and Croes,
2010). The Performance-only Model fails in a scenario where two tourists receive identical
performance, yet respond in completely opposite ways, because they have different prior
expectations regarding the performance. Expectation is thus a key ingredient in the satisfaction
response, playing the role of a standard or a referent against which performance is evaluated. The
discrepancy between performance and expectation then forms a disconfirmation judgment,
which is a distinct cognition from these two preceding variables. Disconfirmation could be
positive (performance is better than expected), negative (performance is worse than expected), or
zero (performance meets expectation). Disconfirmation then leads to the satisfaction response.
There are complexities that may be added to the Expectancy Disconfirmation Model.
First, multiple expectation referents may be used in evaluating performance (Oliver, 2010).
These expectation referents are categorized by different levels of desire: ideal, excellence,
desired, deserved, needed, adequate, minimum tolerable, and intolerable. In looking for the “best”
of the expectation-based comparative referent for performance evaluation, it is observed that
predictive expectation is the most representative of what a consumer desires (Oliver, 2010).
5
Second, consumers may selectively use combinations of performance, expectation, and
disconfirmation in making satisfaction judgments depending on the context (Oliver, 2010). That
is, the satisfaction response may be formed by processing (1) one and only one of the three
variables; (2) any two variables among the three; (3) and all three variables. One example is the
Performance-only Model discussed earlier. These model variations are discussed in Oliver
(2010).
Besides the Expectancy Disconfirmation Model, research has been conducted on other
comparison operations that may influence satisfaction, which are also discussed in Oliver (2010).
All of these comparison operations are made with regard to product or service performance.
Specifically, need fulfillment is a comparison of performance to needs. The judgment of quality
is a comparison of performance to technical standards, or to excellence standards. The value
judgment is a comparison of benefits to costs, or, performance to sacrifices. The equity/inequity
judgment is a comparison of performance to what is deemed a fair outcome. Regret is a
comparison of obtained outcome to what might have been. All of these comparison-based
cognitions, i.e., need fulfillment, quality, value, equity, and regret, may play a role in satisfaction
response in addition to expectancy disconfirmation (Oliver, 2010). Further, these cognitions may
give rise to emotions and affects that in turn influence satisfaction (Oliver, 2010).
Many of these cognitive and affective antecedents to satisfaction have been studied in
tourism. A review of tourist studies that model the determinants and consequences of satisfaction
is provided in Table A1 in Appendix A. As summarized in Table A2 in the Appendix,
expectation, performance, disconfirmation, value, quality, along with destination image, are the
more widely modeled antecedents of tourist satisfaction.

6
1.2 DEVELOPING FURTHER RESEARCH ON TOURIST EXPERIENCE AND
SATISFACTION
Three observations are made of the existing models of satisfaction, based on which
general directions for further research and specific contributions of this study are discussed.
First, satisfaction, as a fulfillment response, is a multi-dimensional phenomenon (Oliver,
2010). Multiple cognitive and affective factors may play a role in this summary judgment. These
factors do not function mutually exclusively, and may be selectively and simultaneously used in
forming a satisfaction judgment. Arguably, research conducted so far, both in marketing in
general and in the tourism and recreation field, cannot be said to have exhausted all the possible
factors that work in the tourist experience and lead to the satisfaction response. Exploration of
other potential factors and processes is thus pursued in this dissertation research.
Second, the existing satisfaction models as reviewed above are product or service
attribute performance-based in a consumption context. Product or service performance is the
target of evaluation in the judgment of disconfirmation, need fulfillment, quality, value, equity,
and regret. These cognitions and related affects then influence satisfaction. A review of
tourist/recreationist satisfaction studies also shows a focus on attribute performance. These
studies are presented in Table A3 in Appendix A. These studies examine only the antecedents of
satisfaction, and thus are presented separately from studies cited in Table A1, which also
examine its consequences in structural models. Five general approaches are identified in these
studies, in which the following are examined: (1) tourist preferences for destination attributes; (2)
tourist satisfaction with attributes performance; (3) the discrepancy between attribute
performance and expectation (ideal or predicted); (4) attribute importance-performance or
importance-satisfaction analysis; and (5) tourist overall satisfaction as a function of attribute
7
performance disconfirmation, or attribute satisfaction. Some of the approaches have already been
criticized for their weaknesses (Oliver, 2010) and are not discussed here. For the purpose of this
study, it is noted that these approaches all focus on attribute performance.
The question from this observation is: Why should we focus only on the performance of
product and service? How about the other end of the transaction: the consumers or the tourists?
Can their “performance” contribute to satisfaction as well? Researchers have proposed the
concept of co-production or co-creation of experience and satisfaction (Brown, 1988; Ellis and
Rossman, 2008; Zeithaml and Bitner, 2003). Yet the role of consumers in the co-production
process has not been well understood beyond responding to product or service performance. This
study proposes three specific models that contribute to the operationalization of the co-
production concept and the understanding of tourist roles in the tourism experience and
satisfaction.
The third observation of existing satisfaction models is helpful in building the three new
models. The key concept in satisfaction is fulfillment, and the key question is: “fulfillment of
what?” Answers to this question, as shown in the Expectancy Disconfirmation Model and other
models, involve comparison mechanisms. Product or service performance is compared to—or is
assessed in terms of the degree to which it fulfills—what is expected, what is needed, what is
best in the market, what is sacrificed, what is fair, or what might have been. Following this line
of thought, what are tourists themselves “fulfilling” in their experience? What are the
comparison standards or references in evaluating tourist “performance”? How do the
corresponding comparison mechanisms work?
To answer these questions, two tourist-centered (versus product or service performance-
centered) models of satisfaction are proposed, one based on Self-Determination Theory (Deci

8
and Ryan, 1985, 2000, 2002) and the other on Flow Theory (Csikszentmihalyi and colleagues,
1975, 1988, 1990). One additional performance-based model is also proposed that is more
specific to the outdoor recreation context. Taken together, the three models will provide a more
comprehensive understanding of tourist satisfaction in nature-based adventure tourism. The
following three sections briefly introduce the three models in comparison to the Expectancy
Disconfirmation Model. The comparison may be one of oranges versus apples, but it is deemed
helpful in illustrating the structure of the newly proposed models.
1.3 THE NORM DISTURBANCE MODEL OF SATISFACTION
The first proposed model is the Norm Disturbance Model of Satisfaction as shown in
Figure 1.1. It is the one that most resembles the Expectancy Disconfirmation Model and adapts
to the outdoor recreation or nature-based tourism context. In this model, outdoor recreation
norms are analogous to the various kinds of expectations acting as the referent in a comparison
mechanism that leads to the satisfaction response. The norms concept takes into account the
normative approach to the development of indicators and standards of quality in outdoor
recreation (Manning, 2011). The backcountry conditions are analogous to the product or service
performance, but differ in that the relevant conditions in the backcountry context, including
environmental degradation, crowding, and recreation conflict (Manning, 2011), usually have a
negative valence. Therefore, when the perceived conditions are compared to the norms, a
disturbance perception follows, which resembles disconfirmation but may only have zero or
negative valences. Disturbance then leads to satisfaction, or more accurately, dissatisfaction.
Like the Expectancy Disconfirmation Model, it may be possible that any combination of norms,

9
conditions, and disturbance may be used in forming a satisfaction response in a specific context
for a particular tourist, which must be found in empirical research.
This study further explores the role of tourist motives in this model. Tourist motives may
influence norms for backcountry conditions (Manning, 2011). For example, backcountry visitors
who have a stronger motive for solitude may have a higher standard for social encounters and be
more sensitive to crowding and recreation conflicts in the backcountry. Thus, when facing the
same situation, they may feel more disturbed than those who have a weaker solitude motive. In
other words, the motive moderates the relationship between perceived condition and felt
disturbance through its influence on the norm used as a comparative referent for perceived
condition. This study will empirically test this moderation effect. Due to the unavailability of the
norms measurement in the dataset used in this study, the role of norms is not directly tested.
According to the Norms Disturbance model, the norms have an indirect effect on satisfaction that
is incorporated in the disturbance variable. It is also possible that norms may have a direct effect
on satisfaction, which is not discussed in this study.
Further, trip motives are proposed to have a moderating effect on the relationship
between felt disturbance and satisfaction. For example, for tourists with a stronger motive for
solitude, the disturbance caused by crowding and diverse activities may play a larger role in
determining their satisfaction. This model is elaborated in Chapter 2.
1.4 THE BASIC PSYCHOLOGICAL NEEDS EXPRESSION MODEL OF SATISFACTION
The second proposed model is the Basic Psychological Needs Expression Model as
shown in Figure 1.1. The model is proposed based on the basic psychological needs concept in
the Self-Determination Theory (Deci and Ryan, 1985, 2000, 2002). The basic psychological
10
needs are autonomy, competence, and social relatedness, which are specified based on empirical
research on motivation. The satisfaction of these needs is supposed to be essential for
psychological well-being and optimal development. The proposed model here tests its
applicability in the tourism and recreation context. Specifically, in the proposed model, the basic
psychological needs are the comparison referents for tourist trip motivation. The better the trip
motives express the basic psychological needs, the more satisfying the trip should be.
This model is different from the Expectancy Disconfirmation Model and other existing
models of satisfaction discussed earlier. These latter models examine the psychological processes
that consumers use to make satisfaction judgments. Empirically, consumers may be asked to
report their cognition regarding each of the variables (e.g., expectations, performance,
disconfirmation, and satisfaction) involved in these models. A lack of cognition of any of these
variables would suggest its exclusion from the corresponding model because it is not processed
in the satisfaction judgment, at least not on a conscious level. In contrast, the model proposed
here differs in terms of the basic psychological needs, whose essentialness is theorized by
researchers (Deci and Ryan, 1985, 2000, 2002), rather than recognized by each individual tourist
(hence the dotted representation in this model in Figure 1.1). This model thus incorporates the
possibility that the satisfaction response may be influenced by some process that is not
cognitively recognized by respondents. On the other hand, the specific model proposed here is
valid only to the extent that the concept of basic psychological needs is valid, which will be
elaborated in Chapter 3.
As the concept of basic psychological needs and their level of expression are not
cognitively processed by tourists, the empirically tested model includes only two components of
the theoretical model, i.e., trip motives and satisfaction. It is then the task of the researcher to
11
compare each of the tourist trip motives to the basic psychological needs and determine whether
the former expresses the latter.
1.5 THE CHALLENGES-SKILLS BALANCE MODEL
The third proposed model is the Challenges-Skills Balance Model as shown in Figure 1.1.
In this model, the situational challenges that face a tourist have to be met by comparable skills at
a personal high level to produce optimal experience, i.e., flow, based on the Flow Theory by
Csikszentmihalyi and colleagues (1975, 1988, 1990). Optimal experience is then proposed to be
factored into satisfaction as a summary psychological state. Flow Theory has been adapted to the
outdoor adventure context by Priest and colleagues (1986, 1987, 1993, 1993) in the Adventure
Experience Paradigm. In this paradigm, peak adventure is produced by the balance between risk
and competence, replacing the challenges and skills variables, respectively. This paradigm is
presented in Figure 1.1 as the Risk-Competence Balance Model. The two balance models will be
elaborated in Chapter 4.
In comparison to the Expectancy Disconfirmation Model and the Norm Disturbance
Model, the “performer” under evaluation in the last two proposed models is changed from
product or service or backcountry conditions to the tourist. In the Expectancy Disconfirmation
Model, products or services have to meet or exceed the expectations of consumers so as to
produce positive disconfirmation and satisfaction. In the Norm Disturbance Model, backcountry
conditions have to conform to visitor norms to avoid disturbance and dissatisfaction. In
comparison, in the Basic Psychological Needs Expression Model, tourists have to establish trip
motives or goals that are expressive of the three basic psychological needs. In the Challenges-
12
Skills Balance Model, tourists have to take a personally high level of challenges which is
adequately met by their skills.
Due to the unavailability of measures of optimal adventure in the dataset used in this
study, this construct is dropped from the empirical test of the Risk-Competence Balance Model.
The effect of the balance of risk and competence on satisfaction as a summary fulfillment
response is proposed to be existent without the mediation of optimal adventure experience.
1.6 CONTRIBUTION OF THIS STUDY
In summary, this study contributes to satisfaction research by first proposing three
theoretical models: the Norm Disturbance Model for a backcountry context, the Basic
Psychological Needs Expression Model, and the Challenges-Skills Balance Model (and its
variant in adventure tourism and recreation context: Risk-Competence Balance Model); and then
by empirically testing three modified models with an available dataset.
Similar to the first observation of satisfaction research, these models or mechanisms are
probably not exclusive to each other, and the proposed models are not supposed to replace
existing models. Rather, they may all function in tourist experience and contribute to satisfaction.
Taken together, the models will increase the understanding of the co-production of tourist
experience and satisfaction.
The concept of co-production is used in this study in a very general and broad sense,
through which the tourist is introduced as an active co-producer of tourism experience and
satisfaction along with management and environmental determinants. Hence this study on how
the three parties co-produce the tourist experience and satisfaction is only at the exploratory
stage of research. There are generally two ways in which tourist, management and environmental
13
factors may take part in the co-production process. One way is that the factors act side by side,
without interfering or interacting with each other. For example, in the Basic Psychological Needs
Expression Model, tourist trip motives were proposed to influence tourists’ experience and
satisfaction individually. The other way is that the factors may combine or interact with each
other in the co-production of the tourist experience. For example, in the Motives-Moderated
Norm Disturbance Model, it was proposed that tourists’ motives moderate the influence of
backcountry conditions on tourists’ experience. The explication of these models and their
empirical tests in the following chapters will illustrate the conceptualization of the co-production
process in more details.
14
CHAPTER 2
DISTURBANCES IN THE BACKCOUNTRY AND TOURIST SATISFACTION
The rapidly expanding recreational use of natural areas in the post-World War II period
brought attention to its impact on the natural and social environment. This concern persisted into
the present day as tens of millions of visitors hike, backpack, camp, and participate in other
activities in the wilderness every year in the United States (National Sporting Goods Association,
2012).The effort to determine appropriate use levels that both protect recreation resources and
contribute to the visitor’s experience have continued for decades. This endeavor has been
undertaken under the concept and frameworks of carrying capacity for outdoor recreation
(Manning, 2011). Within this framework, management objectives were first defined in terms of
desired resources, social and managerial conditions. Associated indicators and standards for
these conditions were then identified, implemented, monitored, and adjusted in outdoor
recreation planning and management cycles. Three backcountry conditions that influence visitor
experience quality have been of particular concern to recreation managers and researchers:
environmental impact, social encounter (or crowding), and diverse activities (Manning, 2011).
This study builds on the outdoor recreation literature, and contributes by systematically
examining the influence of recreation-caused impacts on backcountry visitor experiences and
satisfaction. This was done by modeling the relationship between backcountry backpackers’
norms, perceived conditions, subjectively felt disturbance, and overall satisfaction, which are
presented as the Norm Disturbance Model in general, and the associated models with regard to
each of the three backcountry conditions of environmental impacts, social encounter, and diverse
activities (see Figure 2.1).
15
Tourist motivation is proposed as a moderator in this model. Tourists visit the
backcountry for a variety of motives, as delineated in the Recreation Experience Preference
Scales (Manfredo, Driver and Tarrant, 1996). Some motives seem to be more directed toward or
susceptible to the environment than others. Two such motives are enjoyment of nature and
solitude, which are likely to be affected by environmental degradation, crowding, and conflicts
with other users. The importance of the motives becomes salient when trade-off decisions have
to be made in the face of limited recreation resources and increasing demand. Backcountry
visitors are found to be willing to give up some degree of access (e.g., lowered chance of
obtaining a hiking permit) and freedom of choice (e.g., fixed itinerary) in order to ensure that
they will experience a more pristine environment and less crowdedness (Lawson and Manning,
2001a, 2001b, 2002; Manning, Lawson and Valliere, 2009; Newman, Manning, Dennis and
McKonly, 2005).
The following reviews research on the three backcountry conditions. Hypotheses are
developed as presented in the Specified Motives-Moderated Disturbance Model as shown in
Figure 2.1. As mentioned in Chapter 1, the role of norms is not empirically tested, so they are
included in the model but no formal hypotheses are advanced.
2.1 ENVIRONMENTAL IMPACTS
The impact of recreation on the natural environment may be seen as generally consisting
of two parts: one is through the development of facilities and services in the backcountry, and the
other is through the impacts directly caused by recreationists. Visitor attitudes and preferences
for facilities and services associated with backcountry and wilderness recreation are explored in
early descriptive studies and are summarized by Manning (2011). It is commonly found in these
16
studies that wilderness visitors tend to accept the status quo, and many do not have well-
developed attitudes and preferences with regard to wilderness management issues (Stankey and
Schreyer, 1987). Over time, wilderness visitors seem to be evolving toward a more “purist”
orientation, in which more appreciative and less consumptive uses are favored and use
restrictions are more supported when and where conditions entail. This orientation is shown in
visitor attitudes and preferences toward specific backcountry management policies and facilities
and services in dozens of studies conducted at different sites (Manning, 2011). Specifically, most
backcountry visitors support limitations on use and on travel party size. They generally prefer
low-standard trails to high-standard trails, favor information signs but not campsite and
interpretive signs, prefer fire rings but not fireplaces and picnic tables, prefer maps/pamphlets
and wilderness rangers but not emergency telephones, and they do not like corrals and hitching
racks for horse use in the backcountry. In summary, backcountry visitors seem to prefer keeping
facilities and services to a minimum and bringing little change to the backcountry.
Meanwhile, the popular slogans “pack it in, pack it out,” “take only pictures, leave only
footprints,” and “leave no traces” seem to set behavioral norms for outdoor recreationists
regarding their own impact on the natural environment (Blanchard, Strong and Ford, 2007).
Compared with visitor norms for facilities and services in the backcountry, these “null impact”
norms are so clear that no further clarification is needed. These norms serve as a comparison
reference for evaluating backcountry conditions.
While backcountry visitors may have a salient norm for a “pure” natural environment,
their perception of the environmental impacts caused by recreation use is another story. Early
studies show that, with the exception of litter, visitors usually fail to notice, and rarely complain
about, recreation-caused environmental impacts (e.g., ground cover and vegetation damage, trail
17
erosion, water pollution, and wildlife disturbance) (Hammitt and McDonald, 1983; Knudson and
Curry, 1981; Lucas, 1979).Compared to objective, scientific measurements of environmental
impacts, visitor perceptions and assessments appear entirely unrelated to the magnitude of
impacts (Farrell, Hall and White, 2001), but have been found to be reasonably accurate by others
(Uyarra, Watkinson and Cote, 2009). Compared to managers, visitors are also less perceptive of
all kinds of environmental issues in the backcountry (Manning, 2011). However, despite their
inadequate perception, recent studies suggest that over the decades visitors may be becoming
more conscious of recreation-related environmental impacts (Farrell, Hall and White, 2001;
Flood and McAvoy, 2000; Manning et al., 2004; Uyarra, Watkinson and Cote, 2009).
Along with perception comes an impact on subjective experience. Undesirable
environmental conditions are found to reduce the quality of the recreation experience and visitor
opinions of wilderness managers (Flood and McAvoy, 2000). Lynn and Brown (2003) found that
the presence of environmental impacts (litter, plant and tree damage, fire rings, trail erosion and
widening, muddiness) negatively affected the quality of hiking experiences in four dimensions
(solitude, naturalness, remoteness, and artifactualism).
This study examines the influence of the perceived environmental impacts in the
backcountry on visitors’ subjective experience. Particularly, the impacts include litter and waste
along trails and at campsites, trail erosion, and vegetation damage from trampling or cutting.
Their influence on subjective experience is generally measured as disturbance. Disturbance may
represent related aroused negative emotions such as annoyance, irritation, anger, displeasure, and
resentment that are based on the cognitive attribution of the environmental impacts to others
(Oliver, 2010). Based on the review above, it was hypothesized that:
H1a: More perceived environmental impacts lead to higher subjective disturbance.

18
Subjective disturbance caused by environmental impacts is only part of the backcountry
experience. It will then be explored how this disturbance will be factored into tourists’ overall
satisfaction as a summary psychological state. Hence, the following hypothesis was proposed:
H1b: Environmental impact-related disturbances will negatively affect overall visitor
satisfaction.
Not all environmental impacts are judged negatively, however. For example, the majority
of campers have viewed changes to groundcover, soil and trees in a positive way as these
changes have facilitated camping (White, Hall and Farrell, 2001). Climbers accept the
development of multiple trails but object to some other recreation-related impacts, such as
damage to trees resulting from poor rock-climbing practices (Monz, Roggenbuck, Cole, Brame
and Yoder, 2006).
This study examined the moderating role of tourists’ motives on the relationships
between environmental impact perception, disturbance, and overall satisfaction. The nature
motive is seen as the most pertinent. For tourists with the nature motive, enjoyment of nature and
being in a wilderness setting unspoiled by human influence is important for their trip. Because of
this nature-oriented mindset, they may be more sensitive to environment impacts, and be more
disturbed when they perceive the existence of such impacts. The disturbance may also play a
larger role in their satisfaction response. Therefore, it was hypothesized that:
H1c: Backcountry visitors with a stronger nature motive are more disturbed by environmental
impacts.
H1d: Backcountry visitors with a stronger nature motive are more dissatisfied by environmental
impact-related disturbances.

19
2.2 SOCIAL ENCOUNTERS (CROWDING)
Social encounters or crowding in outdoor recreation, associated with population growth
and increasing use, has been a concern for decades by recreationists and managers. Vaske and
Shelby (2008) summarized 181 studies of perceived crowding from 30 years of research across
615 recreation locations. Perceived crowding was found to be prevalent, though the degree of
crowding (the percentage of visitors reporting crowding) varied significantly depending on time,
country, region, location within a recreation site, and recreation activities.
Crowding thus is one of the most studied issues by outdoor recreation researchers. This
body of literature is synthesized by Manning (2011) in an Expanded Crowding Model that
encompasses the relationships between use level, encounter, perceived crowding, satisfaction,
and other related variables (Manning, 2011, p. 110). Specifically, contacts or encounters between
visitor groups is influenced, but not entirely determined, by recreation use level—encounters
may also be influenced by topography, geography, and trip patterns. Encounters then affect
perceived crowding. Or, in other words, encounter is interpreted as crowding based on crowding
norms. Norms here serve as a comparison referent. Perceived crowding then influences visitor
satisfaction, which is a multi-faceted variable and is also influenced by other variables as well,
such as facility development and weather. Perceived crowding may also lead to coping behaviors
such as displacement, product shift, and rationalization. The observation of each variable,
including use level, encounters, perceived crowding, and satisfaction, is limited by the
measurement techniques used, which influence the observed relationships.
The Motives-Moderated Norm Disturbance Model proposed in this study is in general
consistent with this Expanded Crowding Model (Manning, 2011), but focuses to a greater degree
20
on its psychological component. This focus provides for a systematic examination of the role of
crowding in visitor experience and satisfaction in one single study, as illustrated below.
Manning (2011) summarized findings from 35 studies on use level, perceived crowding,
and satisfaction. Most studies examined only one or two of the relationships between the three
variables. Generally, low or nonsignificant relationships were found, and were positive between
use level and perceived crowding, and negative between perceived crowding and satisfaction.
Use level and satisfaction were unrelated. Accordingly, the following hypotheses were proposed:
H2a: More encounters with others in the backcountry leads to higher subjective disturbance.
H2b: Encounter-caused disturbances negatively affect overall satisfaction.
One explanation for the lack of a relationship between use level and satisfaction is the
Social Interference Theory (Schmidt and Keating, 1979). The Theory states that crowding is
experienced when the presence of others interferes with one’s goals, constrains one’s behavior,
or causes cognitive overload, which results in a loss of personal control over the environment.
Another explanation is from the Normative Theory (Stokols, 1972a, 1972b; Stokols, Rall, Pinner,
andSchopler, 1973), which distinguishes between use level or density (a neutral, physical
condition) and crowding (a normative, psychological experience). Crowding is seen as a
subjective and negative interpretation of a use level that interferes with one’s activities or
intentions (Manning, 2011). The crowding norm, which determines at what point the increasing
use level is interpreted as crowding, is influenced by the characteristics of the recreationist and
those encountered, and situational variables. One variable, i.e., the tourist motive, is examined
for its moderating role in this relationship.
Specifically, the solitude motive is deemed especially vulnerable to the influence of
encounters in the backcountry. Tourists with the solitude motive would like to get away from
21
crowded situations, to be alone, and to experience peace and calm in the wilderness. Therefore,
they may be more sensitive to the presence of others and be more disturbed with such encounters.
The disturbance may also play a larger role in their satisfaction response. Therefore, it was
hypothesized that:
H2c: Backcountry visitors with a stronger solitude motive are more disturbed by encounters.
H2d: Backcountry visitors with a stronger solitude motive are more dissatisfied by encounter-
related disturbances.
2.3 DIVERSE ACTIVITIES
Like crowding, substantial conflict is frequently found among recreationists participating
in different activities, and is expanding as the demand for outdoor recreation grows both in
quantity and in types of activities (Manning, 2011). Conflict is defined as goal interference that
is attributed to others’ behavior (Jacob and Schreyer, 1980). There are two types of conflict: one
is through direct interpersonal contact, which interferes with one’s trip goal (Jacob and Schreyer,
1980); and the other is through indirect contact, in which an activity in general (rather than a
particular participant) is deemed to be at odds with the beliefs, values, and norms of the
recreationist (e.g., Vaske and colleagues, 1995, 2004, 2007). Scores of studies have found
conflict between land recreation groups (e.g., hikers, mountain bikers, horse users, and
motorcyclists; snowmobilers and skiers) and water recreation groups (e.g., canoeists and
motorboaters) (Manning, 2011). Such conflict is often asymmetric or unidirectional, that is,
recreationists in one activity may dislike the presence or behavior of recreationists in another
activity, but the reverse may not be true. Usually it is the nonmotorized recreation participants
that object to motorized activities. In line with these observations, in this study of backcountry
22
backpackers, they are likely to feel disturbed by horse users, or helicopters and other motorized
activities.
An Expanded Conflict Model was proposed by Manning (2011, p. 216) as a synthesis of
the body of theoretical and empirical studies on recreation conflict. This model appears to be
different than the Expanded Crowding Model (Manning, 2011) discussed above. However, it
may be restructured in a way that conflict is examined in a uniform model together with
environmental impact and crowding, as shown in the Norm Disturbance Model (Figure 2.1). As
modeled in this study, the diverse activities in the backcountry, as environmental stimuli, may or
may not be interpreted subjectively as conflict or disturbance. This interpretation depends on
one’s trip goals or expectations, situational norms, or more general values, which serve as a
comparison referent for the perceived presence or behavior of others. Then the subjective feeling
of disturbance may lead to diminished enjoyment and satisfaction. Accordingly, it is
hypothesized that:
H3a: Perceived diverse activities in the backcountry lead to subjective disturbance.
H3b: Diverse activities-related disturbances negatively affect overall satisfaction.
The formation of norms as a comparison referent, as discussed above, may be influenced
by a variety of factors. Jacob and Schreyer (1980) proposed four major factors: (1) activity style,
including the motivation, intensity of participation, experience, status, and quality standard with
regard to an activity; (2) resource specificity, including the quality evaluation, sense of
possession, attachment, and status based on intimate knowledge with regard to a specific
recreation area; (3) mode of experience with regard to the natural environment; and (4) lifestyle
tolerance with regard to use of technology, consumption of resource, and prejudice. These
23
factors influence the sensitivity of a recreationist to potential conflict and moderate the effect of
the perceived presence or behavior of others on the conflict subjectively experienced.
One particular variable, the solitude motive, was examined in this study as such a
moderator. The solitude motive has already been discussed as a moderator of the effect of
encounters on perceived crowding or subjective disturbance in the previous section. Similarly, a
recreationist who is longing for solitude in the wilderness may be more sensitive to the diverse
activities and be more affected in overall experience and satisfaction. Therefore, it is
hypothesized that:
H3c: Backcountry backpackers with a stronger solitude motive are more disturbed by diverse
activities.
H3d: Backcountry backpackers with a stronger solitude motive are more dissatisfied by diverse
activities -related disturbances.
2.4 CONTRIBUTION OF THIS STUDY
This study contributed to tourism and recreation research in two respects. First, visitor
reaction to backcountry conditions (i.e., environmental impacts, social encounters, and diverse
activities) were generally investigated separately (Manning, 2011). This study proposed a unified
model from a psychological perspective that encompassed and explained all three conditions and
synthesized research on these backcountry concerns. The model may also be applied to other
concerns. Meanwhile, this model is analogous to the Expectancy Disconfirmation Model and
other existing models in satisfaction research both in marketing and in tourism (Oliver, 2010). It
thus provided greater integration of the outdoor recreation satisfaction research with satisfaction
research in these related fields.

24
Second, much of the research on the impact of backcountry conditions focuses on visitors’
preliminary or immediate reactions (e.g., perceived crowding or conflict; Manning, 2011). This
study examined the impact on visitors’ overall satisfaction as a summary fulfillment evaluation,
thus further clarifying the role of the impact in the overall tourist experience.
The role of overall satisfaction may also be considered in the carrying capacity
frameworks that guide outdoor recreation planning and management. In these frameworks,
visitor preliminary or immediate reactions to recreation impacts are used to set up standards for
relevant recreation quality indicators. For example, the number of encounters per day is an
indicator of a solitude experience, and more than five encounters per day in the backcountry is
perceived as crowding. Thus the standard is set at five encounters (the standard may then be
popularly accepted and become a norm). The question here is: can overall satisfaction play a role
in setting the standards? Arguably, as overall satisfaction is the summary evaluation of the entire
recreation experience on a trip, it may be less sensitive to the initial impact of specific
backcountry conditions. Relying on overall satisfaction may lead to less stringent standards and
lowered recreation quality. However, on the other hand, some indicators may be found to play a
larger role in overall satisfaction than others, which may be an indication of their importance
relative to others. Hence, overall satisfaction may be used to evaluate the importance of
indicators in visitor experiences, and their importance in outdoor recreation management. This
role of overall satisfaction is discussed after the empirical analysis of this study.
This chapter discussed the influence of backcountry conditions on visitor satisfaction.
The next two chapters will turn to tourists themselves and examine how their own input (e.g.,
motivations, skills and choices) may contribute to their satisfaction.
25
CHAPTER 3
TOURIST MOTIVES AND SATISFACTION
A critical issue in understanding the role of tourists themselves in the co-production of
the tourism experience and satisfaction is to conceptualize and define relevant personal
determinants. Tourist motivation is proposed as one determinant in this chapter based on the
tourism and psychology literature. The proposition of this study is that tourist motives may
influence satisfaction depending on how well they express the basic psychological needs
specified by Self-Determination Theory (Deci and Ryan, 1985, 2000, 2002). This idea is briefly
introduced in Chapter 1 as the Basic Psychological Needs Expression Model of Satisfaction,
which is reproduced in Figure 3.1.
This chapter first reviews and discusses research in the tourism field on tourist motivation
and the relationship between tourist motivation and satisfaction. Then the basic psychological
needs and related psychological research are introduced. Based on this review, the relationship
between individual tourist motives and overall satisfaction is specified, shown as the specified
trip motives model in Figure 3.1.
3.1 TOURIST MOTIVATION
“A motive is an internal factor that arouses, directs and integrates a person’s behavior”
(Murray, 1964, p. 7). Due to this essential role of motivation in behavior, research on tourist
motives has been extensive. A review of 29 such studies is shown in Table A4 in Appendix A.
Despite the diverging contexts of these studies, a core set of common motives is repeatedly
observed. This core set of tourist motives is shown in Table 3.1, summarized from a set of 27
26
studies which used empirical quantitative data and factor analysis to find common dimensions of
tourist motivation (the specific motives in the 27 studies are presented in Table A5 in the
Appendix). Included in the 27 studies is a meta-analysis of 36 studies that have used Recreation
Experience Preference (REP) scales/items (Manfredo, Driver and Tarrant, 1996), which serve as
stronger evidence of the generalizability of tourist motives beyond a single study. Overall, the
generalizability of the core set of tourist motives provides a solid first step for research on the
relationship between motivation and satisfaction.
Specifically, the motives are (in decreasing order of frequency of occurrence in the 27
studies):
1. Escape, solitude, getting away, and relaxation;
2. Knowledge, culture exploration and experience, education, discovery and learning;
3. Novelty, uniqueness;
4. Family togetherness, connecting with friends, enhancing kinship and relationship;
5. Social interaction, meeting similar people and new people;
6. Entertainment, excitement, having fun;
7. Social prestige, recognition, achievement, travel bragging;
8. Nature, love of nature, enjoy nature;
9. Self-development, autonomy, leadership, introspection, creativity, self-actualization;
10. Adventure, risk taking;
11. Risk reduction, safety, social security.
The first five motives are commonly found in over 40% of studies. For the current
research, the following motives are included to account for both the common factors and the
27
backcountry backpacking context: solitude, knowledge, family togetherness, meeting people,
nature, competence, risk taking, and risk reduction (social security).
3.2 RESEARCH ON TOURIST MOTIVATION AND SATISFACTION
A review of research on tourist motivation and satisfaction was conducted and the studies
are summarized in Table A6 in the Appendix A. There are three approaches to examining the
relationship between tourist motivation and satisfaction, as discussed below.
The first is a factor-cluster-comparison approach. This approach has three steps: (1) a list
of tourist motives is reduced to a smaller set of common factors through factor analysis; (2)
based on the motive factors, tourists are clustered into several groups which maximize within-
group commonality and between-group difference; (3) the motive-based tourist clusters are
compared in terms of their satisfaction. This approach is used in Lee, Lee and Wicks (2004), Kau
and Lim (2005), and Devesa, Laguna and Palacios (2010). Lee, Lee and Wicks (2004) found
four clusters: culture and family seeker, multi-purpose seeker, escape seeker, and event seeker.
Among the four clusters, the multi-purpose seekers had higher ratings on most motive factors,
and were the most satisfied. Kau and Lim (2005) found four clusters: family/relaxation seeker,
novelty seeker, adventure/pleasure seeker, and prestige/knowledge seeker. Family/relaxation
seekers had greater overall satisfaction than the other three clusters.
Devesa, Laguna and Palacios (2010) also found four clusters: visitor looking for
tranquility, rest, and contact with nature; cultural visitor; proximity, gastronomic and nature
visitor; and return tourist. They found that performance of some destination attributes was more
pertinent to the satisfaction of certain motivation clusters (e.g., cultural visitors had higher
evaluations of those items related to their cultural motivation, such as monument and museum
28
opening hours, guided tours and heritage conservation), while other attributes affected
satisfaction of all motivational clusters (e.g., gastronomy quality, availability of services and
tourist information).
Somewhat similar to this first approach, an a priori motivational factor approach was
used by Fielding, Pearce and Hughes (1992), which compared intrinsically-motivated versus
achievement-motivated tourists. The former was found to report greater enjoyment, with time
passing more quickly, than the latter.
The second approach is a differential approach to the influence of tourist motives on
satisfaction. It examines the relationship of each motivational factor with tourist satisfaction
separately rather than in the clustered way. Depending on the research context, different numbers
and types of tourist motives were found, and positive, negative and null effects were found in the
six studies reviewed (see Table A6 in Appendix A for specific findings from each study).
Positive effects on satisfaction were found from motivation for relaxation and escape (McDowall,
2010; Pan and Ryan, 2007; Prebensen, Skallerud and Chen, 2010), cultural exploration and local
specific events (Prebensen, Skallerud and Chen, 2010; Schofield and Thompson, 2007), novelty
seeking (Assaker, Vinzi and O’Connor, 2011; McDowall, 2010), and reminiscence (Lee and
Beeler, 2009). Negative effects on satisfaction were found from motivation for sports attraction
(being a fan and enjoying sports events) (Schofield and Thompson, 2007), and family and friend
togetherness (Meng, Tepanon and Uysal, 2008).
The third approach assumes a lump-sum effect of motivation on tourist satisfaction. In
contrast to the differential approach, this approach conceptualizes motivation as one single
construct in a structural model of tourist behavior, and examines its effect on satisfaction. A
positive effect was found in three studies (Kim, Sun and Mahoney, 2009; Lee, 2009; Ragheb and

29
Tate, 1993), indicating that the more motivated a tourist is, the more satisfied he/she will be with
the trip.
The third approach may also include a further distinction between push and pull
factors/motivations in tourism. In this dichotomy, push factors are those that predispose a tourist
to travel; pull factors are features of a destination that attract a tourist (Crompton, 1979; Dann,
1977; Uysal and Jurowski, 1994). For example, Uysal and Jurowski (1994) found four push
factors, re-experiencing family togetherness, sports, cultural experience, and escape; and four
pull factors, entertainment/resort, outdoor/nature, heritage/culture, rural/inexpensive. Yoon and
Uysal (2005) found that push motivation had a positive effect on tourist satisfaction, but pull
motivation had a negative impact. That is, the more a tourist was motivated by push motivations,
which included relaxation, family togetherness, and fun, the more he/she was satisfied with the
trip. In contrast, the more he/she was motivated by pull motivations, which included reliable
weather, cleanness of the destination environment, opportunities for shopping, nightlife and local
cuisine, the less likely he/she was satisfied with the trip. In a different structural model of tourist
behavior, Kim (2008) found that higher push motivation led to higher pull motivation, which
positively affected tourist satisfaction in an indirect way through higher cognitive and affective
involvement.
Overall, research from these different approaches has shown a significant relationship
between tourist motivation and satisfaction. Further advances may be made in this line of
research in the following ways. First, despite an interest in the relationship between motivation
and satisfaction, there is still a lack of theorization. As discussed above, both positive and
negative effects of different motives on tourist satisfaction have been empirically found.
However, there is seldom a priori hypotheses of such directional effects, or posterior
30
explanations for empirical findings. For example, Assaker, Vinzi and O’Connor (2011) did not
propose a relationship between the novelty-seeking motive and tourist satisfaction in their initial
model, but later such an addition was added in order to account for the correlation between the
two. The negative effect of pull motivation empirically found in Yoon and Uysal (2005) was
contrary to their proposition, which seemed difficult to explain. One exception to this lack of
theorization was Fielding, Pearce and Hughes (1992), who based their hypothesis on relevant
psychological theories, and the hypothesis was then empirically verified. Overall, the research
findings from the studies reviewed above call for a more theoretically-guided approach to the
relationship between tourist motives and satisfaction.
The conceptualization of the relationship between tourism motivation and satisfaction
reflects the effect of a lack of theorization especially in the lump-sum effect approach compared
to the differential approach (the factor-cluster-comparison approach is also a less differential
approach). Using Yoon and Uysal (2005) as an example, they conceptualized tourist motivation
as consisting of multiple motives, but did not specify the relationship between each of the
motives and satisfaction. Instead, the specific tourist motives were treated as indicators of a
higher level latent construct, i.e., tourist motivation. When it came to the test of the fit of the
measurement model, some motives were deleted due to lack of a relationship with the “latent
construct” and thus excluded from further analysis. Hence, what were included in the motivation
construct might be only those motives that were empirically closely related. Further, these
motives may have had different effects (negative, positive, or null) on tourist satisfaction, as
observed in studies taking the differential approach. But in the lump-sum effect approach, these
effects were not separately tested. Instead, the higher level motivation construct was tested for an
effect, which became unpredictable as it may have been a combination of effects in potentially
31
different directions. This may partially explain the unexpected null effect of push motivation on
satisfaction in Yoon and Uysal (2005). Therefore, a differential approach at the motive level is
preferable.
The core set of common tourist motives as discussed in the previous section represents
such an appropriate level. The following motives are included for a backcountry backpacking
context: solitude, knowledge, family togetherness, meeting people, nature, competence, risk
taking, and risk reduction (social security). To develop hypotheses about the relationship
between these tourist motives and satisfaction in a theoretical and differential approach, the
concept of basic psychological needs from Self-Determination Theory (SDT; Deci and Ryan,
1985, 2000, 2002) and related studies are introduced and applied to the current study.
3.3 SELF-DETERMINATION THEORY: SATISFACTION OF BASIC PSYCHOLOGICAL
NEEDS
SDT has been developed over three decades, but it has seldom been used and tested in the
tourism field (White and Thompson, 2009). As the theory differs from some other early-
established and probably more widely-received psychological theories in considerable ways
(Deci and Ryan, 2000), a brief introduction to the theory and related research is warranted. This
introduction will provide a basis for considering the theory’s validity and applicability for
understanding the relationship between tourist motivation and satisfaction in this study. A more
detailed account of this research can be found in Deci and Ryan’s papers (1985, 2000, 2002).
32
3.3.1 The Basic Psychological Needs
The applicability of SDT to the current tourism context has to do with its definition of
needs. SDT assumes a fundamental human organismic tendency toward vitality, integration,
growth and health (Deci and Ryan, 2000). Needs are specified as the innate psychological
nutrients that are essential for actualization of this tendency, just like food and water are
necessary for biophysical functioning. Three basic psychological needs have been identified: the
needs for autonomy, competence, and relatedness. Autonomy refers to perceiving oneself as the
origin or source of one’s own behavior. Competence refers to feeling effective in one’s ongoing
interactions with the environment and experiencing opportunities to express and exercise one’s
capacities. Relatedness refers to feeling connected to others, to caring for and being cared for by
those others, and to having a sense of belonging both with other individuals and with the larger
community (Deci and Ryan, 2002). It is expected that if these needs are not satisfied,
psychological well-being and optimal development will be compromised.
The three needs were not specified on an assumptive or a priori basis, but instead
emerged from inductive and deductive empirical processes (Deci and Ryan, 2000). More
specifically, they were proposed as useful concepts to meaningfully interpret and integrate a
diverse set of research findings in the areas of intrinsic motivation and internalization of extrinsic
motivation. Intrinsic motivation refers to engaging in an activity for the pleasure and satisfaction
inherent in the activity, and is related to high quality functioning and psychological well-being.
The need for autonomy was initially specified to account for the repeatedly confirmed
undermining effect of contingent tangible rewards, e.g., monetary rewards, on intrinsic
motivation (Deci and Ryan, 2000; see Deci, Koestner and Ryan 1999 for a meta-analysis of 128
studies). As intrinsically motivated behavior is what people do naturally and spontaneously when
33
freely following their inner interests, it reflects an internal perceived locus of causality (PLOC)
(deCharms, 1968). When extrinsic rewards are provided for doing an intrinsically interesting
activity, people may feel controlled by the rewards, and their PLOC for the behavior is shifted
from internal to external. As people feel less like the origin of their behavior, intrinsic motivation
for the activity decreases. A similar detrimental effect on intrinsic motivation is also found for
events such as threats, surveillance, evaluation, and deadlines, which also prompt a shift toward
external PLOC. In contrast, providing choice and acknowledging people’s inner experience
enhances intrinsic motivation by providing support for an internal PLOC. This leads to a deeper
question: “Why would PLOC have such a significant impact on motivation and behavior?” The
basic need for autonomy is proposed to account for this conceptual gap. External events may
affect intrinsic motivation in positive or negative ways, depending on whether or not they
provide satisfaction of the need for autonomy. This proposition has been tested and supported
both in laboratory experiments and field studies (Deci and Ryan, 2000).
The needs for competence and relatedness are also proposed in similar ways to interpret
and integrate empirical results in research on intrinsic motivation (Deci and Ryan, 2000).
Specifically, the need for competence is proposed and confirmed as a mediator of the effect of
feedback on intrinsic motivation. Positive feedback enhances intrinsic motivation through its
satisfaction of the need for competence (but only when the person feels responsible for the
competent performance, i.e., the need for autonomy is satisfied). Negative feedback decreases
motivation through its frustration of this need.
In comparison to the powerful influence of autonomy and competence, the need for
relatedness plays a more distal role in maintaining intrinsic motivation (Deci and Ryan, 2000). It
is initially proposed to account for the serendipitous finding that children’s intrinsic motivation
34
for an activity significantly diminished when their attempts to interact with an adult were ignored.
It was also linked to Attachment Theory which observes that infants’ intrinsically motivated
exploratory behavior is most robust when they are securely attached to a parent (Bowlby, 1979).
The role of relatedness is further examined in populations of different ages across the life span
(Deci and Ryan, 2000). It was observed that the need for relatedness may not have to be satisfied
proximally, especially in solitary pursuits, but its fulfillment may act as a distal support which
makes the innate organismic growth tendency more likely and more robust.
The concept of the three basic psychological needs are then applied to research on
internalization of extrinsic motivation and found useful in integrating research results in this area
(Deci and Ryan, 2000). However, more evidence was needed given the strict definition of needs
as being innate and essential. Such support is provided by the empirical establishment of a clear
link between satisfaction of needs and various indicators of psychological health and well-being,
the cross-cultural universality of the needs, and the role of the needs from an evolutionary
perspective (Deci and Ryan, 2000).
The definition and specification of the three basic psychological needs for autonomy,
competence and relatedness is followed by, and allows for, a prediction that optimal
development and well-being is likely to be observed under conditions that support basic need
satisfaction, and degradation or ill-being under conditions that thwart need satisfaction (Deci and
Ryan, 2000). In the context of goal-directed behavior, such conditions include both the “what”
(i.e., the content of goals) and “why” (i.e., to what degree the process is self-initiated/determined
as opposed to externally-controlled) of goal pursuit and attainment. According to SDT, both
dimensions influence behavioral and experiential quality relative to the degree to which they
allow for satisfaction of the basic psychological needs. In the tourism context, tourists enjoy
35
comparatively more freedom in their decision-making than in routine life. Hence the basic need
for autonomy is more likely to be satisfied in the travel process. This possibility is not examined
in this study. Instead, the focus here is on whether the effect of goal content on experience
quality, which is initially conceptualized and empirically tested in other life domains, exists in
the tourism context as well. The question is whether tourist motives, which is the term used in
this research that is comparable to goals, are related to trip satisfaction. The following subsection
reviews research on the relation of goal contents to well-being, which will provide some basis for
predicting this relationship in the nature-based adventure tourism context.
3.3.2 Association of Goal Contents to Well-being
Ryan, Sheldon, Kasser, and Deci (1996) argued that the pursuit and attainment of some
life goals may satisfy the basic psychological needs to a greater extent and lead to greater well-
being than others. The distinction between goals in terms of need-satisfaction potential was made
a priori. Specifically, Kasser and Ryan (1993, 1996) and Ryan et al. (1999) distinguished
between intrinsic and extrinsic aspirations. Intrinsic aspirations included goals such as self-
acceptance/growth, affiliation, and community contribution, which were supposed to be more
closely related to basic need satisfaction. Extrinsic aspirations included goals such as acquiring
wealth, fame, and image, which are more attentive to contingent external approval and reward.
These goals were expected to be less likely to provide direct need satisfaction and may even
detract from it. The intrinsic-extrinsic distinction of aspirations was empirically verified by
factor analysis (Kasser and Ryan, 1996; Ryan et al., 1999).
The predicted relationship between goal contents and well-being was consistently
validated in a series of empirical studies, two using U.S. samples (Kasser and Ryan, 1993, 1996)

36
and two comparing U.S. samples to Russian and German samples (Ryan et al., 1999; Schumck,
Kasser and Ryan, 2000, respectively). Goal contents were related to a diverse set of indicators of
well-being in these studies, including positive outcomes such as self-actualization, self-esteem,
vitality, life satisfaction, global functioning and social productivity; and negative outcomes such
as depression, anxiety, physical symptoms and conduct disorders. In general, respondents who
were focused on intrinsic goals had greater well-being, whereas the reverse was true for those
who focused on extrinsic goals. A positive relationship between intrinsic motivation and well-
being was also found in Malka and Chatman (2003) in a work context, and Salinas-Jimenéz,
Artés and Salinas-Jimenéz (2010) in a more general life context.
The association of goal contents with well-being has been evidenced in other lines of
research as well. One line is McAdams and colleagues’ research on intimacy motivation.
Intimacy motivation represents a recurrent preference or readiness for experiencing warm, close
and communicative interactions with others (McAdams, 1980). It is similar to the need for
relatedness (Deci and Ryan, 2000). McAdams and Vaillant (1982) examined the longitudinal
relationship between four social motives (achievement, power, affiliation, and intimacy) and nine
indices of psychosocial adjustment in a sample of 57 men. It was found that, among the four
motives, only high intimacy motivation at age 30 was significantly associated with better overall
adjustment 17 years later. More specifically, it was related to higher income, greater enjoyment
of job and marriage, and more frequent vacations. McAdams and Bryant (1987) examined the
relationship between intimacy motivation and subjective mental health in a representative
nationwide sample of over 1,200 adults. It was found that high intimacy motivation was
associated with greater happiness and gratification in women, and lack of strain and lack of
uncertainty in men.
37
Emmons (1986) conceptualized goals in terms of personal strivings, which represented
what an individual was characteristically trying to do. It is more abstract than action goals but
more specific than basic needs. In empirical research, personal strivings were directly elicited
from respondents and then further categorized into more general social motives (Emmons, 1991).
It was found that a personal striving for affiliation was related to positive affect, while striving
for power was related to negative affect and psychological and physical distress.
In summary, the above studies have shown that what an individual pursues is associated
with his or her well-being both on a day-to-day basis and in the long run. The effect of a specific
goal might be predicted depending on its relation with the basic psychological needs of
autonomy, competence and relatedness. These needs thus took on the role of a comparison
referent for individual pursuits for their effect on well-being, as shown in Figure 3.1. Based on
the claimed universality of the needs, this study tests this proposition in the nature-based
adventure tourism, or more specifically, the backcountry backpacking context. The following
subsection discusses this proposition in relation to the studies on tourist motivation and
satisfaction reviewed in section 3.2, and develops hypotheses that were tested in this study.
3.4 TOURIST MOTIVES AND SATISFACTION: HYPOTHESES BASED ON THE BASIC
PSYCHOLOGICAL NEEDS
In the context of this study, the concepts of goals, social motives and personal strivings
used in the psychological studies reviewed above are substituted by tourist motives. The various
indices of well-being, including life or day-to-day satisfaction, are substituted by tourists’ overall
satisfaction as a summary fulfillment response. It is then proposed that the more closely a tourist
motive reflects the basic psychological needs of autonomy, competence, and social relatedness,
38
the more likely it is to positively affect tourist satisfaction. In other words, those tourists who
assign higher importance to experiences that are closely related to intrinsic psychological needs
are more likely to achieve satisfaction than those who play down such experiences. In contrast,
those who put more importance on extrinsic factors, which may be explained as some pull
factors in the tourism research context, may be less likely to obtain satisfaction.
As mentioned in comparison to the Expectancy Disconfirmation Model, the basic
psychological needs as a comparison referent for motives are not cognitively processed by
tourists. The relationship exists directly between motives and satisfaction. The issue, then, is to
specify the relationship for each of the eight motives examined in this study: solitude, knowledge,
family togetherness, meeting people, nature, competence, risk taking, and social security. As was
done in the psychological studies reviewed earlier, this specification was done a priori, based on
face validity. The empirical findings on the relationship between tourist motivation and
satisfaction as reviewed in section 3.2 are used below as further evidence when available.
Backcountry tourists with a solitude motive want to get away from crowded situations, to
be alone, to release some built-up tensions, and to experience peace and calm (Manfredo, Driver
and Tarrant, 1996). This motive may reflect the need for autonomy by escaping daily obligations
and restrictions. By expressing this basic need, the tourist may be more likely to obtain
satisfaction from the trip. Therefore, it was hypothesized that:
H4a: The solitude motive is positively related to tourist satisfaction.
Backcountry tourists with a knowledge motive want to study nature, learn about a park’s
history and natural wonders (Manfredo, Driver and Tarrant, 1996). Somewhat differently,
tourists with a nature motive want to be in a wilderness setting where human influence is not
noticeable, and enjoy the sounds and smells of nature (Manfredo, Driver and Tarrant, 1996). The
39
learning and appreciative experience may provide a greater understanding of the general
environment and a mental grasp of its functioning. Further, being and surviving in the
backcountry also evidences the competence of tourists. Thus, the motive may reflect the need for
competence. By expressing this basic need, the tourist may be more likely to obtain satisfaction
from the trip. This relationship is evidenced with regard to two similar motives, novelty seeking
and cultural exploration, which are found to be positively related to tourist satisfaction (Assaker,
Vinzi and O’Connor, 2011; McDowall, 2010; Prebensen, Skallerud and Chen, 2010; Schofield
and Thompson, 2007). Therefore, it was hypothesized that:
H4b: The knowledge motive is positively related to tourist satisfaction.
H4c: The nature motive is positively related to tourist satisfaction.
Backcountry tourists with a competence motive want to test, develop, and depend on
their outdoor skills to deal with wilderness conditions and be self-sufficient (Manfredo, Driver
and Tarrant, 1996). It is obviously a very explicit expression of the competence need. Hence, it
was hypothesized that:
H4d: The competence motive is positively related to tourist satisfaction.
Backcountry tourists with a risk taking motive want to chance dangerous situations and
experience the risks involved (Manfredo, Driver and Tarrant, 1996). With risk in mind, it may
insinuate a potential for losing control, which is a negation of one’s competence. The role of risk
will be discussed in more detail in the next chapter. For the purpose of the hypothesis here, risk
alone may be a negative experience. For example, perceived risk decreases college students’
propensity and likelihood to participate in mountain biking, while prior experience (an indication
of competence) has a positive effect (Creyer, Ross and Evers, 2003). A major concern of the so-
called risk takers, mountaineer tourists, is to have a safe experience assisted by mountaineering
40
organizations (Pomfret, 2011). Similarly, outdoor recreationists in Norway ranked risk/challenge
as the least important experience, while facilitation was the most important (Tangeland, 2011).
Therefore, it is argued that risk taking itself may be detrimental to the competence need, and thus
negatively affects tourist satisfaction. However, when risk and competence are balanced, the two
may lead to optimal experience and satisfaction, which is the topic of the next chapter. For now,
it was hypothesized that:
H4e: The risk taking motive is negatively related to tourist satisfaction.
The remaining three motives are all socially related. Backcountry tourists with a family
motive want to do something with their family and bring the family closer together (Manfredo,
Driver and Tarrant, 1996). Tourists with a meeting people motive want to be with others who
enjoy the same thing, and observe and talk to new and varied people (Manfredo, Driver and
Tarrant, 1996). Tourists with a social security motive want to be near others who could help
them if needed (Manfredo, Driver and Tarrant, 1996). All three motives seem to express the need
for social relatedness, which is the need to feel connected to others, to care for and be cared for
by those others, and to have a sense of belonging both with other individuals and with the larger
community. By expressing this basic need, the tourist may be more likely to obtain satisfaction
from the trip. This relationship is evidenced by Kau and Lim (2005), who found that
family/relaxation seekers are more satisfied than other clusters of tourists. Hence, it was
hypothesized that:
H4f: The family togetherness motive is positively related to tourist satisfaction.
H4g: The meeting people motive is positively related to tourist satisfaction.
H4h: The social security motive is positively related to tourist satisfaction.
These eight hypotheses are shown in the model in Figure 3.1.

41
One limitation of this study is that only a limited set of motives are tested for their
relationship to tourist satisfaction. All except one were hypothesized to be positive relationships,
which are examples of intrinsic aspirations in the tourism field (Kasser and Ryan, 1996; Ryan et
al., 1999). No extrinsic motives are examined here, though a negative relationship between
extrinsic motives and satisfaction would be proposed based on Self-Determination Theory and
related studies reviewed earlier. Findings from existing tourism studies are congruent with this
proposal, where extrinsic motives may be interpreted as including those that are contingent upon
external factors, or more specifically, the performance of tourism products and services. For
example, motivation for sports attraction (Schofield and Thompson, 2007) and pull motivation
(Yoon and Uysal, 2005) were found to negatively impact tourist satisfaction. Similarly, Uysal
and Williams (2004) examined the influence of expressive and instrumental factors on tourist
satisfaction. The instrumental factors included convenience, mobility, high-quality service and
accommodation, and a good value for money. It was found that tourists who placed greater
importance on instrumental factors were less likely to obtain satisfaction. Studies including both
intrinsic and extrinsic motives should be conducted in the future for further validation and
understanding.
3.5 THE CONTRIBUTION OF THIS STUDY
In summary, this study proposes that tourist motives influence satisfaction depending on
their expression of the basic psychological needs. The proposal is based on Self-Determination
Theory and related psychological studies, and is supported by existing empirical research on the
relationship between tourist motivation and satisfaction. It contributes to the tourism literature by

42
theorizing and supporting a differential approach to explaining this relationship and by
introducing the role of tourist motives in the co-production of tourist experience and satisfaction.

43
CHAPTER 4
RISK TAKING, COMPETENCE, AND TOURIST SATISFACTION
This chapter continues discussion of the role of tourists themselves in co-producing
experience and satisfaction in the context of nature-based adventure activities. Adventure
activities in this study refer to a relatively objectively defined set of activities (e.g., Blanchard,
Strong and Ford, 2007; Buckley, 2007) which are commonly recognized as having a risky
element. This generic use of the term risky or adventure activities (e.g., in marketing materials)
is distinguished from the individual subjective experience of risk discussed in this study.
Specifically, this study focuses on the role of risk and competence in the backcountry
backpacking experience and satisfaction. Four steps were taken to explore this research goal.
First, tourist motivation for participating in adventure tourism/recreation is discussed, including
whether, and why, tourists take risks (or do not). Second, the subjective experiences, which may
be positive or negative, in adventure activities are explored. Third, the conditions for optimal
experience (which is at the positive end of experiences) in adventure activities are discussed.
Fourth, based on these discussions, two specified models are proposed about the conditions for
satisfaction in adventure activities: one examines how a balance between risk and competence
motives might affect satisfaction, and the other examines how a balance between objective risk
and objective competence might affect satisfaction.
4.1 RISK TAKING BEHAVIOR IN ADVENTURE TOURISM/RECREATION
Adventure tourism has grown rapidly in the last decade (Buckley, 2007) and demand for
outdoor recreation has been high (Manning, 2011). A wide variety of activities are included, with
44
examples ranging from airborne skydiving, to land-based mountaineering and backpacking, and
to whitewater kayaking and rafting. An inherent element in these adventure activities is risk,
especially the possibility of physical injury and even death. Why do people participate in these
activities and take such risks?
Sensation Seeking Theory by Zuckerman (1979) provides a well-known psychological
perspective to this question (Trimpop, Kerr and Kirkcaldy, 1999). Sensation seeking is “the
seeking of varied, novel, complex and intense sensations and experiences and the willingness to
take physical, social, legal and financial risks for the sake of such experiences” (Zuckerman,
1994, p.27). Sensation seeking is proposed and has been validated as a personality trait in
decades of research since the 1960s. This trait may be biologically related and genetically
determined (Trimpop, Kerr and Kirkcaldy, 1999; Zuckerman, 1983). Based on Sensation
Seeking Theory, risk taking is motivated by the need for sensations, rather than for the sake of
the risk alone (Zuckerman, 1983).
The relationship between sensation seeking and participation in risky activities has been
verified in numerous studies. Zuckerman (1983) reviewed 12 studies on this relationship, which
were classified into three groups: high-risk sports, medium-risk sports, and lower-risk sports.
Participants in high-risk sports (e.g., sky diving, auto-racing, hang-gliding, scuba diving,
downhill skiing, and mountaineering) were consistently found to have higher sensation seeking
scores than the control groups who did not participate in such sports. Similar results were found
for medium-risk sports (body-contact sports). In contrast, lower-risk sports participants (runners,
female gymnasts, and physical education majors) did not differ from non-participants or
normative groups. In summary, risky activities are participated in to meet sensation seeking
needs.
45
Slanger and Rudestam (1997) argued that the Theory of Sensation Seeking does not
explain why people take risks in one area of their lives and not in others. They examined the role
of self-efficacy, which enables risk takers to handle factors that assumingly would inhibit
nonparticipants. Self-efficacy is the expectation that one can perform competently in a situation
(Bandura, 1977). It affects whether a person will initiate a behavior or not, how much effort
he/she will expend, and how long he/she will persist in the face of difficulties and aversive
experiences. Extreme and high risk-takers were found to have higher self-efficacy in rock
climbing, skiing, piloting a small plane, and white water rafting comparing to moderate risk
sports participants (Slanger and Rudestam, 1997). The influence of self-efficacy on risk taking
was also verified in an experimental study by Krueger and Dickson (1994). When subjects were
led to believe that they were very competent, they perceived more opportunities and fewer
threats compared to those who were led to develop lowered self-efficacy. Subsequently, the
former took more risks than the latter when making decisions.
Self-efficacy, or belief in self-competence, is not just an enabling condition for risk
taking behavior, but is also an important motivation for it, while risk itself is not, as was shown
in the following studies. When asked about their motivation for risk taking (Slanger and
Rudestam, 1997), the majority (85%) of the extreme and high risk takers identified a desire for
mastery, to challenge and test oneself, and to realize one’s potential. In contrast, risk itself may
not be an attraction, especially for the “mass” adventure tourism and recreation participants. In
one study, perceived risk decreased college students’ propensity and likelihood to participate in
mountain biking, while prior experience, as an indicator of competence, had a positive effect
(Creyer, Ross and Evers, 2003). For a sample of package mountaineer tourists, risk was not
considered an important motive and they did not see themselves as risk takers (Pomfret, 2011).
46
Instead, a major concern for them was to have a safe experience assisted by the mountaineering
organization and the guide. Meanwhile, skill development and experience were key motives
encouraging their participation. Similarly, outdoor recreationists in Norway ranked
risk/challenge as the least important experience, while facilitation was the most important
(Tangeland, 2011). Fletcher (2010) argued that risk in adventure tourism had become a “public
secret”, a paradox. That is, the adventure experience, while defined and advertised as dangerous
and unpredictable, has to be, and is, delivered in a planned and controlled way, safely and
securely.
As a summary of the above discussion, risk taking behavior is motivated by the
personality trait of sensation seeking and a desire for competence expression and development.
For the majority of the population, risk seems not to be a desired experience per se, but is
undertaken for the sake of these needs and desires. High self-efficacy is needed in risk taking.
The next sections examine the subjective experience of adventure, and how optimal experience
may be achieved in risky tourism/recreation activities.
4.2 SUBJECTIVE EXPERIENCE IN ADVENTURE
Bonnet, Fernandez, Piolat and Pedinielli (2008) compared two groups of scuba divers,
risk-takers and non-risk-takers (classified based on their diving practices, e.g., risk-takers dove to
depths below 65 m and did not follow safety rules), in terms of their emotional states before and
after a dive. Emotions were assessed in three factors which included nine types: positive emotion
(happiness), arousal (surprise, alertness, and attentiveness), and negative emotions (sensitivity,
anger, discouragement, and disgust) (Izard, 1977). Before diving, risk takers were more alert and
less sensitive than non-risk takers. After diving, risk takers were happier and less angry, less
47
discouraged, and less disgusted than non-risk takers. Compared to the initial emotional states
before diving, risk takers after diving showed more happiness while non-risk takers had more
anger and discouragement. It seems that in an adventure activity like scuba diving, risk takers
have more positive and less negative emotional states than non-risk takers. But this study did not
at the same time examine the competence or self-efficacy of divers, which may have influenced
the emotional experience as well.
Carnicelli-Filho, Schwartz and Tahara (2010) analyzed first-time participants’ emotional
state of fear in three adventure activities: parachuting, rafting, and rock-climbing. The majority
of the participants predicted before the activity that they would experience no or little fear. But
after the activity, the majority recalled experiencing high levels of fear. Fear has been found to
negatively influence tourist satisfaction in adventure tourism (Faullant, Matzler and Mooradian,
2011).
The above studies show that both positive and negative experiences might occur for
adventure tourists. The line of research and Flow Theory by Csikszentmihalyi and colleagues
(1975, 1988, 1990) focuses on the phenomenology of optimal experience in risky (and non-risky)
activities. As found across various activities, optimal experience, called “flow”, occurs when one
is confident that his or her skills are adequate to cope with the challenges faced. In the flow state,
the participant is acting in a goal-directed, rule-bound system that provides clear feedback about
how well one is performing. Concentration is so intense that no attention is spared to anything
irrelevant or to worrisome problems; even self-consciousness disappears and the sense of time
becomes distorted. Such experience is so intrinsically gratifying that people are willing to
undertake the activity for its own sake, with little regard for what they will get out of it, even
when it is difficult or dangerous. The flow experience has been found to be a positive experience
48
that is widely recognizable across all ages, both genders, diverse socioeconomic statuses, and
very different cultures (Csikszentmihalyi, 1988). Flow Theory has also been adopted by
recreation and sport researchers to understand the intrinsically satisfying and motivating
character of physical, outdoor, and adventurous activities (Boniface, 2000; Kimiecik and Harris,
1996).
4.3 CONDITIONS FOR OPTIMAL EXPERIENCE IN ADVENTURE
However, the flow experience does not occur often (Csikszentmihalyi, 1975). It begins
only when perceived challenges and skills are balanced, at a personal high level
(Csikszentmihalyi and Csikszentmihalyi, 1988). As shown in Figure 4.1, only high challenge,
high skill situations produce a flow experience. When challenges and skills are in balance but
below the individual’s personal averages, apathy follows. The combination of high challenge and
low skill leads to anxiety, while low challenge and high skill leads to boredom. The prediction of
flow experience based on a high level challenge-skill balance has been confirmed to varied
degrees in a series of studies of daily life (Csikszentmihalyi and Csikszentmihalyi, 1988) and in
high altitude mountaineering (Bassi and Fave, 2010). This relationship is represented as the
Challenges-Skills Balance Model in Figure 4.3.
Interpreted in the language of satisfaction research (Oliver, 2010), the demand of
situational challenges is a comparison referent against which personal skills are gauged. Skills
have to meet challenges in order to produce optimal experience. However, both over-skill and
under-skill would lead to less than optimal experience, though the experiences are different in
nature (boredom versus anxiety). Further, skills have to meet challenges at a personal high level;
a low level results in apathy. This mechanism functions differently from the Expectancy

49
Disconfirmation Model, in which a larger positive gap (performance minus expectation) leads to
greater satisfaction, while a larger negative gap leads to greater dissatisfaction.
Wu and Liang (2011) related optimal experience to tourist satisfaction in whitewater
rafting. It was found that perceived skill and perceived challenge (separately) positively affected
flow experience. The flow experience then was highly related to tourist satisfaction. This
relationship is also represented in the Challenges-Skills Balance Model in Figure 4.3.
The four channel Flow Model has been adapted in the form of an Adventure Experience
Paradigm (AEP) as a conceptualization of conditions for optimal experience in outdoor
adventure (Martin and Priest, 1986; Priest and Baille, 1987; Priest and Bunting, 1993; Priest and
Carpenter, 1993). The challenge and skill conditions in the Flow Model are replaced by risk and
competence in AEP. Risk is defined as the uncertainty of outcome and especially potential
physical injury and even death in adventure tourism and recreation (Priest and Gass, 1997). It is
different from challenge in the sense that challenge may be difficult to deal with but may not be
risky. Competence is defined as the ability to effectively handle the situational demands in an
adventure setting (Priest, 1994), and is similar to skills in the Flow Model.
As shown in AEP in Figure 4.2, a balance of risk and competence leads to the optimal
experience as peak adventure. Increasing risk which is not matched with competence may result
in misadventure, devastation, or disaster. Competence matched with a moderate level of risk will
result in the experience of adventure, and exploration and experimentation when risk is even
lower compared to competence.
Jones, Hollenhorst and Perna (2003) empirically compared the power of the flow model
and AEP in predicting optimal experience in whitewater rafting. Both models explained 14% of
the variance in flow experience, as depicted in section 4.2. Further, convergent validity was

50
found for the constructs of perceived challenge and risk, and for perceived skill and competence.
The subjective perceptions also had ecological validity. That is, rafters perceived higher
challenge/risk and lower skill/competence at the more difficult and challenging rapids assessed
according to more objective standards.
AEP was thus adopted in this research and represented in another way as the Risk-
Competence Balance Model in Figure 4.3. Similar to the interpretation of the challenges-skills
balance above, risk is also a comparative referent that has to be met by competence in order for
optimal experience to occur in adventure activities. Both over-competence and under-
competence would lead to less than optimal experience and satisfaction. One limitation of this
study was that optimal experience was not measured. Hence, the balance between risk and
competence was directly linked to tourist satisfaction. It is expected that without the inclusion of
the mediation effect of optimal adventure, the risk-competence balance would still be found to
influence satisfaction.
In the studies reviewed above, the prediction of optimal experience and satisfaction was
based on subjective perceptions of challenges/risk and skills/competence. This study examined
how satisfaction may be affected by the risk-competence combination from two different
perspectives: motivation and objective assessment. They are developed in the following two
sections.
4.4 MOTIVATIONAL CONDITIONS OF RISK AND COMPETENCE FOR SATISFACTION
The main reason to study the motivational conditions of risk-taking and competence for
achieving a satisfactory experience is that motivations are pre-conditions for later experience (as
perceived). Especially in voluntary activities like outdoor adventure, the perceived experiences
51
may be proactively sought in the form of motives. Thus, there may be a connection between
motives and experiences (perceptions). It is interesting to examine whether the motivational
conditions are related to satisfactory experience as well. Besides this theoretical importance, this
question is practically important. In the context of this study, motives were trip goals or
experiences that are important to a tourist (different from the notion of motives as ingrained
personality traits). From a behavioral perspective, when a tourist plans for and engages in an
adventure activity, setting and adjusting motives precede and set the direction for an activity. It is
deemed easier (and less costly) to adjust one’s motives or goals in the first place than to
influence the natural occurrences of the activity and its induced perception. Thus, the
manipulability of trip motives at the decision-making stage makes them more advantageous
variables when the production (versus prediction) of satisfactory experience is under
consideration.
The issue, then, is how the two motives may be combined to produce satisfactory
experience. This study does not assume that a balance, i.e., the combination of equal levels of
risk-taking and competence motives, would lead to better experience and greater satisfaction. As
reviewed in section 4.1, in general, participants in adventure activities report strong motivation
for competence, but less desire for risk for its own sake. Therefore, a stronger motive for
competence coupled with a less strong motive for risk-taking might lead to a more satisfying
experience than otherwise. The best combination of the strength levels of the two is an empirical
question and may be determined through empirical data analysis. It was thus hypothesized that:
H5a. Some combinations of risk and competence, at the motivational level, are more satisfactory
than others.
This hypothesis is shown as the motivational risk-competence model in Figure 4.3.
52
4.5 OBJECTIVE CONDITIONS OF RISK AND COMPETENCE FOR SATISFACTION
This study examined how the combination of risk and competence as assessed from an
objective perspective would affect satisfaction. A distinction was made between objective
assessment and subjective perception. In adventure tourism and outdoor recreation, it is a
common practice to develop a relatively objective assessment of the difficulty or challenge level
of an outdoor activity situation (Blanchard, Strong and Ford, 2007). Such an assessment can be
as elaborate as the rating schemes used in rock climbing (e.g., the Yosemite Decimal System), or
as simple as a categorization of treks into three levels of difficulty (easy, moderate, and
advanced). Although such assessment is ultimately made by people, and hence more or less
“subjective”, it is deemed relatively objective based on its process and result. That is, it is made
by using a rating scheme that was developed by experts and widely used in the field, rather than
based entirely on the participant/assessor’s personal perception and without knowledge of such a
scheme. Or, when there is no elaborate rating scheme, it is made by experts (such as outdoor
recreation managers or adventure tourism providers). This process is likely to result in an
assessment with consensus.
In contrast to the objective assessment is the subjective perception of participants in
adventure activities, which may vary depending on the person or perceiver. It is then interesting
to examine whether, and to what degree, objective assessment and subjective perception match
with regard to an adventure situation. As reviewed earlier (Jones, Hollenhorst and Perna, 2003),
the subjectively perceived challenges/risk and skills/competence by participants in whitewater
rafting was related to, and thus may have reflected, the objectively assessed difficulty of a
recreation situation. Based on this convergence, this study examined whether the condition for
53
optimal experience in Flow Model and AEP, which have been studied from the perspective of
personal subjective perceptions, is also valid from the perspective of objective assessment.
Besides being of theoretical interest, this examination has substantial practical
importance. In adventure tourism and outdoor recreation, the objective assessment of the
challenge/difficulty level of a situation is developed so that an appropriate level of challenge may
be matched with the skill level of a participant (Blanchard, Strong and Ford, 2007). The skill
level of a participant may also be objectively assessed, for example, by his or her participation
history and achievement. The assessments then can inform the decision on participation. The
match between challenges and skills may be important for safety, for accomplishment, or for
optimal development of personal competence, and thus may influence satisfaction as a summary
evaluation of the experience. This study empirically tested the impact of the match on
satisfaction. It was hypothesized that:
H5b. Some combinations of risk and competence, as objectively assessed, are more satisfactory
than others.
The hypothesis is shown as the Objective Risk-Competence Model in Figure 4.3.
4.6 CONTRIBUTION OF THIS STUDY
This study contributed to satisfaction research by proposing two mechanisms that may
work in the co-production of the tourist experience and its associated satisfaction. One is through
the combination of risk and competence motives; the other is through the combination of
objective levels of competence and risk. It is implicated that tourists themselves may affect their
own satisfaction by how they are motivated and how they choose a destination in a way whereby
risks are met by competence.
54
CHAPTER 5
METHOD
Four different mechanisms that may work in tourist experience and influence satisfaction
were discussed from Chapter 2 to Chapter 4. Respectively, backcountry backpacker satisfaction
may be influenced by: (1) physical and social disturbances, moderated by the motives for nature
and solitude experience; (2) trip motives; (3) the motivational risk-competence combination; and
(4) the objective risk-competence combination. Put together, the models provide a more
comprehensive understanding of how satisfaction is co-produced by management, environment,
and tourists themselves. The models are then empirically tested in this study.
The data used for this study were drawn from the Grand Canyon Backcountry Visitors
study (GCBV), which was conducted by the Park Planning and Policy Laboratory at the
University of Illinois for the Grand Canyon National Park (Stewart, McDonald, and Schwartz,
2003).The GCBV study provided a comprehensive exanimation of overnight backcountry
visitors to address backcountry management issues and suggest management actions (Backlund,
Stewart and Schwartz, 2008). In the following, the sample, measures for the constructs in the
satisfaction model, and data analysis are outlined.
5.1 POPULATION AND SAMPLE
The population for the GCBV study included overnight backcountry hikers who applied
for and received an overnight camping permit between March 1, 2004 and February 28, 2005
(Backlund, Stewart, and Schwartz, 2008). A total of 10,930 permits were issued in this period,
from which 2,034 trip leaders were sampled. Considering the uneven distribution of visitors
55
across the twelve months and the four user zones (Corridor, Threshold, Primitive, and
Wilderness), a disproportionate stratified sampling approach was adopted to ensure enough cases
for statistically valid and reliable results. A mail survey was used. The net sample size was 1,918
after deleting non-delivery cases due to incorrect address (91 cases), trip cancellations (23 cases),
and administrative permits (2 cases). The number of responses was 1,460, resulting in a response
rate of 76%. A total of 1,404 cases were included in the final data set after cleaning (56 cases
were dropped).
5.2 MEASURES
The dependent variable in this study, tourist satisfaction, was measured using three items
rated on a 5-point scale ranging from “Strong Agree” (coded as 5) to “Strongly Disagree” (coded
as 1). These items were “I thoroughly enjoyed my visit to the backcountry at Grand Canyon,” “I
cannot imagine a better trip than the one I took in the backcountry at Grand Canyon,” and “My
trip to the backcountry was well worth the cost.” One limitation here is that there is not an item
that explicitly measures satisfaction. For the purpose of this study, the three items included here
all represent a cognitive or affective summary of the overall experience. They were adapted to
the backcountry trip context from similar items used in satisfaction research (Oliver, 2010).
Using multiple items to measure satisfaction from different angles is more advantageous than a
single-item measure of satisfaction. Outdoor recreation research has found that reported
satisfaction levels of visitors were usually uniformly high, limiting their usefulness for
understanding the relationship between satisfaction and other factors (Manning, 2011). The use
of multiple items is likely to increase the sensitivity and variance of the satisfaction response,
which makes the detection of its empirical relationship with other variables more plausible.
56
The independent variables include perceived backcountry conditions, subjective
disturbances, tourist motives, risk and competence measures as discussed from Chapters 2 to 4.
The backcountry conditions and felt disturbances included the same list of 12 items. For
perceived conditions, tourists were asked “How would you rate the extent to which each of the
following conditions was apparent during your trip?” The conditions were measured on a 5-point
scale ranging from “not apparent at all” (coded as 1) to “extremely apparent” (coded as 5). For
disturbances, tourists were asked “how would you rate the extent to which the presence of each
of these conditions disturbed you?” Disturbance was measured on a 5-point scale ranging from
“not at all disturbing” (coded as 1) to “extremely disturbing” (coded as 5). For motivation,
tourists were asked “how important each of the following experiences was to you for your trip in
Grand Canyon backcountry.” The items of experiences were drawn from the Recreation
Experience Preference (REP) scales (Manfredo, Driver and Tarrant 1996). A total of 31 motive
items were included. Each item was rated on a 5-point scale ranging from “extremely
unimportant” (coded as 1) to “extremely important” (coded as 5).
Included in the REP scale are also measures for motives for risk and competence, which
will also be used to test the Motivational Risk-Competence Model. Three levels of risk taking
motive (high, medium, and low) and three levels of competence motive (high, medium, and low)
were determined, resulting in nine combinations of the two motives. Then the nine groups will
be compared in terms of satisfaction.
The objective competence variable was measured by tourist participation history,
assuming that competence develops through repeated participation. Seven measures of past
backpacking trips, in general and specific to Grand Canyon, were included. The raw values of
the participation history were first logarithmic-transformed to account for their right-skewed
57
distribution. The transformation also took into consideration the learning curve, which observes
that one learns more at the beginning of participation in an activity and less after a certain period
of time. The transformed scores thus were a better reflection of tourism competence and
expertise in an adventure activity.
The objective measure of risk was derived from the categorization of four use areas in
Grand Canyon: the Corridor Zone, the Threshold Zone, the Primitive Zone, and the Wild Zone.
The four zones are in the order of increasing primitiveness and decreasing development,
maintenance of trails, water sources, signs, allowed use of livestock, and increasing demand for
hiking experience and route-finding ability (Grand Canyon National Park, 2012). The use of
Primitive and Wild Zones are also discouraged during summer months due to extreme high
temperatures and lack of reliable water sources. When multiple zones were traveled by a
backpacker, the most risky zone is viewed as representing the risk level experienced. Winter also
presents severe risks due to the harsh weather and inconvenience for rescue. Three “objective”
risk conditions were formed by combining the four zones and the four seasons. The most risky
(Risk3) is hiking in primitive and wild zones in winter and summer. The least risky (Risk1) is
hiking in corridor and threshold zones in spring and fall. The other zone-season combinations
have a middle level of risk (Risk2). The combination of the three objective risk levels and three
objective competence levels led to nine groups, which were compared in terms of satisfaction.
5.3 DATA ANALYSIS
5.3.1 Missing Data
A listwise deletion approach was taken to the treatment of missing data (Weisberg, 2005).
As a result, among the 1404 cases in the original data set, 383 cases were omitted due to missing
58
values on one or more of the 67 variables used in this study, and 1021 complete cases were
analyzed.
The two subsets of data with and without missing values were compared in terms of
demographic and tripographic characteristics. There were slight differences in gender, age, and
income; but no significant difference in education, residence area, travel party size, travel season,
trip area, number of hikes in the past 12 months, or number of years visiting the Grand Canyon
National Park. There was no difference in two of the three measures of the dependent variable
(satisfaction). Therefore it was deemed that omitting the missing data may not affect the
empirical tests in this study in a significant manner.
5.3.2 Factor Analyses
The four scales that measure perceived backcountry conditions, subjective disturbances,
trip motives, and past backpacking history were analyzed using either Principle Component
Analysis (PCA) or Exploratory Factor Analysis (EFA). Both procedures are commonly used for
the purpose of variable reduction, but they are different (Hatcher, 1994). EFA assumes that there
exist some hypothetical latent variables (common factors) responsible for the covariation
between two or more observed variables, and EFA may be used to identify this latent factor
structure. PCA does not hold this assumption. It produces an artificial variable, i.e., principle
component, which is a linear combination of the (optimally weighted) observed variables. For
simplicity, both the common factors and principle components will be called factors in the
following text.
For the two 12-item scales of perceived backcountry conditions and subjective
disturbances, there may be no common factors underlying the measures, although they can be
59
classified into the three categories (environmental impacts, social encounters, and diverse
activities). So PCA seems more appropriate and the purpose is simply variable reduction. While
separate analyses of the two scales may produce different factor structures, it is desirable that
identical structures are determined for the two scales as they have an identical list of items that
represent logically correspondent variables (perceived conditions versus subjective disturbances).
Correlation analyses found that the correlation coefficients for the 12 pairs of corresponding
items ranged from 0.32 to 0.70, which were higher than any other non-corresponding items. For
example, the correlation between the perceived condition (apparentness) of “aircraft overhead”
and its felt disturbance was 0.70, higher than its correlation with any other 11 felt disturbance
items (ranging from -0.12 to 0.22). An identical three-factor structure for the two scales was
produced when three items were deleted that had low or double factor loading in either scale.
The three items were: “Litter along trails,” “Number of other groups camped within sight or
sound of you,” and “Vegetation damage from trampling or cutting.”
The principle factor method was used to extract the factors from the remaining nine items,
followed by a varimax rotation (Hatcher, 1994). A three-factor solution was suggested by a scree
test in both scales. The solutions accounted for 56.1% of the variance in the scale of perceived
backcountry conditions and 77.5% of the variance in the scale of felt disturbances. The three-
factor structures are shown in Table 5.1. Factors 1 and 3 belong to the category of environmental
impacts (Waste and litter, and Surface damage); Factor 2 belongs to the category of diverse
activities. The reliability coefficient Cronbach’s alpha is used to measure the internal consistency
of the items and a value of 0.60 and above is satisfactory (Hatcher, 1994). Low reliability (less
than 0.60) was found for Factor 2 in both scales and Factor 1 in the perceived conditions scale. It
could be due to a low correlation between the items and the small number of items. Interestingly,
60
the felt disturbances factors had higher reliability (internal consistency) than their counterparts of
the perceived conditions factors. The difference might indicate that the felt disturbances were a
more blurred feeling than the distinctive perceptions of conditions.
There is no factor corresponding to the social encounter construct in the Specified
Motives-Moderated Disturbance Model. The single item, “number of other groups camped
within sight or sound of you,” was used to represent this construct in hypothesis testing. It was
deemed that the deletion of this item from PCA early only indicated its lack of correlation with
other items. While multi-item measurement is encouraged in research, this single item may still
be useful.
For the trip motives, it seemed more reasonable to use EFA rather than PCA. As shown
in the literature review, there is a core set of trip motives and relatively well developed
measurement scales for them. The survey instrument in this study was based on the Recreation
Experience Preference (REP) scales that have been widely used in outdoor recreation research
(Manfredo, Driver and Tarrant, 1996). Therefore an initial expectation was that the common
factor assumption for EFA may hold in this situation. However, EFA didn’t yield the expected
clear factor structure and PCA was found to perform better in this regard. A possible reason may
be that as items were selected, adapted, or created for the specific research context in this study,
they might be representing factors that were not exactly the same with those in the established
scales.
The principle factor method was used to extract the factors from the 31 items, followed
by a varimax rotation (Hatcher, 1994). Two items (“Releasing or reducing some built-up
tensions” and “Being with others who enjoy the same thing you do”) were deleted due to low
factor loadings (less than .50); their corresponding factors also had higher reliability coefficients
61
after their exclusion. A final eight-factor structure was suggested by a scree test. The solutions
accounted for 68.3% of the variance in the remaining 29 items. The factors and their reliability
coefficients are shown in Table 5.2. The factor structure was slightly different from the factors
hypothesized in the Specified Trip Motives Model. Six factors were correspondent; the Social
Connectedness factor included items about meeting people and social security; the Wilderness
factor emerged as different from the Nature factor.
For the seven items of past backpacking history (logarithmic transformed) that represent
objective competence, EFA seemed more appropriate than PCA as there may be a common
factor of participation (in general and specific to Grand Canyon) underlying the items. The
principle factor method was used to extract the factors from the seven items, followed by a
varimax rotation (Hatcher, 1994). A scree test suggested a two-factor solution which explained
90.4% of the variance but one item (years of participation in backpacking) was excluded due to
low factor loading. This item was deemed an important indicator of backpacker experience and
competence. Moreover, as a common factor of participation was assumed, a one-factor structure
was preferred (Table 5.3), although it explained less variance (68.0%). The reliability coefficient
was .81 for the factor.
It does not make sense to use the average score of the past participation items, either their
raw scores or the logarithmic transformed scores. It was assumed the participation items have
overlaps and different degrees of influence on competence, and the standardized scoring
coefficients from the factor analysis provided optimal weighting of the items for calculating the
factor score of competence. The factor score had a mean value of zero and a standard deviation
of one. The participants were divided into three groups of equal size based on the competence

62
score (low, medium, and high). They were then combined with the three objective risk levels
described in the Measures section to form nine objective risk-competence combinations.
5.3.3 Regression Analysis
The hypotheses were tested by multiple regression analysis. All factors that influence
satisfaction directly were included in one regression model as expressed in the following
equation:
∑ ∑
∑ ∑
S is satisfaction. Di is each of the four subjective disturbances factors: waste and litter, surface
damage, social encounters, and diverse activities. N is the nature motive and Sol is the solitude
motive, which are moderators in the model. Mj is each of the eight trip motives: solitude,
knowledge, nature, wilderness, competence, risk, family, and connected. For the two constructs
of risk-competence combination, eight dummy variables are created to account for the nine
groups of backpackers in each construct: MRCk for the motivational risk-competence
combination and ORCl for the objective risk-competence combination. bi, c1, c2, c3, c4, dj, fk, and
gl are regression coefficients and e is error.
As the model in this study includes interaction effects, the procedure of mean centering is
needed to mitigate the potential problem of multicollinearity between predictor variables and the
constructed cross-product terms (Shieh, 2011). Hence the factor scores of the three disturbances
and eight motives, which were produced from the principal component analyses in a mean-
centered form, were used in the regression model. The factors within the two groups were also
orthogonal to each other, and thus there was no concern for multicollinearity between these
63
factors. The encounter factor, measured by one item, was also standardized so that its quadratic
term (discussed later) can be tested in the regression model without causing multicollinearity. Its
correlation with other three disturbance factors ranged from 0.29 to 0.34 (p < 0.0001). Between
the two groups (disturbances and motives), all of the 32 (4 by 8) bivariate correlations were weak
or nonsignificant, among which the largest one was between the social connectedness motive and
the diverse activity disturbance (r = -0.21, p < 0.0001).
The bivariate relationship between the dependent variable, satisfaction, and each of the
fourteen independent variables (four disturbances, eight motives, one objective risk factor and
one objective competence factor), were examined in scatter plots. A majority of the respondents
(89%) had a satisfaction score of four or above on a five-point scale (Mean = 4.34, SD = 0.57). A
histogram of the satisfaction factor showed that it was negatively skewed (skewness = -0.99)
with heavy tails (kurtosis = 1.32), and was not normally distributed (Shapiro-Wilk’s W = 0.90, p-
value < 0.0001). This distribution of satisfaction was reflected on each scatter plot as a ceiling
effect. The four disturbance factors had a ceiling effect too, as a majority of the respondents
reported a low level of disturbance; hence the data points were concentrated at the upper-left
quadrant of the scatter plot. Overall, it was difficult to visually detect a linear trend these scatter
plot (see Figure B1 Appendix B as an example).
An ordinary least squares (OLS) simple regression line and a loess smooth were plotted
on each scatter plot to aid understanding (Weisberg, 2005). The loess smooth models the
relationship between the dependent and independent variables without making parametric
assumptions about the linearity of the relationship. In nine cases, the two lines agreed, a linear
trend was thus assumed. In the other five cases (the disturbance of surface damage; encounter,
competence, connected, and wilderness motives), the loess smooth showed a quadratic effect.

64
When the quadratic term was added to the simple regression model of satisfaction on each of the
five factors, two were significant (for the encounter disturbance and the connectedness motive, p
< 0.05) and two were marginally significant (for the surface damage disturbance and the family
motive, p < 0.10). For example, as the social connectedness motive became stronger, the increase
in satisfaction became larger (Figure B1 in Appendix B).
Six outliers were also detected from four scatter plots and were individually examined.
They seemed to be in reasonable range and their deletion did not affect the general trend as
shown in the results from simple linear regression. Thus these data points were kept in the
analysis. As normality is not important for large sample size (Weisberg, 2005), it was not further
examined in this study.
The relationship between motivational risk-competence combination and satisfaction was
preliminarily analyzed by Analysis of Variance (ANOVA). It was found to be significant (F =
3.02, p < 0.01; R2 = 0.023). The multiple comparison method Tukey’s test was used to test the
significance of difference in each pair of the nine groups. Among the 36 pairs, significant
differences in satisfaction were found between the medium risk-high competence group and
other groups (high-medium, high-low, and low-low risk-competence combinations; p < 0.05).
All the differences were positive, indicating that the medium risk-high competence motive
combination might be the optimal motivation condition for satisfaction. This level was then
selected as the reference level in later regression analysis.
ANOVA was also conducted for the relationship between objective risk-competence and
satisfaction, which was found to be nonsignificant (F = 0.82, p = 0.58). The high risk-low
competence combination had the lowest satisfaction score and largest difference with other
65
groups, and was assumed to be the least congenial condition for optimal experience and
satisfaction. It was selected as the reference level in later regression analysis.
Additional regression analysis was carried out for each of the four felt disturbances in the
backcountry. The regression equations are:
1 4
Dh is each of the four factors of subjective disturbances. Ch is the perceived backcountry
condition corresponding to each subjective disturbance and Mh is the corresponding moderating
motive (nature motive for waste and litter and surface damage, solitude motive for social
encounters and diverse activities). ph, qh, and sh are regression coefficients and eh is error.

66
CHAPTER 6
RESULTS
6.1 SAMPLE DESCRIPTION
The demographic and tripographic characteristics of the overnight backpacker sample are
summarized in Table 6.1. The majority of the respondents were male (80.8%), white (91.4%),
had a college education or above (95.6%), and less than half came from large cities with a
population size of 150,000 (45.4%). The sample had more even distribution in terms of age and
income. The majority of the backpacker respondents came from Arizona and the four
neighboring states (50.0%), traveled with family and/or friends (82.1%) in small groups of 2 to 4
people (67.7%), and spent one to three nights in the backcountry (72.5%).
On average, the respondents started backpacking about 19.5 years ago (median = 13.7),
and started backpacking in Grand Canyon about 8.5 years ago (median = 3) (Table 5.3). In the
last five years, they backpacked 15.8 trips in total (median = 10) and 4.3 trip in Grand Canyon
(median = 2). They had visited an average of 12.4 (median = 6) different parks, backcountry,
and/or widerness areas for an overnight backpacking trip. For this particular trip to Grand
Canyon, their most important motives were wilderness, solitude, competence, nature (with
means greater than 4 on a 5-point scale); family, risk, and social connectedness were less
important (Table 5.2).
About the backcountry conditions, on average, backpackers perceived surface damage
and social encounter as being slightly to moderately apparent, diverse activities as being about
“slightly apparent”, and waste and litter as being nearly “not at all apparent” (Table 5.1). All
these four factors were less than “slightly disturbing” on average (Table 5.1).
67
6.2 RESULTS FROM THE MULTIPLE REGRESSION
Five quadratic terms that were suggested in the scatter plots were included in the
regression model, but none were significant at the 0.05 significance level, though two were
marginally significant (encounter disturbance and family motive, p < 0.10). Hence, the terms
were not included in the reported regression analysis (Table 6.3). The overall analysis of
variance (Table 6.2) indicated evidence against the null hypothesis that satisfaction was not
associated with any of the terms in the model (F = 3.27, p < 0.0001). The model explained 9.6%
of the variance in satisfaction. The findings are reported below, sequentially for the Specified
Motives-Moderated Disturbance Model, the Specified Trip Motives Model, the Motivational and
Objective Risk-Competence Models.
6.2.1 Backcountry Disturbances and Moderating Motives
As shown in Table 6.3, two of the four disturbances approached significance in relation
to satisfaction. Specifically, the subjective disturbance caused by surface damage was negatively
related to overall trip satisfaction (β = -0.063, p < 0.10), tentatively supporting Hypothesis H1b
regarding the negative impact of environmental impact-related disturbances on satisfaction.
Hypothesis H2b was about the negative impact of social encounters disturbances on satisfaction
and was supported by the test (β = -0.095, p < 0.05). But the disturbance of diverse activities was
not significantly related to overall satisfaction. Hence, Hypothesis H3b regarding this
relationship was not supported in this test. None of the interactions were significant. Hence, the
moderating roles of the nature motive (in Hypothesis H1d with regard to environmental impact-
related disturbances) and the solitude motive (in H2d regarding encounter disturbances and H3d
regarding diverse activities-related disturbances) were not supported in this test.
68
The role of perceptions and motives were then examined in the formation of subjective
disturbances. The results of regression analyses regarding each of the four conditions were
presented in Table 6.4. The F-test in each of the overall analysis of variance indicated that the
four regression models were all significant (all p < 0.0001). The perception of each condition
was significantly positively related to the subjective disturbance aroused by the condition (all p <
0.01). That is, when more environmental impacts (waste and litter, β = 0.393, and surface
damage, β = 0.529, Hypothesis H1a), social encounters (β = 0.367, H1b) and diverse activities (β
= 0.591, H1c) were perceived, they were more disturbing to backpackers. The findings provided
evidence for the negative nature of these conditions in terms of their impact on visitors’
immediate experience.
Two of the moderating effects of motives were significant. Specifically, Hypothesis H3c
regarding the moderating role of the solitude motive in the relationship between perceived
diverse activities and subjective disturbance was supported (β = 0.058, p < 0.05). That is,
compared to backpackers with a weaker solitude motive, those who had a strong solitude motive
were more strongly disturbed when they perceived the presence of diverse activities in the
backcountry. Hypothesis H2c regarding the moderating role of the solitude motive in the
relationship between perceived social encounters and subjective disturbance was not supported
(p > 0.10). Hypothesis H1c proposed that backcountry visitors with a stronger nature motive are
more disturbed by environmental impacts. The finding with regard to waste and litter did not
support this hypothesis (p > 0.10). The finding regarding surface damage was opposite to the
hypothesis (β = -0.087, p < 0.01). That is, perceived surface damage was less disturbing for
visitors with a stronger motive for nature experience compared to those with a weaker motive.
69
Motives may influence subjective disturbance besides their moderating role. Specifically,
regardless of the perceived conditions, a stronger nature motive was related to higher level of
subjective disturbance by waste and litter (β = 0.052, p < 0.10); and a stronger solitude motive
was related to higher level of subjective disturbance by social encounter (β = 0.094, p < 0.05)
and diverse activities (β = 0.083, p < 0.05). But a nature motive did not make backpackers more
sensitive to surface damage (β = 0.004, p > 0.10).
6.2.2 Trip Motives
As shown in Table 6.3, six of the eight hypotheses (H4a to H4h) regarding the
relationship between trip motives and overall trip satisfaction were supported (p < 0.05 or p <
0.10). Specifically, visitors were more satisfied when they had strong motives for the following
experience: knowledge (β = 0.087, H4b), nature (β = 0.121, H4c), competence (β = 0.158, H4d),
family (β = 0.080, H4f), and social connectedness (β = 0.080, incorporating two hypothesized
motives: meeting people [H4g] and social security [H4h]). Two motives, solitude (H4a) and risk
(H4e), were not related to satisfaction. The wilderness motive, which emerged from the factor
analysis as different from the nature motive, was not significant as well.
6.2.3 The Risk-Competence Combinations
As shown in Table 6.3, compared to the (medium, high) risk-competence motives
combination, almost all other motivational combinations had lower overall trip satisfaction.
Although three of the comparisons were significant in the ANOVA test, none were significant in
the regression analysis. Thus hypothesis H5a regarding the impact of motivational risk-
competence combinations was not supported in this test.

70
Compared to the high-low objective risk-competence combination, all other combinations
had higher overall trip satisfaction, among which the low-low and low-medium combinations
had marginally significant higher satisfaction (β = 0.123 and 0.121, respectively, p < 0.10). Thus
hypothesis H5b regarding the objective risk-competence combinations was supported.
71
CHAPTER 7
DISCUSSION AND CONCLUSION
This chapter summarizes and discusses findings from the data analyses in correspondence
to each of the four proposed models of satisfaction: the Norm Disturbance Model, the Basic
Psychological Needs Expression Model, and the Motivational and Objective Risk-Competence
Models. Theoretical and practical implications are discussed and directions for further research
are suggested for separate lines of study. The overall contribution and limitation of this study is
discussed at the end.
7.1 THE MOTIVES-MODERATED NORM DISTURBANCE MODEL
The statistical analyses in this study showed that backcountry backpackers in Grand
Canyon were disturbed by the perceived presence of waste and litter, surface damage, social
encounter, and diverse activities. Moreover, backpackers with a strong solitude motive were
more disturbed when they perceived the presence of diverse activities than those who had a
weaker solitude motive. The disturbance caused by surface damage and social encounter
negatively impacted their overall trip satisfaction, while the disturbances caused by litter and
waste and diverse activities did not. The relationship between any of the disturbances and
satisfaction was not moderated by the nature or solitude motive.
The distinction between the immediate experiences spread over a lengthy trip and its
overall experience and evaluation may help understand and interpret the findings. Specifically,
the perceived presence of the backcountry conditions may have been instantly disturbing to
visitors and have had a substantial immediate impact on their experience quality, but may have
72
had no, or a relatively small, further impact on visitors’ satisfaction with the entire trip. While
the immediate impact part conformed to the findings of the bulk of recreation studies as
reviewed in Chapter 2 (Manning, 2011), the further impact part examined in this study extended
understanding of the experience process, and clarified the role of the impact on satisfaction with
the overall tourist experience.
This understanding has practical implications. It was proposed in Chapter 2 that the
importance of backcountry conditions (and hence resources allocated for the treatment of the
conditions) may be evaluated based on the degree to which it affects overall satisfaction. Along
this line of thinking, surface damage and social encounters seem to warrant more attention in
recreation management due to their significant impact on satisfaction, while waste and litter and
diverse activities do not. This does not mean that waste and litter do not matter because
recreationists have been found to be very sensitive to them (Hammitt and McDonald, 1983;
Knudson and Curry, 1981; Lucas, 1979). In this survey, waste and litter were reported to be the
least apparent across respondents (Mean = 1.25, SD = 0.39, on a 5-point scale, Table 5.1), while
surface damage (Mean = 2.55, SD = 1.04) and social encounter (Mean = 2.31, SD = 1.16) had
more perceived presence. The disturbance caused by waste and litter was also lower than in the
other three conditions (surface damage, social encounter, and diverse activities; Table 5.1). Thus,
the high performance of the waste and litter condition as perceived by the backpackers and its
low variability may account for the lack of its impact on satisfaction.
On the other hand, a suggestion is that tourists’ overall satisfaction, due to its lack of
sensitivity to the impact of specific conditions in the backcountry, may not be the best criterion
for evaluating the impact and importance of these conditions in tourism and recreation. Rather,
perceptions of the quality of specific attributes of the experience may be more reflective of, and
73
useful for, evaluating tourism and recreation conditions and producing a satisfactory tourist
experience, such as the subjective disturbance measures used in this study. Yet, the satisfaction
variable has been used dominantly in tourism research for this purpose. Future research should
develop and examine more measures of the quality of experience attributes (and delve into the
more specific processes of co-production), as well as their importance for the tourist and their
roles in tourism.
An unexpected finding was the moderating role of the nature motive in the relationship
between perceived surface damage and subjective disturbance. Surface damage was found to be
less disturbing for visitors with a stronger motive for nature experience. Further, a nature motive
did not make backpackers more sensitive to surface damage (though it made them more sensitive
to waste and litter). A possible explanation is that backpackers may have accepted surface
damage (e.g., trail erosion) as a necessary price (unlike litter and waste that can be picked up and
packed out) that had to be paid for their experience of nature. They may also rationalize that such
damage is temporary and recoverable. Hence, surface damage may not affect backpackers’
quality of experience. Further, surface damage may “enhance” visitor experience, for example,
by providing a clear place for camping and a sense of safety associated with the observation that
other people have been there before. The findings here may be an echo of the general
observation or sentiment that national parks may be “loved to death,” as documented in Ken
Burns’ film (2009), and reflects the complexity of use and conservation of natural areas. That is,
visitors may selectively ignore the aspects of conservation, such as surface damage, that seem to
be beyond their control and are unavoidable, and whose elimination may mean denial of their
access to natural areas.
74
7.2 THE BASIC PSYCHOLOGICAL NEEDS EXPRESSION MODEL
The data analysis found that backcountry visitors who had stronger motives related to the
basic psychological need of competence (knowledge, nature, and competence) and social
relatedness (family, meeting people, and social security) were more satisfied. Two motives,
solitude (hypothesized as an expression of autonomy) and risk (hypothesized as a threat to
competence), were not related to satisfaction.
Whether a certain motive had a positive, negative, or null effect on tourist satisfaction
depends on at least three conditions: (1) whether the conceptualization of basic psychological
needs (including their importance for well-being) is true; (2) whether the three specified basic
psychological needs are true; and (3) whether the specified relationship between the motive and
the needs is true. There is more confidence in the first two conditions, based on the literature
review, and relatively less confidence in the last condition, considering the specification process
utilized in this study. Moreover, it is possible that such specifications may not be clear cut or
mutually exclusive; that is, one motive may be related to two or more basic psychological needs
at the same time.
Judging from the face validity of the motives, the significant positive association between
the six trip motives and tourists’ overall satisfaction may be due to their expression of the basic
psychological needs for competence or social relatedness. The solitude motive (getting away
from crowded situations, being alone, and experiencing solitude, peace and calm) had no
significant relationship with satisfaction. An explanation is that this motive may be at most an
indirect expression of autonomy (perceiving oneself as the origin or source of one’s own
behavior); and it may also be negatively related to the need for social relatedness. For the risk
motive (chancing dangerous situations, experiencing the risks involved, having thrills, and being
75
your own boss), it has both sides of experiencing competence and losing control. Put together, it
may not be definitively working for or against the need for competence, which may explain its
nonsignificant association with satisfaction.
Based on the theorization and the empirical findings, tourist trip motives may indeed
affect satisfaction depending on whether they express the basic psychological needs. This
conclusion has practical implications. The motives that express basic psychological needs and
enhance satisfaction should be encouraged and appealed to in adventure tourism development,
marketing, and management.
Future research is needed to replicate this study and may be advanced in the following
ways. First, more tourist motives or trip goals should be examined, including extrinsic motives or
those that may be detrimental to the basic psychological needs (e.g., social emulation). Second,
other measures of well-being and optimal experience should be used other than satisfaction.
Third, the realization of motives and their effect on tourist well-being and satisfaction may be a
topic for in-depth study. Tourist motives are an important starting point and get tourists ready for
the satisfaction of basic psychological needs. The degree to which the motives are met in the
tourism experience should also be an important area for empirical study. Fourth, conditions that
facilitate the satisfaction of basic psychological needs should be studied in the tourism and
recreation field.
7.3 MOTIVATIONAL AND OBJECTIVE RISK-COMPETENCE MODELS
The statistical analyses (ANOVA and multiple regression analysis) found that
motivationally, the medium-high risk-competence combination was most satisfactory; and
objectively, the high-low risk-competence combination was the least satisfactory. Considering
76
the exploratory nature of this study, especially that the measurement instrument was not designed
specifically for testing the models, the result may be an indication that this study proceeded in
the right theoretical direction and may have contributed to the production of satisfactory
experience in adventure activities, however there were limitations that should be noted.
Specifically there were three methodological issues in this study that may have affected
the empirical test of the models. First, objective risk was measured by only use areas and seasons,
which were simplistic and crude. More sophisticated measurement may be used in further studies
to better reflect the risk or challenge levels of an adventure situation. For example, measurement
scales developed for the specific activity may be a better assessment and experts may be
consulted in their design and interpretation.
Second, the survey was conducted several weeks after the actual trip, so the motives were
measured after the fact, which may make the responses subject to recall bias. For example, as
time passes by, backpackers may be more likely to recollect the enjoyable times while forgetting
unhappy experiences. Some satisfied backpackers may have exaggerated their motives for risk-
taking and competence. A pre-trip test would eliminate this potential bias. In contrast, the
objective assessments of risk and competence were relatively stable and were not subject to
subjective evaluation of the backpackers, and hence were more reliable. This advantage of the
objective assessments also made them more valid measures that should be included in future
research on the co-production of tourist experience.
Third, this study used one-time cross-sectional data and the comparison of a backpacker’s
risk-taking and competence is based on his or her relative position in the population, both in
terms of motivation and objective assessment. In contrast, flow research that adopts the
Experience Sampling Method samples an individual’s experiences over time (Csikszentmihalyi
77
and Csikszentmihalyi, 1988). Then the comparison of challenges and skills is conducted at the
personal level in reference to the personal averages of the two variables (see Figure 4.1). Despite
this difference, the study is still theoretically interesting and practically useful as both intra-
personal and inter-personal comparisons are common in the field. For example, adventure
tourism providers may be more often comparing highly motivated customers with less motivated
ones, or novices with veterans, rather than examining the changing performances of any single
customer over a trip. As both approaches are meaningful, future research may be conducted to
compare them.
With these shortcomings in mind, the findings from this study provide some theoretical
and practical implications. It indicated that the combination of risk and competence may be
important for tourists to have a satisfactory experience, both at the motivational level and from
the objective assessment perspective. The two angles are different from the perceptual
perspective that is in the Flow Model and the Adventure Experience Paradigm. As motives or
trip goals and objective conditions can be adjusted or selected at the planning stage of a trip and
are the precursors to the actual experience, the two perspectives can be very useful in producing
satisfactory experience in tourism and recreation. That is, for the purpose of creating more
satisfactory experiences, tourists need to align their levels of motivation for risk-taking and
competence, and coordinate their actual competence and risk-taking by using objective
assessment tools. Adventure tourism providers should develop such tools for tourists to use, and
encourage adequate motivational and objective risk-competence combinations during a service
encounter.
Moreover, the role of risk and competence relative to each other in satisfactory
experience became clearer in this study. That is, higher competence with lower risk taking may
78
be more satisfactory than other combinations of the two variables, both at the motivational level
and objective assessment. This observation is different from Flow Model and AEP which
propose that a balance (equality) of challenges (risk) and skills (competence) leads to optimal
experience (peak adventure). Further, the combination of motivation and objective behavior may
also matter. Based on the findings of this study, the more satisfied backpackers were those who
were relatively highly motivated (medium-high risk-competence motives) and who backpacked
in low-risk areas. The interaction between motivation and behavior is left for future study. With
improved measurements, the motivational and objective conditions for satisfactory experience
may be further specified in detail related to the tourism and recreation area.
7.4 OVERALL DISCUSSION AND CONCLUSION
The multiple regression model in this study explained 9.6% of the variation in trip
satisfaction. This low percentage is not uncommon in social sciences. Researchers have
discussed the limitations of, and even questioned the use of, the variance explained criterion for
model evaluation (e.g., Fichman, 1999; O’Grady, 1982). Moreover, when the research interest is
in determining if a particular theoretical effect can be observed, the explanation of variance is
irrelevant (Fichman, 1999). From this perspective, the models proposed in this study can be
deemed useful in understanding experience and satisfaction in tourism and recreation regardless
of the low explained variance. Further, as reviewed in Chapter 1, satisfaction is a summary
fulfillment response, a multi-dimensional phenomenon, and is influenced by many determinants.
Therefore, a single study may be able to explain only part of this complexity.
This study enriches the understanding of tourist experience by examining a set of factors
and establishing three models that have seldom or not been explored in existing literature. It is

79
especially conducted under the view of co-production and emphasizes the role of the tourists by
modeling the effects of their motives and behaviors in co-producing a satisfactory experience.
Specifically, this study examined several ways the tourists at the Grand Canyon took part in the
co-production process, either in interaction with managerial and environmental factors, or in
side-by-side manners. First, the nature and solitude motives of the Grand Canyon backpackers
made them more sensitive to the disturbance of waste and litter and social encounter; these two
motives also moderated the disturbance of surface damage and diverse activities. In other words,
the experience of subjective disturbance was co-produced by these environmental and
managerial factors as well as by the tourists’ motives. Second, the tourists’ motives influenced
their experience and satisfaction, even when the realization of the motives (which may be
influenced by environmental and managerial factors) was not considered in this study. The
conditions that facilitate the realization of tourists’ motives that express the basic psychological
needs are an aspect of co-production that warrants further research. Third, the findings indicated
that adventure tourists may align their risk-taking motive and competence motive and coordinate
their objective competence and risk taking choices to produce satisfactory experience. It is thus
suggested that co-production occurs not only between tourist factors (e.g., competence) and
environmental factors (e.g., risk), but also within tourist factors (e.g., the risk-taking and
competence motives). Overall, the three models and the findings revealed that the co-production
of tourists’ experience operates at multiple levels and in diverse ways.
Besides the issues discussed for each of the three models above, there are several
limitations in this study in general, and future research may be improved in the following ways.
First, the development of the concept of co-production is limited in that only new players
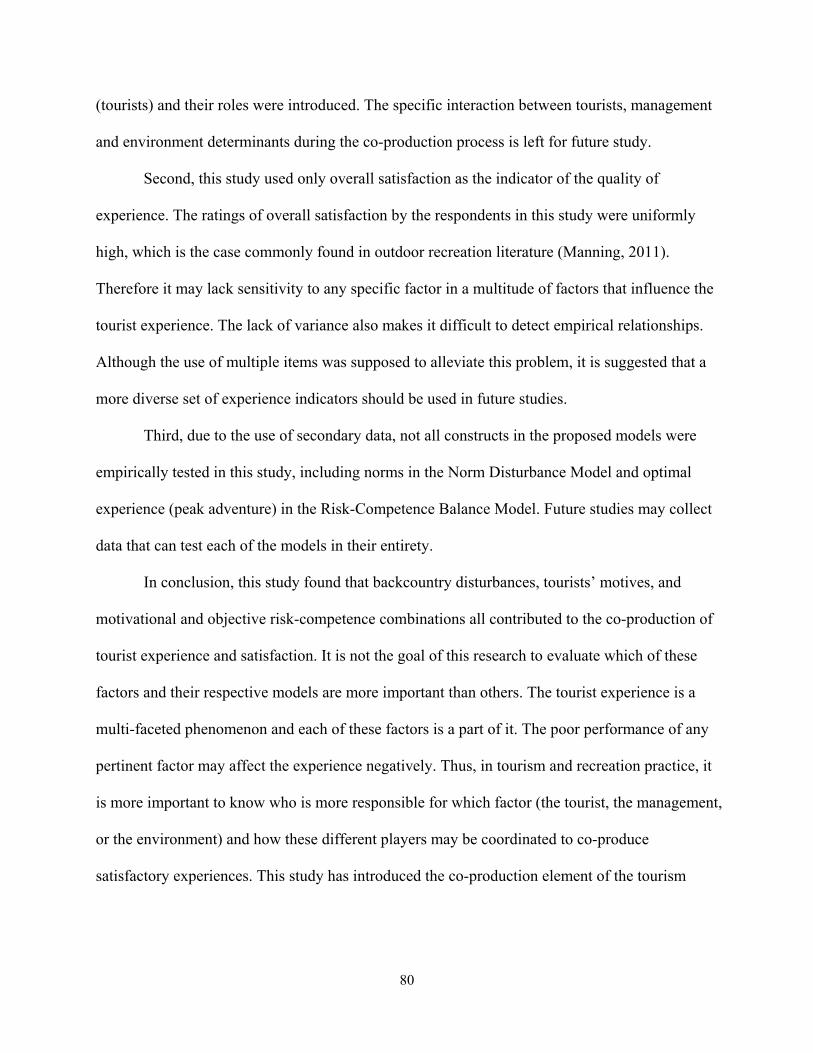
80
(tourists) and their roles were introduced. The specific interaction between tourists, management
and environment determinants during the co-production process is left for future study.
Second, this study used only overall satisfaction as the indicator of the quality of
experience. The ratings of overall satisfaction by the respondents in this study were uniformly
high, which is the case commonly found in outdoor recreation literature (Manning, 2011).
Therefore it may lack sensitivity to any specific factor in a multitude of factors that influence the
tourist experience. The lack of variance also makes it difficult to detect empirical relationships.
Although the use of multiple items was supposed to alleviate this problem, it is suggested that a
more diverse set of experience indicators should be used in future studies.
Third, due to the use of secondary data, not all constructs in the proposed models were
empirically tested in this study, including norms in the Norm Disturbance Model and optimal
experience (peak adventure) in the Risk-Competence Balance Model. Future studies may collect
data that can test each of the models in their entirety.
In conclusion, this study found that backcountry disturbances, tourists’ motives, and
motivational and objective risk-competence combinations all contributed to the co-production of
tourist experience and satisfaction. It is not the goal of this research to evaluate which of these
factors and their respective models are more important than others. The tourist experience is a
multi-faceted phenomenon and each of these factors is a part of it. The poor performance of any
pertinent factor may affect the experience negatively. Thus, in tourism and recreation practice, it
is more important to know who is more responsible for which factor (the tourist, the management,
or the environment) and how these different players may be coordinated to co-produce
satisfactory experiences. This study has introduced the co-production element of the tourism

81
experience, and future research should further reveal the interactive process between tourists,
management, and environment.
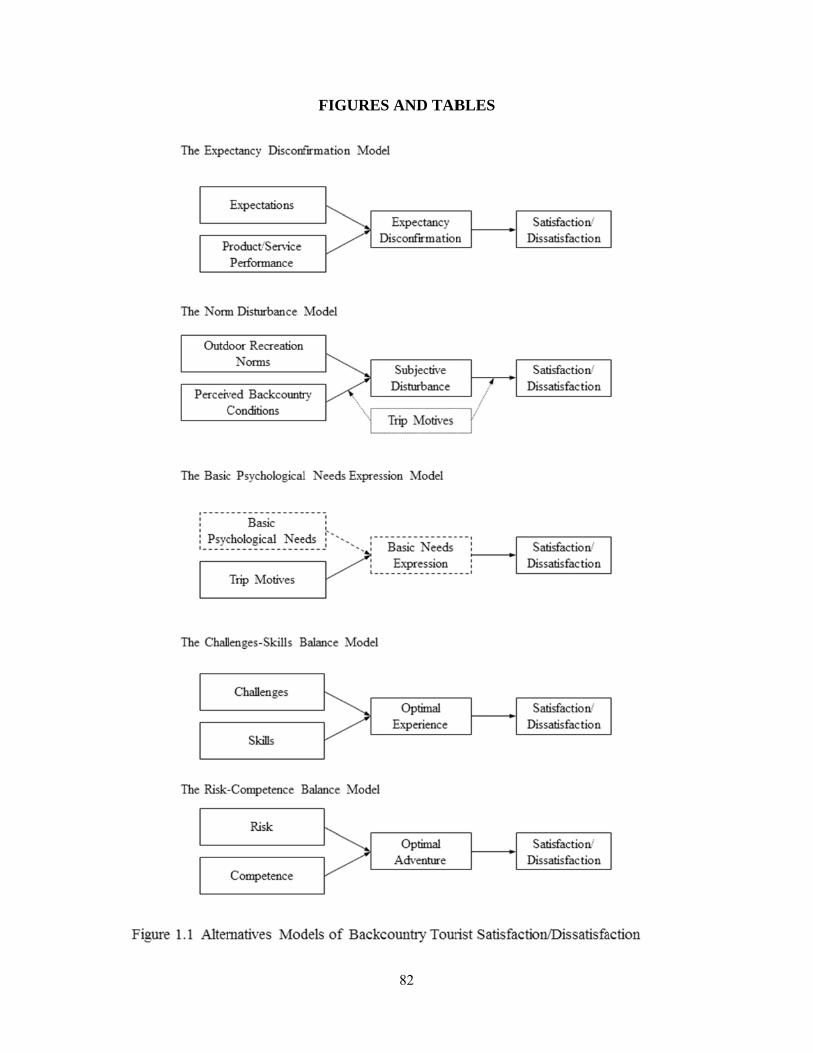
FIGURE
82
S AND TABBLES
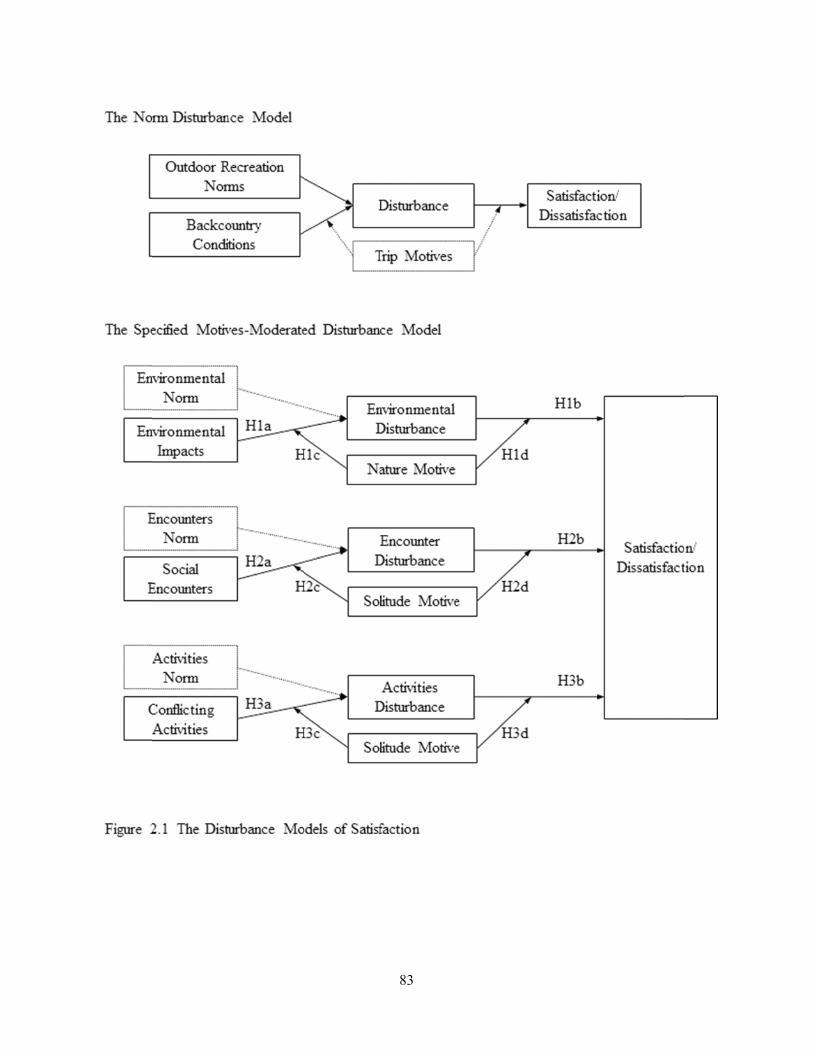
83
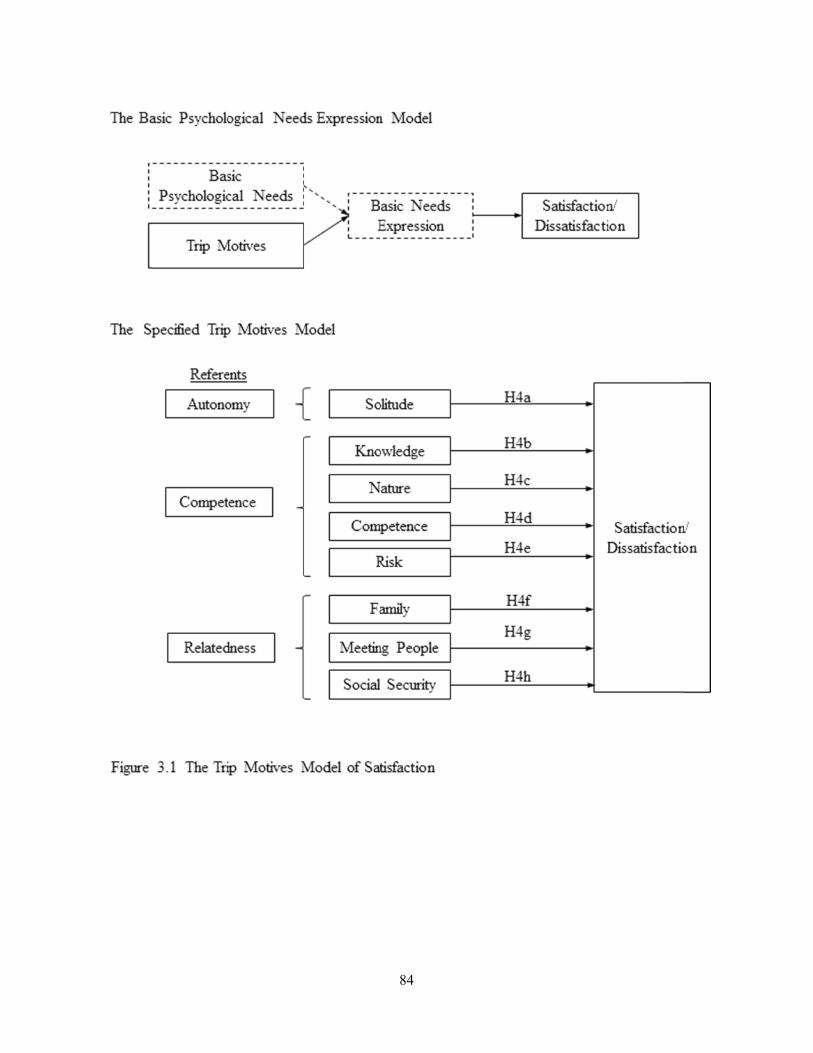
84
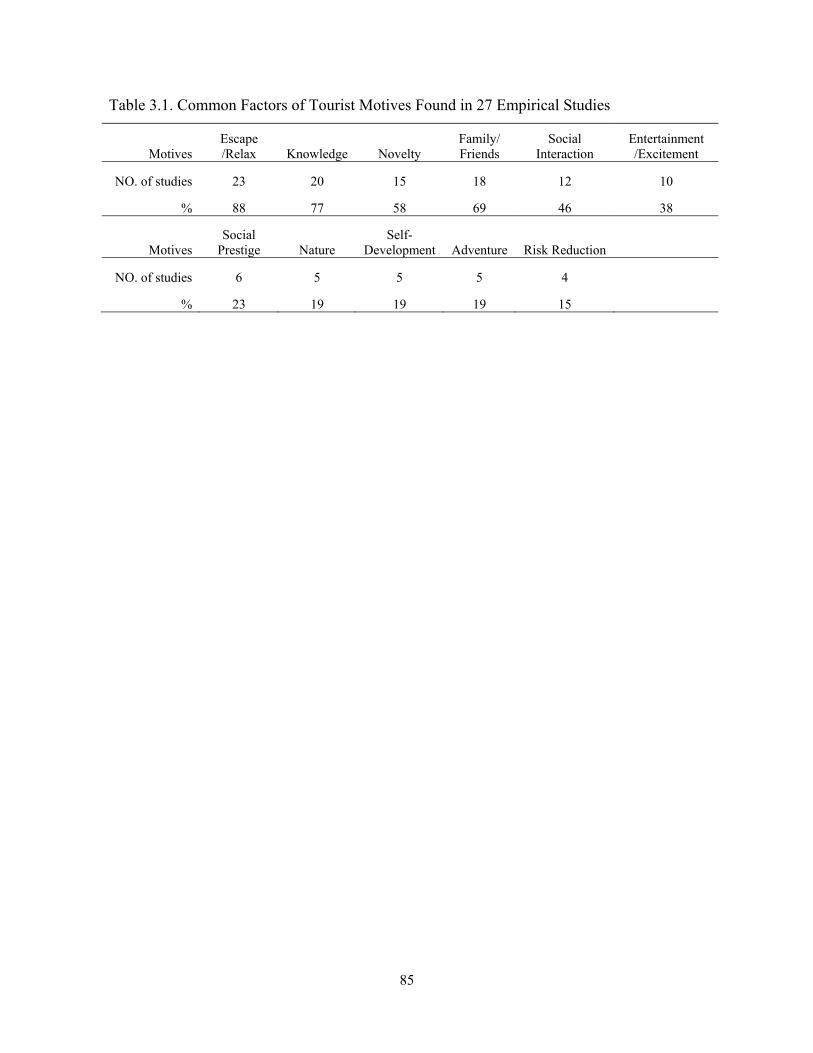
85
Table 3.1. Common Factors of Tourist Motives Found in 27 Empirical Studies
Motives Escape /Relax Knowledge Novelty
Family/ Friends
Social Interaction
Entertainment /Excitement
NO. of studies 23 20 15 18 12 10
% 88 77 58 69 46 38
Motives Social
Prestige Nature Self-
Development Adventure Risk Reduction
NO. of studies 6 5 5 5 4
% 23 19 19 19 15
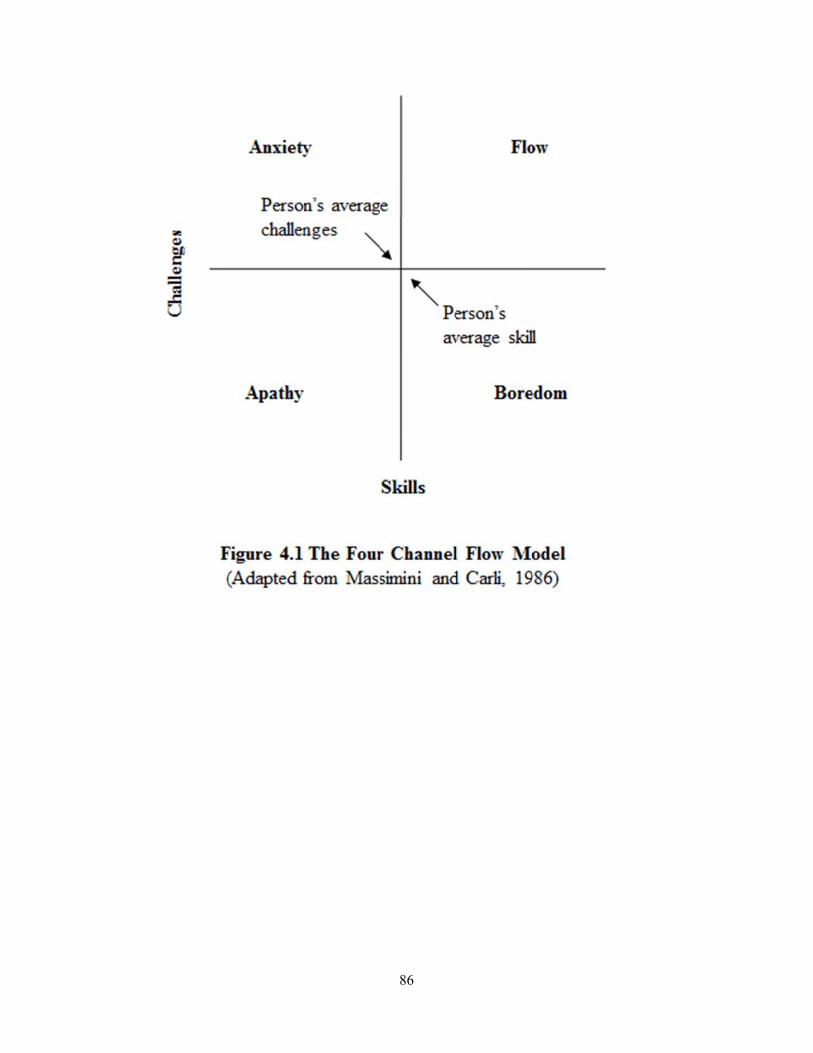
86
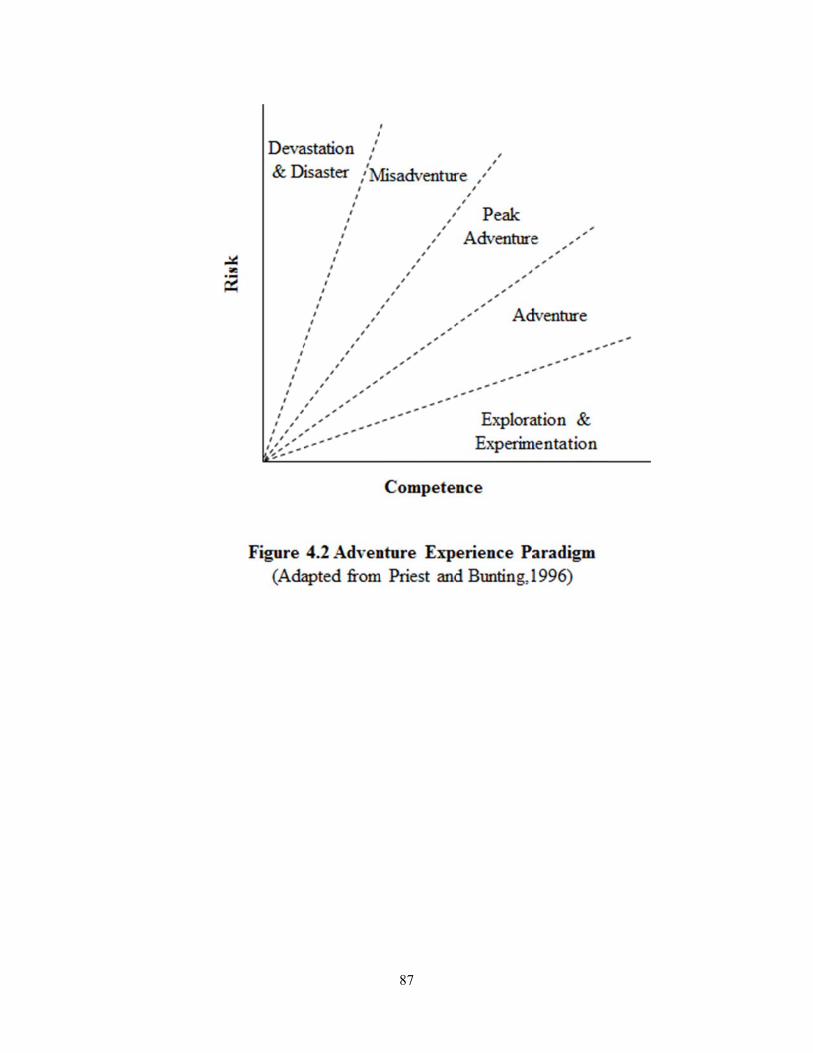
87
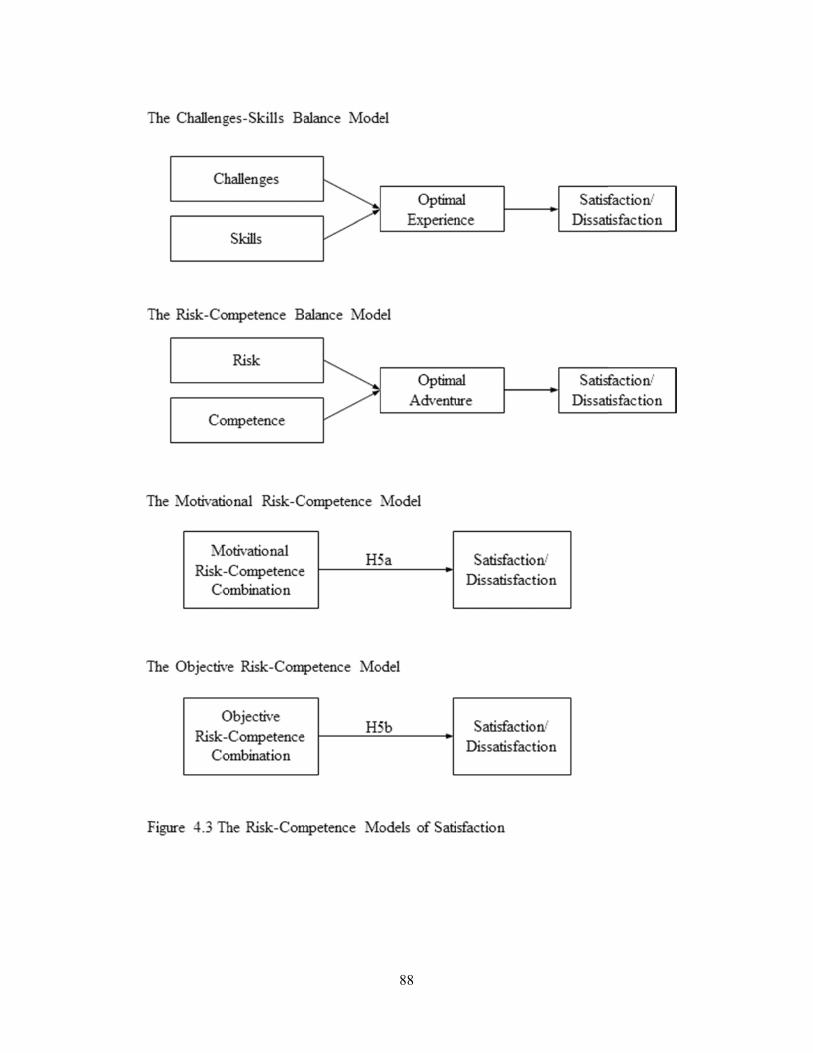
88

89
Table 5.1 Principal Component Analyses of Perceived Conditions and Subjective Disturbances
in the Backcountry
Perceived Conditionsa Subjective Disturbancesb
Mean (SD) Factor loading Mean (SD) Factor loading
Factors and Items 1 2 3 1 2 3
Environmental Impact I (Waste and litter) 1.25 (0.39) 1.54 (1.02)
Human waste along trails 1.13 (0.40) .80 1.47 (1.08) .89
Toilet papers along trails 1.20 (0.51) .77 1.54 (1.12) .90
Toilet papers at camp areas 1.24 (0.59) .68 1.56 (1.14) .91
Human Waste at camp areas 1.21 (0.55) .63 1.54 (1.15) .90
Litter at campsites 1.49 (0.68) .49 1.61 (1.04) .78
Diverse activities 1.91 (0.81) 1.84 (1.00)
Aircraft overhead 2.41 (1.26) .73 2.23 (1.38) .86
Motorized equipment on river trips 1.41 (0.85) .53 1.45 (0.96) .73
Environmental Impact II (Surface damage) 2.55 (1.04) 1.83 (0.90)
Trail erosion 2.59 (1.10) .80 1.67 (0.94) .77
Livestock waste along trails or in campsites 2.51 (1.54) .72 1.98 (1.27) .79
Social Encounter
Number of other groups camped within sight or sound of youc
2.31 (1.16) 1.61 (0.88)
Eigenvalue 2.64 1.31 1.09 5.03 1.03 0.92
Variance (%) 26.1 16.0 14.0 44.7 17.3 15.5
Accumulated variance (%) 26.1 42.1 46.1 44.7 62.0 77.5
Reliability coefficient (Cronbach’s alpha) .75 .37 .24 .95 .46 .60 aPerceived conditions were measured on a five-point scale: 1 = “Not Apparent At All,” 2 = “Slightly Apparent,” 3 = “Moderately Apparent,” 4 = “Very Apparent,” and 5 = “Extremely Apparent.” bFelt disturbances were measured on a five-point scale: 1 = “Not At All Disturbing,” 2 = “Slightly Disturbing,” 3 = “Moderately Disturbing,” 4 = “Very Disturbing,” and 5 = “Extremely Disturbing.” cThis single item represented Social Encounter and was excluded from the two PCAs due to low loadings.

90
Table 5.2 Principal Component Analysis of Trip Motives
Factor loading
Trip motives Mean (SD) 1 2 3 4 5 6 7 8
Competence 4.10 (0.64)
Developing your outdoor abilities and skills. 4.06 (0.80) .82
Depending on your skills to deal with wilderness conditions. 4.13 (0.72) .81
Testing your abilities. 4.03 (0.83) .77
Learning what you are capable of. 4.03 (0.83) .74
Being self-sufficient in a wilderness area. 4.24 (0.72) .57
Social connectedness 2.27 (0.81)
Knowing others are nearby. 2.08 (0.92) .84
Being near others who could help you if you need them. 2.32 (1.00) .82
Meeting other people in the area. 2.44 (1.08) .81
Observing other people in the area. 2.07 (0.96) .74
Talking to new and varied people. 2.94 (1.08) .69
Solitude 4.30 (0.62)
Getting away from crowded situations. 4.40 (0.71) .79
Experiencing solitude. 4.43 (0.69) .78
Being alone. 3.88 (0.96) .78
Experiencing peace and calm. 4.50 (0.60) .70
Risk 3.39 (0.80)
Chancing dangerous situations. 2.78 (1.09) .82
Having thrills. 3.49 (1.09) .72
Being your own boss. 3.66 (0.95) .58
Experiencing the risks involved. 3.64 (0.97) .58
Nature 4.04 (0.57)
Enjoying the smells of nature. 4.09 (0.76) .71
Enjoying the sounds of nature. 4.47 (0.58) .65
Reflecting on your spiritual values. 3.59 (1.13) .57
Studying nature. 4.02 (0.73) .52
Family 3.59 (0.98)
Bringing your family closer together. 3.45 (1.06) .92
Doing something with your family. 3.73 (1.02) .92
Wilderness 4.38 (0.52)
Being in an area where human influence is not noticeable. 4.26 (0.80) .67
Being in a wilderness setting. 4.65 (0.52) .62
Encountering wildlife. 4.22 (0.70) .62
Knowledge 3.95 (0.63)
Learning about the park’s natural wonders. 4.14 (0.67) .79
Learning about the park’s history. 3.76 (0.79) .77
Eigenvalue 6.57 4.53 2.72 1.53 1.35 1.08 1.03 0.98
Variance (%) 12.0 11.5 10.0 8.9 7.1 6.5 6.4 5.9
Accumulated variance (%) 12.0 23.5 33.5 42.4 49.5 56.0 62.4 68.3
Reliability coefficient (Cronbach’s alpha) .87 .86 .85 .78 .69 .89 .65 .66
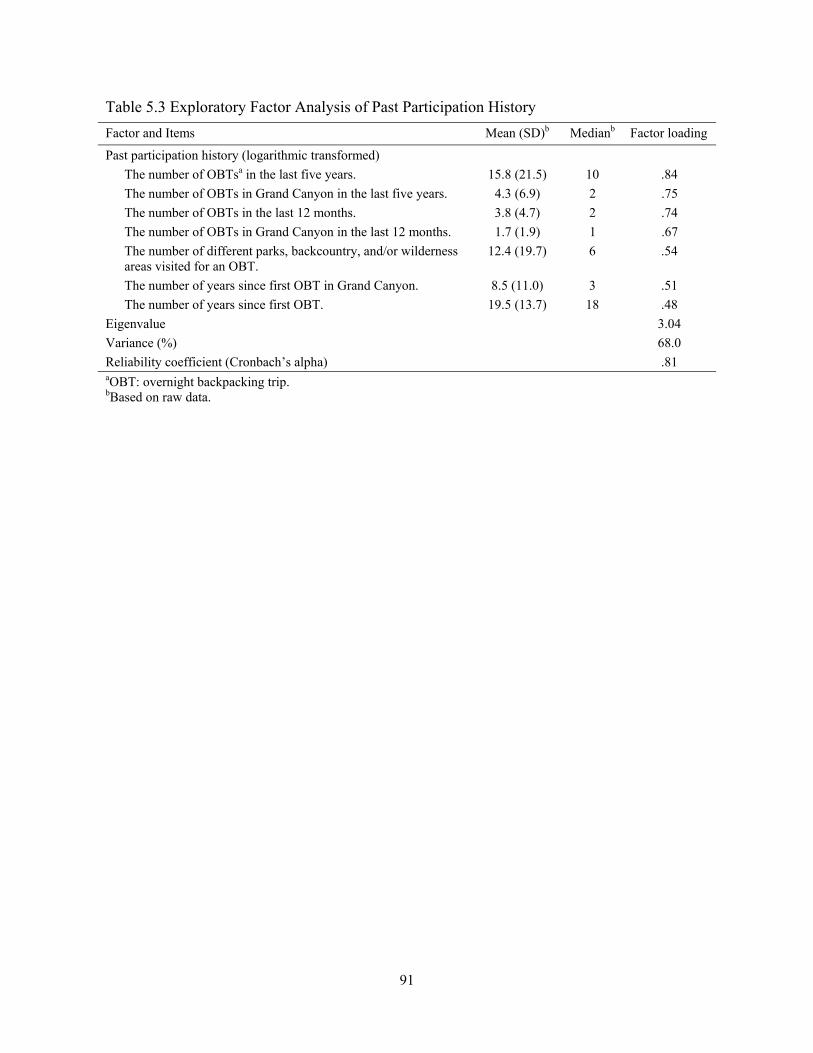
91
Table 5.3 Exploratory Factor Analysis of Past Participation History
Factor and Items Mean (SD)b Medianb Factor loading
Past participation history (logarithmic transformed)
The number of OBTsa in the last five years. 15.8 (21.5) 10 .84
The number of OBTs in Grand Canyon in the last five years. 4.3 (6.9) 2 .75
The number of OBTs in the last 12 months. 3.8 (4.7) 2 .74
The number of OBTs in Grand Canyon in the last 12 months. 1.7 (1.9) 1 .67
The number of different parks, backcountry, and/or wilderness areas visited for an OBT.
12.4 (19.7) 6 .54
The number of years since first OBT in Grand Canyon. 8.5 (11.0) 3 .51
The number of years since first OBT. 19.5 (13.7) 18 .48
Eigenvalue 3.04
Variance (%) 68.0
Reliability coefficient (Cronbach’s alpha) .81 aOBT: overnight backpacking trip. bBased on raw data.
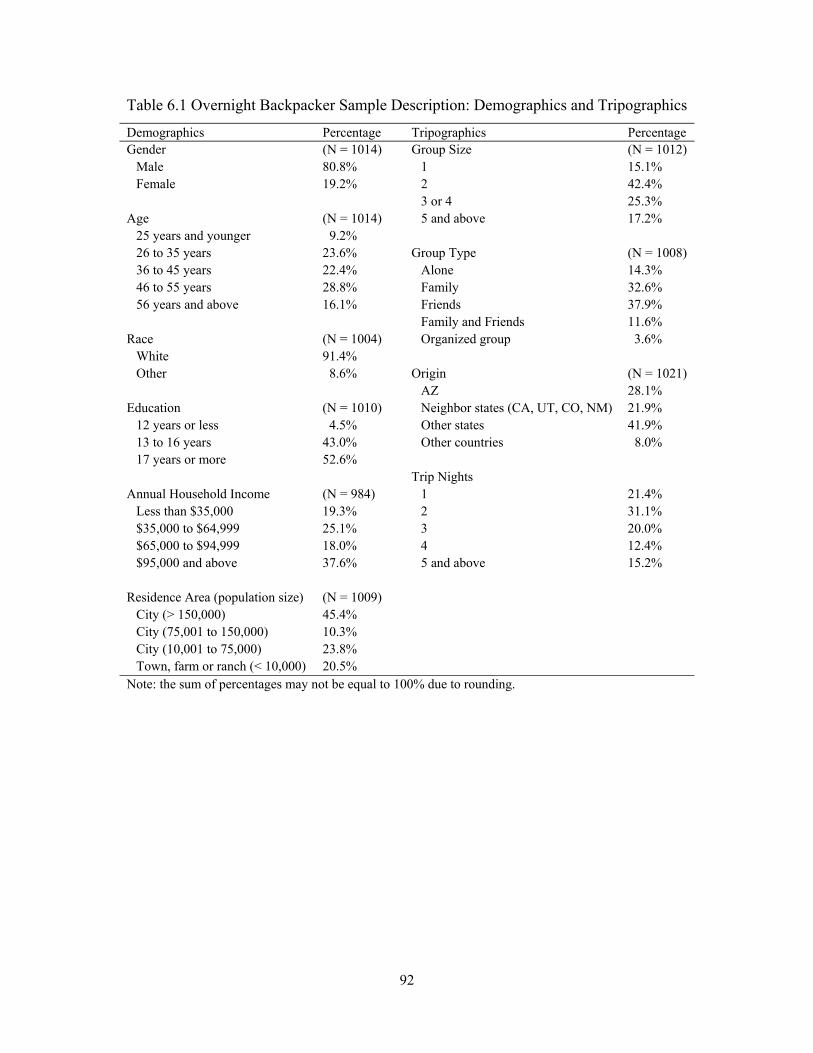
92
Table 6.1 Overnight Backpacker Sample Description: Demographics and Tripographics
Demographics Percentage Tripographics Percentage Gender (N = 1014) Group Size (N = 1012)
Male 80.8% 1 15.1% Female 19.2% 2 42.4% 3 or 4 25.3%
Age (N = 1014) 5 and above 17.2% 25 years and younger 9.2% 26 to 35 years 23.6% Group Type (N = 1008) 36 to 45 years 22.4% Alone 14.3% 46 to 55 years 28.8% Family 32.6% 56 years and above 16.1% Friends 37.9% Family and Friends 11.6%
Race (N = 1004) Organized group 3.6% White 91.4% Other 8.6% Origin (N = 1021) AZ 28.1%
Education (N = 1010) Neighbor states (CA, UT, CO, NM) 21.9% 12 years or less 4.5% Other states 41.9% 13 to 16 years 43.0% Other countries 8.0% 17 years or more 52.6% Trip Nights
Annual Household Income (N = 984) 1 21.4% Less than $35,000 19.3% 2 31.1% $35,000 to $64,999 25.1% 3 20.0% $65,000 to $94,999 18.0% 4 12.4% $95,000 and above 37.6% 5 and above 15.2%
Residence Area (population size) (N = 1009) City (> 150,000) 45.4% City (75,001 to 150,000) 10.3% City (10,001 to 75,000) 23.8% Town, farm or ranch (< 10,000) 20.5%
Note: the sum of percentages may not be equal to 100% due to rounding.

93
Table 6.2 Analysis of Variance for Overall Trip Satisfaction
Source df Sum of Squares Mean Square F p
Model 32 32.26 1.01 3.28 < .0001
Error 988 304.95 0.31
Corrected Total 1020 337.21

94
Table 6.3 Summary of Regression Analysis for Determinants of Overall Trip Satisfaction (N=1021)
Variables B SE B β Hypotheses Disturbances
Waste and litter 0.010 0.020 0.016 H1b
Surface damage -0.034 0.019 -0.063 * H1b1
Social encounter -0.055 0.021 -0.095 ** H2b1
Diverse activities 0.034 0.020 0.058 H3b
Disturbance-Motive Interactions
Waste and litter * Nature 0.020 0.018 0.035 H1d
Surface damage* Nature 0.005 0.017 0.009 H1d
Social encounter * Solitude 0.022 0.022 0.068 H2d
Diverse activities * Solitude -0.031 0.021 -0.050 H3d
Motives
Solitude 0.021 0.040 0.036 H4a
Knowledge 0.050 0.018 0.087 *** H4b1
Nature 0.070 0.018 0.121 *** H4c1
Competence 0.091 0.036 0.158 ** H4d1
Risk -0.030 0.040 -0.052 H4e
Wilderness 0.020 0.018 0.034
Family 0.046 0.018 0.080 ** H4f1
Social connectedness 0.046 0.019 0.080 ** H4g1, H4h1
Motivational Risk-Competence: Reference Level (medium, high) H5a
(low, low) -0.067 0.120 -0.037
(low, medium) -0.076 0.094 -0.040
(low, high) -0.134 0.089 -0.076
(medium, low) 0.012 0.112 0.006
(medium, medium) -0.056 0.084 -0.032
(high, low) -0.039 0.108 -0.021
(high, medium) -0.080 0.094 -0.044
(high, high) -0.053 0.089 -0.029
Objective Risk-Competence: Reference Level (high, low) H5b1
(low, low) 0.228 0.135 0.123 *
(low, medium) 0.256 0.139 0.121 *
(low, high) 0.194 0.143 0.077
(medium, low) 0.194 0.129 0.135
(medium, medium) 0.112 0.128 0.078
(medium, high) 0.179 0.129 0.128
(high, medium) 0.153 0.145 0.059
(high, high) 0.141 0.140 0.061
R2 = 0.096. *p < 0.10, **p < 0.05, ***p < 0.01. 1Hypotheses supported.
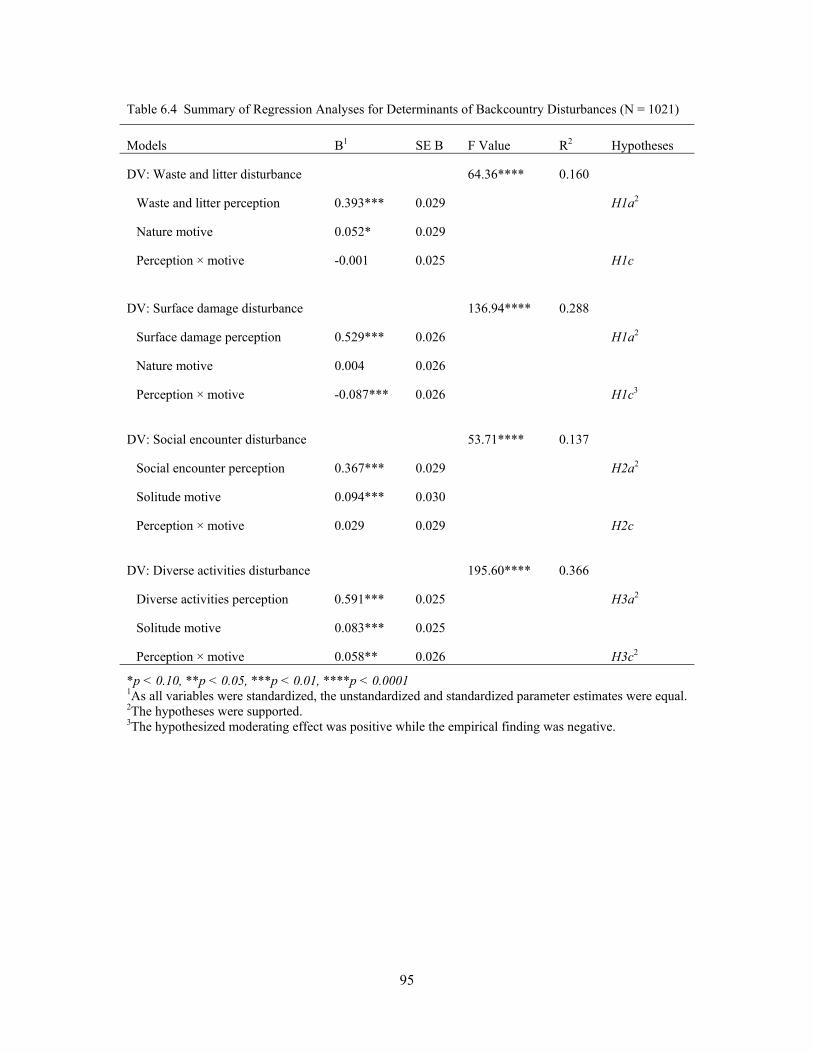
95
Table 6.4 Summary of Regression Analyses for Determinants of Backcountry Disturbances (N = 1021)
Models B1 SE B F Value R2 Hypotheses
DV: Waste and litter disturbance 64.36**** 0.160
Waste and litter perception 0.393*** 0.029 H1a2
Nature motive 0.052* 0.029
Perception × motive -0.001 0.025 H1c
DV: Surface damage disturbance 136.94**** 0.288
Surface damage perception 0.529*** 0.026 H1a2
Nature motive 0.004 0.026
Perception × motive -0.087*** 0.026 H1c3
DV: Social encounter disturbance 53.71**** 0.137
Social encounter perception 0.367*** 0.029 H2a2
Solitude motive 0.094*** 0.030
Perception × motive 0.029 0.029 H2c
DV: Diverse activities disturbance 195.60**** 0.366
Diverse activities perception 0.591*** 0.025 H3a2
Solitude motive 0.083*** 0.025
Perception × motive 0.058** 0.026 H3c2
*p < 0.10, **p < 0.05, ***p < 0.01, ****p < 0.0001 1As all variables were standardized, the unstandardized and standardized parameter estimates were equal. 2The hypotheses were supported. 3The hypothesized moderating effect was positive while the empirical finding was negative.
96
REFERENCES
Akama, J. S., & Kieti, D. M. (2003). Measuring tourist satisfaction with Kenya's wildlife safari: a case study of Tsavo West National Park. Tourism Management, 24, 73-81.
Alegre, J., & Cladera, M. (2006). Repeat visitation in mature sun and sand holiday destinations. Journal of Travel Research, 44(3), 288-297.
Alegre, J., & Cladera, M. (2009). Analyzing the effect of satisfaction and previous visits on tourist intentions to return. European Journal of Marketing, 43, 670-685.
Alegre, J., & Garau, J. (2011). The factor structure of tourist satisfaction at sun and sand destinations. Journal of Travel Research, 50(1), 78-86.
Arabatzis, G., & Grigoroudis, E. (2010). Visitors' satisfaction, perceptions and gap analysis: The case of Dadia-Lefkimi-Souflion National Park. Forest Policy and Economics, 12, 163-172.
Assaker, G., Vinzi, V. E., & O'Connor, P. (2011). Examining the effect of novelty seeking, satisfaction, and destination image on tourists' return pattern: A two factor, non-linear latent growth model. Tourism Management, 32, 890-901.
Bandura, A. (1977). Self-efficacy: Toward a unifying theory of behavioral change. Psychological Review, 84(2), 191-215.
Bassi, M., & Fave, A. D. (2010). Impact of extreme weather conditions on high-altitude climbers' goals and quality of experience. Journal of Leisure Research, 42(3), 469-488.
Bieger, T., & Christian, L. (2002). Market segmentation by motivation: The case of Switzerland. Journal of Travel Research, 41, 68-76.
Bigné, J. E., Sancház, M. I., & Andreu, L. (2009). The role of variety seeking in short and long run revisit intentions in holiday destinations. International Journal of Culture, Tourism and Hospitality Research, 3(2), 103-115.
Bigné, J. E., Sancház, M. I., & Sanchez, J. (2001). Tourism image, evaluation variables and after purchase behavior: inter-relationship. Tourism Management, 22, 607-616.
Blanchard, J., Strong, M., & Ford, P. (2007). Leardeship and Administration of Outdoor Pursuits. State College, PA: Venture Publishing.
Boniface, M. R. (2000). Towards an understanding of flow and other positive experience phenomena within outdoor and adventure activities. Journal of Adventure Education and Outdoor Learning, 1(1), 55-68.
Bonnet, A., Fernandez, L., Piolat, A., & Pedinielli, J. (2008). Changes in emotional states before and after risk taking in scuba diving. Journal of Clinical Sport Psychology, 2, 25-40.
Bowlby, J. (1979). The Making and Breaking of Affective Bonds. London: Tavistock. Bramwell, B. (1998). User satisfaction and product development in urban tourism. Tourism
Management, 19(1), 35-47. Brown, P. J. (1988). Quality in recreation experience. In A. H. Watson (ed.), Outdoor Recreation
Benchmark: Proceedings of the National Recreation Forum, General Technical Report SE-52. US Forest Service, Asheville, NC pp. 412-421.
Buckley, R. (2007). Adventure tourism products: price, duration, size, skill, remoteness. Tourism Management, 28, 1428-1433.
Budruk, M., & Manning, R. (2006). Indicators and standards of quality at an urban-proximate park: Litter and graffiti at Boston Harbro Islands National Recreation Area. Journal of Park and Recreation Administration, 24(3), 1-23.
97
Burns, K. (Director). (2009). The National Parks: America’s Best Idea [Television series]. Arlington, VA: Public Broadcasting Service (PBS).
Burns, R. C., Graefe, A. R., & Absher, J. B. (2003). Alternative measurement approaches to recreational customer satisfaction: Satisfaction-only versus gap scores. Leisure Sciences, 25, 363-380.
Carnicelli-Filho, S., Schwartz, G. M., & Tahara, A. K. (2010). Fear and adventure tourism in Brazil. Tourism Management, 31, 953-956.
Castro, C. B., Armario, E. M., & Ruiz, D. M. (2007). The influence of market heterogeneity on the relationship between a destination’s image and tourists’ future behavior. Tourism Management, 28(1), 175-187.
Cha, S., Mccleary, K. W., & Uysal, M. (1995). Travel motivations of Japanese overseas travelers: A factor-cluster segmentation approach. Journal of Travel Research, 34(1), 33-39.
Chadee, D. D., & Mattsson, J. (1996). An empirical assessment of customer satisfaction in tourism. The Service Industries Journal, 6(3), 305-320.
Chen, C., & Chen, F. (2010). Experience quality, perceived value, satisfaction and behavioral intentions for heritage tourists. Tourism Management, 31, 29-35.
Chen, C., & Tsai, D. (2007). How destination image and evaluative factors affect behavioral intentions? Tourism Management, 28, 1115-1122.
Chi, C. G., & Qu, H. (2008). Examining the structural relationships of destination image, tourist satisfaction and destination loyalty: an integrated approach. Tourism Management, 29, 624-636.
Creyer, E., Ross, W. T., & Evers, D. (2003). Risky recreation: An exploration of factors influencing the likelihood of participation and the effects of experience. Leisure Studies, 22, 239-253.
Crompton, J. L. (1979). Motivations for pleasure vacations. Annals of Tourism Research, 6(4), 408-424.
Crompton, J. L., & MacKay, K. J. (1989). Users' perceptions of the relative importance of service quality dimensions in selected public recreation programs. Leisure Sciences, 11, 367-375.
Crompton, J. L., & McKay, S. L. (1997). Motives of visitors attending festival events. Annals of Tourism Research, 24(2), 425-439.
Crompton, J. L., MacKay, K. J., & Fesenmaier, D. R. (1991). Identifying dimensions of service quality in public recreation. Journal of Park and Recreation Administration, 9(3), 1-13.
Csikszentmihalyi, M, & Csikszentmihalyi, I. (1988). Introduction to part IV. In M. Csikszentmihalyi & I. Csikszentmihalyi (eds.), Optimal Experience: Psychological Studies of Flow in Consciousness (pp. 251-265). NY: Cambridge University Press.
Csikszentmihalyi, M. (1975). Beyond boredom and anxiety. San Francisco: Jossey-Bass. Csikszentmihalyi, M. (1988). The future of flow. In M. Csikszentmihalyi & I. Csikszentmihalyi
(eds.), Optimal Experience: Psychological Studies of Flow in Consciousness (pp. 364-383). NY: Cambridge University Press.
Csikszentmihalyi, M. (1990). Flow: The Psychology of Optimal Experience. New York: Harper & Row.
Dann, G. M. S. (1977). Anomie, ego-enhancement and tourism. Annals of Tourism Research, IV(4), 184-194.
deCharms, R. (1968). Personal Causation: The Internal Affective Determinants of Behavior. New York: Academic Press.
98
Deci, E. L., & Ryan, R. M. (1985). Intrinsic Motivation and Self-Determination in Human Behavior. New York: Plenum Press.
Deci, E. L., & Ryan, R. M. (2000). The 'what' and 'whay' of goal pursuits: Human needs and the self-determination of behavior. Psychological Inquiry, 11, 227-268.
Deci, E. L., & Ryan, R. M. (2002). Handbook of Self-Determination Research. Rochester, NY: University of Rochester Press.
del Bosque, I. R., & Martin, H. S. (2008). Tourist satisfaction: a cognitive-affective model. Annals of Tourism Research, 35(2), 551-573.
Devesa, M., Laguna, M., & Palacios, A. (2010). The role of motivation in visitor satisfaction: empirical evidence in rural tourism. Tourism Management, 31, 547-552.
Dunn Ross, E. L., & Iso-Ahola, S. E. (1991). Sightseeing tourists' motivation and satisfaction. Annals of Tourism Research, 18, 226-237.
Eagles, P. F. J. (1992). The travel motivations of Canadian ecotourists. Journal of Travel Research, 31(2), 3-7.
Ellis, G. D., & Rossman, J. R. (2008). Creating value for participants through experience staging: parks, recreation, and tourism in the experience industry. Journal of Park and Recreation Administration, 26(4), 1-20.
Emmons, R. A. (1986). Personal strivings: An approach to personality and subjective well-being. Journal of Personality and Social Psychology, 62, 292-300
Emmons, R. A. (1991). Personal strivings, daily life events, and psychological and physical well-being. Journal of Personality, 59, 453-472.
Farrell, T., Hall, T., & White, D. (2001). Wilderness campers' perception and evaluation of campsite impacts. Journal of Leisure Research, 33(3), 229-250.
Faullant, R., Matzler, K., & Mooradian, T. A. (2011). Personality, basic emotions, and satisfaction: Primary emotions in the mountaineering experience. Tourism Management, 32, 1423-1430.
Fichman, M. (1999). Variance explained: Why size does not (always) matter. Research in Organizational Behavior, 21, 295-331.
Fielding, K., Pearce, P. L., & Hughes, K. (1992). Climbing Ayers Rock: relating visitor motivation, time perception and enjoyment. The Journal of Tourism Studies, 3(2), 40–52.
Fletcher, R. (2010). The emperor's new adventure: Public secrecy and the paradox of adventure tourism. Journal of Contemporary ethnography, 39(1), 6-33.
Flood, J., & McAvoy, L. (2000). The influence of wilderness restoration programs on visitor experience and visitor opinions of managers. Wilderness Science in A Time of Change Conference: Vol. 5. Wilderness Ecosysmtems, Threats, and Management. USDA Forest Service Proceedings RMRS-P-15-Vol-5, 193-198.
Flucker, M. R., & Turner, L. W. (2000). Needs, motivations, and expectations of a commercial whitewater rafting experience. Journal of Travel Research, 38, 380-389.
Fodness, D. (1994). Measuring tourist motivation. Annals of Tourism Research, 21(3), 555-581. Guinn, R. (1980). Elderly recreational vehicle tourists: Motivations for leisure. Journal of Travel
Research, 19(1), 9-12. Hamilton, J. A., Crompton, J. L., & More, T. A. (1991). Identifying the dimensions of service
quality in a park context. Journal of Environmental Management, 32, 211-220. Hammitt, W., & McDonald, C. (1983). Past on-site experience and its relationship to managing
river recreation resources. Forest Science, 29, 262-66.

99
Hasegawa, H. (2010). Analyzing tourists' satisfaction: a multivariate ordered probit approach. Tourism Management, 31, 86-97.
Hatcher, L. (1994). A Step-By-Step Approach to Using the SAS System for Factor Analysis and Structural Equation Modeling. Cary, NC: SAS Institute.
Henshall, B. D., Roberts, R., & Leighton, A. (1985). Fly-drive tourists: Motivation and destination choice factors. Journal of Travel Research, 23(3), 23-27.
Hsu, C. H. C., Cai, L. A., & Li, M. (2010). Expectation, motivation, and attitude: A tourist behavioral model. Journal of Travel Research, 49(3), 282-296.
Huang, S., & Hsu, C. H. C. (2009). Effects of travel motivation, past experience, perceived constraint, and attitude on revisit intention. Journal of Travel Research, 48, 29-44.
Hui, T. K., Wan D., & Ho, A. (2007). Tourists’ satisfaction, recommendation and revisiting Singapore. Tourism Management, 28, 965-975.
Iso-Ahola, S. E. (1982). Toward a social psychological theory of tourism motivation: A rejoinder. Annals of Tourism Research, 9, 256-262.
Izzard, C. E. (1977). Human Emotions. New York: Plenum. Jacob, G., & Schreyer, R. (1980). Conflict in outdoor recreation: A theoretical perspective.
Journal of Leisure Research, 12, 368-380. Jones, C. D., Hollenhorst, S. J., & Perna, F. (2003). An empirical comparison of the four channel
flow model and adventure experience paradigm. Leisure Sciences, 25, 17-31. Kao, M. C., Patterson, I., Scott, N., & Li, C. K. (2008). Motivations and satisfactions of
Taiwanese tourists who visit Australia. Journal of Travel & Tourism Marketing, 24(1), 17-33.
Kasser, T., & Ryan, R. M. (1993). A dark side of the American dream: Correlates of financial success as a central life aspiration. Journal of Personality and Social Psychology, 65, 410-422.
Kasser, T., & Ryan, R. M. (1996). Further examining the American dream: Differential correlates of intrinsic and extrinsic goals. Personality and Social Psychology Bulletin, 22, 80-87.
Kau, A. K., & Lim, P. S. Clustering of Chinese tourists to Singapore: An analysis of their motivations, values and satisfaction. International Journal of Tourism Research, 7(4/5), 231-248.
Kay, P. L. (2009). Cultural experience tourist motives dimensionality: A cross-cultural study. Journal of Hospitality Marketing & Management, 18, 329-371.
Kim, K. (2008). Analysis of structural equation model for the student pleasure travel market: Motivation, involvement, satisfaction, and destination loyalty. Journal of Travel & Tourism Marketing, 24(4), 297-313.
Kim, K., Sun, J., & Mahoney, E. (2009). Roles of motivation and activity factors in predicting satisfaction: Exploring the Korean cultural festival market. Tourism Analysis, 13(4), 413-425.
Kim, Y. G., Suh, B. W., & Eves, A. (2010). The relationships between food-related personality traits, satisfaction, and loyalty among visitors attending food events and festivals. International Journal of Hospitality Management, 29, 216-226.
Kimiecik, J. C., & Harris, A. T. (1996). What is enjoyment? A conceptual/definitional analysis with implications for sport and exercise psychology. Journal of Sport & Exercise Psychology, 18, 247-263.
100
Knudson, D., & Curry, E. (1981). Campers' perceptions of site deterioration and crowding. Journal of Forestry, 79, 92-94.
Kozak, M. (2001). Comparative assessment of tourist satisfaction with destinations across two nationalities. Tourism Management, 22, 391-401.
Krueger, N., & Dickson, P. R. (1994). How believing in ourselves increases risk taking: Perceived self-efficacy and opportunity recognition. Decision Sciences, 25(3), 385-400.
Kyle, G. T., Theodorakis, N. D., Karageorgiou, A., & Lafazani, M. (2010). The effect of service quality on customer loyalty within the context of ski resorts. Journal of Park and Recreation Administration, 28(1), 1-15.
Lawson, S., & Manning, R. (2001a). Crossing experiential boundaries: Visitor preferences regarding tradeoffs among social, resource, and managerial attributes of the Denali Wilderness experience. The George Wright Forum, 18(3), 10-27.
Lawson, S., & Manning, R. (2001b). Solitude versus access: A study of tradeoffs in outdoor recreation using indifference curve analysis. Leisure Sciences, 23, 179-191.
Lawson, S., & Manning, R. (2002). Tradeoffs among social, resource, and management attributes of the Denali Wilderness experience: A contextual approach to normative research. Leisure Sciences, 24, 297-312.
Lee, C. K., Lee, Y. K., & Wicks, B. E. (2004). Segmentation of festival motivation by nationality and satisfaction. Tourism Management, 25, 61–70.
Lee, J., & Beeler, C. (2009). An investigation of predictors of satisfaction and future intention: Links to motivation, involvement, and service quality in a local festival. Event Management, 13(1), 17-29.
Lee, S., Jeon, S., & Kim, D. (2011). The impact of tour quality and tourist satisfaction on tourist loyalty: The case of Chinese tourists in Korea. Tourism Management, 32, 1115-1124.
Lee, T. H. (2009). A structural model to examine how destination image, attitude, and motivation affect the future behavior of tourists. Leisure Sciences, 31, 215-236.
Lucas, R. (1979). Perceptions of non-motorized recreational impacts: A review of research findings. Recreational Impact on Wildlands. USDA Forest Servcie, pacific Northwest Region, R-6-001-1979, 24-31.
Luo, Y., & Deng, J. (2008). The new environmental paradigm and nature-based tourism motivation. Journal of Travel Research, 46, 392-402.
Lynn, N., & Brown, R. (2003). Effects of recreational use impacts on hiking experiences in natural areas. Landscape and Urban Planning, 64, 77-87.
MacKay, K. J., & Crompton, J. L. (1990). Measuring the quality of recreation services. Journal of Park and Recreation Administration, 8(3), 47-55.
Malka, A., & Chatman, J. (2003). Intrinsic and extrinsic work orientations as moderators of the effect of annual income on subjective well-being: A longitudinal study. Journal of Personality and Social Psychology, 29(6), 737-746.
Manfredo, M. J., Driver, B. L., & Tarrant, M. A. (1996). Measuring leisure motivation: A meta-analysis of the Recreation Experience Preference scales. Journal of Leisure Research, 28(3), 188-213.
Manning, R. (2011). Studies in Outdoor Recreation: Search and Research for Satisfaction (3rd Edition). Corvallis: Oregon State University Press.
Manning, R., Lawson, S., & Valliere, W. (2009). Multiple manifestations of crowding in outdoor recreation: A study of the relative importance of crowding-related indicators using indifference. Leisure/Loisir, 33(2), 637-658.
101
Manning, R., Lawson, S., Newman, P., Budruk, M., Valliere, W., Laven, D., et al. (2004). Visitor perceptions of recreation-related resource impacts. In R. Buckley (Ed.), Environmental Impacts of Ecotourism. Oxford: CAB International.
Marcussen, C. H. (2011). Determinants of tourist satisfaction and intention to return. Tourism, 59(2), 203-221.
Martin, P., & Priest, S. (1986). Understanding the adventure experience. Journal of Adventure Education, 3(1), 18-21.
McAdams, D. P. (1980). A thematic coding system for the intimacy motive. Journal of Research in Personality, 14, 413-432.
McAdams, D. P., & Bryant, F. B. (1987). Intimacy motivation and subjective mental health in a national sample. Journal of Personality, 55(3), 395-413.
McAdams, D. P., & Vaillant, G. E. (1982). Intimacy motivation and psychological adjustment: A longitudinal study. Journal of Personality Assessment, 46, 586-593.
McDowall, S. (2010). A comparison between Thai residents and non-residents in their motivations, performance evaluations, and overall satisfaction with a domestic festival. Journal of Vacation Marketing, 16(3), 217-233.
McDowall, S. (2010). International tourist satisfaction and destination loyalty: Bangkok, Thailand. Asia Pacific Journal of Tourism Research, 15(1), 21-42.
McEwen, D. N. (1986). Recreation quality and the market for tent camping. Journal of Park and Recreation Administration, 4(2), 83-95.
Meng, F., Tepanon, Y., & Uysal, M. (2008). Measuring tourist satisfaction by attribute and motivation: The case of a nature-based resort. Journal of Vacation Marketing, 14(1), 41-56.
Monz, C., Roggenbuck, J., Cole, D., Brame, R., & Yoder, A. (2006). Climbers' attitudes toward recreation resource impacts in the Adirondack park. Proceedings of the 2005 Northeastern Recreation Research Symposium. USDA Forest Service General Technical Report GTR-NE-341, 204-211.
Murray, E. J. (1964). Motivation and Emotion. Englewood Cliffs: Prentice-Hall. National Sporting Goods Association. (2012). Ten-Year History of Sports Participation.
Retrieved March 3, 2012, from www.nsga.org Neal, J. D., & Gursoy, D. (2008). A multifaceted analysis of tourism satisfaction. Journal of
Travel Research, 47(1), 53-62. Newman, P., Manning, R., Dennis, D., & McKonly, W. (2005). Informing carrying capacity
decision making in Yosemite National Park, USA using stated choice modeling. Journal of Park and Recreation Administration, 23(1), 75-89.
Nicholson, R. E., & Pearce, D. G. (2001). Why do people attend events: A comparative analysis of visitor motivations at four south island events. Journal of Travel Research, 39, 449-460.
O'Grady, K. E. (1982). Measures of explained variance: Cautions and limitations. Psychological Bulletin, 92(3), 766-777.
Oliver, R. L. (2010). Satisfaction: A Behavioral Perspective on the Consumer. Armonk, N.Y.: M.E. Sharpe.
O'Neill, M. A., Riscinto-Kozub, K. A., & Hyfte, M. V. (2010). Defining visitor satisfaction in the context of camping oriented nature-based tourism: the driving force of quality. Journal of Vacation Marketing, 16(2), 141-156.
102
Pan, S., & Ryan, C. (2007). Mountain areas and visitor usage - Motivations and determinants of satisfaction: The case of Pirongia Forest Park, New Zealand. Journal of Sustainable Tourism, 15(3), 288-308.
Pearce, P. L., & Caltabiano, M. L. (1983). Inferring travel motivation from travelers' experiences. Journal of Travel Research, 22(2), 16-20.
Pearce, P. L., & Lee, U. (2005). Developing the travel career approach to tourist motivation. Journal of Travel Research, 43, 226-237.
Petrick, J. F., Morais, D. D., & Norman, W. C. (2001). An examination of the determinants of entertainment vacationers' intentions to revisit. Journal of Travel Research, 40(1), 41-28.
Pizam, A., Neumann, Y., & Reichel, A. (1978). Dimensions of tourist satisfaction with a destination area. Annals of Tourism Research, 5(3), 314-322.
Pomfret, G. (2011). Package mountaineer tourists holidaying in the French Alps: An evaluation of key influences encouraging their participation. Tourism Management, 32, 501-510.
Poria, Y., Reichel, A., & Biran, A. (2006). Heritage site perceptions and motivations to visit. Journal of Travel Research, 44, 318-326.
Prayag, G., & Ryan, C. (2011). Antecedents of tourists' loyalty to Mauritius: The role and influence of destination image, place attachment, personal involvement, and satisfaction. Journal of Travel Research, XX(X), 1-15.
Prebensen, N. K., Larsen, S., & Abelsen, B. (2003). I’m not a typical tourist: German tourists’ self-perception, activities, and motivations. Journal of Travel Research, 41, 416-420.
Prebensen, N., Skallerud, K., & Chen, J. S. (2010). Tourist motivation with sun and sand destinations: satisfaction and the WOM-effect. Journal of Travel & Tourism Marketing, 27(8), 858-873.
Priest, S. (1994). The how and why of risk taking behaviors. Books of Abstracts: Fifth North American Symposium on Society and Resource Management, June 7-10, Fort Collins, CO.
Priest, S., & Baille, R. (1987). Justifying the risk to others: The real razor's edge. Journal of Experiential Education, 10(1), 6-22.
Priest, S., & Bunting, C. (1993). Changes in perceived risk and competence during white water canoeing. Journal of Applied Recreation Research, 18(4), 265-280.
Priest, S., & Carpenter, G. (1993). Changes in perceived risk and competence during adventurous leisure experiences. Journal of Applied Recreation Research, 18(1), 51-71.
Priest, S., & Gass, M. (1997). Effective Leadership in Adventure Programming. Champaign, IL: Human Kinetics.
Ragheb, M. G., & Tate, R. L. (1993). A behavior model of leisure participation, based on leisure attitude, motivation and satisfaction. Leisure Studies, 12, 61–67.
Rittichainuwat, N. (2008). Responding to disaster: Thai and Scandinavian tourists' motivation to visit Phuket, Thailand. Journal of Travel Research, 46, 422-432.
Rivera, M. A., & Croes, R. (2010). Ecotourists' loyalty: will they tell about the destination or will they return? Journal of Ecotourism, 9(2), 85-103.
Ryan, R. M., Chirkov, V. L., Little, T. D., Sheldon, K. M., Timoshina, E., & Deci, E. L. (1999). The American dream in Russia: Extrinsic aspirations and well-being in two cultures. Personality and Social Psychology Bulletin, 25, 1509-1524.
Ryan, R. M., Sheldon, K. M., Kasser, T., & Deci, E. L. (1996). All goals are not created equal: An organismic perspective on the nature of goals and their regulation. In P. M. Gollwitzer & J. A. Bargh (Eds.), The Psychology of Action: Linking Cognition and Motivation to Behavior (pp. 7-26). New York: Guilford.
103
Salinas-Jimenéz, M. d. M., Artés, J., & Salinas-Jimenéz, J. (2010). Income, motivation, and satisfaction with life: An empirical analysis. Journal of Happiness Study, 11, 779-793.
Schmidt, D., & Keating, J. (1979). Human crowding and personal control: An integration of the research. Psychological Bulletin, 86(4), 680-700.
Schmuck, P., Kasser, T., & Ryan, R. M. (2000). The relationship of well-being to intrinsic and extrinsic goals in Germany and the U.S. Social Indicators Research, 50, 225-241.
Schofield, P., & Thompson, K. (2007). Visitor motivation, satisfaction and behavioral intention: The 2005 Naadam Festival, Ulaanbaatar. International Journal of Tourism Research, 9(5), 329-344.
Shieh, G. (2011). Clarifying the rold of mean centering in multicollinearity of interaction effects. British Journal of Mathematical and Statistical Psychology, 64, 462-477.
Sirakaya, E., Uysal, M., & Yoshioka, C. F. (2003). Segmenting the Japanese tour market to Turkey. Journal of Travel Research, 41, 293-304.
Slanger, E., & Ruestam, K. E. (1997). Motivation and disinhibition in high risk sports: Sensation seeking and self-efficacy. Journal of Research in Personality, 31, 355-374.
Smith, S., Costello, C., & Muenchen, R. A. (2010). Influence of push and pull motivations on satisfaction and behavioral intentions within a culinary tourism event. Journal of Quality Assurance in Hospitality & Tourism, 11(1), 17-35.
Snepenger, D., King, J., Marshall, E., & Uysal, M. (2006). Modeling Iso-Ahola's motivation theory in the tourism context. Journal of Travel Research, 45, 140-149.
Stankey, G., & Schreyer, R. (1987). Attitudes toward wilderness and factors affecting visitor behavior: A state-of-knowledge review. Proceedings--National Wilderness Research Conference: Issues, State-of-Knowledge, Future Directions. USDA Forest Service General Technical Report INT-220, 246-293.
Stewart, W., McDonald, C., & Schwartz, Z. (2003). Research Proposal For Backcountry Visitors and Stakeholders at Grand Canyon National Park. University of Illinois at Urbana-Champaign.
Stokols, D. (1972a). On the distinction between density and crowding: Some implications for future research. Psychological Review, 79, 275-277.
Stokols, D. (1972b). A social psychological model of human crowding phenomena. Journal of the American Institute of Planners, 38, 72-83.
Stokols, D., Rall, M., Pinner, B., & Schopler, J. (1973). Physical, social, and personal determinants of the perception of crowding. Environment and Behavior, 5(1), 87-150.
Tangeland, T., & Aas, Ø. (2011). Household composition and the importance of experience attributes of nature based tourism activity products --A Norwegian case study of outdoor recreationists. Tourism Management, 32, 822-832.
The Yosemite Decimal System. Retrieved June 2, 2012, from climber.org Tonge, J., & Moore, S. A. (2007). Importance-satisfaction analysis for marine-park hinterlands:
A Western Australian case study. Tourism Management, 28, 768-776. Tribe, J., & Snaith, T. (1998). From SERVQUAL to HOLSAT: holiday satisfaction in Varadero,
Cuba. Tourism Management, 19(1), 25-34. Trimpop, R. M., Kerr, J. H., & Kirkcaldy, B. (1999). Comparing personality constructs of risk-
taking behavior. Personality and Individual Differences, 26, 237-254. Truong, T., & Foster, D. (2006). Using HOLSAT to evaluate tourist satisfaction at destinations:
the case of Australian holidaymakers in Vietnam. Tourism Management, 27, 842-855.
104
Turnbull, D. R., & Uysal, M. (1995). An exploratory study of German visitors to the Caribbean. Journal of Travel & Tourism Marketing, 4(2), 85-92.
Um, S., Chon, K. and Ro, Y. (2006). Antecedents of revisit intention. Annals of Tourism Research, 33(4), 1141-1158.
Uyarra, M., Watkinson, A., & Cote, I. (2009). Managing dive tourism for the sustainable use of coral reefs: Validating diver perceptions of attractive site features. Environmental Management, 43, 1-16.
Uysal, M. and Williams, J. (2004). The role of expressive and instrumental factors measuring visitor satisfaction. In G.I. Crouch, R. Perdue, H.J.P. Timmermans and M. Uysal (eds), Consumer Psychology of Tourism, Hospitality and Leisure, pp. 227 -44. London: CABI.
Uysal, M., & Jurowski, C. (1994). Testing the push and pull factors. Annals of Tourism Research, 21(4), 844-846.
Vaske, J. J., Donnelly, M. P., & Williamson, B. N. (1991). Monitoring for quality control in state park management. Journal of Park and Recreation Administration, 9(2), 59-72.
Vaske, J., & Shelby, L. (2008). Crowding as a descriptive indicator and an evaluative standard: Results from 30 years of research. Leisure Studies, 30, 111-126.
Vaske, J., Donnelly, M., Wittmann, K., & Laidlaw, S. (1995). Interpersonal versus social-values conflict. Leisure Sciences, 17, 205-222.
Vaske, J., Dyar, R., & Timmons, N. (2004). Skill level and recreation conflict among skiers and snowboarders. Leisure Sciences, 26, 215-225.
Vaske, J., Needham, M., & Cline Jr., R. (2007). Clarifying interpersonal and social values conflict among recreationists. Journal of Leisure Research, 39(1), 182-195.
Wang, C., & Hsu, M. K. (2010). The relationships of destination image, satisfaction, and behavioral intentions: an integrated model. Journal of Travel & Tourism Marketing, 27(8), 829-843.
Wang, Y., & Davidson, M. C. G. (2009). Chinese leisure tourists: perceptions and satisfaction with Australia. Tourism Analysis, 14, 737-747.
Webb, D., & Hassall, K. (2002). Measuring visitor satisfaction with Western Australia's conservation estate. Journal of Consumer Satisfaction, Dissatisfaction and Complaining Behavior, 15, 81-98.
Weisberg, S. (2005). Applied Linear Regression (3rd ed.). Hoboken, New Jersey: John Wiley & Sons.
White, C. J., & Thompson, M. (2009). Self determination theory and the wine club attribute formation process. Annals of Tourism Research, 36(4), 561-586.
White, D., Hall, T., & Farrell, T. (2001). Influence of ecological impacts and other campsite characteristics on wilderness visitors' campsite choices. Journal of Park and Recreation Administration, 19(2), 83-97.
Wight, P. A. (1996). North American ecotourists: Market profiles and trip characteristics. Journal of Travel Research, 34(4), 2-10.
Williams, P., & Soutar, G. N. (2009). Value, satisfaction and behavioral intentions in an adventure tourism context. Annals of Tourism Research, 36(3), 413-438.
Wright, B. A., Duray, N., & Goodale, T. L. (1992). Assessing perceptions of recreation center service quality: An application of recent advancements in service quality research. Journal of Park and Recreation Administration, 10(3), 33-47.
105
Wu, C. H., & Liang, R. (2011). The relationship between white-water rafting experience formation and customer reaction: A Flow Theory perspective. Tourism Management, 32, 317-325.
Xu, F., Morgan, M., & Song, P. (2009). Students' travel behavior: A cross-cultural comparison of UK and China. International Journal of Tourism Research, 11, 255-268.
Yoon, Y., & Uysal, M. (2005). An examination of the effects of motivation and satisfaction on destination loyalty: a structural model. Tourism Management, 26, 45-56.
Yuksel, A., Yuksel, F., & Bilim, Y. (2010). Destination attachment: effects on customer satisfaction and cognitive, affective and conative loyalty. Tourism Management, 31, 274-284.
Zabkar, V., Brencic, M. M., & Dmitrovic, T. (2010). Modeling perceived quality, visitor satisfaction and behavioral intentions at the destination level. Tourism Management, 31, 537-546.
Zeithaml, V. A., & Bitner, M. J. (2003). Services Marketing: Integrating Customer Focus Across the Firm (3rd ed.). New York, NY: McGraw-Hill.
Zuckerman, M. (1979). Sensation Seeking: Beyond the Optimal Level of Arousal. Erlbaum, Hillsdale. New Jersey.
Zuckerman, M. (1983). Sensation seeking and sports. Personality and Individual Differences, 4(3), 285-293.
Zuckerman, M. (1994). Behavioral Expressions and Biosocial Bases of Sensation Seeking. Cambridge and New York: Cambridge University Press.
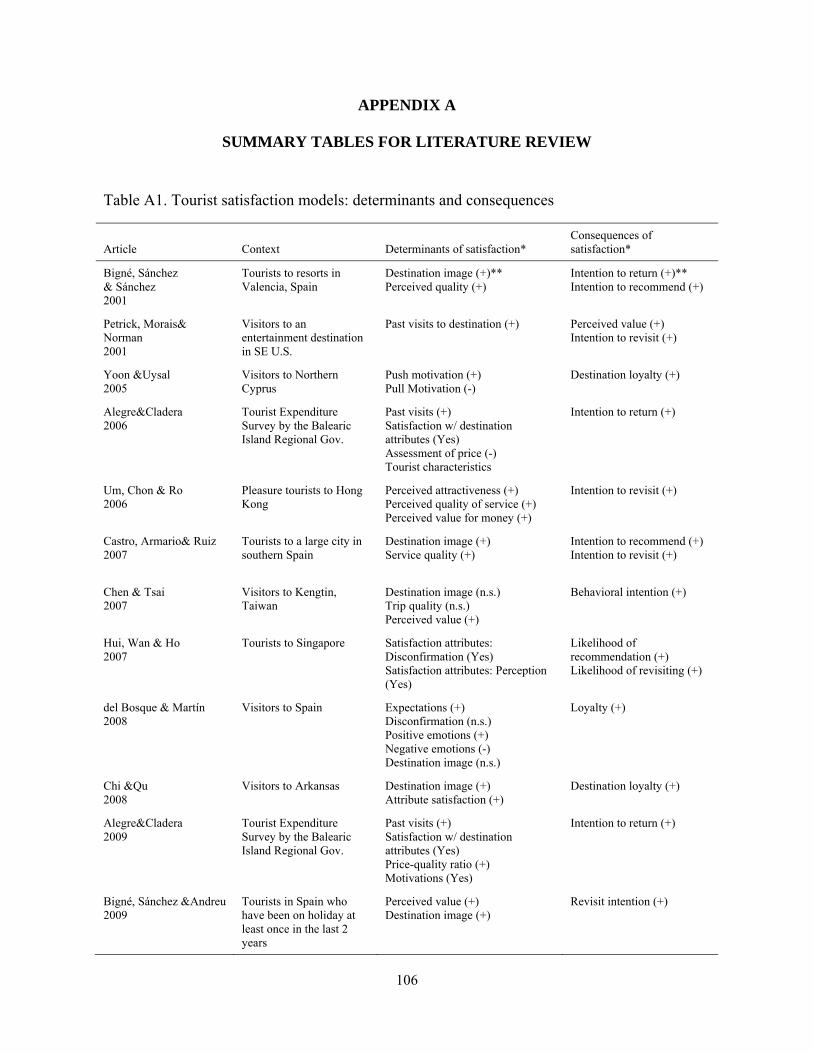
106
APPENDIX A
SUMMARY TABLES FOR LITERATURE REVIEW
Table A1. Tourist satisfaction models: determinants and consequences
Article Context Determinants of satisfaction* Consequences of satisfaction*
Bigné, Sánchez & Sánchez 2001
Tourists to resorts in Valencia, Spain
Destination image (+)** Perceived quality (+)
Intention to return (+)** Intention to recommend (+)
Petrick, Morais& Norman 2001
Visitors to an entertainment destination in SE U.S.
Past visits to destination (+) Perceived value (+) Intention to revisit (+)
Yoon &Uysal 2005
Visitors to Northern Cyprus
Push motivation (+) Pull Motivation (-)
Destination loyalty (+)
Alegre&Cladera 2006
Tourist Expenditure Survey by the Balearic Island Regional Gov.
Past visits (+) Satisfaction w/ destination attributes (Yes) Assessment of price (-) Tourist characteristics
Intention to return (+)
Um, Chon & Ro 2006
Pleasure tourists to Hong Kong
Perceived attractiveness (+) Perceived quality of service (+) Perceived value for money (+)
Intention to revisit (+)
Castro, Armario& Ruiz 2007
Tourists to a large city in southern Spain
Destination image (+) Service quality (+)
Intention to recommend (+) Intention to revisit (+)
Chen & Tsai 2007
Visitors to Kengtin, Taiwan
Destination image (n.s.) Trip quality (n.s.) Perceived value (+)
Behavioral intention (+)
Hui, Wan & Ho 2007
Tourists to Singapore
Satisfaction attributes: Disconfirmation (Yes) Satisfaction attributes: Perception (Yes)
Likelihood of recommendation (+) Likelihood of revisiting (+)
del Bosque & Martín 2008
Visitors to Spain
Expectations (+) Disconfirmation (n.s.) Positive emotions (+) Negative emotions (-) Destination image (n.s.)
Loyalty (+)
Chi &Qu 2008
Visitors to Arkansas
Destination image (+) Attribute satisfaction (+)
Destination loyalty (+)
Alegre&Cladera 2009
Tourist Expenditure Survey by the Balearic Island Regional Gov.
Past visits (+) Satisfaction w/ destination attributes (Yes) Price-quality ratio (+) Motivations (Yes)
Intention to return (+)
Bigné, Sánchez &Andreu 2009
Tourists in Spain who have been on holiday at least once in the last 2 years
Perceived value (+) Destination image (+)
Revisit intention (+)
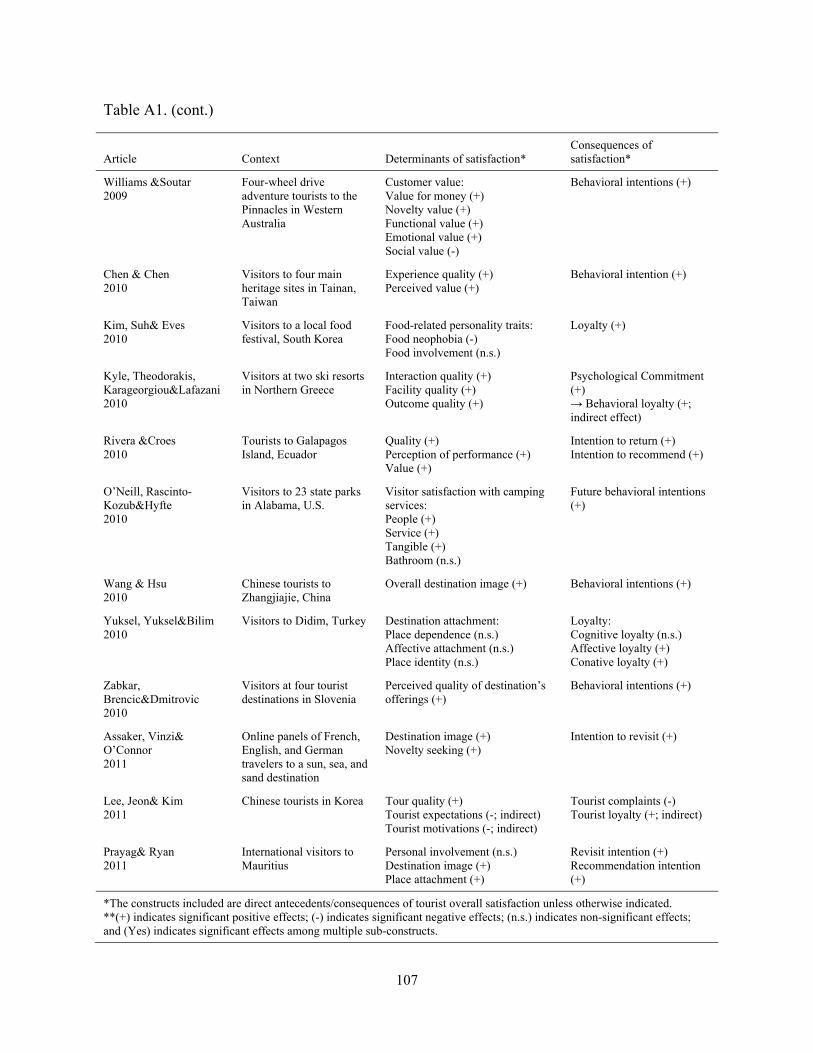
107
Table A1. (cont.)
Article Context Determinants of satisfaction* Consequences of satisfaction*
Williams &Soutar 2009
Four-wheel drive adventure tourists to the Pinnacles in Western Australia
Customer value: Value for money (+) Novelty value (+) Functional value (+) Emotional value (+) Social value (-)
Behavioral intentions (+)
Chen & Chen 2010
Visitors to four main heritage sites in Tainan, Taiwan
Experience quality (+) Perceived value (+)
Behavioral intention (+)
Kim, Suh& Eves 2010
Visitors to a local food festival, South Korea
Food-related personality traits: Food neophobia (-) Food involvement (n.s.)
Loyalty (+)
Kyle, Theodorakis, Karageorgiou&Lafazani 2010
Visitors at two ski resorts in Northern Greece
Interaction quality (+) Facility quality (+) Outcome quality (+)
Psychological Commitment (+) → Behavioral loyalty (+; indirect effect)
Rivera &Croes 2010
Tourists to Galapagos Island, Ecuador
Quality (+) Perception of performance (+) Value (+)
Intention to return (+) Intention to recommend (+)
O’Neill, Rascinto-Kozub&Hyfte 2010
Visitors to 23 state parks in Alabama, U.S.
Visitor satisfaction with camping services: People (+) Service (+) Tangible (+) Bathroom (n.s.)
Future behavioral intentions (+)
Wang & Hsu 2010
Chinese tourists to Zhangjiajie, China
Overall destination image (+) Behavioral intentions (+)
Yuksel, Yuksel&Bilim 2010
Visitors to Didim, Turkey
Destination attachment: Place dependence (n.s.) Affective attachment (n.s.) Place identity (n.s.)
Loyalty: Cognitive loyalty (n.s.) Affective loyalty (+) Conative loyalty (+)
Zabkar, Brencic&Dmitrovic 2010
Visitors at four tourist destinations in Slovenia
Perceived quality of destination’s offerings (+)
Behavioral intentions (+)
Assaker, Vinzi& O’Connor 2011
Online panels of French, English, and German travelers to a sun, sea, and sand destination
Destination image (+) Novelty seeking (+)
Intention to revisit (+)
Lee, Jeon& Kim 2011
Chinese tourists in Korea Tour quality (+) Tourist expectations (-; indirect) Tourist motivations (-; indirect)
Tourist complaints (-) Tourist loyalty (+; indirect)
Prayag& Ryan 2011
International visitors to Mauritius
Personal involvement (n.s.) Destination image (+) Place attachment (+)
Revisit intention (+) Recommendation intention (+)
*The constructs included are direct antecedents/consequences of tourist overall satisfaction unless otherwise indicated. **(+) indicates significant positive effects; (-) indicates significant negative effects; (n.s.) indicates non-significant effects; and (Yes) indicates significant effects among multiple sub-constructs.

108
Table A2. Determinants of tourist satisfaction in the models included in Table A1
Determinants of tourist satisfaction Counts*
Cognitive and Affective Antecedents
Destination image 9
Perceived performance/quality 8
Price/Value/Perceived value/Perceived value for money/Price-quality ratio 8
Attribute satisfaction 5
Expectations 2
Disconfirmation 2
Perceived attractiveness 1
Experience quality 1
Positive and negative emotions 1
Customer value (novelty, emotional, social) 1
Tourist Psychological and Behavioral Characteristics
Past visits to destination 3
Tourist motivations, pull and push motivations 3
Tourist personality (food neophobia, novelty seeking) 2
Involvement/personal involvement 2
Place/destination attachment 2
*The number of times each of the determinants is included in the models in Table A1.
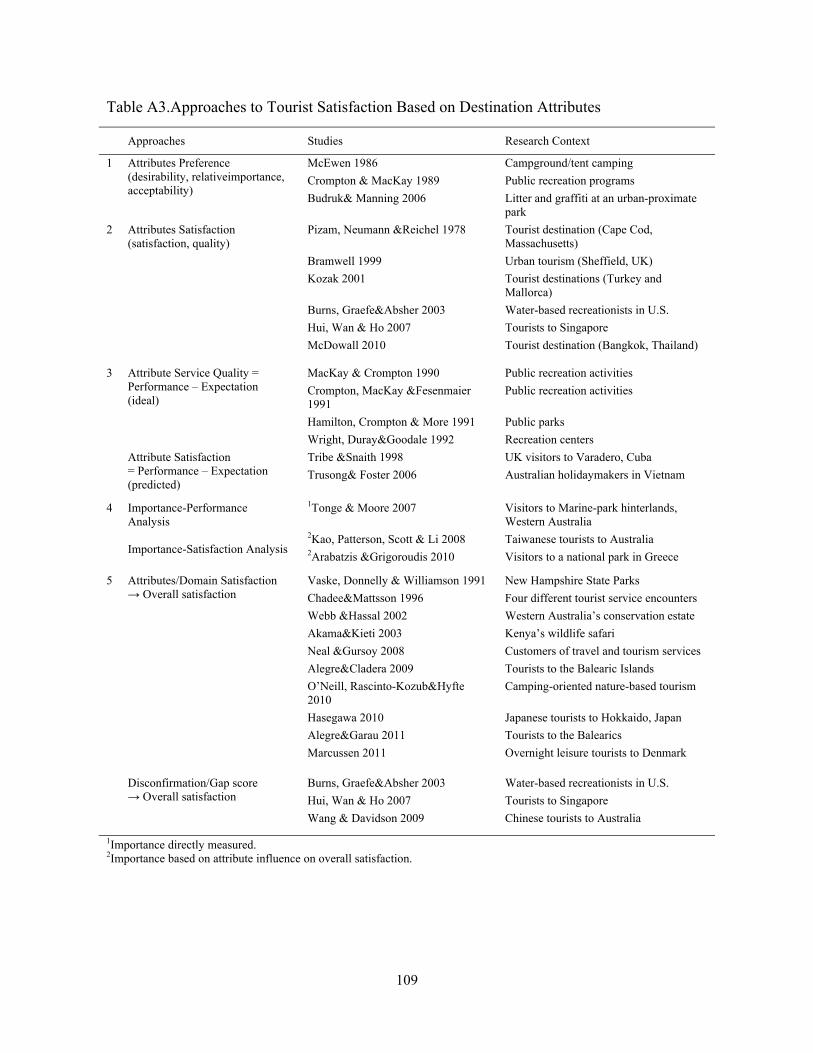
109
Table A3.Approaches to Tourist Satisfaction Based on Destination Attributes
Approaches Studies Research Context
1 Attributes Preference (desirability, relativeimportance, acceptability)
McEwen 1986 Campground/tent camping
Crompton & MacKay 1989 Public recreation programs
Budruk& Manning 2006 Litter and graffiti at an urban-proximate park
2 Attributes Satisfaction (satisfaction, quality)
Pizam, Neumann &Reichel 1978 Tourist destination (Cape Cod, Massachusetts)
Bramwell 1999 Urban tourism (Sheffield, UK)
Kozak 2001 Tourist destinations (Turkey and Mallorca)
Burns, Graefe&Absher 2003 Water-based recreationists in U.S.
Hui, Wan & Ho 2007 Tourists to Singapore
McDowall 2010 Tourist destination (Bangkok, Thailand)
3
Attribute Service Quality = Performance – Expectation (ideal)
MacKay & Crompton 1990 Public recreation activities
Crompton, MacKay &Fesenmaier 1991
Public recreation activities
Hamilton, Crompton & More 1991 Public parks
Wright, Duray&Goodale 1992 Recreation centers
Attribute Satisfaction = Performance – Expectation (predicted)
Tribe &Snaith 1998 UK visitors to Varadero, Cuba
Trusong& Foster 2006 Australian holidaymakers in Vietnam
4 Importance-Performance Analysis Importance-Satisfaction Analysis
1Tonge & Moore 2007 Visitors to Marine-park hinterlands, Western Australia
2Kao, Patterson, Scott & Li 2008 Taiwanese tourists to Australia 2Arabatzis &Grigoroudis 2010 Visitors to a national park in Greece
5 Attributes/Domain Satisfaction → Overall satisfaction
Vaske, Donnelly & Williamson 1991 New Hampshire State Parks
Chadee&Mattsson 1996 Four different tourist service encounters
Webb &Hassal 2002 Western Australia’s conservation estate
Akama&Kieti 2003 Kenya’s wildlife safari
Neal &Gursoy 2008 Customers of travel and tourism services
Alegre&Cladera 2009 Tourists to the Balearic Islands
O’Neill, Rascinto-Kozub&Hyfte 2010
Camping-oriented nature-based tourism
Hasegawa 2010 Japanese tourists to Hokkaido, Japan
Alegre&Garau 2011 Tourists to the Balearics
Marcussen 2011 Overnight leisure tourists to Denmark
Disconfirmation/Gap score → Overall satisfaction
Burns, Graefe&Absher 2003 Water-based recreationists in U.S.
Hui, Wan & Ho 2007 Tourists to Singapore
Wang & Davidson 2009 Chinese tourists to Australia
1Importance directly measured. 2Importance based on attribute influence on overall satisfaction.
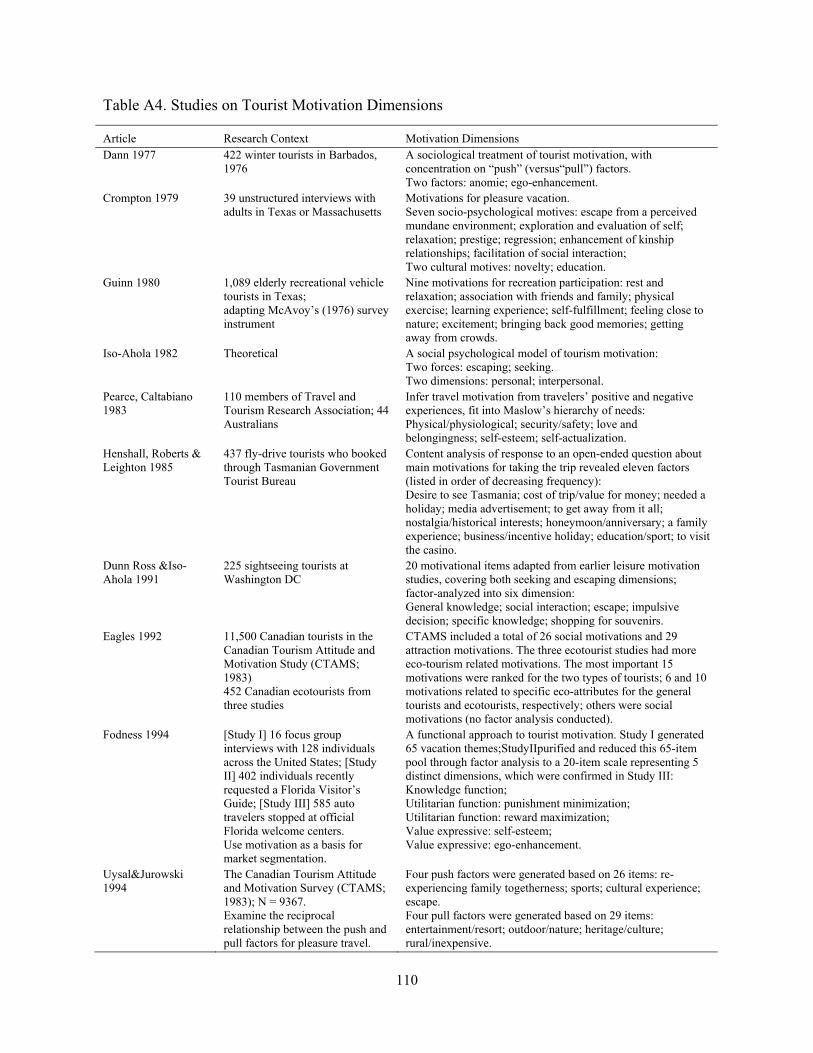
110
Table A4. Studies on Tourist Motivation Dimensions
Article Research Context Motivation Dimensions Dann 1977 422 winter tourists in Barbados,
1976 A sociological treatment of tourist motivation, with concentration on “push” (versus“pull”) factors. Two factors: anomie; ego-enhancement.
Crompton 1979 39 unstructured interviews with adults in Texas or Massachusetts
Motivations for pleasure vacation. Seven socio-psychological motives: escape from a perceived mundane environment; exploration and evaluation of self; relaxation; prestige; regression; enhancement of kinship relationships; facilitation of social interaction; Two cultural motives: novelty; education.
Guinn 1980 1,089 elderly recreational vehicle tourists in Texas; adapting McAvoy’s (1976) survey instrument
Nine motivations for recreation participation: rest and relaxation; association with friends and family; physical exercise; learning experience; self-fulfillment; feeling close to nature; excitement; bringing back good memories; getting away from crowds.
Iso-Ahola 1982 Theoretical A social psychological model of tourism motivation: Two forces: escaping; seeking. Two dimensions: personal; interpersonal.
Pearce, Caltabiano 1983
110 members of Travel and Tourism Research Association; 44 Australians
Infer travel motivation from travelers’ positive and negative experiences, fit into Maslow’s hierarchy of needs: Physical/physiological; security/safety; love and belongingness; self-esteem; self-actualization.
Henshall, Roberts & Leighton 1985
437 fly-drive tourists who booked through Tasmanian Government Tourist Bureau
Content analysis of response to an open-ended question about main motivations for taking the trip revealed eleven factors (listed in order of decreasing frequency): Desire to see Tasmania; cost of trip/value for money; needed a holiday; media advertisement; to get away from it all; nostalgia/historical interests; honeymoon/anniversary; a family experience; business/incentive holiday; education/sport; to visit the casino.
Dunn Ross &Iso-Ahola 1991
225 sightseeing tourists at Washington DC
20 motivational items adapted from earlier leisure motivation studies, covering both seeking and escaping dimensions; factor-analyzed into six dimension: General knowledge; social interaction; escape; impulsive decision; specific knowledge; shopping for souvenirs.
Eagles 1992 11,500 Canadian tourists in the Canadian Tourism Attitude and Motivation Study (CTAMS; 1983) 452 Canadian ecotourists from three studies
CTAMS included a total of 26 social motivations and 29 attraction motivations. The three ecotourist studies had more eco-tourism related motivations. The most important 15 motivations were ranked for the two types of tourists; 6 and 10 motivations related to specific eco-attributes for the general tourists and ecotourists, respectively; others were social motivations (no factor analysis conducted).
Fodness 1994 [Study I] 16 focus group interviews with 128 individuals across the United States; [Study II] 402 individuals recently requested a Florida Visitor’s Guide; [Study III] 585 auto travelers stopped at official Florida welcome centers. Use motivation as a basis for market segmentation.
A functional approach to tourist motivation. Study I generated 65 vacation themes;StudyIIpurified and reduced this 65-item pool through factor analysis to a 20-item scale representing 5 distinct dimensions, which were confirmed in Study III: Knowledge function; Utilitarian function: punishment minimization; Utilitarian function: reward maximization; Value expressive: self-esteem; Value expressive: ego-enhancement.
Uysal&Jurowski 1994
The Canadian Tourism Attitude and Motivation Survey (CTAMS; 1983); N = 9367. Examine the reciprocal relationship between the push and pull factors for pleasure travel.
Four push factors were generated based on 26 items: re-experiencing family togetherness; sports; cultural experience; escape. Four pull factors were generated based on 29 items: entertainment/resort; outdoor/nature; heritage/culture; rural/inexpensive.
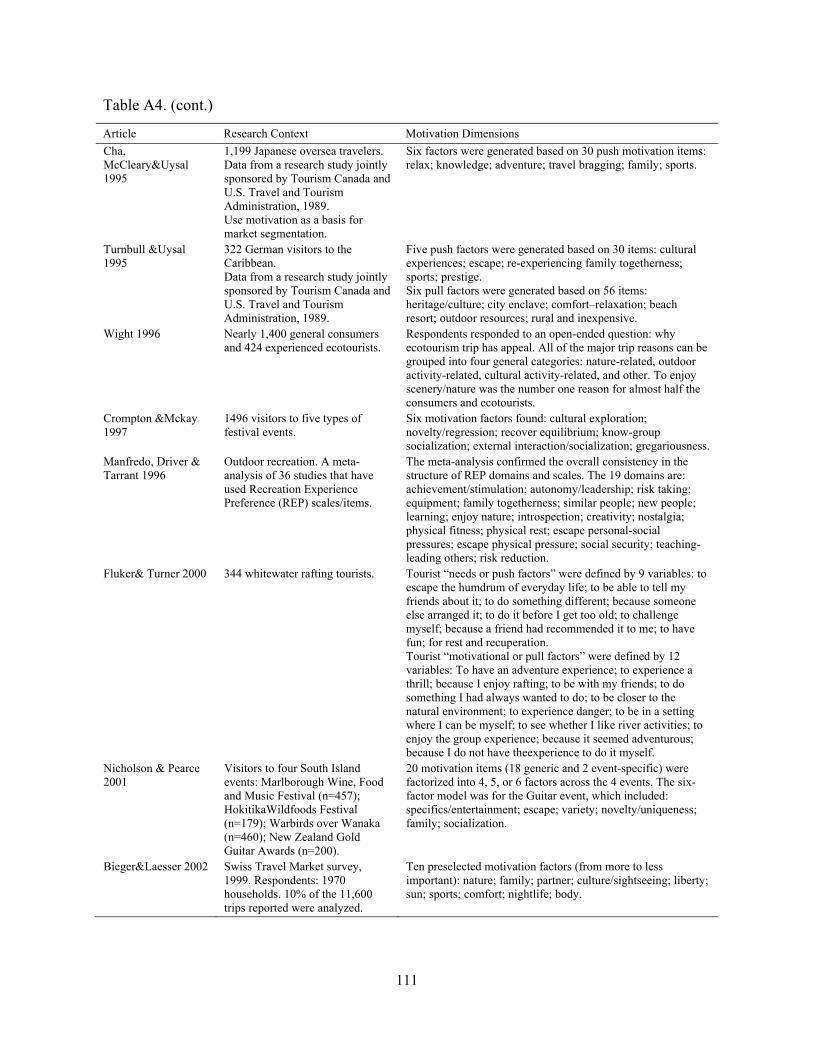
111
Table A4. (cont.)
Article Research Context Motivation Dimensions
Cha, McCleary&Uysal 1995
1,199 Japanese oversea travelers. Data from a research study jointly sponsored by Tourism Canada and U.S. Travel and Tourism Administration, 1989. Use motivation as a basis for market segmentation.
Six factors were generated based on 30 push motivation items: relax; knowledge; adventure; travel bragging; family; sports.
Turnbull &Uysal 1995
322 German visitors to the Caribbean. Data from a research study jointly sponsored by Tourism Canada and U.S. Travel and Tourism Administration, 1989.
Five push factors were generated based on 30 items: cultural experiences; escape; re-experiencing family togetherness; sports; prestige. Six pull factors were generated based on 56 items: heritage/culture; city enclave; comfort–relaxation; beach resort; outdoor resources; rural and inexpensive.
Wight 1996 Nearly 1,400 general consumers and 424 experienced ecotourists.
Respondents responded to an open-ended question: why ecotourism trip has appeal. All of the major trip reasons can be grouped into four general categories: nature-related, outdoor activity-related, cultural activity-related, and other. To enjoy scenery/nature was the number one reason for almost half the consumers and ecotourists.
Crompton &Mckay 1997
1496 visitors to five types of festival events.
Six motivation factors found: cultural exploration; novelty/regression; recover equilibrium; know-group socialization; external interaction/socialization; gregariousness.
Manfredo, Driver & Tarrant 1996
Outdoor recreation. A meta-analysis of 36 studies that have used Recreation Experience Preference (REP) scales/items.
The meta-analysis confirmed the overall consistency in the structure of REP domains and scales. The 19 domains are: achievement/stimulation; autonomy/leadership; risk taking; equipment; family togetherness; similar people; new people; learning; enjoy nature; introspection; creativity; nostalgia; physical fitness; physical rest; escape personal-social pressures; escape physical pressure; social security; teaching-leading others; risk reduction.
Fluker& Turner 2000 344 whitewater rafting tourists. Tourist “needs or push factors” were defined by 9 variables: to escape the humdrum of everyday life; to be able to tell my friends about it; to do something different; because someone else arranged it; to do it before I get too old; to challenge myself; because a friend had recommended it to me; to have fun; for rest and recuperation. Tourist “motivational or pull factors” were defined by 12 variables: To have an adventure experience; to experience a thrill; because I enjoy rafting; to be with my friends; to do something I had always wanted to do; to be closer to the natural environment; to experience danger; to be in a setting where I can be myself; to see whether I like river activities; to enjoy the group experience; because it seemed adventurous; because I do not have theexperience to do it myself.
Nicholson & Pearce 2001
Visitors to four South Island events: Marlborough Wine, Food and Music Festival (n=457); HokitikaWildfoods Festival (n=179); Warbirds over Wanaka (n=460); New Zealand Gold Guitar Awards (n=200).
20 motivation items (18 generic and 2 event-specific) were factorized into 4, 5, or 6 factors across the 4 events. The six-factor model was for the Guitar event, which included: specifics/entertainment; escape; variety; novelty/uniqueness; family; socialization.
Bieger&Laesser 2002 Swiss Travel Market survey, 1999. Respondents: 1970 households. 10% of the 11,600 trips reported were analyzed.
Ten preselected motivation factors (from more to less important): nature; family; partner; culture/sightseeing; liberty; sun; sports; comfort; nightlife; body.
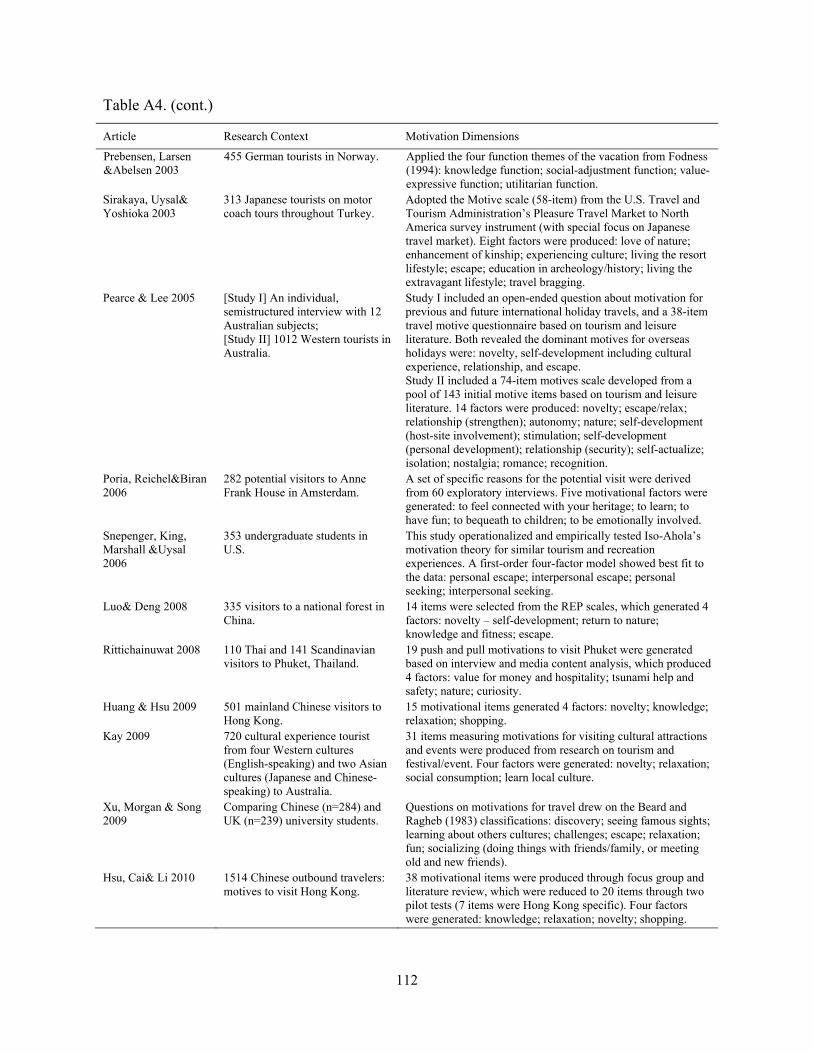
112
Table A4. (cont.)
Article Research Context Motivation Dimensions
Prebensen, Larsen &Abelsen 2003
455 German tourists in Norway. Applied the four function themes of the vacation from Fodness (1994): knowledge function; social-adjustment function; value-expressive function; utilitarian function.
Sirakaya, Uysal& Yoshioka 2003
313 Japanese tourists on motor coach tours throughout Turkey.
Adopted the Motive scale (58-item) from the U.S. Travel and Tourism Administration’s Pleasure Travel Market to North America survey instrument (with special focus on Japanese travel market). Eight factors were produced: love of nature; enhancement of kinship; experiencing culture; living the resort lifestyle; escape; education in archeology/history; living the extravagant lifestyle; travel bragging.
Pearce & Lee 2005 [Study I] An individual, semistructured interview with 12 Australian subjects; [Study II] 1012 Western tourists in Australia.
Study I included an open-ended question about motivation for previous and future international holiday travels, and a 38-item travel motive questionnaire based on tourism and leisure literature. Both revealed the dominant motives for overseas holidays were: novelty, self-development including cultural experience, relationship, and escape. Study II included a 74-item motives scale developed from a pool of 143 initial motive items based on tourism and leisure literature. 14 factors were produced: novelty; escape/relax; relationship (strengthen); autonomy; nature; self-development (host-site involvement); stimulation; self-development (personal development); relationship (security); self-actualize; isolation; nostalgia; romance; recognition.
Poria, Reichel&Biran 2006
282 potential visitors to Anne Frank House in Amsterdam.
A set of specific reasons for the potential visit were derived from 60 exploratory interviews. Five motivational factors were generated: to feel connected with your heritage; to learn; to have fun; to bequeath to children; to be emotionally involved.
Snepenger, King, Marshall &Uysal 2006
353 undergraduate students in U.S.
This study operationalized and empirically tested Iso-Ahola’s motivation theory for similar tourism and recreation experiences. A first-order four-factor model showed best fit to the data: personal escape; interpersonal escape; personal seeking; interpersonal seeking.
Luo& Deng 2008 335 visitors to a national forest in China.
14 items were selected from the REP scales, which generated 4 factors: novelty – self-development; return to nature; knowledge and fitness; escape.
Rittichainuwat 2008 110 Thai and 141 Scandinavian visitors to Phuket, Thailand.
19 push and pull motivations to visit Phuket were generated based on interview and media content analysis, which produced 4 factors: value for money and hospitality; tsunami help and safety; nature; curiosity.
Huang & Hsu 2009 501 mainland Chinese visitors to Hong Kong.
15 motivational items generated 4 factors: novelty; knowledge; relaxation; shopping.
Kay 2009 720 cultural experience tourist from four Western cultures (English-speaking) and two Asian cultures (Japanese and Chinese-speaking) to Australia.
31 items measuring motivations for visiting cultural attractions and events were produced from research on tourism and festival/event. Four factors were generated: novelty; relaxation; social consumption; learn local culture.
Xu, Morgan & Song 2009
Comparing Chinese (n=284) and UK (n=239) university students.
Questions on motivations for travel drew on the Beard and Ragheb (1983) classifications: discovery; seeing famous sights; learning about others cultures; challenges; escape; relaxation; fun; socializing (doing things with friends/family, or meeting old and new friends).
Hsu, Cai& Li 2010 1514 Chinese outbound travelers: motives to visit Hong Kong.
38 motivational items were produced through focus group and literature review, which were reduced to 20 items through two pilot tests (7 items were Hong Kong specific). Four factors were generated: knowledge; relaxation; novelty; shopping.

113
Table A5. Common Factors of Tourist Motivation found in 27 Empirical Studies
Motives
Studies Esc
ape
/rel
ax
Kno
wle
dge
Nov
elty
Fam
ily/
fr
iend
s
Soc
ial
inte
ract
ion
Ent
erta
inm
ent
/exc
item
ent
Soc
ial
pres
tige
Nat
ure
Sel
f-
deve
lopm
ent
Adv
entu
re
Dunn Ross & Iso-Ahola 1991 1 1 1
Uysal & Jurowski 1994 1 1 1
Cha, McCleary &Uysal 1995 1 1 1 1 1
Turbull& Uysal 1995 1 1 1 1
Manfredo, Driver & Tarrant 1996 1 1 1 1 1 1 1
Crompton & McKay 1997 1 1 1 1 1
Nicholson & Pearce 2001
Study 1 1 1 1 1
Study 2 1 1 1 1 1
Study 3 1 1 1 1 1
Study 4 1 1 1 1 1 1
Sirakaya, Uysal & Yoshioka 2003 1 1 1 1 1 1
Lee, Lee & Wicks, 2004 1 1 1 1 1 1
Kau& Lim 2005 1 1 1 1 1 1
Pearce & Lee 2005 1 1 1 1 1 1 1 1
Yoon &Uysal 2005 1 1 1 1 1 1
Poria, Reichel & Biran 2006 1 1 1
Pan & Ryan 2007 1 1 1 1
Schofield & Thompson 2007 1 1 1 1 1
Kim 2008 1 1 1 1 1
Luo& Deng 2008 1 1 1 1
Rittichainuwat 2008 1 1
Huang & Hsu 2009 1 1 1
Kay 2009 1 1 1 1
Lee & Beeler 2009 1 1 1
Hsu, Cai& Li 2010 1 1 1
McDowell 2010 1 1 1 1
Counts 23 20 15 18 12 10 6 5 5 5
% 88 77 58 69 46 38 23 19 19 19

114
Table A6. Studies on the Relationship between Motivation and Satisfaction
Article Research Context Motivation Dimensions Findings**
Lee, Lee & Wicks 2004a
Visitors to the 2000 Kyongju World Culture Expo
Six dimensions: Cultural exploration, Family togetherness, Novelty, Escape, Event attractions, and Socialization
(1) Four clusters: Culture and family seeker, Multi-purpose seeker, Escape seeker, and Event seeker. (2) Multi-purpose seekers had the higher ratings on most motivation dimensions and were also the most satisfied.
Kau& Lim 2005a
Chinese tourists to Singapore
Six dimensions: Prestige/knowledge, Escape/relax, Adventure/excitement, Exploration, Pleasure seeking/sightseeing, Enhance family/social relationship
(1) Four clusters: Family/relaxation seeker, Novelty seeker, Adventure/pleasure seeker, and Prestige/knowledge seeker. (2) Family/relaxation seekers had greater overall satisfaction than the other three clusters.
Devesa, Laguna & Palacios 2010a
Visitors to a rural tourism destination (Segovia) in Spain
Five push and pull factors: Looking for tranquility and rest through contact with nature, Cultural and monumental motivation, Return reasons/motivation, Nature activities, and Reasons of convenience.
(1) Four clusters: Visitor looking for tranquility, rest, and contact with nature; Cultural visitor; Proximity, gastronomic and nature visitor; and Return tourist. (2) Performance of some destination attributes was more pertinent to the satisfaction of certain motivation cluster. (3) Performance of some destination attributes affected satisfaction of all clusters independent of travel motivations.
Fielding, Pearce & Hughes 1992a
Ayers Rock visitors
Intrinsically motivated vs. Achievement motivated
Intrinsically motivated visitors reported greater enjoyment and perceived time passing more quickly than Achievement motivated visitors.
Pan & Ryan, 2007b
Tourists to Pirongia Forest Park, New Zealand
Five intrinsic (push) motives: Relaxation, Social, Belonging, Mastery, and Intellectual; Two pull factors: Nature/accommodation, and Infrastructure.
Positive effect: Relaxation, Infrastructure.
Schofield& Thompson 2007b
Visitors to the 2005 Naadam Festival, Ulaanbaatar
Five dimensions: Cultural exploration, Togetherness (with family and friends), Socialization, Sport attraction, and Local special events.
Positive effect: Cultural exploration, Local specific events; Negative effect: Sports attraction.
Meng, Tepanon&Uysal2008b Visitors to a nature-based resort in Southwest Virginia
Four travel motivations: Activities for seeing and doing, Relaxation/familiarity, Family/friend togetherness, and Novelty/romance. Four pull factors: Friendliness & accessibility, Food & location, Natural scenery & activity, and Lodging.
Negative effect: Family/friend togetherness, Food & location (at a .10 significance level).
Lee & Beeler 2009b
Visitors to Tallahassee's 19th Annual Winter Festival in 2005
Five factors: Novelty, Reminiscence, Family togetherness, Escaping from boredom, and Fun with friends.
Positive effect: Reminiscence.
McDowall 2010b
Visitors to the Tenth Month Merit-Making Festival in 2007 in Thailand
Four motivation factors: Family/friends, Excitement, Event novelty, and Escape.
Positive effect: Event novelty, Escape (for resident visitors);Event novelty (for non-resident visitors).
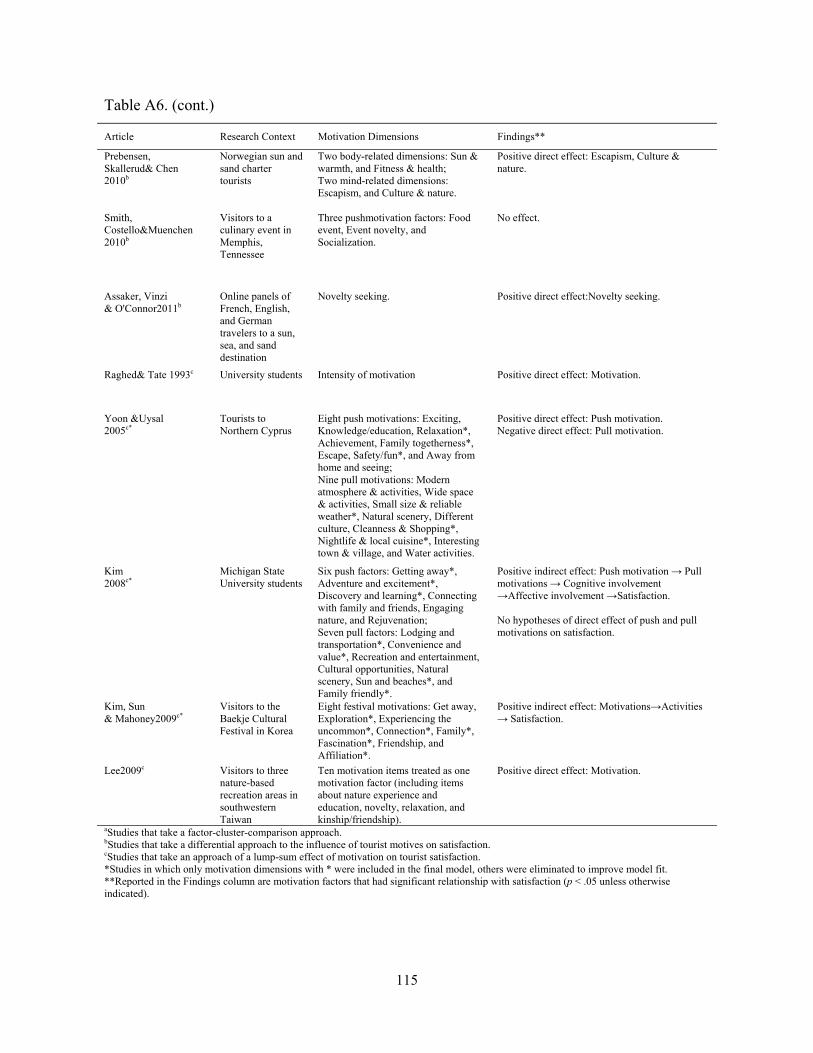
115
Table A6. (cont.)
Article Research Context Motivation Dimensions Findings**
Prebensen, Skallerud& Chen 2010b
Norwegian sun and sand charter tourists
Two body-related dimensions: Sun & warmth, and Fitness & health; Two mind-related dimensions: Escapism, and Culture & nature.
Positive direct effect: Escapism, Culture & nature.
Smith, Costello&Muenchen 2010b
Visitors to a culinary event in Memphis, Tennessee
Three pushmotivation factors: Food event, Event novelty, and Socialization.
No effect.
Assaker, Vinzi & O'Connor2011b
Online panels of French, English, and German travelers to a sun, sea, and sand destination
Novelty seeking. Positive direct effect:Novelty seeking.
Raghed& Tate 1993c University students Intensity of motivation Positive direct effect: Motivation.
Yoon &Uysal 2005c*
Tourists to Northern Cyprus
Eight push motivations: Exciting, Knowledge/education, Relaxation*, Achievement, Family togetherness*, Escape, Safety/fun*, and Away from home and seeing; Nine pull motivations: Modern atmosphere & activities, Wide space & activities, Small size & reliable weather*, Natural scenery, Different culture, Cleanness & Shopping*, Nightlife & local cuisine*, Interesting town & village, and Water activities.
Positive direct effect: Push motivation. Negative direct effect: Pull motivation.
Kim 2008c*
Michigan State University students
Six push factors: Getting away*, Adventure and excitement*, Discovery and learning*, Connecting with family and friends, Engaging nature, and Rejuvenation; Seven pull factors: Lodging and transportation*, Convenience and value*, Recreation and entertainment, Cultural opportunities, Natural scenery, Sun and beaches*, and Family friendly*.
Positive indirect effect: Push motivation → Pull motivations → Cognitive involvement →Affective involvement →Satisfaction. No hypotheses of direct effect of push and pull motivations on satisfaction.
Kim, Sun & Mahoney2009c*
Visitors to the Baekje Cultural Festival in Korea
Eight festival motivations: Get away, Exploration*, Experiencing the uncommon*, Connection*, Family*, Fascination*, Friendship, and Affiliation*.
Positive indirect effect: Motivations→Activities → Satisfaction.
Lee2009c Visitors to three nature-based recreation areas in southwestern Taiwan
Ten motivation items treated as one motivation factor (including items about nature experience and education, novelty, relaxation, and kinship/friendship).
Positive direct effect: Motivation.
aStudies that take a factor-cluster-comparison approach. bStudies that take a differential approach to the influence of tourist motives on satisfaction. cStudies that take an approach of a lump-sum effect of motivation on tourist satisfaction. *Studies in which only motivation dimensions with * were included in the final model, others were eliminated to improve model fit. **Reported in the Findings column are motivation factors that had significant relationship with satisfaction (p < .05 unless otherwise indicated).

FIG
APP
GURES FO
116
PENDIX B
OR DATA AANALYSIS
![Critical ideals of graphs - CINVESTAV · G], the determinantal ideals of L(G;X G) are ideals on Z[X G] which we call critical ideals of G. Next we study how the critical ideals encode](https://img.dokumen.tips/doc/110x75/5fa3f5e4efc6f36b113a3fab/critical-ideals-of-graphs-cinvestav-g-the-determinantal-ideals-of-lgx-g-are.jpg)