Embed Size (px)
Citation preview
0' 6. al I i
co
DTIC
~OF rA1
A Wind Tunnel and Computer Investigation of theLow Speed Aerodynamic Characteristics of the
Prone Escape System (PRESS)
THESIS
Lonnie R. DillonCaptain, USAF
AFIT/GAE/AA/88D-09
DEPARTMENT OF THE AIR FORCE
AIR UNIVERSITY
AIR FORCE INSTITUTE OF TECHNOLOGY
Wright-Patterson Air Force Base, Ohio
m WTN8---THMO A,Ap..v... .... ,.u,.e Te -iemwi~ 'l

AFIT/GAE/AA/88D-09
A Wind Tunnel and Computer Investigation of theLow Speed Aerodynamic Characteristics of the
Prone Escape System (PRESS)
THESIS
Lonnie R. DillonCaptain, USAF
AFIT/GAE/AA/88D-09
DTICELECTEII
HApproved for public release; distribution unlimited

AFIT/GAE/AA/88D-09
A Wind Tunnel and Computer Investigation of the
Low Speed Aerodynamic Characteristics of the
Prone Escape System (PRESS)
THESIS
Presented to the Faculty of the School of Engineering
of the Air Force Institute of Technology
Air University
In Partial Fulfilhment of the
Requirements for the Degree of
Master of Science in Aeronautical Engineering
Lonnie R. Dillon, B.S.
Captain, USAF
December, 1988
Approved for public release; distribution unlimited

Ac knowlcdgmycni
I would like to thank many people who helped me with my research, without whom
this thesis would have been much shorter but much less complete. First and foremost I
would like to thank my adviser, Lt Col Paul King, whose patience and guidance helped
me through rough waters on many occasions, as well as allowing rne the freedom of letting
me learn from my own mistages. Dave Driscoll's skill in the model shop helped make
the experimental research a possibility, and Jay Anderson and Andy Riemenschneider
assembled a brand new pressure measurement system to keep me on schedule in the wind
tunnel. The exceptional prograirming skill of Frank Baxter provided the wind tunnel data
acquisition and reduction software. The water tunnel work would have been impossible
without the unflagging support vf Lieutenant Francis Geiser in the Aeromechanics Division
of the Flight Dynamics Laboratory. The computer support for QUADPAN provided by
Norma Taylor of the Aircraft Dynamics Branch of the 4950 Test Wing proved indispensable
to the analytical portion of this, thesis. Finally, the support at home of my wifeM
allowed me the time and motivation to put this thesis together.
Lonnie R. Dillon
Accession ForNTIS GRAT
DTIC TABUnan.nouno i
Ditrbu iooJ
Availability CodesAvail. and/or
Dtst Special

Table of Contents
Page
Acknowledgments. .. .. ... ... ... ... ... ... ... ... ... ..... ii
Table of Contents .. .. .. ... ... ... .... ... ... ... ... ....... iii
List of Figures. .. .. .. ... .... ... ... ... ... ... ... ... .... vii
List of Tables .. .. ... ... ... ... ... ... .... ... ... ... .... ix
List of Symbols. .. .. ... ... ... .... ... ... ... ... ... ...... ix
Abstract. .. .. ... ... ... ... .... ... ... ... ... ... ....... iii
I. Introduction. .. .. ... ... ... ... ... ... .... ... ....... 1-1
Background. .. .. .. ... .... ... ... ... ... ... .... 1-1
G-Force Tolerance. .. .. .. ... ... ... ... ... .... 1-1
Windblast Protection .. .. .. ... ... ... ... ...... 1-2
PRESS Design Study. .. .. .. ... ... ... ... ... ...... 1-4
Research Objectives .. .. .. .. ... ... ... ... ... ...... 1-5
Primary Objective .. .. .. .. ... ... ... ... ...... 1-5
Secondary Objective. .. .. .. .. ... ... .... ....... 1-6
II. Experimental Model Designs .. .. .. ... ... ... ... .... ..... 2-1
Wind Tunnel Model .. .. .. .. ... ... ... ... ... ...... 2-1
Precision of Construction. .. .. .. ... ... ... ...... 2-1
Scale Requirements .. .. .. ... ... ... ... ... .... 2-2
Onboard Instrumentation. .. .. .. .. .... ... ....... 2-3
Tunnel Mounting. .. .. .. .. ... ... ... ... ...... 2-3
Materials. .. .. .. ... ... ... ... ... ... ...... 2-5
iii
Page
Final Design .. .. .. .. ... ... ... ...... ... ....... 2-5
Water Tunnel Model .. .. .. ... ... ... ... ... ........ 2-7
111. Wind Tunnel Testing
Procedures and Data Reduction .. .. .. ... ... .... ... ... ... 3-1
Facility Description. .. .. .. ... ... ... ... ... ... .... 3-1
Instrumentation .. .. .. ... ... ... ... ... ...... 3-1
Flow Angles and Coordinate System .. .. .. ... ... ........ 3-2
Trim Attitude .. .. .. ... ... ... ... ... ........ 3-4
Model Test Configurations. .. .. .. ... ... ... ... ...... 3-4
Model Orientation .. .. .. .. ... ... ... ... ...... 3-6
Stability Fins .. .. .. .. ... ... ... ... ... ...... 3-6
Pressure Port Layout .. .. .. ... ... ... ... ...... 3-8
Test Procedure .. .. .. .. .. ... .... ... ... ... ....... 3-9
Data Reduction. .. .. .. ... ... ... ... ... .... ..... 3-9
Velocity Scaling. .. .. .. ... .... ... ... ... ... 3-10
Wind Tunnel Corrections .. .. .. .. ... .... ... ... 3-11
Dimensionless Coefficients .. .. .. .. ... ... ... ..... 3-12
Center of Gravity Considerations .. .. .. .. ... ... ... 3-13
IV. Wind Tunnel Test Results .. .. ... ... ... ... ... ... ...... 4-1
Force and Moment Data. .. .. .. ... ... ... ... ........ 4-1
Longitudinal Forces and Moments .. .. .. .. .... ..... 4-1
Lateral Forces and Moments. .. .. .. ... ... ........ 4-6
Pressure Data. .. .. .. ... ... ... ... ... ... ........ 4-8
Stability Augmentation Effectiveness .. .. .. ... ... ... ... 4-11
Force Effects .. .. .. ... ... ... ... ... ... ..... 4-11
Moment Effects .. .. .. ... ... ... .... ... ..... 4-16
Center of Gravity Considerations. .. .. .. .... ... ... ... 4-17
iv

Page
V. Water Tunnel
Flow Visualization ........ ............................... 5-1
Facility Description ........ .......................... 5-1
Test Configurations ........ .......................... 5-1
Data Collection ......... ............................ 5-4
Test Procedure ........ ............................. 5-4
Results ......... ................................. 5-4
Flow Separation ........ ........................ 5-7
Vortical Flow ........ .......................... 5-7
VI. Computer Analysis ....... .. ............................. 6-1
Modified Newtonian Method ............................ 6-1
Subsonic Aerodynamic Paneling Techniques ................. 6-2
Apparent Body Analysis ....... ....................... 6-4
QUADPAN Results ........ .......................... 6-6
Pressure Data ........ ......................... 6-6
Force And Moment Data ......................... 6-11
VII. Summary Of Results and Conclusions ...... ................... 7-1
Stability Characteristics of the PRESS .................. 7-1
Computer Analysis Results ....... ...................... 7-1
Conclusions ....... .............................. 7-2
Bibliography ........ ..................................... BIB-i
A. Wind Tunnel Program Algorithm ....... ..................... A-1
Calibration ........ ............................... A-1
Balance Strain Gage Calibration ..... ............... A-i
Sting Bend Calibration ....... .................... A-2
Angle of Attack Calibration ...... .................. A-2
v

Page
Pressure Calibration ....... ...................... A-3
Data Collection ........ ............................ A-3
Tare Slope Calculation ........ ........................ A-4
Data Reduction ........ ............................ A-4
B. Tare Slope Corrections and Calculations ...... ................. B-i
General Form of Tare Equations ......................... B-I
Transformation Matrix and Tare Equations .... ............. B-2
Tare Slope Calculation ........ ........................ B-6
Vita ............. .......................................... VITA-I
vi

List of Figures
Figure Page
1.1. Example of Semi-Prone Seating .......................... .I... 1-3
1.2. Prone Escape System (PRESS) ....... ....................... 1-4
2.1. PRESS Pressure port layout ........ ........................ 2-4
2.2. PRESS model design ......... ............................ 2-6
3.1. Body Axis and Flow Angles ........ ........................ 3-3
3.2. Body Axis Force and Moment Definitions ...................... 3-5
3.3. Large Tail .......... .................................. 3-7
3.4. Yaw Fins .......... ................................... 3-8
4.1. PRESS Axial Force as a Function of Angle of Attack .... .......... 4-2
4.2. PRESS Normal Force as a Function of Angle of Attack ......... 4-2
4.3. PRESS Lift as a Function of Angle of Attack .................... 4-3
4.4. PRESS Drag as a Function of Angle of Attack ..... .............. 4-3
4.5. PRESS Pitching Moment as a Function of Angle of Attack .......... 4-4
4.6. PRESS Side Force as a Function of Sideslip ...................... 4-7
4.7. PRESS Rolling Moment as a Function of Sideslip ..... ............ 4-7
4.8. PRESS Yawing Moment as a Function of Sideslip ..... ............ 4-8
4.9. Cowling Pressures as a Function of Angle of Attack ............... 4-10
4.10. Upper Cowling Pressures as a Function of Angle of Attack .......... 4-10
4.11. Seat Pan Pressure as a Function of Angle of Attack ............... 4-11
4.12. Effect of Stability Augmentation Devices on Axial Force ............. 4-12
4.13. Effect of Stability Augmentation Devices on Normal Force .......... 4-12
4.14. Effect of Stability Augmentation Devices on Lift ................. 4-13
4.15. Effect of Stability Augmentation Devices on Drag .... ............ 4-13
vii

Figure Page
4.16. Effect of Stability Augmentation Devices on Pitching Moment 4-14
4.17. Effect of Stability Augmentation Devices on Side Force .... ......... 4-14
4.18. Effect of Stability Augmentation Devices on Rolling Moment ...... .... 4-15
4.19. Effect of Stability Augmentation Devices on Yawing Moment ....... ... 4-15
4.20. Center of Gravity Forces and Moments ...... .................. 4-18
4.21. CG Locations to Trim PRESS at 35 Degrees ..... ............... 4-19
4.22. Effect of VaryingCG Locations on Pitch Stability (Baseline) ...... 4-20
4.23. CG Locations to Trim PRESS at 35 Degrees with Short Tail ...... .... 4-22
4.24. Effect of Varying CG Locations on Pitch Stability (Short Tail) 4-23
5.1. Dye Source Locations ........ ............................ 5-3
5.2. PRESS Flow field, a = 52 deg ....... ....................... 5-5
5.3. PRESS Flow field, a = 70 deg ....... ....................... 5-6
5.4. Lateral Separation Vorticity ........ ........................ 5-8
6.1. PRESS Apparent Body Computer Model ..... ................. 6-5
6.2. QUADPAN Pressure Output for Impact Surfaces ..... ............ 6-7
6.3. QUADPAN/Wind Tunnel Comparison of C, for Front Cowling. 6-8
6.4. QUADPAN/Wind Tunnel Comparison of C, for Bottom Cowling . . . 6-9
6.5. QUADPAN/Wind Tunnel Comparison of Cp, for Chamfer ........... 6-10
B.I. Balance Coordinate System ....... ......................... B-4
B.2. Weight Induced Moments (Body Coordinates) ..... .............. B-5
Viii

0 List of Tables
Table Page
2.1. PRESS Pressure port layout .. .. .. .. .. .. .. . ... ... ....... 2-5
AlI. Angle Spline Tables .. .. .. .. .. .. ... .. . .. . .. . .. . ..... A-5
ix
List of Symbols
Symbols
a.. . ... ... ... ... ... .... ... ... ..... Angle of attack, deg
43 .. .. .. .. . . . . . ... .. .. .. . Angle of sideslip, deg
I . .. . . . ... .. .. .. .. . Angle of sting prebend, deg
b .. . . .. .. .. . Angle that flow makes with surface plane, deg
AP .. .. . . . ... .. . Pressure difference from atmospheric, psf
0...... ... .. .... ... .... ... ... ... Yoke pitch angle, deg
11 .. .. .. .. . . . . ... .. .. .. . Fluid viscosity, Ib-sec/ft2
V...........................Fluid kinematic Viscosity, 111p, ft 2 /sec
p.... ... ... ... ... .. ............. Fluid density, slugs/ft3
. .. .. .. .. .... .. .. . ... .. .... . M odel roll angle, deg
. .. .. .. . . . .. .. .. .. . . . Yoke yaw angle, deg
a.. . .. ... ... ... .... ... ... ... ... Speed of sound, ft/sec
a.. . ... ... ... ... ... ... ... ... ..... acceleration, ft/sec/sec
AX.. .... ... ... ... ... ... ... ... ..... Axial force/gage, lbs
CD.......... ............. ........... Coefficient of drag
CL..... .... .... ... .... .... .... ....... Coefficient of lift
CI .. .. . . . .. .. . . . .. .. . Coefficient of rolling moment
CM... .... .... ... .... .... .... Coefficient of pitching moment
C IN..... .... ... .... .... ....... Coefficient of yawing moment
CP.. ... .... ... ... ... ... ... Coefficient of Pressure, (p - p#4/q
Cy.... ... ... .... ... ... ... ... ..... Coefficient of sideforce
D... ... ... .... ... ... ... ... ... ... ... ........ Drag
x

g.. . ... ... ..... ... ....... Acceleration due to gravity, ft/sec 2
g.. .. ... .... ... ... ... Acceleration units measured in "gravities"
K.... ... ... ... ... ... ........ Modified Newtonian coefficient
L..... ... .... ... ... ... ... ... ... ... Reference length, ft
L..... ... .... ... ... ... ... ... ... ... ... ... ... Lift
1.. ....................................... Mass, slugs
A!..... ... ... ... ... ... ... ... ... ..... Mach number, V/a
N1.... ...... .... ... ... ... ... Forward normal force/gage, lbs
N2... ... ... ... ... ... ........ Rearward normal force/gage, lbs
p....................................pressure, lplV2, psf
q.. ... ... ... ... ... .... ... ... Dynamic pressure, p2 , s
RE... ... ... ... ... ... ... ... .... Reynolds number, pVL/p
RM.... ..... ... ... ... ... ..... Rolling moment/gage, ft-lbs
S.. .. .... ... ... ... ... ... ... ... ..... Reference area, ft2
V.. .. ... ... .... ... ... ... ... ... ... ... Velocity, ft/-ec
W . ... ... ... ... ... ... ... ... ... ... Weight of model, lbs
a... .. ... .... ...... Distance of model CG from BMC along .- axis, ft
Y.. .. ... .... ...... Distance of model CG from BMC along y-axis, ft
YI... ... ... ... ... ... ... ....... Forward side force/gage, lbs
IT2.... .... ... ... ... ... ... ... Rearward side force/gage, lbs
z.. . .... .... ...... Distance of model CG from BMC along z-axis, ft
Azio System..
xYZ .. .. .. .. .. .. .. .. .... Wind tunnel coordinates, (wind axes)
XBYBZB. .. .. .. .. .. .... ...... Balance coordinates, Body coordinates
xi

X s .'sZs . . . . . . . . . . . . . . . . . . . . . . . . . . . . . Stability axes
XwYwZw ................................ W ind Axes
X, '1 Z1 . . . . . . . . . . . . . . . . . . . . . . . . . . . . Intermediate system
X212Z2 ......... ................... Intermediate system
Subscripts
A ............................... Aerodynamic (sub-subscript)
A .......... ............................ Axial force (balance)
C. ........... ................................. Corrected
D ............ ..................................... Drag
I ........... ................................ Roll moment
L ............ ...................................... Lift
A! .......... ................................ Pitch moment
* N ............................................ Yaw moment
N ......... .......................... Normal force, (balance)
Q ......... Used when choice of axis unimportant i.e. derivations
S .......... ............................. Side force (balance)
T ........... ..................................... Total
X .......... ............................. Axial force (Body)
X ......... .... Used when choice of axis unimportant i.e. derivations
Z .......... ............................ Normal force (body)
0 ........... ................................... Constant
Miscellaneous
ACES ..................... Advanced Concept Ejection Seat
xii

AGSNI.. .. ... ... ... ... ... ... ..... Anti-g Straining Mantievers
BMC .. .. .... ... ... ... ... ... ... ... Balance moment center
CG... .... ... ... ... ... ... ... .... ... Center of Gravity
CP.... ... .... ... ... ... ... ... ... ... Center of Pressure
h-valie .. .. .. ... ... ... ... Vertical distance from aortic valve to eyes
PRESS .. .. .. ... ... ... ... ... ... ... ... Prone Escape System
xiii

AFIT/GAE/AA/8RD-09
Abstract
Due to new design technology, future fighter aircraft will fly at higher g levels than
e-ver before. As a result a previous preliminary design study was conducted to develop an
ejection seat providing higher g-tolerance for the crewinember during maneuvering as well
as improved windblast protection during ejection. This seatotifized the crewmember in a
prone, or leaning forward, position. The Prone Ejection System (PRESS) was computer
simulated at supersonic conditions in the earlier report and found satisfactory. It was the
purpose of this/research to perform an experimental low speed study of the aerodynamic
characteristics of the PRESS. Wind tunnel testing was performed to determine the static
stability of the PRESS and measure pressures over the seat. It was determined that static
pitch stability did not occur at the desired angle of attack, but could be easily corrected
with aerodynamic fins and/or a shift in the center of gravity. Directional stability was also
confirmed. (In addition~,an analytical experiment was performed to determine whether a
potential paneling code could be modified to predict flow conditions about the PRESS.
An apparent body was constructed by including the regions of flow separation as part
of the seat itself. Water tunnel flow visualization wastutilized to determine the shape of
the apparent body. The computer analysis showed that a paneling code could accurately
predict the pressure coefficients on the cowling. /I T .:: -
xiv

A Wind Tunnel and Computer Investigation of the
Low Speed Aerodynamic Characteristics of the
Prone Escape System (PRESS)
I. Introduction
Background
The major goal of any air force is to obtain and keep control of the airspace over the
land battle and other areas of tactical and strategic importance. Primarily, this means pro-
viding pilots with aircraft that are better than potential adversaries in terms of performance
and maneuverability. For the United States air forces, the threat of facing a numerically
superior enemy has made this goal even more imperative. This realization has driven the
American industrial complex and military engineering researchers to develop new technolo-
gies to improve the capabilities of today's fighter aircraft. These advanced technologies
have had two major ramifications. First, with improved aircraft maneuverability, the level
of g-forces encountered by the pilot during air-to-air combat has increased to the point
that his tolerance to these forces has btome a major limiting factor of the aircraft maneu-
vering envelope. Secondly, protecting the pilot during ejection has become more difficult.
Because of improved aircraft performance, operating envelopes have expanded to higher
airspeeds and altitudes, increasing the severity of the enviromnent outside the cockpit.
G-Force Tolerance The improved maneuverability of modern and future fighters has
forced engineers to understand the human body's reactions to g-forces and to design seats
to increase the human tolerance to them. The basic problem is to maintain the blood flow
to the brain and eyes to prevent the pilot from blacking out. Primarily, active and passive
are the two methods employed.
Active methods include g-suits and Anti-g Straining Manuevers (AGSM). G-suits
provide external pressure to the abdomen and lower limbs, increasing the blood pressure
and restricting the flow of blood to the body parts below heart level. This increased
I-I

pressure asirts the heart in pumping blood to the head. AGSM refers to the pilot's
tensing of his abdominal and leg muscles while breathing in short gasps. The breathing
pattern increases the chest cavity pressure, and the muscle tensing increases the blood
pressure. Combined, the suit and pilot actions can increase g-tolerance to approximately
nine g's [4:1.31. The AGSM requires anticipation by the crew members, however, and is
quite fatiguing.
On the other hand, passive techniques require no hardware or effort by the crewmem-
ber. In one technique, the body is positioned in the seat to reduce the effort by the heart
to pump blood to the head. Reducing the vertical distance between the heart's aortic
valve and the head and eyes (h-value) will reduce the required blood pressure. An obvious
method of applying this technique is to seat the pilot in a reclined position. However,
Reference [4:5.5] showed that the pilot must recline at least 60 degrees before any signif-
icant incrcase in g-tolerance is obtained. At these angles however, the body is extremely
susceptible to injury during an ejection. In addition, pilot visibility is severely limited
when reclined to such a large angle.
Research in recent years has involved placing the pilot in a semi-prone, or leaning
forward, position (see Figure 1.1). The semi-prone position has distinct advantages over
the typical reclined position. Primarily, Reference [4] showed that leaning the pilot forward
an angle of 35 degrees achieved the same improvement in g-tolerance as reclining the pilot
backwards 65 degrees. This allows the pilot to seat in a more compact position, providing
more protection in the event of ejection. In addition, this position does not impose visibility
restriction on the pilot. In fact, it is easier for the pilot to look directly behind him from
the semi-prone position than the reclined position [2], a distinct advantage in an air-to-air
combat situation.
Vindblast Protection A major danger facing a pilot upon ejection is the windblast.
At speeds above 600 knots, the windblast can cause serious injuries. With the increased
performance of today's aircraft, the windblast is quite severe, yet ejection seat designs
have not kept pace and current seats cannot protect the pilot at the higher speeds. This
situation can force a pilot during an emergency to decide whether to eject at too high a
1-2

Figure I.I. Example of Semi-Prone Seating
velocity, or to stay in a damaged and possibly out-of-control aircraft. Both options present
serious risks to the pilot.
The most widely used ejection seats in U.S. aircraft, the McDonnell-Douglas Ad-
vanced Concept Ejection Seat (ACES) II and the British Martin-Baker MK series, do not
shield the pilot from the windblast. The only U.S. aircraft employing windblast protec-
tion during ejection at high speeds is the F-ill. This aircraft utilizes an escape capsule
which completely encloses the flight crew. A capsule system was initially installed on the
B-I bomber as well, but was replaced with ACES II seats on the fourth prototype and
all subsequent production aircraft. There were several reasons for the change, including
in-flight instability in some flight regimes, maintainability expenses, and overly complex
removal procedures for inspection (5:4871. In sunmary, most modern, high-performance
aircraft are still equipped with ACES II and Martin-Baker ejection seats. Therefore, there
1-3

H~~Fi s te1
et
Figure 1.2. Prone Escape System (PRESS)
is a need for ejection seats capable of protecting the crew in an expanded envelope.
PRESS Design Study
In Reference [41, the authors designed an ejection system which enhances g-tolerance
as well as incorporates a measure of windblast protection. Their resulting design is the
Prone Escape System (PRESS) as shown in Figure 1.2.
In this seat, the crewmember can sit upright during a conventional, cruise-type flight
condition, but lean forward against the chest plate at an angle of approximately 35 de-
grees during high-g maneuvering or an ejection sequence. In addition, once he clears the
aircraft during an ejection, the pilot is provided windblast protection from a cowling and a
1-4

lteadshield. The study predicted that if the ideal pitch orientation could be achieved, safe
ejections could be made in the PRESS at dynamic pressures, q, up to 2410 psf [4:11.7],
where safe is defined as the chance for injury is 5% or less. For comparison, the ACES II
is rated only up to approximately 1200 psf 11).
By designing the seat to reduce g-forces effects, the seat also inherently provides the
pilot protection against ejection forces. When the spine is parallel to acceleration forces,
injury due to spinal compression is most likely to occur. By rotating the spine away from
vertical, the chance for injury is reduced. The design study [4] also proposed including
propulsion and flight control systems for the PRESS.
Since the PRESS itself will become a flight vehicle upon ejection, it is important
that it flies in a stable manner, without tumbling out of control. Thus, the design team
performed a computer analysis of a simplified version of the PRESS to determine the
aerodynamic characteristics and the in-flight stability for a supersonic, high altitude con-
dition. This analysis, though not complete, showed that the overall design was a viable
one. The study recommended that wind tunnel testing be performed to provide further
design verification [4:7.1].
Research Objectives
This thesis is divided into two related but distinctly separate objectives. The pri-
mary objective concerns the results of wind tunnel testing to deternine the baseline char-
acteristics of the PRESS, and to determine various methods of improving aerodynamic
performance. The secondary objective of the research concerns construction of a computer
model and the investigation of the ability of that model to predict aerodynamic pressures
about the seat.
Primary Objective As mentioned earlier, the original design study [4] included a
computer analysis of the PRESS to determine the aerodynamic behavior of the seat in
supersonic, high altitude flight. This analysis predicted that in supersonic flight the PRESS
will stabilize in pitch with the lower cowling pointed 52 degrees above horizontal. The
desired pitch angle is 35 degrees, the forward lean angle of the pilot. This pitch angle
1-5
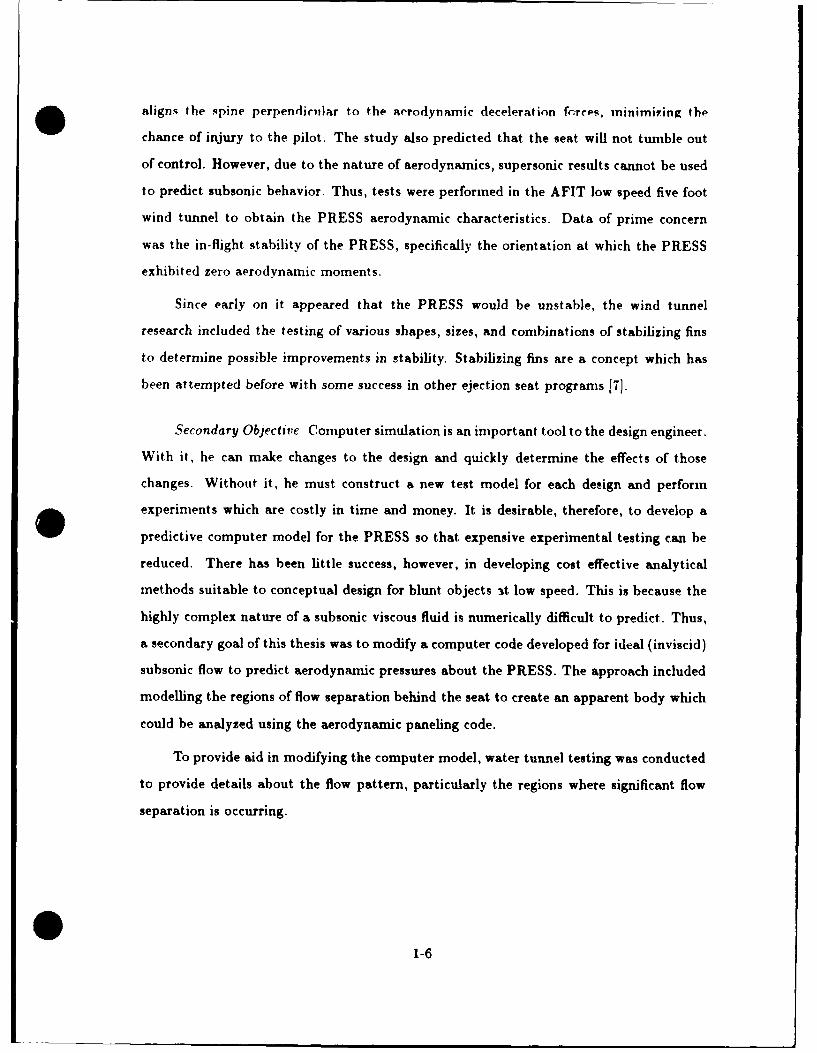
aligns the spine perpendicular to the aerodynamic deceleration fcr.cps, ininimi7.ing the
chance of injury to the pilot. The study also predicted that the seat will not tumble out
of control. However, due to the nature of aerodynamics, supersonic results cannot be used
to predict subsonic behavior. Thus, tests were performed in the AFIT low speed five foot
wind tunnel to obtain the PRESS aerodynamic characteristics. Data of prime concern
was the in-flight stability of the PRESS, specifically the orientation at which the PRESS
exhibited zero aerodynamic moments.
Since early on it appeared that the PRESS would be unstable, the wind tunnel
research included the testing of various shapes, sizes, and combinations of stabilizing fins
to determine possible improvements in stability. Stabilizing fins are a concept which has
been attempted before with some success in other ejection seat programs [7].
Secondary Objective Computer simulation is an important tool to the design engineer.
With it, he can make changes to the design and quickly determine the effects of those
changes. Without it, he must construct a new test model for each design and perform
experiments which are costly in time and money. It is desirable, therefore, to develop a
predictive computer model for the PRESS so that expensive experimental testing can be
reduced. There has been little success, however, in developing cost effective analytical
methods suitable to conceptual design for blunt objects -t low speed. This is because the
highly complex nature of a subsonic viscous fluid is numerically difficult to predict. Thus,
a secondary goal of this thesis was to modify a computer code developed for ideal (inviscid)
subsonic flow to predict aerodynamic pressures about the PRESS. The approach included
modelling the regions of flow separation behind the seat to create an apparent body which
could be analyzed using the aerodynamic paneling code.
To provide aid in modifying the computer model, water tunnel testing was conducted
to provide details about the flow pattern, particularly the regions where significant flow
separation is occurring.
1-6
I. Ezperimental Model Designs
Before any part of this thesis research could begin, experimental models had to be
constructed based on the design from Reference (4]. Two such models were required, one
for the wind tunnel and one for the water tunnel. The final model designs as described
below were fabricated by the AFIT model shop.
Wind Tunnel Model
The following criterion were considered when desigi.ing the wind tunnel model:
" Precision required versus time and cost of construction.
- Seat.
- Pilot.
o Scale requirements.
- Tunnel blockage.
- Strain gage force limits.
" Any onboard instrumentation i.e. pressure transducer.
" Method for mounting into tunnel.
" Material.
Precision of Construction The final design of the PRESS is presented in Reference [4].
Since the design was a conceptual one, there was no effort expended on an aerodynamic
refinement. Thus, the final design was presented with all flat surfaces. The decision was
made to duplicate this design exactly for wind tunnel testing for several reasons. One,
it was this non-aerodynamic shape that underwent a computer aerodynamic analysis. By
attempting a refinement of the external shape, the eventual comparison between the results
of this research and the earlier study would lose its utility. Another reason to duplicate the
final design exactly was the same reason the original study did not attempt to streamline
2-1

the PRESS. To effectivly improve the aerodynamics of the system, the engineer needs
wind tunnel and flow visualization data. Since this thesis is the first to obtain that data,
it seemed futile at best to attempt a refinement a priori. In any event, since this was
a proof-of-concept experiment, any refinement seemed unnecessary. Finally, since the
design is made up entirely of straight lines and flat surfaces, construction of a similar
model was relatively trivial when compared to duplicating a curved, streamlined version.
The only part of the model that seemed difficult to reproduce was the pilot figure. To
simplify construction and increase geometric similarity, it was decided to use a "Ken" doll
to represent the pilot (Ken is a registered trademark of the Mattel Toy Corporation). The
doll has approximately the correct anatomical proportions and is approximately one foot
tall. Thus, by assuming a six foot tall pilot, use of the doll forced the scaling of the PRESS
wind tunnel model to one-sixth scale. As will be shown in the next section, this choice
of scale was appropriate for testing. Thus, by using the flat-surface PRESS design and a
doll for the pilot, exact geometric similarity with the final PRESS design was achieved at
relatively low cost.
Scale Requirements To choose an appropriate scale for a wind tunnel model, one
must consider the maximum cross sectional area of the model and the magnitudes of the
expected forces. As discussed above, construction considerations dictated a one-sixth scale
model. It must be shown, however, tiat this scale is appropriate for experimental purposes.
Tunnel Blockage A model whose maximum cross sectional area is large relative
to the area of the tunnel will cause the airflow to accelerate as it passes around the model.
Keeping this ratio below 7.5% (9:371] ensures that this effect is minimal and can be reliably
correctpd. With the model mounted at a 52 degree pitch angle (see section below on trim
selection), the maximum cross sectional area occurs at 26 degrees of sideslip (nose left).
With a one-sixth scale PRESS, this value is approximately 44.6 in 2 . The tunnel cross
sectional area is 2827 in2 . This results in a tunnel blockage of less than two percent, well
within limits.
2-2
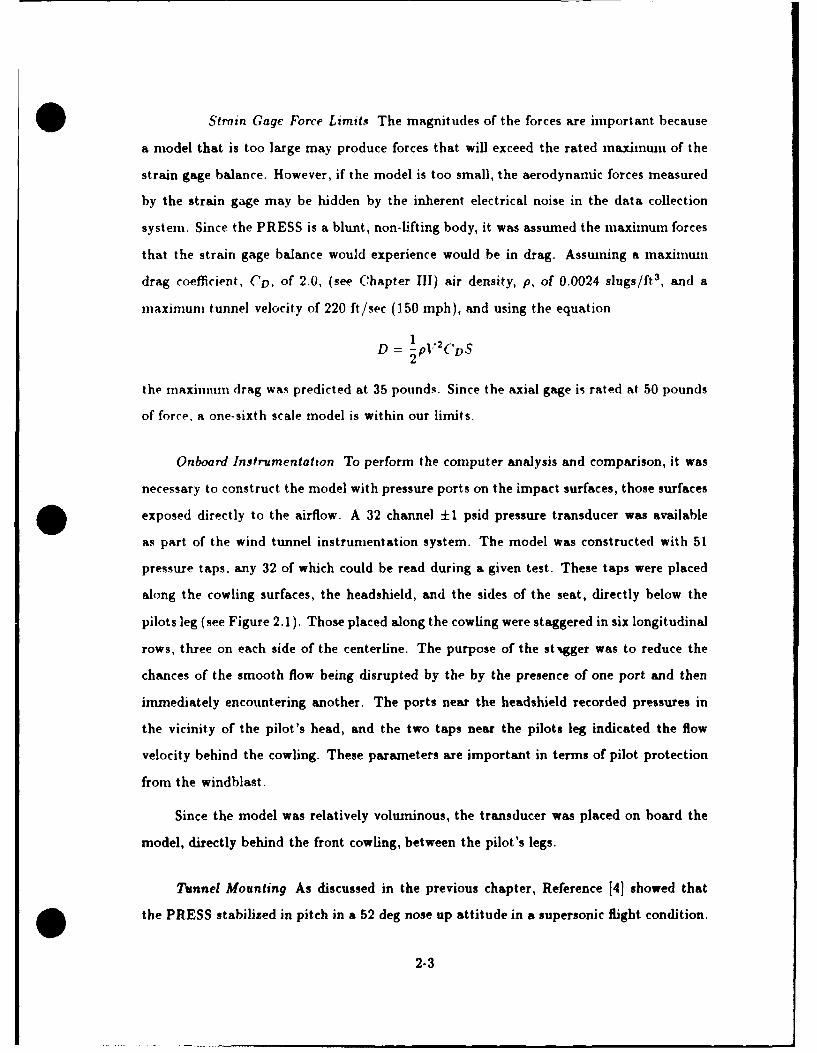
Strain Gage Force Limits The magnitudes of the forces are important because
a model that is too large may produce forces that will exceed the rated maximum of the
strain gage balance. However, if the model is too small, the aerodynamic forces measured
by the strain gage may be hidden by the inherent electrical noise in the data collection
system. Since the PRESS is a blunt, non-lifting body, it was assumed the maximum forces
that the strain gage balance would experience would be in drag. Assmning a maximum
drag coefficient, CD, of 2.0, (see Chapter III) air density, p, of 0.0024 slugs/ft3, and a
maximum tunnel velocity of 220 ft/sec (150 mph), and using the equation
D = 1 PV 2CDS
2
the maxinun drag was predicted at 35 pounds. Since the axial gage is rated at 50 pounds
of force, a one-sixth scale model is within our limits.
Onboard Instrumentation To perform the computer analysis and comparison, it was
necessary to construct the model with pressure ports on the impact surfaces, those surfaces
exposed directly to the airflow. A 32 channel ±1 psid pressure transducer was available
as part of the wind tunnel instrumentation system. The model was constructed with 51
pressure taps, any 32 of which could be read during a given test. These taps were placed
along the cowling surfaces, the headshield, and the sides of the seat, directly below the
pilots leg (see Figure 2.1). Those placed along the cowling were staggered in six longitudinal
rows, three on each side of the centerline. The purpose of the stigger was to reduce the
chances of the smooth flow being disrupted by the by the presence of one port and then
immediately encountering another. The ports near the headshield recorded pressures in
the vicinity of the pilot's head, and the two taps near the pilots leg indicated the flow
velocity behind the cowling. These parameters are important in terms of pilot protection
from the windblast.
Since the model was relatively voluminous, the transducer was placed on board the
model, directly behind the front cowling, between the pilot's legs.
Tunnel Mounting As discussed in the previous chapter, Reference [4] showed that
the PRESS stabilized in pitch in a 52 deg nose up attitude in a supersonic flight condition.
2-3

49-
4 9 .4 E 444 42
stti p3F - 50
Fiur 2.1 PRS4rsue otlyu
2204

It is typical, howpvwr, that the pitching tendency of a body in subsonic flow is different
than in supersonic flow. Sirce the PRESS is rather uniquely shaped, there is no method to
predict this change. The only option was to assume that there was no change. Therefore,
52 deg was chosen as the baseline pitch angle for testing, and the model was constructed
such that the strain gage balance receptacle in the rear of the PRESS model was installed
at a 52 deg offset.
Matcrials The model shop constructed the PRESS model of wood, due to its low
cost and the relative ease with which wood can be shaped.
Final Design
The resulting design is shown in Figure 2.2. The precise location of each pressure
port is identified in Table 2.1. The locations are based on a standard body axis coordinate
system, described in the next chapter.
Table 2.1. PRESS Pressure port layout
Port Number T y z Port Number z y z
1 -6.333 0.712 0.000 15 0.000 0.712 -2.2052 -5.757 0.962 0.000 16 0.000 0.962 -2.6543 -5.181 0.837 0.000 17 0.000 0.837 -3.1304 -4.605 0.712 0.000 18 0.000 0.712 -3.6145 -4.029 0.962 0.000 19 0.000 0.962 -4.0946 -3.453 0.837 0.000 20 0.000 0.837 -4.5837 -2.877 0.712 0.000 21 0.000 0.712 -5.0478 -2.301 0.962 0.000 22 -0.579 1.100 -5.5759 -1.725 0.837 0.000 23 -1.158 1.100 -5.73310 -1.149 0.712 0.000 47 -0.386 0.000 -5.52211 -0.250 0.837 -0.250 48 -0.851 0.000 -6.34912 0.000 0.712 -0.750 49 -0.851 0.000 -7.04913 0.000 0.962 -1.220 50 -3.942 1.333 -2.45514 0.000 0.837 -1.709 1 1
Ports 24-46 are mirror images about y of 1-23, and 51 is an image of 50 (SeeFigure 2.1)
Origin is located on PRESS centerline at intersection of lower and frontcowling (extended), using standard body axis system.
2-5

S I III II
I II
I II
3.63 JL 2.431 2.67".67I II
.6. 83
50 1.00.0.67 6--
5.91 Cowling5Thickness 1.00
1/6 in .68
2.33 500L
50
Figure 2.2. PRESS model design
2-6

Iater Tunnel Model
Although the water tunnel has only a 2 x 2 ft square test section, the water tunnel
model was built with the same dimensions as the wind tunnel model described above to
expedite construction. This was larger than typical models, causing some constriction of
the streamlines near the tunnel walls. However, since this study was more interested in
flow trends rather than actual data, the larger model was satisfactory. This also allowed
the water model to use the same "Ken" doll as the pilot, maintaining geometric similarity.
The model was constructed of plexiglass to better withstand the environment within the
water tunnel.
2-7

IH. Wind Tunnel Testing
Procedures and Data Reduction
Facility Description
The Air Force Institute of Technology Department of Aeronautics and Astronautics
currently maintains a low speed wind tunnel facility, located in Bldg 19, Area B, on Wright-
Patterson AFB. The primary function of the wind turmel is to support student thesis
projects, although the facility is often used by the Air Force Flight Dynamics Laboratory
when available. It is an open circuit, continuous flow type tunnel with a closed test section.
The test section is five feet in diameter with a length of eighteen feet and a contraction
ratio of 3.7 to 1. The wooden tunnel, including intake and diffuser, is located in a large
building which provides a double return for the air. Tunnel air flow is induced by two 12
foot counterrotating fans driven by two sets of two 400 horsepower direct current motors.
Total pressure is atmospheric, with static pressure measured by eight sets of static ports
located 30 inches from the tunnel entrance and 11 feet from the test section. The tunnel is
capable of a Mach number of approximately 0.26 and a Reynolds number of approximately
1.9 X 10⁶ per foot, each parameter to be defined later in the chapter. The tunnel is
currently equipped with a sting-type model support, with ranges of angle of attack from
-6 to +26 degrees, and sideslip angles up to ±6 degrees.
Instrumentation For data collection, the tunnel is equipped with:
" Digital data acquisition system, including a Z-248 computer for data reduction and
presentation.
" A six component strain gage balance system.
* A three component wire balance system (not used but available if needed)
" Conventional and electrical pressure sensors.
" Conventional temperature sensors.
* A two channel hot-wire anemometer system.
" A house air supply system for studies requiring blowing.
3-I

The six components of the strain gage and their maximum range- are:
" Two normal force (2 lift) gages of 100 lbs each.
" Two side force gages of 50 lbs each.
" One axial force (-z drag) gage of 50 lbs.
" One rolling moment gage of 40 in.lbs.
The electrical pressure system was also utilized. This system uses a 32 channel
pressure transducer with a measurement range of ± 1 pound per square inch (differential).
In addition to the hardware, the computer software is currently under a complete
revision. The purpose of this is threefold. First, an influx of new data collection equipment
rendered the old program obsolete. Second, the department has in the past been highly
dependant upon the Flight Dynamics Laboratory for technical expertise. By developing
new software, the facility can be self-supporting. Third, the new program is carefully
structured to cater to the tunnel's unique usage as both an educational as well as a research
facility. The new code will allow the researcher to quickly perform testing and obtain
data without having to develop excessive programming routines. The code is flexible
enough however to allow the student to add modules and/or modify existing routines to
perform specialized tasks. A functional description of this program, and improvements
and corrections to the code by the author, can be found in the appendices.
Flow Angles and Coordinate System
It is important at this time to introduce the coordinate system we will use as refer-
ence for the aerodynamic forces and moments, and define the angles which determine the
PRESS's orientation in the windstream.
Using standard notation, XBYBZB will refer to a coordinate system which is attached
to the vehicle, where X is outward normal to the front cowling, Z is outward normal to the
bottom cowling, and Y forms a dextral set by pointing to the pilots right. This is shown
in Figtre 3.1. Note that X and Z form the plane of symmetry. In addition, two more axis
systems are typically used in stability and performance analysis [9:425]. By rotating the
3-2

OL
0 ,(
Figure 3.1. Body Axis and Flow Angles
body axis about the Y axis until the velocity vector V is in the XY plane, the stability axis
system is created, identified by XsYsZs. This is the standard axis system used to quantify
aerodynamic forces and moments. The angle rotated is defined as the angle of attack, a,
and is shown in Figure 3.1. The third commonly used axis system is the wind axis system.
In this system, the axes are aligned with X pointing directing into the windstream and the
other axes oriented to maintain the dextral set. This system, XwYwZw, is obtained by
rotating the XsYsZs system about the Z axis an angle 3. This angle is called the sideslip
angle and is defined as positive when the airstrean is wetting the right side of the vehicle.
can also be defined as the angle between the velocity vector and the plane of symmetry
3-3

of the PRESS. This angle is shown in Figure 3.1. This thesis will present the final data in
both the body system and in the stability system. The body system is important because
that is the frame of reference of the passenger. The stability axis system, however, allows
an easier interpretation of the seat's motion in the windstream.
The forces measured in the body frane of reference are the axial, FX, side, Fy, and
normal, Fz, along the positive XB, YE, and ZB axes, respectively (see Figure 3.2). The
aerodynamic moments are defined as the pitching moment, MAf, rolling moment, M1, and
the yawing moment, MN. They are defined as positive in accordance with the right hand
rule about the XB, YB, and Z8 axes, respectively (see Figure 3.2). Note that roll moment
is identified as a lower case "L" instead of upper case. This is to avoid confusion with the
lift force which will be defined next.
In addition to the forces identified earlier, two more must be included. In the sta-
bility axes, lift and drag are used in place of Fz and Fx, respectively, which are equal in
magnitude but opposite in direction to Fz and FX transformed into the stability reference
frame. They are identified with the symbols L and D. Thus, Fx, Fy, and Fz denote
irces in the body frame, and L and D identify stability axis forces, with side force not
affected by the coordinate transformation.
Trim Attitude In any flight vehicle, there exists a flight attitude where all aerody-
namic moments are zero. This point is called the trim point, and is defined by a unique
combination of a and 3. If a change in one of those values produces a moment which
returns the vehicle to its trim position, the vehicle is statically stable. By plotting the
moment as a function of the displaced angle, the slope of the curve at the trim point is a
quantitative measure of the static stability of the vehicle about that axis. This technique
will be used in the next chapter to analyze the stability characteristics of the PRESS.
Model Test Configurations
The primary objective of this thesis is to determine the aerodynamic coefficients for
the PRESS in a low speed flight regime. In particular, the pitch angle for which there
exists no pitching moments was to be established. Since early results indicated that this
3-4

10
L
1Y
Figure 3.2. Body Axis Force and Moment Definitions
occurred at a pitch angle much higher than desired, a = 35 deg, external fins were then
tested to improve the pitch angle. Additionally, the degree of lateral stability was also
determined, as well as the measured effect of stabilizing fins on the rolling and yawing
moments of the PRESS. Finally, a simple pressure survey of the cowling was performed
to provide comparative data for the computer analysis of Chapter VI. To obtain all of the
necessary data, the PRESS model would have to be tested in a number of configurations.
The configuration categories are discussed below.
3-5

Model Oricntation The sting in the wind tunnel is capable of providing anglos of
attack from -6 degrees to +26 degrees. With the model constructed to provide an initial
a of 52 degrees, this provided a test range of 46 < a < 78 degrees when the model was
mounted upright. To be able to collect data at the ideal pitch angle of 35 degrees, the
model and sting were rolled upside down, providing a test angle range of 26 < a < 58.
This resulted in a total test range of 26 < a < 78. In addition, the model was tested
inverted in the baseline configuration (no fins - see below) with the sting bent upwards an
angle of 30 degrees. This provided a test range of -4 < a < 28. Thus the baseline model
was tested at angles of attack from -4 degrees all the way up to 78 degrees.
The sting could also provide sideslip angles of ±6 degrees. However, the previous
study [4] predicted that significant lateral effects didn't appear until 03 reached 12 de-
grees. To reach the higher sideslip angles, the model was mounted on the sting and rolled
90 degrees. Then, performing a normal o sweep actually provided a sideslip test range of
-6 < 3 < 26 degrees.
Stability Fins To improve the stability characteristics of the PRESS, three types of
aerodynamic fins were tested. Two were tails of similar design but differing size designed
to decrease the pitching moment of the seat, and the other was a pair of lateral fins to
improve the directional stability. To be practical devices, the fins were designed to be large
enough to provide adequate forces yet small enough to fit flush on the back of the seat, the
theory being that on a full scale PRESS they would unfold into the airstream as dictated
by stability requirements. The details and the effects of each fin type are described below.
1. The first fin tested consisted of a simple flat plate extending from the bottom of the
seat as shown in Figure 3.3. To fit the design criteria, this fin was sized to the same
size as the back of the seat (3.633 x 4.667 inches) such that it could fold up against
it. Aerodynamically, this fin was designed to provide a nose down pitching moment
at positive angles of attack and lower the trim angle of attack. For this report, this
fin will be referred to as the "large tail".
2. When early testing indicated that the large tail was too large, a smaller one was
tested. This "small tail" was three inches in length. This tail reacts similarly to the
3-6

Figure 3.3. Large Tail
larger one but with less magnitude.
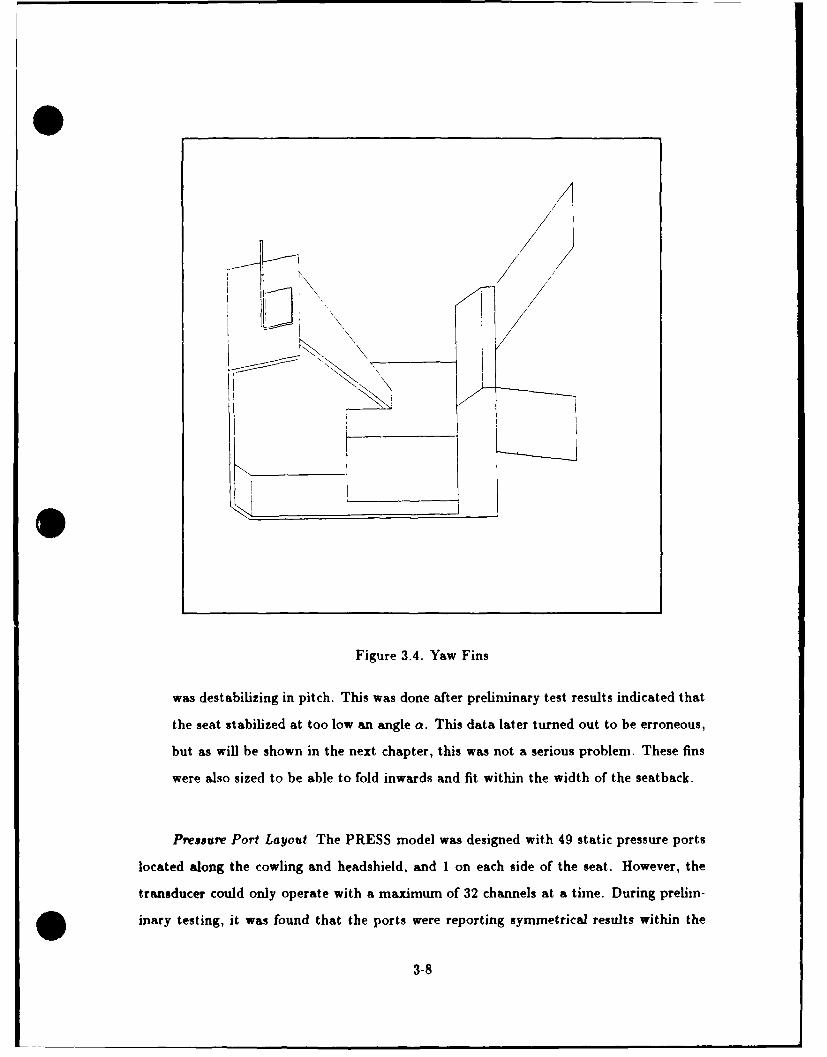
3. To improve the directional stability of the PRESS, yaw fins as illustrated in Figure 3.4
were constructed. These served a dual purpose. First, they projected onto the plane
of symmetry a large side area behind the center of gravity. This would provide a
weathercock-type stability in the same manner as the vertical tail on an aircraft.. At
positive angles of attack, the geometry of the fins also create a downforce aft of the
CG, resulting in a nose up moment. As a increased, so would the moment, until a
point when the plane of the fins coincided with the velocity vector. Thus this design
3-7
OL
Figure 3.4. Yaw Fins
was destabilizing in pitch. This was done after prelininary test results indicated that
the seat stabilized at too low an angle a. This data later turned out to be erroneous,
but as will be shown in the next chapter, this was not a serious problem. These fins
were also sized to be able to fold inwards and fit within the width of the seatback.
Pressure Port Layout The PRESS model was designed with 49 static pressure ports
located along the cowling and headshield, and 1 on each side of the seat. However, the
transducer could only operate with a maximum of 32 channels at a time. During prelim-
inary testing, it was found that the ports were reporting symmetrical results within the
3-8

range of the statistical variation. Thus for testing, only the ports on the starboard side
were used along with the centerline ports. The remaining channels were placed evenly
among the port side pressure ports to provide checks on the starboard channels.
Test Procedure
For data collection, five fin configurations were tested. The baseline configuration
was with no fins installed. The PRESS was then tested with the large tail, short tail, yaw
fins, and finally a combination of the short tail and the yaw fins. The data collection was
performed in two parts.
First, tare data was collected as described in Appendix B. This data provides the
weight and CG location of the model. For accuracy, two tare runs were conducted for each
configuration, and the results were averaged.
The test data was then collected as outlined in Appendix A. Initially, the tests were
performed at a dynamic pressure, q, of 20 psf (; 88 mph). However, severe model buffet
at this wind speed created forces of equal magnitude of the aerodynamic forces, thus the
data was extremely scattered. By increasing q to approximately 60 psf ( 150 mph),
the aerodynamic forces dominated the vibration noise, providing smoother data. The
importance of velocity scaling will be discussed later in the chapter. Data points were
collected every two degrees of sting angle from -6 to +26. As the sting was returned to
zero, check points were conducted at 18, 12, and 0 degrees. These check points served to test
repeatability and hysteresis effects. At each point, pressure data was also collected. The
pressure transducer reported the difference in the local static pressure from atmospheric
pressure in psi.
Data Reduction
The data reduction methodology is described in detail in Appendix A. This section
will discuss the rational of the data reduction, i.e. nondimensionalization, velocity scaling,
etc .... Also, model center of gravity considerations and the reduction of the pressure
data will be discussed.
3-9

Vcloctty Scaling To perform testing that is a true simulation of a fudl scale model, not
only geometric similarity must be achieved, but also flow similarity. Geometric similarity
was discussed in Chapter II. Flow similarity is more subtle. The flow of a fluid over a
surface has certain characteristics that depend on the v'scosity and density of the fluid,
and the velocity of the fluid relative to the surface. An example of this is the boundary
layer phenomenon. As a plate moves through a fluid, a thin layer of the fluid near the
surface is dragged along with it. Some distance L downstream of the plate's leading edge,
however, the boundary layer will suddenly become turbulent, increasing the drag on the
plate. If, however, a scaled plate is tested with length less than L, and all other condition
are the same, this change in flow behavior will not be seen; the drag characteristics will
be different than the full scale model. Thus, flow similarity has not been achieved. The
characteristics of a flow can be described by a parameter called the Reynolds number, RE,
defined by the equationS- Lp (3.1)
where
* U" = Flow velocity
L = Some characteristic length such as wing chord
p = Density of fluid
it = Absolute viscosity of fluid
By keeping RE constant in the scaled test, one can assure flow similarity. This is because
the scaled and actual governing equations are identical in nondimensional form. All flow
phenomenon will therefore be appropriately scaled. To hold the Reynolds number constant
when L has been reduced, however, requires an increase in velocity or density, hence the
term velocity scaling. However, increasing V increases the Mach number, M, the ratio of
the velocity to the local speed of sound. Improper scaling of M can distort the results
more than a difference in RE due to flow compressibility effects, so increasing V isn't the
answer. Therefore, wind tunnel testing usually requires testing at lower Reynolds numbers
of varying values, determining a functional relationship of the result in question to RE,
and extrapolating the data to the full scale RE.
3-10

A flow phenomenon which can be fairly independent of RE is flow separation, sinre4
this is often a function of geometry. As a flow follows a surface, viscous forces keep the
fluid attached to the surface. If however, that surface turns away from the flow with a
very small radius or a sharp edge, the fluid's momentum will overcome the viscous forces
and the flow will detach from the surface.
In the case of the PRESS, it was reasoned that the many sharp edges of the seat
would cause extensive flow separation, the effects of which would dominate all other viscous
effects. Thus, the testing could be performed at the wind velocity that produced the best
data. This meant it was not necessary to conduct a full RE sensitivity study. Since model
vibration at the lower velocity forced repeating the test program at a higher velocity (see
page 3-9), a method of checking for RE sensitivity was available. The lower and higher test
velocities corresponded to Reynolds numbers of 360, 000 and 600, 000, respectively. Even
though the data from the low velocity test was scattered from the vibrations, there was no
apparent change in the data resulting from the differing RE.
Wind Tunnel Corrections Reference [9] provides an excellent account of wind tunnel
correction factors. These factors account for the presence of the walls, to make the data
match freestream conditions. However, these corrections apply primarily to streamlined
bodies with little or no flow separation, and the PRESS is not such a body. As a re-
sult, these boundary corrections are of questionable quality. In addition, the goal of this
research was to establish trends, not hard data. Therefore, all corrections that affected
data uniformly were avoided, and the only corrections that were applied were those that
affected the drag force only. There were two such corrections: buoyancy and induced drag.
Due to a gradual thickening of the boundary layer on the inside of the tunnel, the effective
cross section continuously decreased as the flow passed the test section. Mass conservation
requires a proportional increase in velocity. This in turn creates a negative pressure gradi-
ent which causes the model to "float" downstream. This is the buoyancy effect. Induced
drag is that drag resulting directly from the formation of lift. The induced drag correction
results when the tunnel walls attenuates the downwash present behind any lifting body,
which reduces the measured induced drag.
3-11

The above corrections were applied during the reduction process. There were two
more corrections made to the data after the reduction was complete.
The first was due to flow angularity in the tunnel, meaning that the air's velocity
vector is not exactly parallel with the tunnel centerline. Thus, when the model was inverted
in the tunnel, the angle of attack of the model was different. Since there was angle of
attack overlap in the upright/inverted test runs, the data was separated by twice the flow
angularity. The appropriate correction was a simple shift in the data. Testing showed
a flow angularity of 0.75 degrees downward. Although this seemed a bit high, it was
consistent for all data.
The final correction accounted for that data collected when the model was not at the
center of the tunnel. When the model is tested throughout the normal range of angles of
attack, the sting is mechanized to keep the model in the center of the tunnel. However,
for those tests when higher angle of attacks are needed, the sting can be bent upwards.
The design of the sting, however, then places the model above the resolvent center, nearer
the top of the tunnel. This has significant effects on the streamline formation about the
model, resulting in changes to the forces and moments. Although analytical corrections
were considered, the most accurate correction to this effect was a vertical shift in the data,
the amount and direction of which depended upon the force or moment in question.
Dimensionless Coefficients Since conditions will not be identical from one test to the
next, a common data reduction procedure is to convert all data into dimensionless form.
The forces and moments will be reduced to dimensionless coefficients using the equations
C Cy F CZ , L= Lift
qs q5$S 9 (3.2)Drag CMm=M C = - CN MCD qS qSL qSL
where
S = Reference area
L = Reference length
To be consistent with the original study [4] and standard ejection seat analysis tech-
niques, the reference values will be defined as follows. The reference area, S, is defined
3-12

as the projected frontal area at zero degrees angle of attack and sideslip. The hydrai lic
diameter is defined here as the diaaneter of a circle whose area is equal to S, and is used
as the reference length, L. These values are S = 0.164 ft' and L = 0.457 ft.
The pressure data will be transformed into a dimensionless coefficient of pressure
using the equation
(P - 1 (3.3)q
where
Ap = Pressure difference from atmospheric, psf
In incompressible flow (M < .3), Eq 3.3 becomes
0- -i-- (3.4)
where
V: = Local velocity
I" = Freestream velocity
Using this definition, freestream flow has a Cp of zero and the Cp at a stagnation
point (flow brought completely to rest) is one.
C'enter of Gravity Considerations The original study [41 conducted their analysis with
three different center of gravity (CG) locations. These locations corresponded with the 5th,
50th, and 95th percentile pilots. Since each pilot was a different size, each placed the CG
of the overall system at slightly varying locations. The 50th percentile pilot data was a
rough average of the overall results, therefore the CG location was chosen to correspond to
this case. The moments measured by the strain gage balance during testing, however, were
referenced to the Balance Moment Center (BMC). Therefore, all moments were transferred
to the 50th percentile CG for analysis.
3-13

IV. Wind Tunnel Test Results
The primary objective of this research was to obtain the low speed aLrodynanic
characteristics of the PRESS through wind tunnel testing. The previous chapter described
the test facilities and the methodology of the wind tunnel testing. This chapter will present
the results of that testing. These results can be divided into four categories: force and
moment data, pressure data, stability augmentation effectiveness, and center of gravity
considerations. Each of these will be presented and discussed individually. All results will
be presented in accordance with the nondimensional coefficients defined on page 3-12.
Force and Moment Data
The force data will be presented in two coordinate systems. First, the data will be
presented in body c,, linates (see page 3-2). Data presented in this form is important to
bio-engineers because the force directions are always constant relative to the pilot. In this
way, the forces exerted on the pilot are immediately apparent. In addition, the data will
be presented in a stability axis frame of reference as described on page 3-3. This frame
of reference is important because it is the standard coordinate system used for stability
and vehicle performance analysis. Aerodynamic drag, for example, is a stability axis force
and will determine the deceleration of the PRESS in the freestreamn. The results will be
further divided into longitudinal and lateral components. The longitudinal data refers to
forces and moments which occur within the plane of symmnetry, such as lift, drag, and
pitching moments. The lateral forces and moments are those which will move the plane of
symmetry, i.e. side forces and rolling moments.
Longitudinal Forces and Moments The longitudinal aerodynamic data can be found
in Figures 4.1 through 4.5.
Normal and Axial Forces From a flight mechanics point of view, the normal
and axial force plots (Figures 4.1 and 4.2) are not very informative in themselves, but
they clearly identify the forces that the pilot will experience in ejected flight. Reference [7]
related an attempt to place a stabilizing fin on an ACES II style open ejection seat system.
4-1

-C.C
C-
00
0C
000
00--.00 0ov%
0' oo ,0
-1.2
- .4 . ....... . . .. . ...
Angle cT Attjc:k - :,,egree,.Figure 4.1. PRESS Axial Force as a Function of Angle of Attack
00
00cO
-0.4
Q,)0
" .6 o°0U 0
-o
) 00o -O.E o0
0) 0
-1. 0.
o-1.2 o %
ooE0o0 00
o -1.4z
-23 0 20 4D 63 a 13Angle of Attack - a (oegrees)
Figure 4.2. PRESS Normal Force as a Function of Angle of Attack
4-2

4-o
0 c., 0
0
Co C
0 0 o 0 0
_ .JC ~
-4:
Angie cf Att3:k - ax e
Figure 4.3. PRESS Lift as a Function of Angle of Attack
*1.4
C0 C ,
00
1.2 0 _ 0
0
00
00
1.0
0
0C 0
-4-, ,
0 0 2CA o
¢4-
0.8
-20 0 20 40 100:Angle of Atto:k - oc (cdegrees)
e Figure 4.4. PRESS Drag as a Function of Angle of Attack
4.3

C.2C
CO 15C.)
00 .1 0
0 r 0 00 0
0O.10 0r 0 000 0 0
CC
0 00C
Angle of Atto:k - a jegreez;
Figure 4.5. PRESS Pitching Moment as a Function of Angle of Attack
The fins stabilized the seat as intended, but they also produced enough additional normal
forces that, combined with the catapult rocket, the resulting normal acceleration exceeded
safety limits.
Assuming the vehicle will trim at the desired 35 degree angle of attack, and will not
exceed that value, the maximum normal force the pilot will feel occurs at the trim point
and is Cz = -0.82 (see Figure 4.2). Using Equation 3.2, we can determine the maximum
normal force to be
Fz = qSCz (4.1)
= (57)(.164 6')(-0.82)
2t -276 lbs
Knowing the mass, m, of the PRESS to be 15.481 slugs [4:E.42], we can find the maximum
4-4

normal acceleration, a,, using the equation
a= Fz/m (4.2)
= -276 lbs/15.481 slugs
= -17.8 ft/sec2
= -0.55 g
Thus, the pilot will feel .55 g's upwards in addition to any accelerations caused by the
catapult rocket. In a similar manner, the maximum axial force occurs at approximately
24 degrees a and is Cx = -1.03. Using Equations 4.1, we find that the maximum axial
force is approximately 347 lbs rearward, and the resulting axial deceleration is 0.70 g's.
Lift and Drag Lift is a rather unimportant parameter in ejection seat analysis,
since one is primarily interested in stability rather then performance. The one value of
interest is the acceleration imparted to the seat away from the parent aircraft by the lift
force. From Figure 4.3 we see that the CL at the moment of ejection when the angle of
attack is zero degrees is approximately 0.13. Using the same procedure as before, we can
approximate the lift force on the full scale model at 43.7 lbs and an acceleration away from
the parent aircraft of 0.09 g's. Since the catapult rocket will provide acceleration on the
order of 7 g's [4:10.31], the lift force is insignificant, but in the right direction.
The drag experienceed by the PRESS in ejected flight is very important because it
determines the deceleration rate. Again, using the methodology above, we obtain the drag
coefficient from Figure 4.4 at the trim condition, CD = 1.27, and from Eq (4.1) we see that
the braking force at the test velocity is 427 lbs. This results in a deceleration of 0.86 g's.
Pitching Moment Of all the parameters measured in the test program, the most
important was the pitching moment. As discussed in the Introduction, maximum aircrew
protection from deceleration forces occurs when the PRESS has a trim angle of 35 degrees.
Thus it was important to determine the actual angle at which zero moments occur, and if
it was away from the ideal, determine methods of correcting it.
4-5

Initial testing of the PRESS in the baseline configuration did not find a trim point
within the range of tested angles of attack, -4 < a < 78 (see Figure 4.5). The PRESS
exhibited a positive pitching moment at all angles tested.
Lateral Forces and Moments The lateral aerodynamic data can be found in Fig-
ures 4.6 through 4.8. Since side force is not affected by a coordinate transformation
about the pitch axis, it is the same in either body or stability axis systems. In addition,
the roll and yawing moments are of little interest in body coordinates, unless they are
large enough to create physical problems for the pilot, so they too will be presented in the
stability axis system only.
In theory, all lateral data for the PRESS should be odd functions in /3, since the
PRESS XZ plane is one of symmetry. However, the model was actually asymmetrical due
to the presence of the pressure tube, and the fact that the pilots right leg was partially
removed to accomodate the tubing, therefore the data is somewhat skewed. However, the
effects are small, and the overall trends are still clearly evident.
Side Force Side forces experienced by the PRESS are relatively unimportant,
but are included for completeness.
Rolling Moment As predicted in Reference [4], the PRESS exhibits a negative
rolling moment when subjected to a positive sideslip (see Figure 4.7). For aircraft this
is commonly called positive lateral stability [10:261]. To understand why this is positive
stability, imagine the following sequence of events. As the PRESS is flying through the
air, some random force rolls it to the right. This tilts the lift vector to the right, resulting
in a positive sideslip. This positive sideslip then causes a negative rolling moment, which
restores the seat to upright flight. However, as discussed above, the lift forces are relatively
weak, resulting small sideslip angles. Fortunately, the magnitudes of the rolling moment
coefficients are much larger than the study predicted for the supersonic case, which will
overcome the small /3's and help to stabilize the seat.
4-6

0.1
O-c]
C2C
C 4
-,- - J
-- -10 -5 C 5 10 15 20 25 30
Angle of Sidesip - # (degrees)
Figure 4.6. PRESS Side Force as a Function of Sideslip
0 02 -
CO
0
- -C .4
5,. -C -5,5 0 15' 20 2 ,
-q.) -C 10E0
0 -C.14
-0.16 j ..... ,i ,,i . . . . .-15 -10 -5 0 5 10 15 20 25 30
Angie of Sideslip - # (degrees)
~Figure 4.7. PRESS Roiling Moment as a Function of Sideslip
4-7

0 1
z
c
Q) C:C
C
?€'A
) :1
.± -]
-15 5 - 0 5 10 15 2 5 32Ar, -e of Sideslip - A (degrees)
Figure 4.8. PRESS Yawing Moment as a Function of Sideslip
Yawing Moment The yawing moment of the PRESS can be seen in Figure 4.8.
This plot shows that for positive sideslip (nose left), there is a positive yawing moment (nose
right). Thus the PRESS is directionally stable. However, should 3 exceed approximately
30 degrees, Figure 4.8 would indicate that the PRESS becomes directionally unstable.
This would make sense from a geometrical perspective, since high sideslip angles would
expose the center support panel between the pilot's legs to the freestream. This results in
a large side area near the front of the PRESS, dramatically shifting the center of pressure,
the point where the aerodynamic forces appear to act, forward of the PRESS's center of
gravity.
Pressure Data
The purpose of recording surface pressures on the wind tunnel model was to provide a
method of comparing experimental data to the analytical study performed in Chapter VI.
However, since the wind tunnel balance measures net forces and moments, the pressure
data provides information that the balance cannot, namely, forces and flow velocities at
specific points on the model. The pressure ports on the model can be separated into three
4-8

regions: the impact surfaces, the upper cowling near the headshield and the pilots head,
and behind the cowling near the pilot's torso and legs. Representative ports from each
region are plotted as functions af angle of attack in Figures 4.9 through 4.11.
Beginning from the bottom rear of the cowling and proceeding forward and up the
front cowling, Figure 4.9 shows that each port on the cowling measures its maximum
pressure at a lower angle of attack than the preceeding one. This should come as no
surprise since maximum pressures occurs when a surface is normal to the freestream flow.
One should note than none of the ports reach unity. At zero sideslip, the stagnation
streamline should lie in the plane of symmetry. Since the ports are not in that plane, one
would not expect stagnation to occur.
A high angles of atack, the upper cowling is positioned such that the trailing edge is
below the leading edge. Therefore, one would expect the flow to separate off the top edge
of the front cowling. This will be shown to be true in Chapter V. This flow separation near
the headshield is clearly evident in Figure 4.10. All five ports indicate similar values and
trends at the higher angles of attack, regardless of position or orientation. Note in this
region that the pressure coefficient is negative, meaning that the local flow is higher than
the wind velocity. This would indicate that there is significant swirling -curing in this
region. As the angle of attack is decreased, however, first the higher port (49) and then
the lower port (48) on the headshield are no longer shielded from freestream flow by the
front cowling. Since they are no longer enveloped within the separated flow region, they
begin to display characteristics similar to the cowling ports in Figure 4.9.
Finally, we see from Figure 4.11 that the pressure measured at port 50 ranges from
-0.40 to -0.75 throughout the tested angles of attack. Again, the negative values indicate
that the velocity at the port location is higher than the freestream. From Eq (3.4) we can
determine that the flow velocity is 20% faster at the trimmed pitch angle. This type of
information is important to ejection seat engineers wishing to protect the passenger from
flailing injuries.
4-9

X /
/ z
Fort 11z7Port-10
Angl ofq Atc . (dgre
.P \ 64
-; Port 23 C6, 2I2
Angle of Attack - cx (degrees)Figure 4.9. Cowling Pressures as a Function of Angle of Attack
4-1
:- !Part 49
• Port 23
-- Port 22 Prt4
Angie of Attack - a (degrees)
Figure 4.10. Upper Cowling Pressures as a Function of Angle of Attack
4-10

OQ
4 -1
A o--I
I-"L. . 42 52 62? T~ Z- - -
Angie 3f Att3:k - o (degree ;
Figure 4.11. Seat Pan Pressure as a Function of Angle of Attack
Stability Augmentation Effectiveness
The lack of a pitch trim point was a problem that was detected early in the test
program. Therefore, testing was performed with the large and small tails to determine
their effectivness in changing the pitch trim angle. In addition, the yaw fins were tested
to improve the directional stability, and tr, determine their effect on the lateral stability of
the PRESS. The tails and yaw fins are described starting on page 3-6. The effects of each
device are compared to the baseline data in Figures 4.12 through 4.19.
Force Effects The purpose of these external devices was to modify the moment char-
acteristics of the PRESS. Since moments are created by applying forces away from the
CG, the force coefficients are effected as well. These forces act normal to the surfaces
of the fins. Since the yaw fins increased the frontal area but not the top projected area,
one would expect the axial force to be increased significantly, but very little change in
the normal force should be noted. Conversely, the area of the tails contribute only to the
top projection, thus only normal force should be effected. Both of theses can be seen in
Figures 4.12 and 4.13. It should be apparent that lift and drag are effected from both
4-11

0.2
I - Baseline- ----- Large Tail
- - Smail Tai eC. Yaw Fns T-
C,02 - Yaw Fins Sm ii Toil
-CA 4
X~</
I I
/
~-1.4
" -2.0 Bsln
E----- L , i L a rg T oi , j l l i l l l l l l l l l l I j lJ I ~
-20 0 2C 40 60 80 11C3
Angle of Attack - aX (degrees)Figure 4.12. Effect of Stability Augmentation Devices on Axial Force
C4 ,C_) -1.C , x,
©N
-2.0. Baseline ".
E Large Ta;d"'-- 2.4. - - Small Tail"'
Z_24 Yaw Fins + Small Tail
-20 0 20 40 60 80 100Angle of Attack - o (degrees)
Figure 4.13. Effect of Stability Augmentation Devices on Normal Force
4-12

0-
037
CD 4
-C.Z Bcseirne-- -- Large ]oi
Yaw FnsYaw Fins i-Smal T
Angi ofAttack - a (aegrees)Figure 4.14. Effect of Stability Augmentation Devices on Lift
*2.4 -
2.0 ...
57-
~1.4
C1.2
.1.0 -Baseiine----------------------------------Large Tal
-Small Tail0.8 -Yaw Fins
-Yaw Fns + Small Tail
-20 0 20 40 60 80 100
Angle of Attack - a (degrees)
Figure 4.15. Effect of Stability Augmentation Devices on Drag
4-13

0.3
Q)O.1T-. 4 ,
_____ Baseine---- Large Tai
' c Smai Tai- Yaw Frs
._w Yw Fins a- Sr, li Tod
-2C 20 40 63 80 00
Angie of Attack - c (cegrees)
Figure 4.16. Effect of Stability Augmentation Devices on Pitching Moment
C.2 .
-34
U
Q)-0.8
U\
L_ -1.0C)
- 1.2 Baseline N"- - Small Tail
f-l.4 Yaw FinsSmall Tail + Yaw Fins
-15 -10 -5 0 5 10 15 20 25 30
Angle of Sideslip - (degrees)
Figure 4.17. Effect of Stability Augmentation Devices on Side Force
4-14

C.3
0.2 "
0 60
I 0.1 ,.
/
-3 Ese r,
//
/7
ol. //
O -: / __ E Seire,--- - Sm oii Tal
-- Yaw Fins
- 4- Smail Toil + Yaw Fins
-15 -1 -5 0 5 10 15 20 25 32
Angle of Sideslip - # (degrees)Figure 4.18. Effect of Stability Augmentation Devices on Rolling Moment
C C.3
/
0.2 ,
,) -0.1 /
E /
C) /0
-0.0
-0.2 / ___ asejine
SSmall ToI- -- Yaw Fins
-0.3 Small Tail + Yaw Fins
-04-
-15 -10 -5 0 5 10 15 20 25 30
Angle of Sideslip - ? (degrees)
Figure 4.19. Effect of Stability Augmentation Devices on Yawing Moment
O4-15
types of fins from the coordinate transformation involved. An example of this is the effect
of the tails on the drag force. At zero a, the tail should have no effect on drag since
the area projects in the lift direction. However, as the angle of attack increases, the tails
present some frontal area, increasing the drag above that for the baseline condition (see
Figure 4.15). Finally, one can see the effect of the small tail and the yaw fins on the side
force component in Figure 4.17.
Moment Effects As discussed earlier, the pitching moment of the PRESS's baseline
configuration was always positive throughout the entire test range. This is a problem
which must be fixed if the PRESS is to be a practical design. As a first attempt to
correct this deficiency, the large tail was tested. As shown in Figure 4.16, this tail was
too effective, causing severe negative moments and too low a pitch trim angle of attack.
The model was then retested with the short tail. The figure shows a positive increase in
the pitching moment as compared to the large tail's effect, but it was still too negative.
The trend, however, would seem to indicate that the PRESS cannot be trinmed with tail
alone. The tails do indeed change the magnitude and the slope of the pitching moment,
but both curves appear to intersect the zero moment axis at nearly the same angle of
attack, (: 18 degrees). By installing an even shorter tail, one might achieve the correct
trim angle, but the curve will be so flat that neutral stability will result (see page 4-17).
The yaw fins were designed to provide an increase in the directional stability of the
PRESS, but they also were intended to create a positive pitching moment. This design
resulted from analyzing the data before the data reduction program was properly debugged.
The data indicated that a positive moment was needed, which later proved erroneous. As
it turned out, however, combining the yaw fins with the short tail provided almost the
exact moment needed to trim the PRESS at 35 degrees (see Figure 4.16).
For the lateral moments, the yaw fins multiplied the yaw restoring moment by a
factor of over three, and combined with the short tail, a factor of four (see Figure 4.19).
However, in Figure 4.18 one can see that the fins caused the rolling moments to reverse
their sign, causing lateral instability.
04-16
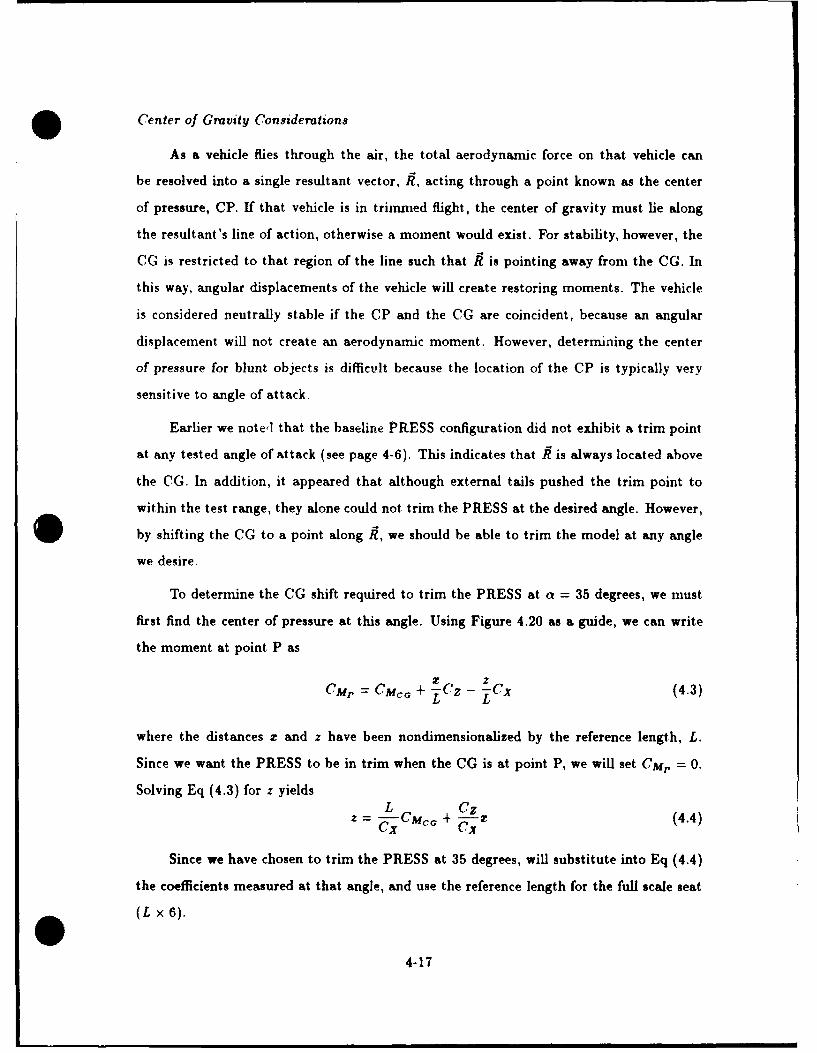
Center of Gravity Considerations
As a vehicle flies through the air, the total aerodynamic force on that vehicle can
be resolved into a single resultant vector, A, acting through a point known as the center
of pressure, CP. If that vehicle is in trimmed flight, the center of gravity must lie along
the resultant's line of action, otherwise a moment would exist. For stability, however, the
CC is restricted to that region of the line such that A is pointing away from the CC. In
this way, angular displacements of the vehicle will create restoring moments. The vehicle
is considered neutrally stable if the CP and the CG are coincident, because an angular
displacement will not create an aerodynamic moment. However, determining the center
of pressure for blunt objects is difficult because the location of the CP is typically very
sensitive to angle of attack.
Earlier we notec! that the baseline PRESS configuration did not exhibit a trim point
at any tested angle of attack (see page 4-6). This indicates that A is always located above
the CG. In addition, it appeared that although external tails pushed the trim point to
within the test range, they alone could not trim the PRESS at the desired angle. However,
by shifting the CC to a point along A, we should be able to trim the model at any angle
we desire.
To determine the CC shift required to trim the PRESS at a = 35 degrees, we must
first find the center of pressure at this angle. Using Figure 4.20 as a guide, we can write
the moment at point P as
r zCM, = CMcG + -CZ - -Cx (4.3)
where the distances - and z have been nondimensionalized by the reference length, L.
Since we want the PRESS to be in trim when the CC is at point P, we will set CM,, = 0.
Solving Eq (4.3) for z yieldsSC- + Cz (4.4)
ex C1
Since we have chosen to trim the PRESS at 35 degrees, will substitute into Eq (4.4)
the coefficients measured at that angle, and use the reference length for the full scale seat
(L x 6).
4-17
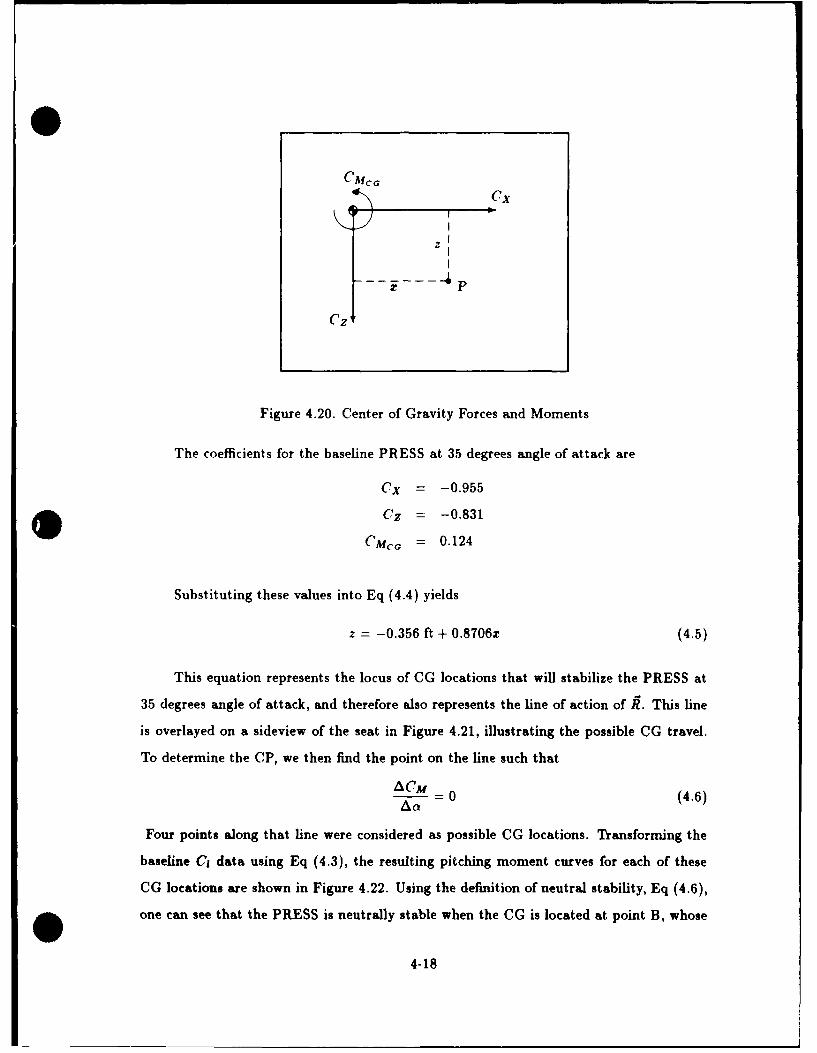
cex
(,z
Figure 4.20. Center of Gravity Forces and Moments
The coefficients for the baseline PRESS at 35 degrees angle of attack are
Cx = -0.955
Cz = -0.831
C'McG = 0.124
Substituting these values into Eq (4.4) yields
z = -0.356 ft + 0.8706z (4.5)
This equation represents the locus of CG locations that will stabilize the PRESS at
35 degrees angle of attack, and therefore also represents the line of action of R. This line
is overlayed on a sideview of the seat in Figure 4.21, illustrating the possible CG travel.
To determine the CP, we then find the point on the line such that
ACM 0 (4.6)Aa
Four points along that line were considered as possible CG locations. Transforming the
baseline C1 data using Eq (4.3), the resulting pitching moment curves for each of these
CG locations are shown in Figure 4.22. Using the definition of neutral stability, Eq (4.6),
one can see that the PRESS is neutrally stable when the CG is located at point B, whose
4-18

* A
Figure 4.21. CG Locations to Trim PRESS at 35 Degrees
4-19

-, F 0 irt A
Pont B
point C
-Z
-2
Angie of Attoo-k - ~(jegrees)
Figure 4.22. Effect of VaryingCG Locations on Pitch Stability (Baseline)
4-20
pitching moment curve is shown in Figure 4.22 as a dashed line. Shifting the CG to points
C and D will stabilize the seat, while shifting to point A will cause the seat to become
unstable. Therefore, the center of pressure must be located at point B. The coordinates of
point B relative to the CG as defined by Figure 4.20 are
r -- 0.20 ft
z = -0.18 ft
This point represents the smallest possible CG shift for stable, trimmed flight at
35 degrees angle of attack, a total shift of 3.24 inches.
A similar analysis was performed for the PRESS with the short tail installed be-
cause physical requirements may not allow a forward shift of the CG. The coefficients at
35 degrees a for this case are
CX = -0.995
Cz = -1.247
Cm,, = -0.133
The CG locus and selected points are illustrated in Figure 4.23, and the resulting
pitching moment curves for each points can be seen in Figure 4.24. We can see from these
figures that the PRESS center of pressure with the short tail is located at point E, whose
coordinates relative to the original CG are
z = -0.40 ft
z = -0.44 ft
This represents a CG shift of 7.14 inches. Again, the C curve for this CG location
is shown in Figure 4.24 as a dashed line. The minimum required CG shift to trim and
stabilize the modified PRESS at 35 degrees, however, is 1.5 inches, the closest approach of
the line to the original CG location.
4-21

0
Figure 4.23. CG Locations to Trim PRESS at 35 Degrees with Short Tail
94-22

-4
-4
- - -"--" - t-:ft L
- 4
. -: i .3r,;,nzi C3 "'- 4
Ps,rt F
N1 "\ P-nt G
P : rt I-i
4C 60
Angle of Attock - Ca (degrees)
Figure 4.24. Effect of Varying CG Locations on Pitch Stability (Short Tail)
4-23

V. Wafer Tunnel
Flow Visualization
To construct a reasonable apparent body as described in Chapter VI, some type of
flow visualization technique was required. The most efficient method in terms of time, cost,
and availability was to use the Flight Dynamics Laboratory two-foot water tunnel. This
chapter will describe the facilities and test procedures, and will present some qualitative
results.
Facility Description
The Two-Foot Hydrodynamic Test Facility is located in Bldg 25a, Area B, at Wright-
Patterson AFB, and is operated by the Aeromechanics Division of the Flight Dynamics
Laboratory. The primary purpose of the water tunnel is to use inexpensive models and
colored dyes to provide a qualitative simulation of the flow pattern produced by a flight
vehicle at virtually any flight condition.
0This facility is a closed circuit vertical water tunnel with a maximum test section
velocity of 0.85 feet per second, with the optimum for flow visualization (using dye injec-
tion) being 0.25 feet per second. The test section has a 2'x2' cross section and a length
of 4 feet. The test section is constructed of two inch plexiglass on two adjacent sides for
viewing and a slide away door to permit quick access to the model. The tunnel design
includes a 7,000 gallon reservoir above the test section, and sufficient pumping capability
to test continuously at 0.85 feet per second. A dye injection system for flow visualization
is available. Colored dye can be injected into the flow either from the model, if equipped
with dye ports, or from a rake located upstream from the model.
Test Configurations
To be able to observe the entire flow field about the PRESS, four different dye injection
sources were utilized. The various techniques were combined as needed to provide flow
information in the region of interest. In some cases, the use of one dye source did not
5-1
permit the use of another due to a local diqruption of the flow pattern. The various dye
sources are illustrated in Figure 5.1 and described below:
1. A dye rake injected red dye into the freestrearn approximately three inches upstream
of the model. The rake could be positioned such that the dye followed the flow
streamlines all the way past the model. It could also be adjusted during a test to
other positions. The rake is shown in Figure 5.1(a).
2. Dye ports mounted on the sides of the cowling discharged blue dye laterally from the
model. The flow in this region was suspected to be separated and hi'-hly turbulent.
The dye ejected into this region would therefore mix rapidly and form a cloud rather
than streamlines, and would completely fill the separated region. The difference in
color provided visual contrast between the separated flow and the laminar freestreani
flow. These ports are shown in Figure 5.1(b).
3. External tubes were mounted longitudinally along the lower surface of the model,
discharging blue dye over the front surface as shown in Figure 5.1(c). The dye flowed
down the model's front surface and indicated the flow separation at the corner near
the head shield. This proved less than successful because the dye had to flow the
length of the front surface before it reached the region of interest. At the lower
angles of attack when that surface was relatively normal to the freestrean flow, the
flow direction near the surf6:e was primarily lateral and the dye left the seat on the
side before it reached the corner. In addition, the presence of the dye tubes running
longitudinally along the bottom of the model severely affected the flow in that region.
Thus, flow visualization was limited to the upper surface. This method was improved
for the next set of ports.
4. External tubes were mounted in as indicated in Figure 5.1(d) to indicate the separated
flow behind the seatback. With the placement of the dye tubes behind the seat and
out of the primary flow, there was no disruption of the flow pattern elsewhere. In
addition, the dye was discharged at the point where the anticipated flow separation
would occur, eliminating the lateral flow problem.
05-2

(a) (b)
(c) (d)
Note: Freestreani flow in each is downward
Figure 5.1. Dye Source Locations
5-3

Data Collection
The two foot water tunnel is not currently equipped with data collection equipment,
since it is primarily a flow visualization facility. However, qualitative data can be obtained
using still and video photography. Two still cameras were positioned at right angles to each
other to provide two dimensional imaging of the flow pattern. Also, two video cameras
were also orthogonally placed, with the two images recorded side by side in a split-frame
formnat for comparison.
Tcft Procedur
The primary data sought in the water tunnel was the flow pattern about the PRESS
when positioned at the predicted trim angle of attack of 52 degrees and no sideslip. This
was the condition for which the computer model in Chapter VI would be constructed.
Additional data included obtaining flow visualization at various angles of attack about the
trim angle. With the remaining time available, partial flow data was collected with the
PRESS at O's of 8 and 14 degrees for database purposes.
The test procedure was to place the model at an initial angle of attack of 40 de-
grees and the appropriate 0 for that test, and the water flow was set at 0.25 feet/sec.
This velocity corresponds to a RE of 11400, although this is relatively unimportant in
light of the discussion in Chapter IV. The angle of attack, a, was then increased in six
degree increments to a maximum of 70 degrees. Photographic data was collected at each
increment.
Re.qults
A sampling of the water tunnel results are illustrated in Figures 5.2 and 5.3. The
major findings of the water tunnel testing can be divided into two parts: flow separation
and vorticity. Flow separation will occur at surface discontinuities such as corners and its
location is virtually independent of the model's angle of attack for the range of a's tested.
Vortical flow occurs off the edges of the cowling laterally and is a strong function of a as
discussed later.
5-4

Low Jn Laminar
Flow Flow
/
/
I /I I I
S Separated I Separated
i Flow I I l owi
5-5\I I .1
/I /
l I
I lI
II
O Figure 5.2. PRESS Flow field, a = 52 deg (Shear layer shown as dashed line)
5-5

4 Laminar I4 LaminarFlow Flow
Seaae eaaeFlwFo
Figr 5..P ESFo/ila 7 e Sha ae hw sdse ieI5-6

Flow Scparation The predominant flow characteristic present about the PRESS is the
extensive flow separation. As expected, the separation "bubble" occurs in three regions:
off the bottom rear of the seat, off the sides of the cowling, and over the top in the region
of the headshield. The turbulence in these separated regions creates a large portion of the
aerodynamic drag on the PRESS. Drag is a concern in ejection seats because excessive drag
can cause large deceleration forces which may exceed the physical limits of the passenger.
The flow separation occurring in the longitudinal plane, i.e. top and bottom, behaved
predictably. The region of separation begins at the sharp edge and expands into the flow in
a direction roughly parallel to the surface from which it just separated. This shear layer, the
demarcation line between separated flow and the laminar freestream flow, then turns with
the freestream flow to become parallel with the freestrean within approximately one body
length. The position of the shear layer then remains constant as it travels downstream.
Vortical Flow Unlike the longitudinal flow separation, the flow separating from the
sides of the PRESS behaves in an unexpected manner. When the PRESS is at extremely
large angles of attack it. presents the bottom surface of the seat nearly perpendicular to
the oncoming flow. At this condition, the flow shear layer behaves as described in the
previous section. However, when the PRESS is at the angles near the trim condition,
the chamfered "nose" of the seat is pointed into the flow. In this position, the region of
flow separation is much smaller, i.e. the shear layer stays much closer to the sides of the
PRESS as it progresses downstream than it does at the higher a's. In addition, as the flow
continues past the model, the shear layers created on opposite sides curve back towards
each other, reaching a minimum separation distance of approximately two thirds of the
PRESS's width. This minimum separation is reached at approximately three body lengths
downstream from the nose of the PRESS.
This phenomenon can possibly be explained by deducing from the PRESS geometry
that vortices are created as the flow separates off the sides of the cowling. These vortices
are illustrated in Figure 5.4. The vortices are created by the angles formed by the cowling
relative to the flow direction. As the flow separates laterally, the energy created by each
vortex keeps the flow near its core rather than allowing it to propagate into the freestream.
5-7

Figure 5.4. Lateral Separation Vorticity
As the flow passes beyond the model, the mutual induction of the vortices draw the lateral
shear layers towards each other. Recalling the discussing on page 2-7 concerning the
constriction of the streamlines due to an oversized model, it must be noted that this
attraction of the shear layers towards one another might be a result of the wall's presence.
However, one would expect the same result for all a's if this were true, and that is not the
case.
0
5-

VI. Computer Analysis
As discussed in the Introduction, the purpose of computer simulation was to inves-
tigate a cost-effective alternative to physical modelling. Constructing an experimental
model costs both time and money, and significant changes to the design can render a pre-
vious model obsolete. On the other hand, a properly constructed computer model can be
easily reconfigured to meet the new design needs. Thus, a logical step early in the aero-
dynamic analysis of the PRESS was to develop such an analytical model. In the original
design study, a computer analysis was performed for the PRESS for a supersonic flight
condition (4:7.51. The simulation technique that they employed was relatively simple to
implement. However, low speed analytical methods are much more complex, since the
governing equations for a subsonic, viscous fluid are elliptic. In particular, if the vehicle
in question is blunt, i.e. not streamlined, extremely elaborate programs are required to
get reliable results. As a result of the time and cost required to perform a design trade
study using such elaborate coding, such methods are not efficient for preliminary design
considerations, particularly student projects. Thus, it was a secondary goal of this thesis
to utilize a subsonic paneling code, generally considered highly inaccurate for blunt ob-
jects, to determine the aerodynamic pressure distribution on the cowling. In order to use
this code, a computer model of the PRESS was modified to include the regions of flow
separation. The combination of the physical seat and wake regions is called an apparent
body.
Modified Neutonian Method
The aerodynamic code used by the PRESS design team was the MARK IV Supersonic-
Hypersonic Arbitrary-Body Program [4:A.1]. This program utilizes the Modified Newto-
nian Method to calculate the pressure coefficients about the flight vehicle. This method
6-1

determines the ("p for a given surface using the equation
Cp = K sin 2 (b) (6.1)
where
K - Modified Newtonian coefficient, uiiique for each shape, velocity
6 Angle of freestream flow vector relative to surface plane
To use the MARK IV code, the external shape of the test item is modeled as a system
of flat panels. The program then uses Eq (6.1) and the problem geometry of each panel
to obtain a local Cp. The individual panels and their respective pressure coefficients and
locations are then appropriately manipulated to obtain aerodynamic force and moment
coefficients.
The trick to using Eq (6.1) is determining the correct value of K. As the method was
originally developed, K was a direct function of Mach number and valid only for bodies at
high supersonic and hypersonic velocities [11]. For a sphere, K asymptotically approaches
a maximum value of 1.833, approximately reached at M = 5. Because of this asymptotic
nature, the Modified Newtonian was developed for hypersonic speeds (M > 5) where K is
held constant at 1.833.
Ejection seat designers soon discovered, however, that by modifying K, Eq (6.1) pro-
vided reasonably good correlation with experimental data, even at low supersonic speeds.
Reference [11] produced evidence that aerodynamic data for ejections seats have been
accurately predicted for velocities as low as Mach 0.6. However, these studies required ex-
perimental data to establish K. In a similar manner, by comparing computer analysis to
experimental results, Chiang [3] determined that the optimum K for an ACES II ejection
seat at Mach 1.2 and 20,000 feet was 1.4. For lack of a better method, Reference [4] made
the assumption that the PRESS was sufficiently similar to the ACES II in shape and used
the same value for K. Thus, their analysis was limited to the same flight conditions. Since
no K was available for subsonic velocities, this technique could not be applied for the low
speed case.
6-2

Subsonic Aerodynamic Paneling Techniques
Aerodynamic paneling codes operate on the general principle that any arbitrary body
being modeled can be approximated with smooth panels. These panels are typically flat
for numerical simplicity, although not necessarily required to be so. Solutions to the
flow's governing equations are found for control points within the interior of each panel.
Because of the nature of these governing equations, the solution for a given panel may
be independent of the other panels (supersonic), or they may be interrelated, requiring
a simultaneous solution for all the panels (subsonic). The Modified Newtonian Method
described above is an example of a supersonic paneling code, with the solution for each
panel dependent only upon its orientation to the freestream.
Subsonic paneling codes are much more complex, however. They are based on poten-
tial theory, a good discussion of which can be found in Reference [8]. The major feature
of this theory is that fluids are mathematically described as having no viscosity, and phe-
nomena such as flow separation, turbulence, and aerodynamic drag cannot be predicted.
Potential flow based paneling codes are very easy to use, however, and on streamlined
vehicles where viscous effects are insignificant, they are very accurate.
Problems occur, however, when paneling codes are used to analyze blunt objects.
Recalling our discussion on page 3-11, flow separation can occur at edges, when the flow
is forced to turn too sharply. The result of sharp corners in potential theory is numerical
singularities, because instantaneous changes in flow direction require infinite velocities.
Since the control points by definition are in the interior of smooth panels, and cannot
lie on such an edge, there are always finite solutions. Computationally, however, these
singularities will cause velocity spikes at those control points near the edges, and depending
on the angle made by the corner, their effects can propagate significantly into otherwise
well behaved flow. As a result, paneling codes have not been used in the past to analyze
blunt objects. Reference [6] cited a recent attempt to use QUADPAN@ [12], a paneling
code developed by the Lockheed Corporation, on an escape capsule. The initial results
were so inaccurate that it was immediately abandoned.
In light of the above discussion, use of a paneling code for the PRESS, whose flow
6-3

field is dominated by separation, required a differnt approach to the construction of the
computer model.
Apparent Body Analysis
Although the flow within the regions of separation is extremely turbulent, the flow
outside of those regions is very smooth and can be approximated with potential theory
quite accurately. Therefore, it was hypothesized that if one modeled all separated flow
regions as part of the seat, then a potential paneling code should be able to accurately
predict the laminar flow solution. This computer model is known as an apparent body.
However, to do this, it was necessary to either predict or determine experimentally the
location of the separated flow regions. Since the unique shape of the PRESS prevented the
use of any known flow solutions for predictive purposes, some sort of flow visualization was
required. For this reason, the water tunnel testing of Chapter V was performed to identify
the shear layer marking the intersection of the laminar and turbulent flow regions.
Using the flow visualization data for the PRESS at 52 degrees angle of attack and0 zero sideslip (see Figure 5.2), a three dimensional body was constructed, illustrated in
Figure 6.1. The front and bottom cowling and the connecting chamfer section form the
front portion of the body. These surfaces will be referred to as the impact surfaces, since
they are in direct contact with freestream. The remaining surfaces of the seat were en-
closed within the separation envelope. The rest of the apparent body shape represents the
demarcation between the separated flow in the interior, and the laminar, potential flow
around the exterior. Since the turbulent flow region appeared to stabilize in shape and
continue downstream with a constant cross section, this portion was constructed ten body
lengths long and capped with a surface normal to the freestream. It was reasoned that by
being that far downstream, the 90 degree edge would have little effect on the results near
the seat itself. In addition, at the junction of the envelope and the seat cowlings, there
were still some slight edges present. This was unavoidable with the geometry software
available, and the results will be clearly evident.
To perform the analysis, QUADPAN was chosen for its ease of use and student
6-4

Figure 6.1. PRESS Apparent Body Computer Model
6-5

availability. Arrangements wpre made with the Aircraft Dynamics Branch of the 4950
Test Wing to utilize their Computational Aerodynamic Workstation (CAW). This facility
features QUADPAN on a DEC MicroVax III minicomputer. In addition, the CAW incudes
a digitizing pad and associated software, and a graphics system to display the geometry
and results.
QUADPAN Results
QITADPAN outputs data of two types. First, it determines the pressure coefficient at
the control point of each panel. Next, the code uses those C P's and the area and orientation
of each panel to determine forces and moments of the vehicle.
Pressure Data The overall pressure distribution on the impact surfaces is shown
in coefficient form in Figure 6.2. Recalling that decreasing Cp, indicates increasing local
velocity, the large gradients near the sides clearly show the effects of the edges on the
apparent body. These gradients are a result of the velocity spikes discussed earlier (see
0 page 6-3). However, as will be shown in the next section, the edge effects were not a
significant problem.
Comparison to Wind Tunnel Results Recalling from the discussion on page 2-3
and Figure 2.1, the cowling pressure taps were staggered in six rows to avoid flow inter-
ference. These rows were located at 0.712, 0.837, and 0.962 inches from the centerline,
and will be referred to as the inner, center, and outer row, respectively. Due to symmetry,
only the starboard ports will be considered. If we take the contour plots in Figure 6.2 and
cut slices at the appropriate distance, we can plot the pressure coefficient distribution for
that station. If we then overlay on those plots the experimental data, a comparison can be
made between the QUADPAN and wind tunnel results. These comparisons can be seen
in Figures 6.3 through 6.5. One can see that there is a very close correlation between the
experimental data and the values predicted by QUADPAN for the impact surfaces.
In Figure 6.3 we see that the predicted pressures are consistently higher than the
experimental pressure ports for the front cowling with three exceptions (ports 12, 20,
6-6

b/1 -0 C3 -UU UL) 0 65 1o
43
3 90
00
6 2
532 0 9
4 82 C
00381
3 31 0
281 o~
0 )
2 31 0 (
Iii040 0 Contours Represent
~ 030Pressure Coefficients, Cp
0 20 ONO
1 166 -083 -000 083 1 66
Figure 6.2. QUADPAN Pressure Output for Impact Surfaces
6-7
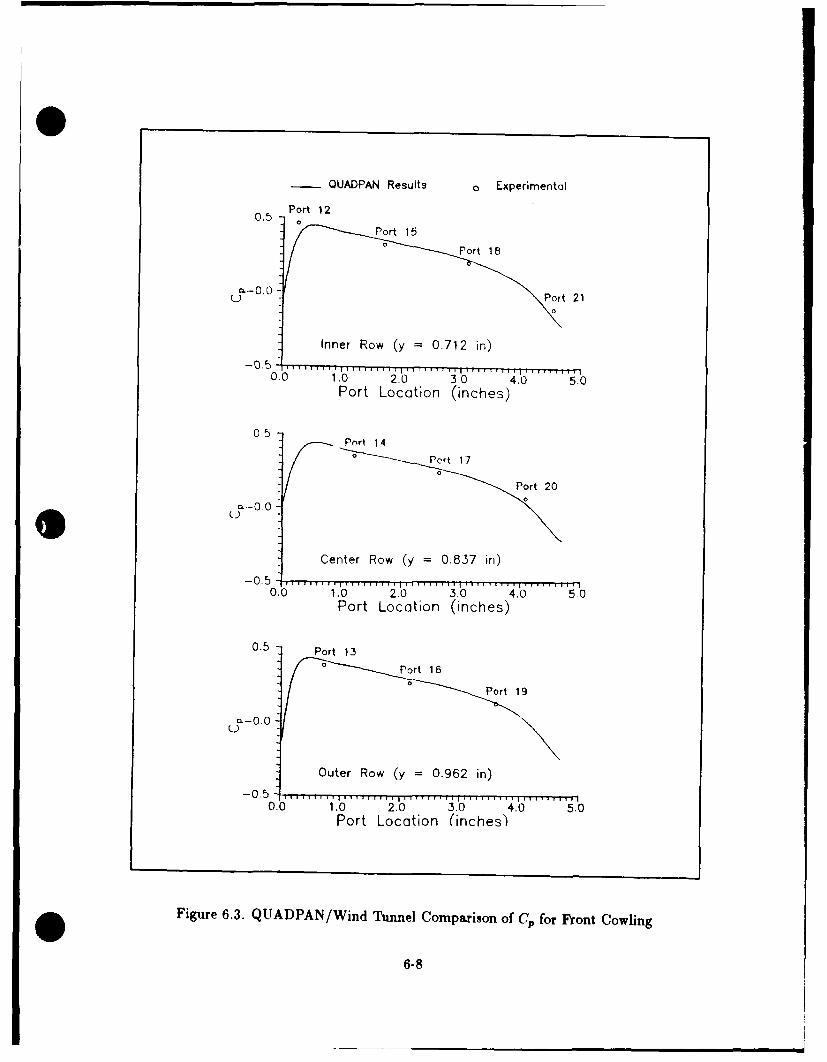
QUADPAN Resuts~ Experimental
Port Loaio2inhs
0.Po~rt 1
00
Cner Row (y =0.7 in)
0.0 1.0 20 3.0 4.0 50Port Location (inches)
Oute Ro y=0.6 n
Port ~ ~ ~ or Lo2io0inh
Figue 63. UADAN/ind unnl Cmpaiso of ,, or ron Colin
a.-6 8
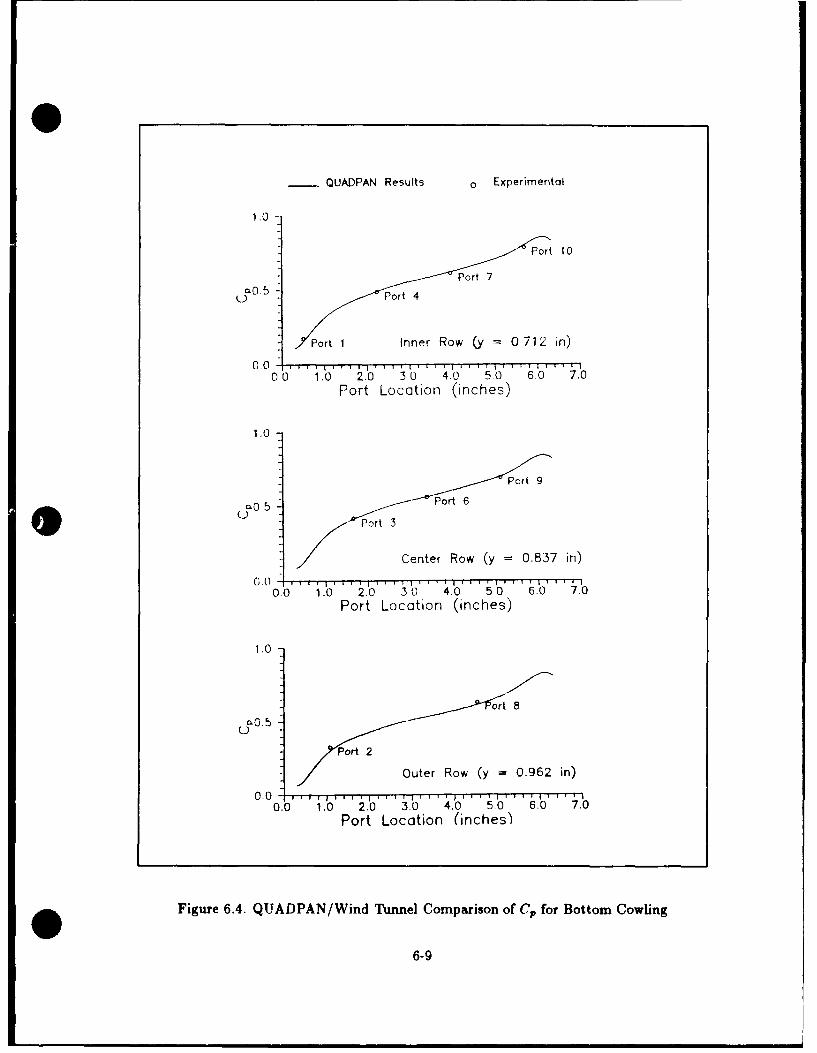
- QUADPAN Results o Experimental
1.0 -
Pr4
Pot 10
Port 7
,Port I Inner Row (y - 0712 in)
0.0 10 20 0 4. 50 6.0 7.0Port Location (inches)
1.0
C enter Row (y = 0.837 In)
0.0 1.0 2.0 V3 0 .. .5 0 6 .. .0Port Location (inches)
100
Port 3
Outer Row (y - 0.962 in)
0.0 - T O , I I
0.0 1.0 2.0 30 4.0 50 6.0 7.0Port Location (inches)
Figure 6.4. QUADPAN/Wind Tunnel Comparison of Cp for Bottom Cowling
6-9

QUADPAN Results o Experimental
1.0 Port 11
Ca-0 .5
Center Row (y = 0.837 in)0 .0 I - i I I r T- 7 I I I TI 1 I I I I
0.0 0.2 0.4 0.6 0.8Port Location (inches)
Figure 6.5. QUADPAN/Wind Tunnel Comparison of (Cp for Chamfer
and 21). These ports, however, are located in regions where the computational edge effects
are locally significant, driving the analytical C, values down. The one data point on the
chamfer (see Figure 6.5) matches the predicted curve quite well. In Figure 6.4, we see
that the analytical solution and the wind tunnel results are also almost perfectly matched.
Overall, port 12 represents the worst case with an error of ACp = 0.1, which corresponds to
a velocity error of 9.7%. It should be noted that port 5 was omitted from the data, because
that channel was reporting erroneous pressures, possibly due to debris in the tubing.
It should be rioted that the reported experimental results are an average of two test
points, thus there is not a large statistical base from which to draw conclusions. In addition,
the angle of attack for the experimental data was approximately 51.5 degrees, compared to
the 52 degrees for the analytical case. Referring to Figure 4.9, we see that some ports are
very sensitive to a at these angles of attack. Therefore, one might conclude that this might
6-10

be the reason that the data for the front cowling is predicted too high. However, since the
model was at too low an a, one would expect, the experimental pressure results to be too
high on the front cowling, which is more normal to the flow, and too low on the bottom
cowling. This is not the case. Another possible source of error is that the dynamic pressure
was not corrected for blockage effects. Again, however, this should affect the pressure data
uniformly. Therefore, although these may be factors, there must be other reasons for the
discrepancy.
The most probable explanation lies in the construction of the apparent body. If the
envelope in the regions of the front cowling were located too far laterally from the seat, the
PRESS would appear blunter than normal, which would result in higher pressures. Since
only one configuration was analyzed, however, one cannot determine the sensitivity of the
QUADPAN results to bWdy shape.
Pressure data comparisons elsewhere on the model are more difficult because QUAD-
PAN can only predict pressures on the surface of the apparent body, and all regions other
than the impact surfaces have no physical counterpart. Therefore, one can only compare
trends rather than exact points. The pressure coefficients measured by the pressure taps
on the upper cowling and the head shield at a = 52 degrees ranged from -0.51 to -0.60.
The analytical results in this region were approximately -0.57 to -0.60. Thus, there is a
reasonably good correlation for the data in this region. For the tap on the seat pan (port
50), experimental data shows a ('p of -0.77 at a = 52 degrees. This compares to QUAD-
PAN predictions of approximately -0.43. Therefore, it would appear that the pressures
behind the cowling where the major flow separation is occurring cannot be predicted with
any reliability.
Force And Moment Data QUADPAN uses the pressure coefficients on each panel, the
direction of the panel's surface normal vector, and a moment reference center to determine
force and moment coefficients on the vehicle. It was a goal of this thesis to determine
whether QUADPAN could provide such data for the PRESS using the apparent body
approach. Unfortunately, this data was not even close enough to identify trends. There
are several possible explanations for this, but the main reason is that the apparent body
6-11

approach provides pressure data not on the surface of the seat, but at some point out in
the flow where the turbulent flow transitions into laminar flow. Since turbulence is by
definition a mixing flow, the flow conditions at the surface of the apparent body are quite
different from those found on the model itself. Another reason for the Door correlation is
that the analytical model consists of surfaces that have no physical counterparts, such as
the extended tail behind the seat. Although QUADPAN is capable of ignoring specified
panels for force calculations, the geometry of the problem still left a large amount of excess
surface area. Finally, since QUADPAN is a potential code based on inviscid flow theory,
there is no friction drag, and since the turbulent region was removed from consideration by
being placed inside the body, there was no drag resulting from turbulence, which for the
PRESS is a major portion of the overall drag. Thus, the drag was poorly calculated, which
in turn contributes to the poor result in the pitching moment calculations. The result of
all this is the apparent body approach worked very well for the wetted surface pressures
but did not work well for forces and moments for this test case.
0
6-12
VH. Summary Of Results and Conclusions
This chapter will present a summary of the results and conclusions reached in the
previous chapters.
Stabrl~ty Characteristics of the PRESS
Wind tunnel testing showed that the PRESS in the baseline conhguration is laterally
and directionally stable in ejected flight at low speeds. but exhibits unacceptable pitching
moment behavior. However, it was demonstrated that the pitch stability can be greatly
improved with the addition of aerodynamic fins. Improvements can also be made in the
directional stability of the seat with the addition of yaw fins, but testing showed that the
fins cause lateral instabilities.
In addition, the center of pressure was located for the desired trim angle of 35 degrees,
and analysis showed that the PRESS could be trimmed and stabilized at this angle by
shifting the center of gravity 3.24 inches from its present location. By adding the short
tail, a smaller shift of only 1.5 inches can trim and stabilize the PRESS at 35 degrees.
('omputer Analysis Results
This study showed that by constructing an apparent body for the PRESS and its
flow separation regions, a subsonic paneling code such as QUADPAN is capable of ac-
curately predicting aerodynamic pressure coefficients on the impact surfaces, and those
surfaces close to the apparent body surface. However, the program was not able to predict
pressures measured at a point on the seat just below the pilot's leg. Therefore, it appears
that flow behavior behind the cowling where severe turbulence was occurring cannot be
reliably determined with this method. In addition, the code was incapable of accurately
determining force and moment coefficients. This was because the code determined the
flow characteristics on the apparent body surface only, which are quite different than the
characteristics on the surface on the seat itself, with the exception of the cowling which
formed the leading edge of the apparent body.
7-1

Conclusions
This thesis has proven the aerodynamic feasibility of the Prone Escape System. Al-
though stability and the correct trim was achieved with external fins and/or a shift in the
PRESS's center of gravity location, it should be possible to accomplish this with a simple
refinement in the external shape of the cowling itself. Therefore,it is recommended that
an aerodynamic refinement be performed on the cowling and further wind tunnel testing
be performed.
0
7-2

Bibliography
1. Bennet, David. Former Engineer, Deputy for Life Support Systems, ASD, Wright-Patterson AFB, OH 45431. Personal interview, 1988.
2. Burton, Russell R. "A Conceptual Model for Predicting Pilot Group G Tolerance forTactical Fighter Aircraft". Aviation, Space and Environmental Medicine, 57:733-744,August 1986.
3. Chaing, Donald C. Computer Code for the Determination of Ejection Seat/Man Aero-dynamic Parameters. Technical Report AFOSR-80-0147, Air Force Office of ScientificResearch, 1980.
4. Disselkoen, Allen D. et al. Prone Escape System (PRESS) Design Study. Master's the-sis, School of Engineering, Air Force Institute of Technology (AU), Wright-PattersonAFB, OH, December 1987. AFIT/GSE/AA/87D-2. (AD-B 118011).
5. Gething, Michael 3. et al. The Great Book of Modern Warplanes. Portland House,New York, 1987.
6. Hubert, James H. Vehicle Equipment Division, Flight Dynamics Laboratory, Wright-Patterson AFB, O[ 45431. Personal interview, 1988.
7. Jines, Lanny. Aircrew Escape Branch, Flight Dynamics Laboratory, Wright-PattersonAFB, OH 45431. Personal interview, 1988.
8. Kuethe, Arnold M. and Chuen-Yen Chow. Foundations of Aerodynamics. John Wiley& Sons, New York, third edition, 1976.
9. Pope, Alan and William H. Rae Jr. Lou' Speed Wind Tunnel Testing. John Wiley andSons, New York, 1984.
10. Roskam, Jan. Airplane Flight Dynamics and Automatic Flight Controls, Part LRoskam Aviation and Engineering Corporation, Ottawa, Kansas, 1979.
11. Shereda, Don. Aeromechanics Division, Flight Dynamics Laboratory, Wright-Patterson AFB, Oh 45431. Personal interview, 1988.
12. Youngren, Ha.,uld H. et al. QUADPAN Users Manual Ver 3.2. Technical Re-port LR 30563, Lockheed Corporation, 1984.
BIB-I

Appendix A. Wind Tunnel Program Algorithm
This section will briefly describe the program used at the AFIT five foot wind tunnel
in terms of procedural steps. The program can be separated into four major components:
calibration, data collection, tare slope calculation, and data reduction/presentation. The
entire program runs from a menu, incorporating all parts into one very user-friendly pack-
age.
Calibration
At the beginning of any test program, four types of calibrations must be performed:
strain gage, sting bend, angle of attack, and pressure. The computer programs role in
these calibrations will be discussed below.
Balance Strain Gage Calibration The strain gage balance consists of six gages: two
normal force (Ni and N2), two side force ( Yi and Y2), an axial force gage, (AX), and a
rolling moment gage (RM). The purpose of the strain gage calibration is to determine the
relationship between the applied force and the balance voltage output, i.e. pounds per volt
for each gage. Each of these gages must be calibrated for both positive and negative loads,
with the exception of AX which is calibrated in the positive direction only. Positive loads
on the balance are defined as follows: normal force is upward (; lift), axial is rearward
(z drag), side force is to the right when looking forward (IV x AY = ft), and positive
rolling moment is right wing down.
The calibration procedure calls for hanging weights from a calibration body mounted
on the balance such that the applied force is aligned with the line of action of the gage
in question. The output voltage of all six gages and the applied weight is recorded by
the computer. It is important to record the output voltage of all six gages regardless of
which gage has the applied weight. Even though 50 lbs is being applied to the NI gage,
the output voltages of the other five gages will change as well. This behavior is called gage
interaction. The weight is incremented throughout the expected range, both positively
and negatively.
A-i

Next, a least squares linear regression is performed on the voltage data collected to
obtain volts per pound values for each gage. This step includes the interaction effects,
i.e. the voltage change in YI due to a force applied to, say, N2. This results in 72 values
(6 gages x 6 forces x 2 directions). These values are stored in a file called the balance
calibration file.
Sting Bend Calibration As forces are applied to the model during a test, the sting
will bend, changing the angle of attack. The purpose of the sting bend calibration is to
determine the amount of bend the sting undergoes in degrees per pound of load, as well
as sting twist due to external torques. In the above procedure, each incremental weight
is applied with the balance at a zero degree angle of attack. As each weight is applied,
the sting bends a small amount. This angle is recorded along with the applied force, and
the balance is then restored to zero degrees by pitching the yoke. The next weight is then
applied, and the process is repeated. Thus, both calibrations are performed simultaneously.
Required data is vertical bend due to positive and negative normal loads, horizontal bend
due to side forces, and twist due to rolling moments. For this step, it is assumed that the
bend is symmetrical, i.e, the sting bends the same for positive forces as it does for negative
forces. The positive and negative measurements serve as a check, and if they differ, an
average can be use. Tables are created and input into the program that relates total sting
bend to applied force for NI, N2, YI, and Y2, and sting twist to RM, and stored until
needed for data reduction.
Angle of Attack Calibration The previous two calibrations can theoretically be per-
formed only once per balance, although good testing procedures dictate it be done for each
test. However, the angle of attack calibration must be done for each model. Since the
sting bends with applied force, the weight of the model itself will chtnge it's own angle of
attack. To account for this, the model is placed at known angles of attack as measured by
an inclinometer, and the voltage from the a potentiometer is recorded. These values will
differ, however, if the model is placed in sideslip, 0, due to mechanical reasons. Therefore,
this procedure must be repeated for various sideslip angles as well. This data is entered
into the computer as a versus volts in tabular form for each /3. As above, this data is
A-2

stored until needed by the data reduction program. In addition, values of 13 angles versus
13 voltage is also recorded.
Pressure Calibration The data acquisition system measures two pressure values using
voltage levels: dynamic pressure and base pressure. Each must be properly calibrated to
produce accurate readings. This is done by using a dead weight tester or similar device to
provide known pressures and record output voltages. The data is tabulated and stored in
a pressure calibration file for use by the data reduction routines.
Data ('ollectzon
The data collection procedure is as follows:
1. The operator inputs several lines of data such as model configuration, roll angle and
barometric pressure. The computer labels the data and places it in the resulting raw
data file for that particular run.
2. The model is placed at zero a, and strain gage voltages are collected with the wind
off. This will be referred to as the zero point. Each data point is actually a statis-
tical set of data returned to the Z-248 computer from the Hewlett-Packard digital
data acquisition unit. The unit takes a number of data points (user selectable) and
returns to the Z-248 computer the high, low, mean, and standard deviation of that
measurement set, which is then presented to the operator. If voltage spikes appear in
the data, the operator can abort the run; otherwise the wind is brought up to speed
and the model placed in position for the first data point. The zero point can also be
used to perform steps such as calibrating the onboard pressure transducer.
3. The model is then incremented through a, typically from low to high, and data is
collected at each point. Run data includes air temperature in the tunnel, dynamic
and base pressure voltages, strain gage voltages, a and fl potentiometer voltages, and
any other data the operator chooses to include such as pressure port data from the
model. As above, each set of data is presented to the operator for approval or a
AA-3

retake. This data should include some repeat points with sting movement reversed
to check for repeatability and hysteresis effects.
4. At the completion of the run, the operator then inputs a line into the data file
indicating repeat points or other problems which occurred during the run. The data
file is then stored until needed for data reduction.
Tare Slope Calculation
The purpose of tare data, is to eliminate the model's weight contribution to the total
forces and moments measured by the balance. To accomplish this, it is necessary to know
the models weigtJ, and the location of it's center of gravity relative to the balance moment
center. This is calculated by either direct physical measurement or using the tare slope
calculation routines in the computer. This procedure was developed by the author and is
outlined in detail in Appendix B.
Data Reduction
The data reduction program, although a small portion of the overall package, is the
heart of the wind tunnel data acquisition system. This set of routines takes the raw voltages
and creates aerodynamic coefficients in three axis systems: body, stability, and wind. The
steps performed by the computer during this process are described below.
1. The first step is to calculate a and 0 from the voltage levels. This is done by creating
two tables of voltages in the form shown in Table A.1. First, a cubic spline function is
fit to the ,3 table to determine the sideslip angle from the measured value. Then, using
the a table, a column of a voltages for the determined value of 0 is constructed by
interpolating between the existing columns. Then a cubic spline is used to determine
the correct value for a.
2. Cubic spline functions are fit to the dynamic pressure and the base pressure calibration
files to determine the values from the raw voltages.
3. The raw voltages, E, from the strain gage balance are then analyzed to determine
whether a positive or a negative load is being applied to each. Then the appropriate
A-4
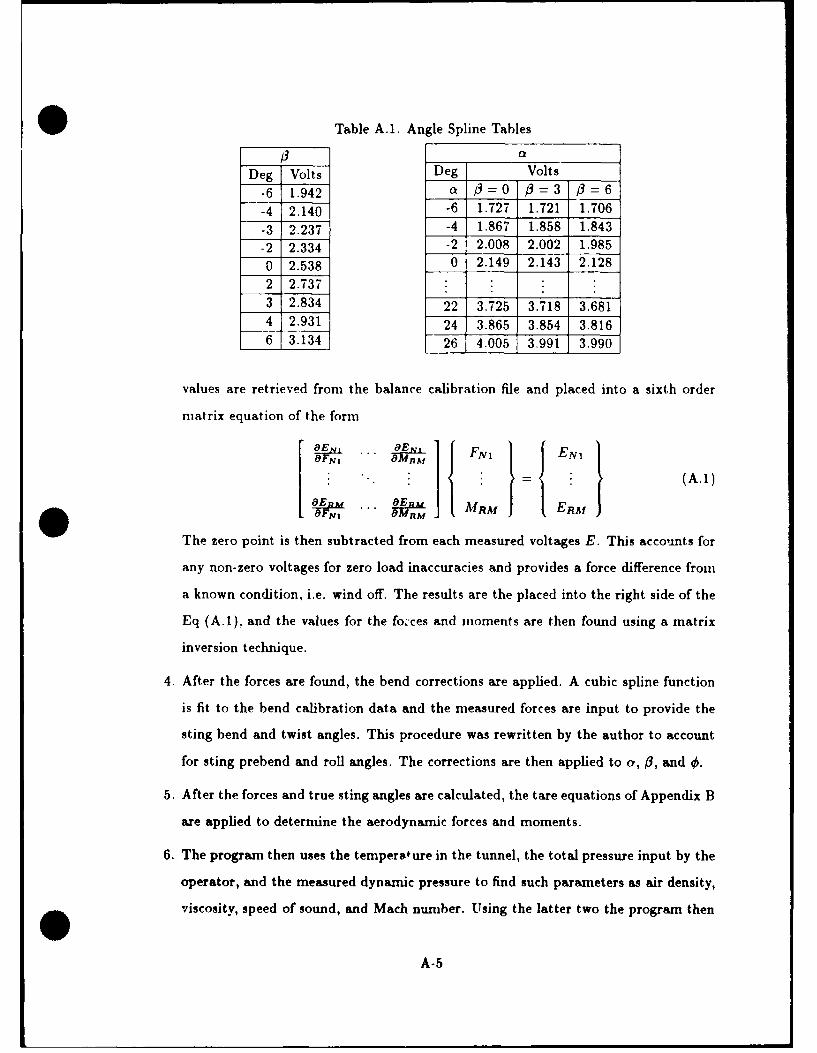
Table A.1. Angle Spline Tables
Deg Volts Deg Volts
-6 1.942 a 0B= 0=3=3 3 =6-4 2.140 -6 1.727 1.721 1.706-3 2.237 -4 1.867 1.858 1.843-2 2.334 -2 2.008 2.002 1.9850 2.538 0 2.149 2.143 2.128
2 2.737 :3 2.834 22 3.725 3.718 3.6814 2.931 24 3.865 3.854 3.8166 3.134 26 4.005 3.991 3.990
values are retrieved from the balance calibration file and placed into a sixth order
matrix equation of the form
" B 1-'J [ j1EN8E .. OE FNI JENI. " = (A.1)
OFNI ;W, "'" .- I MIM
The zero point is then subtracted from each measured voltages E. This accounts for
any non-zero voltages for zero load inaccuracies and provides a force difference from
a known condition, i.e. wind off. The results are the placed into the right side of the
Eq (A.1), and the values for the fo.'ces and moments are then found using a matrix
inversion technique.
4. After the forces are found, the bend corrections are applied. A cubic spline function
is fit to the bend calibration data and the measured forces are input to provide the
sting bend and twist angles. This procedure was rewritten by the author to account
for sting prebend and roll angles. The corrections are then applied to a, #, and 0.
5. After the forces and true sting angles are calculated, the tare equations of Appendix B
are applied to determine the aerodynamic forces and moments.
6. The program then uses the temperature in the tunnel, the total pressure input by the
operator, and the measured dynamic pressure to find such parameters as air density,
viscosity, speed of sound, and Mach nunber. Using the latter two the program then
A-5

finds the velocity of the air in the tunnel and the true dynamic pressure, q. This
differs from the measured dynamic pressure due to compressibility effects. During
this step corrections are applied to q to account for factors such as tunnel skew and
model blockage effects.
7. The next step is to use the reference values and dynamic pressure to nondimensionalize
the measured forces and moments as described in Chapter III. The buoyancy, induced
drag, and base pressure corrections to the drag coefficient are then applied. The data
produced here is in body coordinates (see page 3-2). The moment coefficients are
calculated at the balance moment center and can be transferred to any point the user
wishes, such as the CG of the full scale vehicle. Corrections to a and '3 due to sting
prebend and roll are then applied.
8. Finally, coordinate transformations are performed to put the coefficients in stability
and wind coordinate systems (see page 3-3).
When data reduction is complete, the program provides a method of printing out a
complete record of the reduced data of any data run, as well as providing direct access to
a commercial plotting routine.
A-6

Appendix B. Tare Slope Corrections and Calculations
A difficulty in all wind tunnel testing is that strain gage balances cannot differentiate
between aerodynamic and gravitational forces. Thus, it is necessary to determine the
model's weight contribution to the total forces and moments measured for each axis as a
function of its orientation. These weight effects are called tare. The following will present
the basic form of tare equations, develop the transformation matrix required to convert
the weight vector into body axis components, and present the final tare equations as used
in the program. Finally, the method of experimentally determining the tare slopes of the
model will be presented.
General Form of Tare Equations
Model orientation is provided by mechanizing the model support sting with four
possible rotations. First, the yoke can be pitched up and down an angle 0. Second, the
yoke can be yawed left or right to an angle, V/,. Rolling the sting in the yoke to an angle,
d, is a third possible movement. Lastly, the sting can have a prebend in the balance's XY
plane of an angle -. This results in the weight component along any axis being a function
of 0, t,, and "y. V' is not a factor because it is measured about an axis parallel to the gravity
vector.
The first step is to develop a general equation for the tare forces. We can write the
total forces along any axis 'Q' as measured by the balance as
FQT FQA + FQ0 + FQw(0,4 ,y) (B.1)
whereFQT = Total force measured along 'Q' axis
FQA = Aerodynamic force along 'X' axis
FQ,, = Forces other than model weight, measured at zero airspeed
FQw (#,,0, 7) = Weight component of model as function of 0, 4', and -
The FQ. term may need further explanation. Due to the inherent nature of strain gage
balances, the gages may indicate a voltage due to a non-zero offset of the bridge balance
B-I

with no external load present. Since this is not accounted for in the gage coefficient
matrix, it will show up in the data reduction as a virtual force. From the discussion on
data reduction, we know that we subtract the zero point from each data point. The zero
point is the algebraic sum of FQ0 and Fqw.(O,O,7). Therefore, subtracting these terms
from both sides of Eq (B.1) yields:
FQc -FQA + FQ(,,,)- FQ.(0,¢,y) (B.2)
where
FQC = Corrected force (FQT - FQ,, -FQw(0,
The next step is to determine the functional relationship between FQw and the rota
tion angles 0, 4, and y.
Transformation Matrix and Tare Equations
A vector in any coordinate system can be transformed to another system using a
maximum of three rotations. In this case, we will transform the weight vector from tunnel
coordinates to balance coordinates. We begin with a standard wind axis coordinate system
(see page 3-3), and make the following rotations:
1. Rotate an angle 0 about the YW axis to create an intermediate axis system X 1Y1Z1 .
Putting this in matrix form:
X, cos 0 0 - sin] J XW1Y, 0 1 0 Yw (B.3)
Z, sin 0 0 cos 0 IZwJ
2. Rotate an angle 4 about the X 1 axis to create the next intermediate axis system
X 2Y2 Z 2 . In equation form this becomes:
Y2 = 0 cos (0 sin 0 1", (B.4)
Z2 0 -sine cost Z
B-2

3. Rotate an angle - about the X 2 axis to create the final axis system XBIBZB. Again,
in matrix form:
X B Cos - 0 - sin X2
I 1B [0 0 Y 5 (B.5)
ZB sin 1/ 0 cos 7 Z2
By performing back substitution, one gets:
XBCs 10 i 1 0 10 cos 0 0 -sin 0
YB [ 0 0 cos sin 0 1 0 Y
Z8 sin 7 0 cos-y 0 -sin) cos¢ sin0 0 cos 0 z
(B.6)
The above expression will transform force vectors from the tunnel coordinate system
into balance coordinates. A problem with this is that strain gage coordinate systems
typically are not calibrated with this orientation. Standard procedure is to calibrate the
balance such that a positive force will generate a positive voltage and vica versa. This
results in a positive normal force directed upward (-Z), a positive axial force rearward
(-.V), and a positive side force to the right (+f). This is shown along with the tunnel
axis sys teni in Figure BI. Using this convention, the weight vector in balance coordinates
isFUw,(0, 0, -) =FA.{, (0,7, I"B + FSw, 0,7YB - FN.,.(0, 0, I) ZB (B. 7)
and the weight vector in the wind axis system is
Vw = 09 + o0 + Wi (B.8)
We now substitute Eqs (B.7) and (B.8) into the first and last column vectors of
Eq (B.6) respectively:IXB J Fw8,,Y f 0~oYB Fs,(O, ,r) Y J0 (B.9)
ZB -FNw(0, 0, 7) Z W
B-3

0FN
FA Y',FsIx
Notes:0 = 0 when gravity vector lies in IY planeSting points along +X axis
Figure B.I. Balance Coordinate System
Performing the algebra yields the equations we need:
FAw(O,O,"t) = Wcosysin8-WsinycoscosG
Fsw(O,,7) = WsinbcosO (B.10)
FN,.(O,4,-) = WsinsinO - Wcos-fcos40cos9
By substituting Eq (B.10) into Eq (B.2), evaluating, and rearranging, the force tare equa-
tions become:
FAA FA, - WcosysinO- Wsin cos O(cos- 1)
FsA = Fs. - Wsin O(cosG- 1) (B.11)
FNA FN, - W sin 7 sin 0 + W cos 7cos O(cos - 1)
Next, we must obtain the moment tare equations. These equations are of the same
form as Eq (B.2)
MQo = MQA + MQw(O,4,7-)- MQW(0,0,y) (B.12)
They result from the forces in Eq (B.10) acting through the model's center of gravity
(CG) located some finite distance from the balance moment center (BMC). Figure B.2
B-4

BMCx
~~PAw "
- Model CG
Figure B.2. Weight Induced Moments (Body Coordinates)
shows the relationship between the BMC and the model's weight force components in
body coordinates.
Referring to Figure B.2, it is clear that a positive FNw acting at the CG will result
in a negative rolling moment about the X-axis and a positive pitching moment about the
Y-axis. Similarly, a positive FAw will create a negative pitching moment and a positive
yawing moment. Defining the location of the model's CC relative to the BMC as scalar
values r, y, and z along their respective axis, we can write the roll, pitch, and yaw moments
about the BMC due to the model's weight in body coordinates as
MR, = -YFN. - zFs,
Mpw = ZFNw - zFAw (B.13)
My w = zFsw + yFAw
Substituting Eq (B.10) into Eq (B.13) yields:
MR W = Wy(cosycoscos0- sinysin0)- WzsinocosO
Mp w = Wz(sin-7 sing - cos- 7cosocos0) - Wz(cos-7 sing + sin - cos Ocos0)
Myw = Wzsin Ocos6+ Wy(cos- Tsing + sin- 3cos OcosO) (B.14)
B-5

The final moment tar.- equations result when Eq (B.14) is substituted into Eq (B.12):
MRA MR, + Wzsin O(cos6- 1)
+ Wy(sin y sin 0 - cos y cos O(cos 0 - 1))
MFA Alp, - Wr(sin-ysin0 - costcos O(cos6 - 1))
+ IVz(cos -ysin0 + sin -cos O(cos 0 - 1)) (B.15)
Myt = My, - 11ar sin ,(cos 6 - 1)
- IVy(cos -y sin 0 - sin-) cos (cos6 - 1))
Tare Slope Calculation
The preceding sections presented the technique for removing the weight component
from the measured forces and moments assuming the weight and moment arms are known.
This section will present a method of using the strain gage balance and those equations to
determine the weight and location of the model CG. The procedure can be divided into a
data collection portion and a data reduction portion.
0 The tare data is collected in a similar manner as the test data (see Appendix A) with
two exceptions. First, the wind is off. This serves the purpose of removing all forces and
moments due to aerodynamics from Eqs (B. 11) and (B.15). Second, the sting is positioned
with no roll (0 = 0). This is a restriction that was imposed to keep the program to
reasonable size. With these exceptions, Eqs (B.l) and (B.15) reduce to
FAC = WsinO (a)
Fs = 0 (b)
FNe = -W(cos0- 1) (c)
MRc = WY(cosG- 1)) (d) (B.16)
Mp, = -Wz(cosO-1)-Wzsin0 (e)
My c = Wy sinG (f)
B-6

All of the values in Eq (B.16) are now known except W and the products WI', Wy,
and Wz. These four values are collectively called the tare slopes. W can be found by
performing a least squares regression technique to Eq (B.16a) or Eq (B.16c). The program
allows the user to use the average of the two or pick one. Similarly, Wy can be determined
using a least squares regression on Eq (B.16d) or Eq (B.16f). Again, the user can choose
to use either value or the average for Wy. Finally, a two dimensional least squares can be
used on Eq (B.16e) to determine both Wx and Wz.
0
0B-7

Vita
Captain Lonnie R. Dillon was born He graduated
from Lawrence High School in 1980 and began attending the University of Kansas. In 1984
he graduated with a degree of Bachelor of Science in Aerospace Ergineering. He rece;--'ed
his commission in August 1984 upon graduation from Officer Training School at Lackland
AFB, Texas. From September 1984 to April 1987 he served as a munitions test engineer
with the 3246 Test 1 't .ig, Armament Division, at F.glin AFB, Florida. In April 1987
Captain Dillon transferred to the School of Engineering, Air Force Institute of Technology,
Wright-Patterson AFB.
VITA-1

UNCLASSIFIED
SECURITY CLASSIFICATION OF THIS PAGEForm Approved
REPORT DOCUMENTATION PAGE IOM No. 070r-01pp e
REPORT SECURITY CLASSIFICATION 1b RESTRICTIVE MARKINGSUNCLASSIFIED
2a. SECURITY CLASSIFICATION AUTHORITY 3 DISTRIBUTION/AVAILABILITY OF REPORTApproved for Public Release;
2b. DECLASSIFICATION / DOWNGRADING SCHEDULE distribution unlimited
4. PERFORMING ORGANIZATION REPORT NUMBER(S) S. MONITORING ORGANIZATION REPORT NUMBER(S)
AFIT/GAE/AA/88D-09
6a. NAME OF PERFORMING ORGANIZATION 6b. OFFICE SYMBOL 7a. NAME OF MONITORING ORGANIZATION(If applicable)
School of Enginaering AFIT/ENY
6c. ADDRESS (City, State, and ZIP Code) 7b. ADDRESS (City, State, and ZIP Code)
Air Force Institute of Technology (AU)
Wright-Patterson AFB, Ohio 45433-6583
Ba. NAME OF FUNDING/SPONSORING 8b OFFICE SYMBOL 9. PROCUREMENT INSTRUMENT IDENTIFICATION NUMBERORGANIZATION (If applicable)
Biomedical Protection Branch AAMRL/BBP
Sc. ADDRESS (City, State, and ZIP Code) 10 SOURCE OF FUNDING NUMBERS
Wright-Patterson AFB, Ohio 45433-6583 PROGRAM i PROJECT TASK IWORK UNITELEMENT NO. NO. NO ACCESSION NO.
11. TITLE (Include Security Classification)A WIND TUNNEL AND COMPUTER INVESTIGATION OF THE LOW SPEED AERODYNAMIC CHARACTERISTICS
OF THE PRONE ESCAPE SYSTEM (PRESS)
PERSONAL AUTHOR(S)nnie R. Dillon, B.S., Capt, USAF
13a. TYPE OF REPORT 13b. TIME COVERED 14. DATE OF REPORT (Year, Month, Day) 15. PAGE COUNTMS Thesis FROM TO December 1955 103
16. SUPPLEMENTARY NOTATION
17. COSATI CODES 18. SUBJECT TERMS (Continue on reverse If necessary and identify by block number)FIELD GROUP SUB-GROUP Ejection seats Water tunnels
01 01 Subsonic wind tunnels Computerized simulation
19. ABSTRACT (Continue on reverse if necessary and identify by block number)
Thesis Advisor: Lt Col Paul King
Assistant Professor
Department of Aeronautics and Astronautics
DISTRIBUTION /AVAILABILITY OF ABSTRACT 21. ABSTRACT SECURITY CLASSIFICATIONUNCLASSIFIEDUNLIMITED 0 SAME AS RPT, 0 DTIC USERS UNCLASSIFIED
22a. NAME OF RESPONSIBLE INDIVIDUAL 22b. TELEPHONE (Include Area Code) 22c. OFFICE SYMBOL
Paul I. King. Assistant Professor (513) 255-2362 AFIT/ENY
DD Form 1473, JUN 86 Previous editions are obsolete. SECURITY CLASSIFICATION OF THIS PAGE
UNCLASSIFIED

UNCLASSIFIED
Due to new design technology, future fighter aircraft will fly at higher g levels than
ever before. As a result, a previous preliminary design study was conducted to develop an
ejection seat providing higher g-tolerance for the crewmember during maneuvering as well
as improved windblast protection during ejection. This seat utilized the crewmember in a
prone, or leaning forward, position. The Prone Ejection System (PRESS) was computer
simulated at supersonic conditions in the earlier report and found satisfactory. It was the
purpose of this research to perform an experimental low speed study of the aerodynamic
characteristics of the PRESS. Wind tunnel testing was performed to determine the static
stability of the PRESS and measure pressures over the seat. It was determined that static
pitch stability did not occur at the desired angle of attack, but could be easily corrected
with aerodynamic fins and/or a shift in the center of gravity. Directional stability was also
confirmed. In addition, an analytical experiment was performed to determine whether a
potential paneling code could be modified to predict flow conditions about the PRESS.
An apparent body was constructed by including the regions of flow separation as part
of the seat itself. Water tunnel flow visualization was utilized to determine the shape of
the apparent body. The computer analysis showed that a paneling code could accurately
predict the pressure coefficients on the cowling.
UNCLASSIFIED