Embed Size (px)
Citation preview
CMOM ANNUAL REPORT FY2016
September 30, 2016

Page 1 of 22
Contents Capacity, Management, Operations and Maintenance (CMOM) Plan Overview ......................................... 3
Report Purpose ......................................................................................................................................... 3
Permit Requirements ................................................................................................................................ 3
CMOM Program Self-Assessment ............................................................................................................. 3
FOG Policy ..................................................................................................................................................... 4
FOG Enforcement...................................................................................................................................... 4
SSO Analyses ................................................................................................................................................. 5
Permit Requirements ................................................................................................................................ 5
SSO Study Team ........................................................................................................................................ 5
Causes & Mitigations ................................................................................................................................ 7
SSO Tabulation & Analysis ........................................................................................................................ 8
Volume Spilled and Recovered ............................................................................................................... 10
Actions Implemented and On-Going Programs .......................................................................................... 11
General .................................................................................................................................................... 11
FOG Policy Implementation: ................................................................................................................... 11
Collection System Capital Implementation Program (CIP) Funding ....................................................... 11
Overflow Emergency Response Plan (OERP) .......................................................................................... 12
Force Main Inspection Program .............................................................................................................. 12
Closed Circuit Television (CCTV) ............................................................................................................. 13
Cleaning Program Goal ........................................................................................................................... 13
Root Foaming .......................................................................................................................................... 13
FOG Buster .............................................................................................................................................. 14
Generator Plan ........................................................................................................................................ 14
Shunt Trip Testing ................................................................................................................................... 14
Manhole Base Sketches & Follow-Up ..................................................................................................... 15
Written SOPs ........................................................................................................................................... 15
Odor Complaints ..................................................................................................................................... 15
Identified Gaps in the Water Authority Processes with Recommendation to Close .................................. 18
Prohibited Discharges, i.e., SSOs ............................................................................................................. 18
Appendices .................................................................................................................................................. 19
Appendix 1 Sanitary Sewer Overflow Analysis Table ........................................................................ 20

Page 2 of 22
Appendix 2 Sanitary Sewer Overflow Volume Captured Analysis Table ........................................... 21
Appendix 3 Overflow Emergency Response Plan (OERP) ................................................................. 22

Page 3 of 22
Capacity, Management, Operations and Maintenance (CMOM) Plan Overview In accordance with National Pollutant Discharge Elimination System (NPDES) Permit No. NM0022250 (Permit), the Albuquerque Bernalillo County Water Utility Authority (Water Authority) prepared a Capacity, Management, Operations and Maintenance (CMOM) Plan with Emphasis on the Fats, Oils and Grease (FOG) Policy. The effective date of the Water Authority’s permit is October 1, 2012.
The CMOM Plan consists of the following documents:
1. FOG Policy 2. CMOM Annual Report 3. CMOM Program Self-Assessment
The FY2016 CMOM Annual Report follows previous FY2013-15 reports. The three previous reports, as well as the most recent, can be accessed at http://www.abcwua.org/Sewer_System.aspx.
Report Purpose As indicated by its name, the CMOM Annual Report will be reissued to describe CMOM activities in the previous fiscal year (July 1 to June 30). This CMOM Annual Report covers July 1, 2015 to June 30, 2016. The CMOM Annual Report provides summary descriptions of CMOM activities (past and planned) and is intended to be a communication tool. The report is intended for Water Authority staff, regulatory authorities, customers, and the general public.
Permit Requirements The Water Authority discharges to the Rio Grande under authority of NPDES Permit No. NM0022250 (Permit). Under this Permit, the Water Authority operates the Southside Water Reclamation Plant (SWRP) and the Collection System. The following are the Permit requirements that impact the collection system.
1. The Water Authority must submit a (monthly) Discharge Monitoring Report (DMR) in tabular form for all overflows. (Part I, Paragraph C.6).
2. The Water Authority must develop a Capacity, Management, Operation and Maintenance (CMOM) Plan with emphasis on the Fats, Oils and Grease (FOG) Policy. The FOG Policy will be a re-evaluation of the existing FOG Sewer Use and Wastewater Control (SCO) Ordinance. The goal of the FOG Policy will be to reduce Sanitary Sewer Overflows (SSOs). The FOG Policy may address such items as an inventory of repeat Food Service Establishments (FSE) sources of SSO and routine grease trap inspection programs at FSE with increased frequencies at repeat FOG SSO FSEs. Additional elements of the FOG Policy may be sewer line inspections, such as video recording and required sewer line cleaning activities if warranted at repeat sites.
CMOM Program Self-Assessment EPA states (see http://www.epa.gov/npdes/pubs/cmomselfreview.pdf): “An important component of a successful CMOM program is to periodically collect information on current systems and activities and develop a “snapshot-in-time” analysis. From this analysis, the utility

Page 4 of 22
establishes its performance goals and plans its CMOM program activities.” The Water Authority developed Self-Audits as a part of the FY2013 and FY2014 reports. Because the data provided in the Self-Audit does not significantly change year-to-year, the next update will coincide with the FY2019 CMOM Report.
FOG Policy The Water Authority’s FOG Policy is a separate document. The FOG Policy was developed as a requirement of the NPDES Permit effective on October 1, 2012 and subsequently approved by the United States Environmental Protection Agency (EPA). The policy was developed to work in conjunction with the Water Authority Sewer Use and Wastewater Control Ordinance (SUO) and Enforcement Response Plan (ERP) to reduce the rate of SSOs in the collection system and decrease FOG loading at the SWRP. The policy describes expectations for FOG dischargers such as Food Service Establishments (FSEs) and waste haulers, and the steps the Water Authority is taking to mitigate FOG.
The FOG Policy sets a Water Authority goal of inspecting every FSE at least once every three years. Details of what is expected of the FSE in terms of Grease Removal System (GRS) functionality, pumping schedule, maintenance, and recordkeeping are identified. The FOG policy explains the Water Authority use of the 25% solids and grease rule (25 Percent Rule) to determine if a GRS is filled to capacity. The policy also contains Best Management Practices (BMPs) such as scraping plates, using screens, and not using emulsifiers, etc.
Pumper requirements are also covered in the FOG Policy. Full evacuation of a GRS is required each time pumping occurs. The pumper must leave the FSE documentation in the form of manifests that contain pertinent information such as date, time, volume pumped, and the condition of the GRS. The FOG Policy lists the minimum service to be provided by the pumper.
Enforcement of FOG violations and hauled wastewater violations is described in the FOG Policy. The FOG Policy works in conjunction with the ERP to set administrative assessments for violations.
The FOG Policy also sets forth the process for identifying new sources of FOG. The Water Authority Pretreatment Program will update the FOG database on an annual basis. The FOG Policy sets a goal that the Water Authority will meet with the City of Albuquerque, Bernalillo County, the Village of Los Ranchos, the Village of Corrales, plumbers, and the New Mexico Restaurant Association on a semiannual basis to discuss FOG issues.
In developing the FOG Policy, the Water Authority held a meeting with the hauled wastewater permit holders on July 22, 2013 and a public meeting on July 25, 2013 to discuss the proposed Policy. The final FOG Policy was submitted to the EPA on September 27, 2013 and updated in the Pretreatment Program modification documents sent to EPA on June 2, 2014. No comments from EPA were received regarding either submission, thus indicating approval.
FOG Enforcement In FY2015, the Water Authority Pretreatment Program conducted 1,570 FSE inspections (of 2,110 FSE sites) with 1877 passing for a compliance rate of 89%. Of the 317 failing inspections, 209 FSEs corrected the deficiencies and called for a re-inspection within seven (7) days. The

Page 5 of 22
remaining 108 FSEs did not take corrective action and thus were issued Notices of Violation (NOVs) of which 57 were for no GRS, 69 were for non-functioning GRS, 12 were for GRS needs pumping, and 67 were for missing manifests.
In response to SSOs, 55 FSE inspections were conducted with 24 failing. Within the seven day grace period, 12 FSEs corrected the deficiency. After the seven day grace period, 12 NOVs were issued. In addition, Water Authority Pretreatment personnel distributed FOG brochures to FSEs, single-family residences and apartment complexes upstream of the SSOs.
Additionally, the Water Authority’s Public Information Office advanced radio, print and television public outreach for the purpose of improving the Water Authority’s FOG Policy.
SSO Analyses
Permit Requirements The Permit requires a CMOM Plan with an emphasis on FOG Policy. The Plan goal is to reduce impacts on the sewer system caused by FOG and the Policy goal is to reduce SSOs. The FOG Policy states that the Pretreatment Program will investigate all SSOs related to large amounts of grease. The policy is to take enforcement actions for violations of FOG requirements with priority on FSEs causing repeat SSOs.
SSO Study Team To meet these requirements, the Water Authority created an SSO Study Team. The Team is comprised of:
1. Collection Section – Gravity Superintendent, Assistant Superintendent, Close Circuit Television (CCTV) Supervisor, and Research Analyst;
2. NPDES Pretreatment –Industrial Pretreatment Engineer and Pollution Prevention Specialist.
The Mission Statement for the Study Team is: The SSO Study Team will work inter-divisionally
to study, analyze and determine causes of previous SSOs to mitigate future SSOs in the
Collection System.
The Study Team procedure is:
1. Tabulate all 10-40s, 10-42s and 10-48s (see Table 1 for definitions). 2. Ensure all segments responsible for causing 10-42s and 10-48s are televised. 3. The Research Analyst will review and analyze all CCTV inspections to determine
causes (if possible) and document findings. 4. To conduct meetings with the SSO Study Team to review and analyze CCTV that
needs further investigation for resolution. 5. Recommend/implement and document mitigations (if possible) based on analysis. 6. Coordinate with NPDES Pretreatment concerning grease issues discovered during
analysis.

Page 6 of 22
Table 1 Sewer Trouble Definitions
Sewer Trouble Definitions
10-40 Sewer Backup A gravity line blockage that does not result in a spill, or in the vacuum system, a low vacuum (low vac) that causes a customer service disruption. Does not result in an SSO Reportable (10-42) or a Property Damage (10-48).
10-42 SSO Reportable An overflow of sewage from the system that may impact surface waters. These are reported to the EPA and other locally impacted stakeholders.
10-48 Property Damage An overflow of sewage from the system that results in damage to private property. These are not reportable under current definitions.
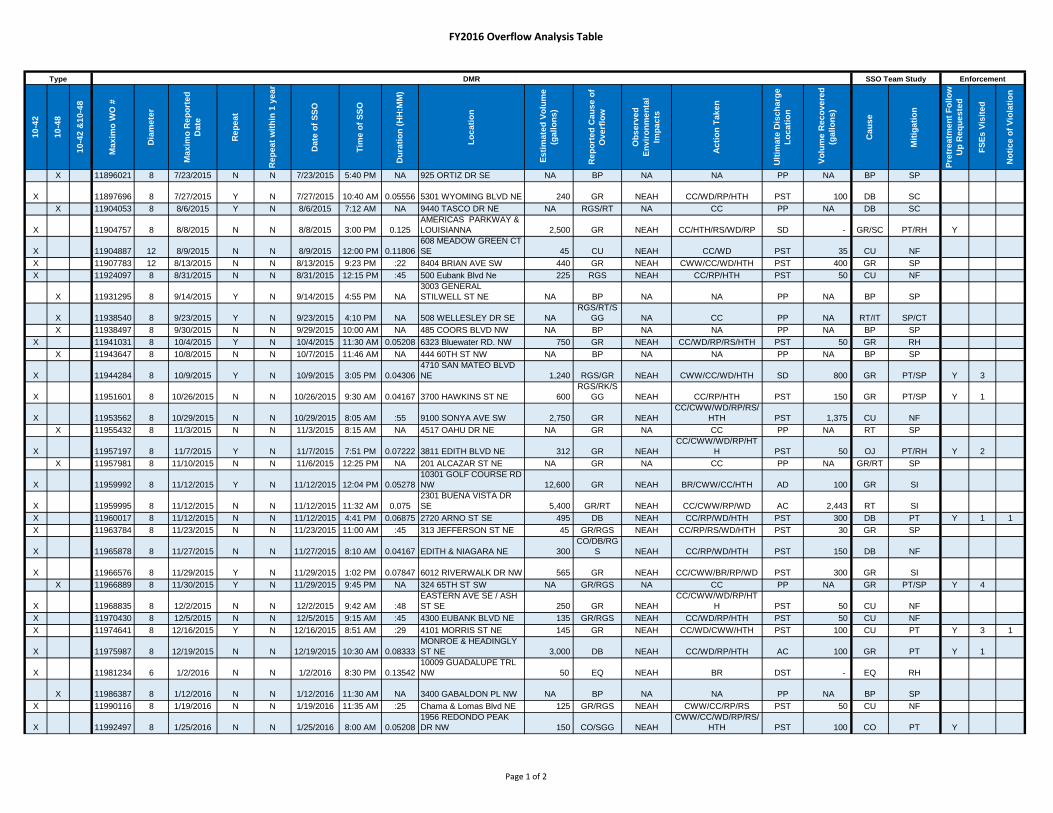
Appendix 1 identifies all 10-42s and 10-48s, and the overflows that resulted in both a 10-42 and a 10-48. When documenting the number of Sewer Troubles of different types, for example in Figure 1, the 10-42 item includes all overflows that may impact surface waters, including those that also had property damage; the 10-48 item includes overflows that only resulted in property damage. This prevents double-counting the number of overflow occurrences.
All 10-40s, 42s and -48s were CCTV inspected, although only 10-42s are “reportable”, i.e., required to be reported to the EPA, et al. All 10-42s and -48s were then examined by the Study Team and a Cause and Mitigation were determined.
Table 2 Types of Causes for SSOs
Cause(s) of SSO from DMR
Causes determined from
CCTV
CO - Construction DB - Debris SC - Surcharged CU-Cause Unknown RK-Rocks SL - Sag in Line
EQ - Equipment Failure
GR - Grease IT - Intruding Tap
SGG-Sand, grit or gravel RT - Roots MH - Manhole
LF - Line Failure RN - Rainfall OJ - Offset Joint
V - Vandalism RGS-Rags
RGR - Roots / Grease BP-Burped

Page 7 of 22
Causes & Mitigations The Cause(s) were selected from the above table that identifies SSO causes from the DMR and CCTV. The monthly SSO DMR has a specific list of Causes that are based on system observations made by an Operator or Supervisor at the site of an SSO. The CCTV data provided to the Study Team often results in a different, more refined Cause or Causes. Table 3 provides the causes determined by the Study team for FY2016. (Note: Percentages may not add up to 100%, as they are rounded to the nearest percent.)
Table 3 Summary of Causes from SSO Study
FY2016 10-42, 10-48 Causes Total % of Total
Burped 9 15% Construction 6 10% Cause Unknown 10 17% Debris 6 10% Equipment Failure 2 3% Grease 13 22% Grease/Roots 1 2% Grease/Surcharged 1 2% Manhole 1 2% Offset Joint 1 2% Roots 8 13% Roots/Intruding Tap 1 2% Sag in Line/Roots 1 2% Grand Total 60
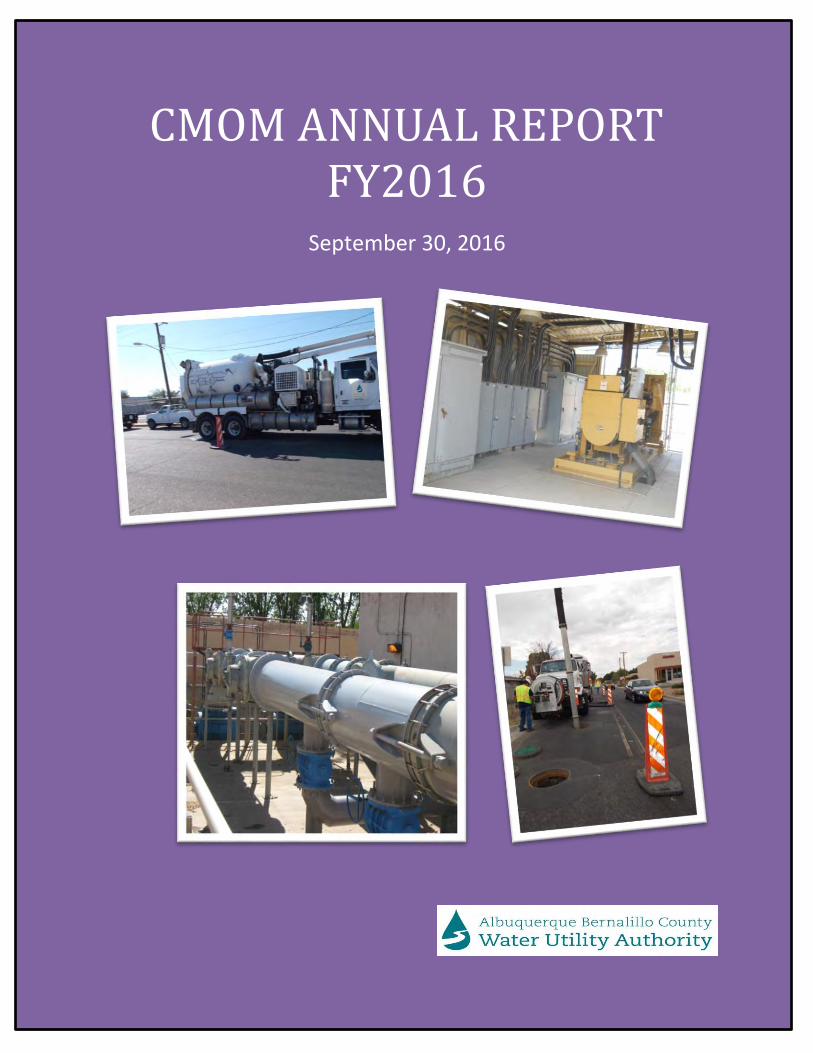
Mitigations are the steps that the Team identified to prevent a recurrence of an SSO, at least for the identified Cause. Specific Mitigations are very dependent on the conditions observed from the CCTV video and report. Table 4 provides a summary of the various Mitigations. The Mitigations are tracked through completion or implementation. (Note: Percentages may not add up to 100%, as they are rounded to the nearest percent.)
Page 8 of 22
Table 4 Summary Mitigations from SSO Study
FY2016 10-42, 10-48 Mitigations Total % of Total
No Follow Up Needed 16 27% Pretreatment Notified 4 7%
Pretreatment Notified/Rehab 3 5% Pretreatment Notified/Special
Instructions 3 5%
Rehab 7 12% Special Cleaning 2 3%
Short Interval 8 13% Short Interval/Special Instructions 1 2%
Special Instructions 13 22% Special Instructions/Cut Intruding Tap 1 2%
Special Instructions/Rehab 1 2% Special Instructions/Short Interval 1 2%
Grand Total 60
SSO Tabulation & Analysis Appendix 1 contains a list of every 10-42 and 10-48 event in FY2016. The table columns are grouped as follows:
1. The type, i.e., 10-42 or -48, is identified on the left. In two cases a single event was both a 10-42 and a 10-48, as indicated.
2. Next to the right are the data included in the monthly SSO DMRs. It is noted that a “Reported Cause” is listed. This is typically based on the observations of the Operator that reported the SSO.
3. Next to the right is data determined by the Study Team: a. Cause b. Mitigation c. If Pretreatment follow-up is necessary
4. To the far right are follow-ups by NPDES Pretreatment a. FSEs visited b. Notice of Violation issued

Page 9 of 22
Figure 1 shows the cumulative 10-42s by month for FY2012-16.
Figure 1 FY2016 Reportable SSOs
The SSO Rate is defined as 100 times the number of SSOs in a year divided by the miles of sewer in the system. The Water Authority system has a total of approximately 2,414 miles of line (p. 8 of the Self-Audit). The SSO rate is therefore 4.5, 2.8, 2.5, 2.3 and 1.7 for FY2012-16 respectively.

Page 10 of 22
Figure 2 shows the total sewer troubles, i.e. 10-40s, -42s, and -48s by year for FY2012-16. This graph does not include 10-48s due to “burps” which are not due to a blockage or other failure resulting in the overflow of sewage. Instead, air displaced during the Vactor jetting cleaning can under certain circumstances force out the water in the home fixture P-traps, e.g. toilets and sinks. These sometimes result in claims and are therefore included in the Property Damage totals for completeness and consistency. The burps for FY2012-16 have been 1, 0, 5, 5, and 9 respectively. The increase in burps is possibly due to more aggressive efforts to thoroughly clean the lines. If so, it is possible the increased burps are associated with the decrease of 10-42s over the same time. The burps are identified in Appendix 1.
Figure 2 Sewer Trouble Comparison
Volume Spilled and Recovered Via the OERP, the Water Authority has implemented a policy of capturing spills and documenting actions. Appendix 2 provides estimated spill volumes and volumes recovered for the 41 reported SSOs for FY2016. In FY2016, it is estimated that approximately 27% of the sewage spilled was captured. Of the 40,449 gallons estimated not to be recovered, none was identified as directly reaching the Rio Grande.

Page 11 of 22
Actions Implemented and On-Going Programs
General Below are gaps that were identified in the FY2015 CMOM Report and were closed in FY2016, or are on-going programs, or both. In addition to the commitments made in the FY2015 CMOM Report, the following additional actions were taken to expand the Water Authority’s ability to operate and maintain the system.
1. Purchase orders have been issued for two new Vactors which will be obtained and put into service in FY2017.
2. As follow up to a 10-40, two storm drain inlets in the 1500 block of San Lorenzo Ave. NW were found to be connected to the sanitary system. These laterals were plugged at the manhole and the City informed for their follow-up.
3. Public advertising addressed the need to dispose wipes in a trash can, not the sink or toilet. As a portion of the routine anti-grease advertising campaign, this was included in a radio spot, public restrooms, and bill stuffer.
4. Modified the Vactor cleaning SOP in response to lessons learned on a 10-48 caused by a rebar caught on a drop manhole fitting.
FOG Policy Implementation: FOG Policy is an on-going program. Long-term recommendations were made in the FY2014 CMOM Report. The following are on-going efforts to meet the long-term FY2014 recommendations:
1. Develop a link between the Linko FOG database utilized by NPDES Pretreatment and the Maximo work order system used by the Collection Section.
2. Began creating a FSE flier in Spanish. The Pretreatment Section, in conjunction with the Public Information Office, will continue to develop FSE fliers in languages other than English.
3. Satellite Community agreements require that FSE connections be coordinated with the Water Authority.
4. The Pretreatment Program continued issuing NOVs for not complying with the record keeping requirements of the SUO and FOG policy.
5. The Pretreatment Program continued issuing NOVs for not complying with the direct access provisions of the SUO and FOG policy.
Collection System Capital Implementation Program (CIP) Funding This is an on-going program. The following recommendation is made in the FY2013 CMOM Report: “Based on the need for additional funding, the Water Authority Board approved rate increases for three of the next five fiscal years beginning in FY2014. The rate increases assist the Water Authority in increasing CIP funding for the Collection System.”
The Water Authority has approved and implemented 5% revenue rate adjustments in FY2014, FY2015 and FY2016. Recent and future rate increases is allowing the Water Authority to increase its capital asset renewal program by $5-million per year. The current objective is to
Page 12 of 22
increase the renewal program spending level to $76-million per year ($2010 dollars), which is approximately double what was being spent prior to 2015.
This completes this recommendation.
Overflow Emergency Response Plan (OERP) This is an on-going program to update the OERP as required. In FY2014, the following modifications were made to the OERP:
1. Page 5: Made modifications to who to call if the sewer problem is in a private system and code enforcement must be contacted.
a. Added Kevin Daggett as a secondary contact regarding private spills into City streets.
b. Similarly added our other MS4 contacts to be alerted if a private spill impacts their facility.
c. Agreed with City Planning to simplify to a single number for City Code Enforcement. The City will be responsible to route the information to the correct person within the City.
d. Added a number and title for the Village of Los Ranchos. e. Changed a number for NMED.
2. Page 6: Modified process on response to severe pipe conditions. 3. Page 8: Updated telephone number. 4. Page 11: Updated contact information for MRGCD. 5. All pages: Added “Authority” to our name.
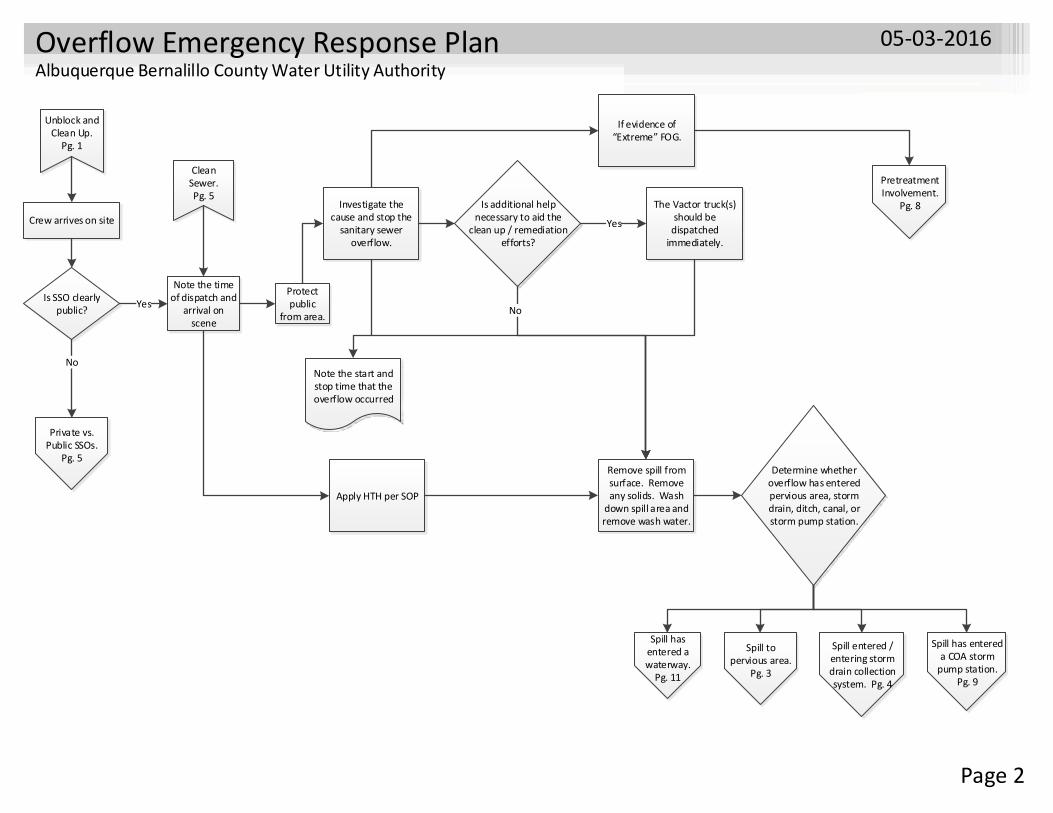
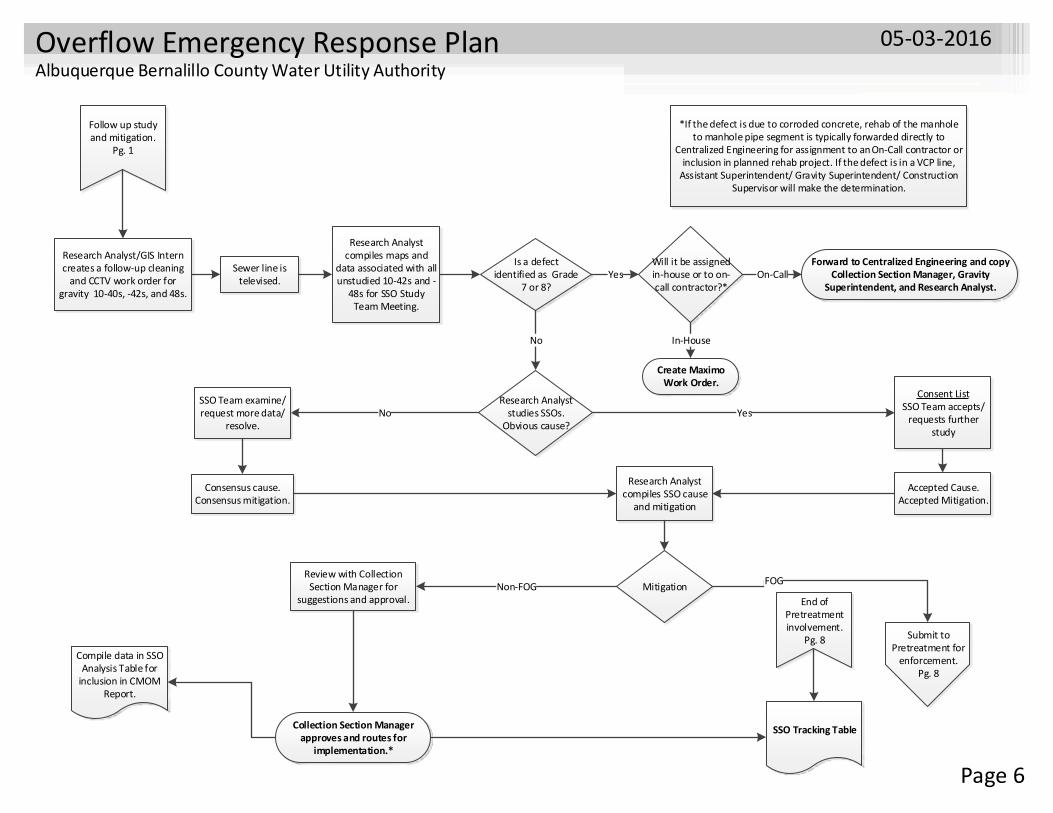
The Collection Section is the “owner” of the OERP. The Collection Section creates the components of the OERP, routes for internal review (specifically including the Compliance Division), and the completed portions are approved for posting to SharePoint by the Collection Section Manager. Appendix 3 provides the OERP which was in effect at the end of FY2016.
In accordance with the OERP, the Water Authority coordinated with the appropriate MS4 Permittees on two spills that occurred on 11/12/2015 and 2/9/2016. The spill at 12:04 p.m. on 11/12/2015 reached the Calabacillas Arroyo which is an AMAFCA facility. AMAFCA assisted by installing a dirt berm for containing the spill until it could be treated with HTH and removed as much as possible. The 2/19/2016 spill reached a storm drain and over a mile downstream, reached the Piedras Marcadas Dam which is an AMAFCA facility. AMAFCA was contacted and the following information was provided: the flow was being contained on a concrete channel by a sill installed for the purpose of containing contaminated flow prior to reaching a pervious area; the proper route and gate access were identified for Vactors to drive to this location. Per the OERP, wash water with HTH was applied to the inlet the spill entered and was removed at the Piedras Marcadas Dam sill.
Force Main Inspection Program This is an on-going program in which the alignment is annually inspected for all force mains and valves found in field are compared to those in the GIS mapping and this information is stored in Maximo. In FY16, a valve connecting the Lift Station 24 force mains was found. The need to locate this critical valve was identified as a result of the FY15 inspections.

Page 13 of 22
Closed Circuit Television (CCTV) This is an on-going program. The following recommendation is made in the FY2013 CMOM Report: “CCTV inspections of the collection system as follows: 1) Small diameter main lines less than 15”: In four of five years, televise approximately 5% per year of the small diameter system. Televise high risk lines based on current Asset Management Plan and subsequent in-house analysis. 2) Large diameter lines 15” and larger: Every fifth year, televise as much as possible acknowledging access limitations of the unlined concrete lines 15” and larger. Anticipated schedule: 3) FY2014-17: 5% of the small diameter each year. 2) FY18: Large diameter unlined concrete pipe.”
The CCTV program will continue. Anticipated schedule:
1. FY17: 5% of the small diameter. 2. FY18: Large diameter unlined concrete pipe. 3. FY19: 5% of the small diameter. (Any small diameter inspections accomplished in FY18
will be allocated to meeting the FY19 goal.) 4. FY20: 5% of the small diameter.
The FY2016 portion of this recommendation is complete.
It is currently estimated that that the system includes 1988 miles of small diameter gravity pipe. In FY2016, approximately 99.4 miles of small diameter line was televised, i.e. 5.0%.
Cleaning Program Goal This is an on-going program. The following recommendation is made in the FY2013 CMOM Report: “The Water Authority will establish and monitor a goal of cleaning all gravity small diameter lines every ten years. (This will be accomplished through the existing Sub-Basin program.) The Water Authority will continue the program of high-frequency maintenance of known problem locations within the system. (This will be accomplished through the existing Short Interval program.) The frequency of Short Interval cleaning will vary in accordance with system performance and risk factors, maintenance history, and the latest maintenance findings.”
The FY2016 portion of this recommendation is complete. In FY2016, the Water Authority cleaned approximately 284.5 miles under the Sub-Basin program. This is equal to approximately 14.3% of the small diameter system which exceeds the 10% pace implicit in cleaning every ten years. Likewise, the Short Interval cleaning program was maintained with approximately an additional 230.1 miles cleaned. The total length of all types of small diameter cleaning, exclusive of interceptors, was approximately 584.3 miles.
The cleaning program continues with the same goals.
Root Foaming The following recommendation is made in the FY2013 CMOM Report: “Starting in FY15, implement a 3-year pilot program. Root foam selected lines that meet the root infested and / or inaccessibility criteria. Compare effectiveness to mechanical cleaning currently practiced and provide recommendation.”
The Root Foaming Pilot Project is a three year program. The FY15 and FY16 groups were foamed in June 2015 and March 2016 respectively. Per vendor recommendations, the FY15

Page 14 of 22
group will be retreated approximately June 2017. This will complete the foaming application of the Pilot Project. For both of the treated groups, control groups (equivalent to the treated lines as measured by PACP evaluation) were selected. The treated and control groups will be compared over time to determine if foaming is advantageous. Interim inspection of the FY15 treated and control group was inconclusive.
FOG Buster The following recommendation is made in the FY2013 CMOM Report: “Starting in FY15, implement a 3-year pilot program. Equip two units with FOG Buster equipment and utilize to clean lines known to be impacted by FOG. Compare effectiveness to mechanical cleaning currently practiced and provide recommendation.”
Per this recommendation, the equipment was purchased and installed. One high FOG segment was selected and cleaned utilizing FOG Buster in the downstream portion while the upstream portion was cleaned using water. On March 8, 2016, the line was re-CCTVed and the results were inconclusive. The recommendation at this time is to focus on the foaming efforts and only consider FOG Buster for unusual conditions that should first involve FSE enforcement.
This completes this recommendation.
Generator Plan The following recommendation is made in the FY2015 CMOM Report: “in FY2016, a test will be run simulating a simultaneous power failure at two vacuum stations.” This recommendation follows the completion of the FY2014 CMOM recommendation to develop an SOP for portable generators.
The test was run on March 31, 2016 simulating the simultaneous failure of power at Vacuum Stations 67 and 69. Improvements to the SOP were identified and implemented through the process of preparing for, and actually performing the test.
In FY2017, it is recommended to run a test at two vacuum stations in which power is actually cut and the portable generators are hooked up.
Shunt Trip Testing The following recommendation is made in the FY2015 CMOM Report: “The design is complete and construction is under contract. In FY2016, Lift Stations 20 and 24 will be tested utilizing the shunt trips, simulating a power failure.” This recommendation follows the completion of the FY2014 CMOM recommendation to “During FY2015, design shunt trips, or equivalent, for Lift Stations 20 and 24.”
The construction is complete and the recommended testing was performed. Regular testing will be performed as part of the routine O&M. Maximo recurring Work Orders have been created to assure this is done.
This completes this recommendation.

Page 15 of 22
Manhole Base Sketches & Follow-Up The following recommendation is made in the FY2015 CMOM Report: “In FY2016, require manhole base sketches from cleaning and CCTV crews to identify need for channelizing. Follow-up with construction as appropriate.”
A form was created for use by cleaning and CCTV crews. In addition to addressing manhole hydraulics, the form requires information on flow direction vs. GIS mapping, on the cleaning nozzle(s) utilized, and on the use of a chute. During FY2016, the hydraulics were improved at 23 manhole bases after being identified by a field crew. This form and its requirements have been integrated as a part of the routine O&M.
This completes this recommendation.
Written SOPs The following recommendation is made in the FY2015 CMOM Report: “In FY2016, develop and implement SOPs for routine cleaning, for responding to sewer blockages, and for completion of overflow response forms. This is in addition to the “Use of Portable Generators at Sanitary Lift Stations and Vacuum Stations” and the SOP for Shunt Trip Testing, both of which are discussed above.”
This was accomplished and SOPs were posted to SharePoint. The Vactor Cleaning SOP addresses Vactor operation for routine cleaning and responding to blockages. The SOP for Response and Documentation of a Sanitary Sewer Overflow (10-42) provides procedures for responding to an SSO and in the completion and correction of the various reporting forms. The OERP is incorporated as an appendix in this SOP. This SOP requires a second Vactor to respond to 10-42s during normal work hours when multiple units are in operation. In FY2016, SOPs were developed and posted to SharePoint for a number of additional items including: Setup and Installation of OdaLog® Low Range Sampling System (LRSS) for Biofilter and Scrubber Testing; Creating Follow Up Work Order Packages – Cleaning and CCTV; Flow Calculation Based on Winter Water Average; Engineering Intern Responsibilities for the Collection Section Monthly Report; Setup and Installation of pH Module with ISCO Sampler; Use of Portable Generators at Sanitary Lift Stations and Vacuum Stations.
SOPs will continue to be created and updated and posted to SharePoint. This completes this recommendation.
Odor Complaints The Water Authority has committed to tabulate odor complaints by month. The EPA considers odor and corrosion control an issue in collection system O&M, as indicated by the Hydrogen Sulfide Monitoring and Control (HSMC) section in the CMOM Program Self-Assessment standard template from the EPA website.
Odor control is a major issue in warm-weather systems such as Albuquerque’s. A high correlation has been demonstrated between odor complaints and the sewage temperature (analysis of FY11 & FY12 temperature vs. odor complaint data, r = 0.89, p < 0.02). Odor complaints are also known as a 10-52. The following graphic shows the odor complaints received by the Water Authority in FY2012 through FY2016. All odor complaints received are

Page 16 of 22
included in this graphic; however, study has indicated that approximately ¾ of the complaints received originate in the private and not the public system.
Figure 3 Odor Complaints

Page 17 of 22
The following flow chart describes the process followed by the Water Authority in response to an odor complaint. This specific process in the immediate response and the follow-up to odor complaints is due to the importance placed on customer service. Also, the Water Authority has found that some odor complaints are due to a blockage prior to an overflow; therefore, a quick response can prevent an SSO.
Figure 4 Odor Complaint Flow Chart

Page 18 of 22
Identified Gaps in the Water Authority Processes with Recommendation to Close In the process of continuous improvement, the Water Authority is committed to identifying and closing gaps. As discussed above, most of these recommendations are now considered On-Going programs.
Prohibited Discharges, i.e., SSOs The Water Authority acknowledges that prohibited discharges have occurred and that all discharges from the sanitary sewer system are prohibited.
Recommendation: The Water Authority will annually examine sewer system performance, set specific steps for decreasing SSOs and mitigating their impacts, and has a program of continuous improvement.

Page 19 of 22
Appendices

Page 20 of 22
Appendix 1 Sanitary Sewer Overflow Analysis Table
FY2016 Overflow Analysis Table1
0-4
2
10
-48
10
-42
&1
0-4
8
Ma
xim
o W
O #
Dia
me
ter
Ma
xim
o R
ep
ort
ed
Da
te
Re
pe
at
Re
pe
at
wit
hin
1 y
ea
r
Da
te o
f S
SO
Tim
e o
f S
SO
Du
rati
on
(H
H:M
M)
Lo
ca
tio
n
Es
tim
ate
d V
olu
me
(ga
llo
ns
)
Re
po
rte
d C
au
se
of
Ov
erf
low
Ob
se
rve
d
En
vir
on
me
nta
l
Imp
ac
ts
Ac
tio
n T
ak
en
Ult
ima
te D
isc
ha
rge
Lo
ca
tio
n
Vo
lum
e R
ec
ov
ere
d
(ga
llo
ns
)
Ca
us
e
Mit
iga
tio
n
Pre
tre
atm
en
t F
oll
ow
Up
Re
qu
es
ted
FS
Es
Vis
ite
d
No
tic
e o
f V
iola
tio
n
X 11896021 8 7/23/2015 N N 7/23/2015 5:40 PM NA 925 ORTIZ DR SE NA BP NA NA PP NA BP SP
X 11897696 8 7/27/2015 Y N 7/27/2015 10:40 AM 0.05556 5301 WYOMING BLVD NE 240 GR NEAH CC/WD/RP/HTH PST 100 DB SC
X 11904053 8 8/6/2015 Y N 8/6/2015 7:12 AM NA 9440 TASCO DR NE NA RGS/RT NA CC PP NA DB SC
X 11904757 8 8/8/2015 N N 8/8/2015 3:00 PM 0.125
AMERICAS PARKWAY &
LOUISIANNA 2,500 GR NEAH CC/HTH/RS/WD/RP SD - GR/SC PT/RH Y
X 11904887 12 8/9/2015 N N 8/9/2015 12:00 PM 0.11806
608 MEADOW GREEN CT
SE 45 CU NEAH CC/WD PST 35 CU NF
X 11907783 12 8/13/2015 N N 8/13/2015 9:23 PM :22 8404 BRIAN AVE SW 440 GR NEAH CWW/CC/WD/HTH PST 400 GR SP
X 11924097 8 8/31/2015 N N 8/31/2015 12:15 PM :45 500 Eubank Blvd Ne 225 RGS NEAH CC/RP/HTH PST 50 CU NF
X 11931295 8 9/14/2015 Y N 9/14/2015 4:55 PM NA
3003 GENERAL
STILWELL ST NE NA BP NA NA PP NA BP SP
X 11938540 8 9/23/2015 Y N 9/23/2015 4:10 PM NA 508 WELLESLEY DR SE NA
RGS/RT/S
GG NA CC PP NA RT/IT SP/CT
X 11938497 8 9/30/2015 N N 9/29/2015 10:00 AM NA 485 COORS BLVD NW NA BP NA NA PP NA BP SP
X 11941031 8 10/4/2015 Y N 10/4/2015 11:30 AM 0.05208 6323 Bluewater RD. NW 750 GR NEAH CC/WD/RP/RS/HTH PST 50 GR RH
X 11943647 8 10/8/2015 N N 10/7/2015 11:46 AM NA 444 60TH ST NW NA BP NA NA PP NA BP SP
X 11944284 8 10/9/2015 Y N 10/9/2015 3:05 PM 0.04306
4710 SAN MATEO BLVD
NE 1,240 RGS/GR NEAH CWW/CC/WD/HTH SD 800 GR PT/SP Y 3
X 11951601 8 10/26/2015 N N 10/26/2015 9:30 AM 0.04167 3700 HAWKINS ST NE 600
RGS/RK/S
GG NEAH CC/RP/HTH PST 150 GR PT/SP Y 1
X 11953562 8 10/29/2015 N N 10/29/2015 8:05 AM :55 9100 SONYA AVE SW 2,750 GR NEAH
CC/CWW/WD/RP/RS/
HTH PST 1,375 CU NF
X 11955432 8 11/3/2015 N N 11/3/2015 8:15 AM NA 4517 OAHU DR NE NA GR NA CC PP NA RT SP
X 11957197 8 11/7/2015 Y N 11/7/2015 7:51 PM 0.07222 3811 EDITH BLVD NE 312 GR NEAH
CC/CWW/WD/RP/HT
H PST 50 OJ PT/RH Y 2
X 11957981 8 11/10/2015 N N 11/6/2015 12:25 PM NA 201 ALCAZAR ST NE NA GR NA CC PP NA GR/RT SP
X 11959992 8 11/12/2015 Y N 11/12/2015 12:04 PM 0.05278
10301 GOLF COURSE RD
NW 12,600 GR NEAH BR/CWW/CC/HTH AD 100 GR SI
X 11959995 8 11/12/2015 N N 11/12/2015 11:32 AM 0.075
2301 BUENA VISTA DR
SE 5,400 GR/RT NEAH CC/CWW/RP/WD AC 2,443 RT SI
X 11960017 8 11/12/2015 N N 11/12/2015 4:41 PM 0.06875 2720 ARNO ST SE 495 DB NEAH CC/RP/WD/HTH PST 300 DB PT Y 1 1
X 11963784 8 11/23/2015 N N 11/23/2015 11:00 AM :45 313 JEFFERSON ST NE 45 GR/RGS NEAH CC/RP/RS/WD/HTH PST 30 GR SP
X 11965878 8 11/27/2015 N N 11/27/2015 8:10 AM 0.04167 EDITH & NIAGARA NE 300
CO/DB/RG
S NEAH CC/RP/WD/HTH PST 150 DB NF
X 11966576 8 11/29/2015 Y N 11/29/2015 1:02 PM 0.07847 6012 RIVERWALK DR NW 565 GR NEAH CC/CWW/BR/RP/WD PST 300 GR SI
X 11966889 8 11/30/2015 Y N 11/29/2015 9:45 PM NA 324 65TH ST SW NA GR/RGS NA CC PP NA GR PT/SP Y 4
X 11968835 8 12/2/2015 N N 12/2/2015 9:42 AM :48
EASTERN AVE SE / ASH
ST SE 250 GR NEAH
CC/CWW/WD/RP/HT
H PST 50 CU NF
X 11970430 8 12/5/2015 N N 12/5/2015 9:15 AM :45 4300 EUBANK BLVD NE 135 GR/RGS NEAH CC/WD/RP/HTH PST 50 CU NF
X 11974641 8 12/16/2015 Y N 12/16/2015 8:51 AM :29 4101 MORRIS ST NE 145 GR NEAH CC/WD/CWW/HTH PST 100 CU PT Y 3 1
X 11975987 8 12/19/2015 N N 12/19/2015 10:30 AM 0.08333
MONROE & HEADINGLY
ST NE 3,000 DB NEAH CC/WD/RP/HTH AC 100 GR PT Y 1
X 11981234 6 1/2/2016 N N 1/2/2016 8:30 PM 0.13542
10009 GUADALUPE TRL
NW 50 EQ NEAH BR DST - EQ RH
X 11986387 8 1/12/2016 N N 1/12/2016 11:30 AM NA 3400 GABALDON PL NW NA BP NA NA PP NA BP SP
X 11990116 8 1/19/2016 N N 1/19/2016 11:35 AM :25 Chama & Lomas Blvd NE 125 GR/RGS NEAH CWW/CC/RP/RS PST 50 CU NF
X 11992497 8 1/25/2016 N N 1/25/2016 8:00 AM 0.05208
1956 REDONDO PEAK
DR NW 150 CO/SGG NEAH
CWW/CC/WD/RP/RS/
HTH PST 100 CO PT Y
Type DMR SSO Team Study Enforcement
Page 1 of 2

FY2016 Overflow Analysis Table1
0-4
2
10
-48
10
-42
&1
0-4
8
Ma
xim
o W
O #
Dia
me
ter
Ma
xim
o R
ep
ort
ed
Da
te
Re
pe
at
Re
pe
at
wit
hin
1 y
ea
r
Da
te o
f S
SO
Tim
e o
f S
SO
Du
rati
on
(H
H:M
M)
Lo
ca
tio
n
Es
tim
ate
d V
olu
me
(ga
llo
ns
)
Re
po
rte
d C
au
se
of
Ov
erf
low
Ob
se
rve
d
En
vir
on
me
nta
l
Imp
ac
ts
Ac
tio
n T
ak
en
Ult
ima
te D
isc
ha
rge
Lo
ca
tio
n
Vo
lum
e R
ec
ov
ere
d
(ga
llo
ns
)
Ca
us
e
Mit
iga
tio
n
Pre
tre
atm
en
t F
oll
ow
Up
Re
qu
es
ted
FS
Es
Vis
ite
d
No
tic
e o
f V
iola
tio
n
Type DMR SSO Team Study Enforcement
X 11991807 8 2/1/2016 Y Y 2/1/2016 3:00 PM NA
3011 COMMERCIAL ST
NE NA BP NA NA PP NA BP NF
X 11997528 8 2/2/2016 N N 2/2/2016 11:15 AM NA 1327 AMADO RD NW NA BP NA NA PP NA BP SP
X 12001161 8 2/9/2016 Y N 2/9/2016 8:58 PM :42
Juan Tabo Blvd. NE &
Candelaria Rd. 210 GR/RGS NEAH CC/WD/RS/HTH PST 50 RT SP
X 12001436 8 2/10/2016 N N 2/9/2016 1:30 PM NA 1122 MARIANO TRL SW NA BP NA NA PP NA BP NF
X 12004088 2 2/12/2016 N N 2/12/2016 5:15 PM :50
5550 SAN ANTONIO DR
NE 50 LF NEAH CWW/HTH/RS/WD PST 20 CO RH
X 12004143 8 2/13/2016 N N 2/13/2016 10:50 AM 0.06944 6558 ANCIENTS RD NW 500 GR NEAH CC/HTH PST - CU NF
X 12004524 8 2/15/2016 N N 2/15/2016 3:47 PM 0.06458
San Mateo Blvd /
Marquette Ave NE 9,300 GR/RGS NEAH
CWW/CC/WD/RP/HT
H SD 200 CU NF
X 12007615 8 2/19/2016 N N 2/19/2016 6:58 AM 0.04236
PARADISE & ASBURY LN
NW 3,050 RGS NEAH
CWW/CC/WD/RP/RS/
HTH AC 3,050 GR SP
X 12011212 8 2/26/2016 N N 2/25/2016 11:40 AM NA 10301 CORNELIA CT SW NA BP NA NA PP NA BP SP
X 12016178 8 3/6/2016 N N 3/6/2016 1:35 PM 0.07292
San Pedro and Topke Dr.
NE 525 GR NEAH
CC/CWW/WD/RP/RS/
HTH PST 525 GR SP/SI
X 12020935 8 3/15/2016 N N 3/15/2016 6:50 AM 0.07986 8400 OSUNA RD NE 575 CO/SGG NEAH CC/CWW/RP/HTH PST 275 CO NF
X 12020980 8 3/15/2016 N N 3/15/2016 12:41 PM NA 8401 OSUNA RD NE NA CO/SGG NEAH CC PP NA CO NF
X 12029021 8 4/2/2016 N N 4/2/2016 9:10 AM 0.10764
1213 MICHAEL HUGHES
DR NE 850 RGS/SGG NEAH
CC/CWW/WD/RS/HT
H PST 400 MH RH
X 12030625 8 4/6/2016 N N 4/6/2016 4:15 PM NA
9800 GREENBRIER RD
NE NA RT NEAH CC PP NA RT SI
X 12030912 30 4/7/2016 N N 4/7/2016 9:10 AM :30 3600 CUTLER AV NE 750 GR/RGS NEAH CC/CWW/RP/RS/HTH DST 400 DB SI
X 12032483 8 4/8/2016 N N 4/8/2016 7:00 PM NA 10412 DELICADO PL NE NA GR/RGS NA CC PP NA RT SI
X 12032655 8 4/10/2016 N N 4/10/2016 1:14 PM 0.07361 12700 Granite Ave. NE 530 LF NEAH CC/HTH SD 75 CO RH
X 12037415 8 4/15/2016 N N 4/15/2016 10:30 AM NA
429 RHODE ISLAND ST
NE NA GR NEAH CC PP NA GR SI Y
X 12039132 10 4/21/2016 N N 4/21/2016 8:35 AM :45
Sunningdale Ave & Coe Dr
NE 225 RGS/RT NEAH CWW/CC/RP/HTH PST 100 SL/RT SP/RH
X 12043345 8 4/29/2016 N N 4/29/2016 7:14 AM NA 301 ROMA AVE NE NA GR NA CC PP NA DB RH
X 12050092 8 5/10/2016 N N 5/10/2016 10:58 AM :47
1329 CUATRO CERROS
TRL SE 5 RGS/RT NEAH CWW/CC/WD PST - RT SI/SP
X 12050422 5/11/2016 Y Y 5/10/2016 11:41 AM 0.06528
LYONS & BLUE FEATHER
NW 2,350 EQ NEAH CWW/WD/RP/HTH O 2,250 EQ NF
X 12052998 8 5/14/2016 Y N 5/14/2016 11:35 AM 0.06944 7408 DELLWOOD RD NE 200 RGS/RT NEAH CC/WD/RP/HTH PST 75 RT SI
X 12053300 8 5/15/2016 N N 5/15/2016 9:10 AM 0.07639 10801 ACADEMY RD NE 200 RGS NEAH
CC/CWW/WD/RP/HT
H YD 70 CU NF
X 12057820 8 5/21/2016 Y N 5/21/2016 12:27 PM 0.04375 1715 2ND ST SW 315 GR NEAH CC/WD/RP/HTH PST 50 GR PT/RH Y 1 1
X 12058503 8 5/23/2016 Y Y 5/22/2016 9:07 PM 0.07847 13329 ORIENTE AVE NE 2,825 RGS/GR NEAH CC/CWW/WD/HTH SD 500 RT RH
X 12073253 15 6/10/2016 N N 6/8/2016 12:45 PM :45 Alexander & Carmony NE 500 CO NEAH CWW/WD/HTH SD 50 CO NF
Page 2 of 2

Page 21 of 22
Appendix 2 Sanitary Sewer Overflow Volume Captured Analysis Table

Maximo WO
# Date of SSO Location
Volume
(gallons)
Volume
Recovered
(gallons)
Volume Not
Recovered
%
Recovered
11897696 7/27/2015 5301 WYOMING BLVD NE 240 100 140 42%
11904757 8/8/2015 AMERICAS PARKWAY & LOUISIANNA 2,500 0 2,500 0%
11904887 8/9/2015 608 MEADOW GREEN CT SE 45 35 10 78%
11907783 8/13/2015 8404 BRIAN AVE SW 440 400 40 91%
11924097 8/31/2015 500 Eubank Blvd Ne 225 50 175 22%
11941031 10/4/2015 6323 Bluewater RD. NW 750 50 700 7%
11944284 10/9/2015 4710 SAN MATEO BLVD NE 1,240 800 440 65%
11951601 10/26/2015 3700 HAWKINS ST NE 600 150 450 25%
11953562 10/29/2015 9100 SONYA AVE SW 2,750 1,375 1,375 50%
11957197 11/7/2015 3811 EDITH BLVD NE 312 50 262 16%
11959992 11/12/2015 10301 GOLF COURSE RD NW 12,600 100 12,500 1%
11959995 11/12/2015 2301 BUENA VISTA DR SE 5,400 2,443 2,957 45%
11960017 11/12/2015 2720 ARNO ST SE 495 300 195 61%
11963784 11/23/2015 313 JEFFERSON ST NE 45 30 15 67%
11965878 11/27/2015 EDITH & NIAGARA NE 300 150 150 50%
11966576 11/29/2015 6012 RIVERWALK DR NW 565 300 265 53%
11968835 12/2/2015 EASTERN AVE SE / ASH ST SE 250 50 200 20%
11970430 12/5/2015 4300 EUBANK BLVD NE 135 50 85 37%
11974641 12/16/2015 4101 MORRIS ST NE 145 100 45 69%
11975987 12/19/2015 MONROE & HEADINGLY ST NE 3,000 100 2,900 3%
11981234 1/2/2016 10009 GUADALUPE TRL NW 50 0 50 0%
11990116 1/19/2016 Chama & Lomas Blvd NE 125 50 75 40%
11992497 1/25/2016 1956 REDONDO PEAK DR NW 150 100 50 67%
12001161 2/9/2016 Juan Tabo Blvd. NE & Candelaria Rd. 210 50 160 24%
12004088 2/12/2016 5550 SAN ANTONIO DR NE 50 20 30 40%
12004143 2/13/2016 6558 ANCIENTS RD NW 500 0 500 0%
12004524 2/15/2016 San Mateo Blvd / Marquette Ave NE 9,300 200 9,100 2%
12007615 2/19/2016 PARADISE & ASBURY LN NW 3,050 3,050 0 100%
12016178 3/6/2016 San Pedro and Topke Dr. NE 525 525 0 100%
12020935 3/15/2016 8400 OSUNA RD NE 575 275 300 48%
12029021 4/2/2016 1213 MICHAEL HUGHES DR NE 850 400 450 47%
12030912 4/7/2016 3600 CUTLER AV NE 750 400 350 53%
12032655 4/10/2016 12700 Granite Ave. NE 530 75 455 14%
12039132 4/21/2016 Sunningdale Ave & Coe Dr NE 225 100 125 44%
12050092 5/10/2016 1329 CUATRO CERROS TRL SE 5 0 5 0%
12050422 5/10/2016 LYONS & BLUE FEATHER NW 2,350 2,250 100 96%
12052998 5/14/2016 7408 DELLWOOD RD NE 200 75 125 38%
12053300 5/15/2016 10801 ACADEMY RD NE 200 70 130 35%
12057820 5/21/2016 1715 2ND ST SW 315 50 265 16%
12058503 5/22/2016 13329 ORIENTE AVE NE 2,825 500 2,325 18%
12073253 6/8/2016 Alexander & Carmony NE 500 50 450 10%
Grand Total 55,322 14,873 40,449 27%
FY2016 10-42 SPILL VOLUME AND VOLUME RECOVERED
Estimated
Page 22 of 22
Appendix 3 Overflow Emergency Response Plan (OERP)

05-03-2016
Page 1
Overflow Emergency Response PlanAlbuquerque Bernalillo County Water Utility Authority
Customer calls dispatch with issue
Dispatch collects data and creates
a Service Request; Task
elevated to supervisor
Supervisor creates a work order and sends crew to
location. Status of work order is updated to
DISPATCHED
Unblock and Clean up.
Pg. 2
Supervisor reviews work order for quality assurance.
Status of work order is updated to COMPLETE AND
READY FOR REVIEW
Planner / Scheduler does quality control and updates
status of work order to COMPLETE
Follow up study and mitigation.
Pg. 6
Notification process.
Pg. 7
Collection Response
Alert Media. Pg. 10
Applies only to Collection System sewer problems.
Private vs. public SSO.
Pg. 5
Tech confirms asset and fills out required
information in the work order
Spill to pervious areas.
Pg. 3
Spill entered / entering storm drain collection system. Pg. 4
Spill has entered storm pump station.
Pg. 9
Spill entering Waterway.
Pg. 11
05-03-2016
Page 2
Overflow Emergency Response PlanAlbuquerque Bernalillo County Water Utility Authority
Unblock and Clean Up.
Pg. 1
Note the time of dispatch and
arrival on scene
Investigate the cause and stop the
sanitary sewer overflow.
Note the start and stop time that the overflow occurred
Is additional help necessary to aid the
clean up / remediation efforts?
The Vactor truck(s) should be
dispatched immediately.
Yes
Determine whether overflow has entered pervious area, storm drain, ditch, canal, or storm pump station.
Spill entered / entering storm drain collection system. Pg. 4
Spill has entered a COA storm
pump station. Pg. 9
Crew arrives on site
If evidence of “Extreme” FOG.
Pretreatment Involvement.
Pg. 8
Apply HTH per SOP
Remove spill from surface. Remove any solids. Wash
down spill area and remove wash water.
Is SSO clearly public?
Yes
Private vs. Public SSOs.
Pg. 5
No
No
Clean Sewer. Pg. 5
Spill to pervious area.
Pg. 3
Protect public
from area.
Spill has entered a waterway.
Pg. 11

05-03-2016
Page 3
Overflow Emergency Response PlanAlbuquerque Bernalillo County Water Utility Authority
Immediately begin collecting spill with
Vactor truck.
When SSO stopped, apply washwater & HTH to spill area &
allow to flow to pervious area and
remove washwater.
Supervisor or Superintendent to determine if public access to pervious area is a concern.
Supervisor or Superintendent to
determine / recommend remediation.
Consult with Chief Engineer if required.
Yes
Allow to dry.No
Implement
Remediation Complete.
Pg. 1
Spill to pervious
area. Pg. 2

05-03-2016
Page 4
Overflow Emergency Response PlanAlbuquerque Bernalillo County Water Utility Authority
Spill entered / entering storm drain collection system. Pg. 2
Determine how far downstream the spill has reached.
SSO Reaches COA storm drain.
Wash water to street and inlet.
Add wash water & remove at downstream manhole.
Remove immediately if rain is imminent. If not, remove
next normal work day.
Remediation Complete.
Pg. 1
Assist in clean up as requested.
If possible, position 2nd Vactor to
remove spill prior to reaching inlet.
Note: Process shown is for typical spills. Spills that are not appropriate for Vactor removal may require a joint response with the impacted MS4 Permittee in which the spill is captured, treated, and determined appropriate for release.

05-03-2016
Page 5
Overflow Emergency Response PlanAlbuquerque Bernalillo County Water Utility Authority
Ask Supervisor. Clearly Public? Yes
Clearly Private?
No
Elevate to Superintendent.
NoResolve if
Public?Yes
Inform Public NoYes
Do not clean sewer
Depending on jurisdiction, follow up with City of
Albuquerque, Bernalillo County, Village of Las Ranchos or NMED
(See table for contacts)
City of Albuquerque Code Enforcement(505) 924-3450
Note: The identified code enforcement contacts will also be utilized to report private service lines issues resulting in sewage spills to private or public property.
Clean Sewer. Pg. 2
Remediation Complete.
Pg. 1
Private vs. Public SSOs.
Pg. 2
Bernalillo CountyNatural Resource Services
Review & Permitting Section(505) 314-0375
NMEDLiquid Waste Program (505) 222-9500
(505)827-1840
Public and private lines may be differentiated on the Water Authority GIS Mapping.
Private lines that may be confused with Water Authority mains should be identified to the Collection Section Research Analyst for inclusion in the “Waste Water Non-Authority” layer.
For non-Authority spills in the City limits, in addition to calling the appropriate portion of COA
Code Enforcement, also alert: Kevin Daggett- (505) 803-8058
For non-Authority spills in the County, in addition to calling Natural Resources Services, contact Hugh
O’Neall at 934-2704. For any non-Authority that impact an AMAFCA or NMDOT facility, alert the
appropriate contact listed on page 4.
Village of Los Ranchos(505) 344-6582
Code Enforcement office
05-03-2016
Page 6
Overflow Emergency Response PlanAlbuquerque Bernalillo County Water Utility Authority
Follow up study and mitigation.
Pg. 1
Research Analyst/GIS Intern creates a follow-up cleaning
and CCTV work order for gravity 10-40s, -42s, and 48s.
Sewer line is televised.
Research Analyst compiles maps and
data associated with all unstudied 10-42s and -
48s for SSO Study Team Meeting.
Research Analyst studies SSOs.
Obvious cause?YesNo
SSO Team examine/request more data/
resolve.
Consensus cause. Consensus mitigation.
Consent ListSSO Team accepts/
requests further study
Accepted Cause.Accepted Mitigation.
Research Analyst compiles SSO cause
and mitigation
MitigationReview with Collection
Section Manager for suggestions and approval.
Non-FOGFOG
Collection Section Manager approves and routes for
implementation.*
SSO Tracking Table
End of Pretreatment involvement.
Pg. 8 Submit to Pretreatment for
enforcement. Pg. 8
Compile data in SSO Analysis Table for
inclusion in CMOM Report.
Is a defect identified as Grade
7 or 8?
No
Will it be assigned in-house or to on-call contractor?*
Yes
*If the defect is due to corroded concrete, rehab of the manhole to manhole pipe segment is typically forwarded directly to
Centralized Engineering for assignment to an On-Call contractor or inclusion in planned rehab project. If the defect is in a VCP line,
Assistant Superintendent/ Gravity Superintendent/ Construction Supervisor will make the determination.
Create Maximo Work Order.
In-House
Forward to Centralized Engineering and copy Collection Section Manager, Gravity
Superintendent, and Research Analyst.On-Call

05-03-2016
Page 7
Overflow Emergency Response PlanAlbuquerque Bernalillo County Water Utility Authority
Notification Process.
Pg. 1
Spill from WUA System?
No Reporting
No
Spill contained in WUA Facility (e.g. dry
well)?
Yes
Spill contained in private facility (e.g.
basement SSO)?No
Yes
O & M Supervisor Reports
No
Within 12 hrs. or 24 hrs. of time of
dispatch notified or contractor verbally reports
Oral report Pueblo of Isleta (12 hrs.) NM Environment Dept. (24 hrs.)Email report EPA (24 hrs.)
Written Report EPA NM Environment
Department Pueblo of Isleta
Within 5 days
Document but do not report.
Spill results from contractor’s work or construction activity
(Section 911).
YesNo
Contractor verbally reports to collection
section Superintendent or
standby Supervisor.
Yes
Contractor provides 24 hour written
report.
Assistant Superintendent prepares written
report. Field Division Manager
signs.
DMR Collection Section SSOs
Compliance DivisionEPA DMR, 15th of
the month
Collection Section Manager to COA &
AMAFCA

05-03-2016
Page 8
Overflow Emergency Response PlanAlbuquerque Bernalillo County Water Utility Authority
Supervisor calls Pretreatment Office Assistant (289-3419)
o Addresso Dateo Timeo Supervisor Nameo Estimated Volume
Is P2 spec. available?
Pretreatment Engineer
Investigates
No
P2 spec. investigatesYesProceed to SSO
Location
Observe site, fill out form, take pictures, and collect sample if
possible
Use mapping resources to
establish upstream basin area
Develop list of FSEs in area
Note any problem FSEs.
Visit FSEs and check GRSs and manifests
Is a FSE responsible?
No
Start Enforcement Process
Yes
Update SSO Tracking Table.
Pg. 6
LINKO Generated Notice of Violation
(NOV)
Pretreatment Involvement.
Pg. 2
Submit to Pretreatment for
enforcement. Pg. 6

05-03-2016
Page 9
Overflow Emergency Response PlanAlbuquerque Bernalillo County Water Utility Authority
Shut down pumps
Remove sewage with Vactor or pump
to SAS
Wash down wet well and remove wash
water
Remediation Complete.
Pg. 1
Spill has entered a COA storm
pump station. Pg. 2
Note: Process shown is for typical spills. Some spills may require a joint response with the City of Albuquerque in which the spill is captured, treated, and determined appropriate for release.

05-03-2016
Page 10
Overflow Emergency Response PlanAlbuquerque Bernalillo County Water Utility Authority
For large or significant spills.
Superintendent, Chief Engineer, or Division Manager to contact Public Affairs Manager
(PAM), Dave Morris, or Chief Operating Officer (COO), John Stomp. Provide required
information.
Media alerted by PAM, COO, or designee
Alert Media. Pg. 1

05-03-2016
Page 11
Overflow Emergency Response PlanAlbuquerque Bernalillo County Water Utility Authority
Spill has entered a waterway.
Pg. 2
If possible, stop the flow from entering the waterway and
collect wastewater.
Reaches MRGCD Facility?
Remove debris.No
Contact (In sequence until contacted)o Ray Gomez, Assistant Engineer – (505) 247-0234 Officeo Eric Zamora, Chief of Operations – (505)-550-0854 Cello Joe Brem, Albuquerque Division Manager – (505) 249-5780 Cello Joe Baca, Equipment Operations & Maintenance Supervisor – (505)
249-5155 Cell
Yes
Assist in cleanup as requested.
Pg. 1