Embed Size (px)
Citation preview

CME® EQUITY INDEX FUTURES AND OPTIONS Information Guide 20
05

CME 2005 Equity Index Futures and Options Information Guide 1
Table of Contents
INTRODUCTION 3
SECTION I: UNDERSTANDING THE INDEXESS&P 500®, MidCap 400TM, and SmallCap 600TM Indexes 6NASDAQ-100® and NASDAQ Composite® Indexes 10Russell 1000® and Russell 2000 ® Indexes 12S&P 500/BARRA Growth & Value Indexes:
Methodological Details 18Calculation of the Nikkei 225TM Stock Average 23Special Opening Quotations 24How to Calculate Fair Value 28
SECTION II: CONTRACT INFORMATIONS&P 500 Index Futures & Options 30E-miniTM S&P 500 Futures & Options 31S&P MidCap 400 Index Futures & Options 32E-mini S&P MidCap 400 Index Futures 33S&P SmallCap 600 Index Futures 34NASDAQ-100 Index Futures & Options 35E-mini NASDAQ-100 Index Futures & Options 36E-mini NASDAQ Composite Futures 37Russell 2000 Index Futures & Options 38E-mini Russell 2000 Index Futures & Options 39E-mini Russell 1000 Index Futures 40S&P 500/BARRA Growth Index Futures & Options 41S&P 500/BARRA Value Index Futures & Options 42Financial SPCTRTM Futures 43Technology SPCTR Futures 44Nikkei 225 Futures & Options 45Nikkei 225 Futures Comparison Chart 46
Equity Index FLEX® Options 47Frequently Asked Questions: FLEX Options 48Index Trading Calendar 52Holiday Calendar 53Frequently Asked Questions: E-mini Futures 54Price Limits 56Frequently Asked Questions: Equity Index Price Limits 58Frequently Asked Questions: Fair Value Settlement 63Frequently Asked Questions: EFPs 65Frequently Asked Questions: Exchange
Traded Funds Used as EFPs 69Frequently Asked Questions: Block Trading 71
SECTION III: STOCKS AND INDEX INFORMATIONS&P 500 Index Top 40 Stocks 78S&P MidCap 400 Index Top 40 Stocks 80S&P SmallCap 600 Index Top 40 Stocks 82NASDAQ-100 Index Top 40 Stocks 84NASDAQ Composite Top 40 Stocks 86Russell 2000 Index Top 40 Stocks 88Russell 1000 Index Top 40 Stocks 90S&P 500/BARRA Growth Index Top 40 Stocks 92S&P 500/BARRA Value Index Top 40 Stocks 94Financial SPCTR Top 40 Stocks 96Technology SPCTR Top 40 Stocks 98Nikkei 225 Top 40 Stocks 100Japanese ADRs 102Sector Breakdown 103Market Location of Underlying Issues 104Market Capitalization Comparisons 105

2 cme.com
SECTION IV: STATISTICAL DATAHistorical Volatilities & Price Returns 108Correlation Matrices of Daily Returns 109Index Dividend Yield 110
SECTION V: QUOTE VENDOR GUIDESS&P 500 112E-mini S&P 500 113S&P MidCap 400 114E-mini S&P MidCap 400 115S&P SmallCap 600 116NASDAQ-100 117E-mini NASDAQ-100 118E-mini NASDAQ Composite 119Russell 2000 120E-mini Russell 2000 121E-mini Russell 1000 122S&P 500/BARRA Growth 123S&P 500/BARRA Value 124SPCTR Future 125Nikkei 225 126Quote Vendor Guide Key 127Contact Lists 128

CME 2005 Equity Index Futures and Options Information Guide 3
Large-cap U.S. stock indexes finished up for the year, makingit two straight years of positive gains. In 2004, the S&P 500Stock Index grew by nearly 9%, while the technology-heavyNASDAQ-100 was up by over 10%. Mid-cap and small-capstocks performed even better than blue chips, with the S&PMidCap 400 gaining more than 15%, and the Russell 2000increasing by over 17%.
Overall trading volume at CME continued to reach newrecords in the equity index products in 2004 with the followingannual records: 2004 volume of 312,510,698 million contracts,which surpassed the previous year volume of 286,204,884million by 9.2 percent, and which was primarily fueled by thegrowth in the electronically traded E-mini products.
In response to customer demand, CME turned its focus in2004 to expanding its markets in electronically traded equityindex options. The initiative began in Q3 with expandedtechnology capacity for trading options on E-mini S&P 500futures, and the addition of market makers to provide contin-uous bids and offers throughout the nearly 24-hour tradingday. In addition, CME® Globex® fees for customers werewaived for trading these products.
The result? Spectacular growth. Volume in options on the E-mini S&P 500 increased more than seven-fold (from 652 to5405) from December 2003 to December 2004. Growth inopen interest expanded more than twelve-fold (from 5,348to 79,387) throughout the year. The launch of options on E-mini NASDAQ-100 futures followed in Q4 and E-miniRussell 2000 options are scheduled to begin trading in thefirst quarter of 2005.
Introduction
CME Equity Index % Growth Futures Products 2004 ADV 2003 ADV from 2003
E-mini Russell 2000 67,673 15,393 + 340%
E-mini S&P 500 660,881 639,590 + 3%
E-mini S&P MidCap 400 12,974 5,625 + 131%
E-mini NASDAQ-100 305,014 269,401 + 13%

4 cme.com
There were numerous volume and open interest records in CME equity products 2004.
volume records:
• E-mini NASDAQ-100 futures – 619,825 contracts • E-mini Russell 2000 futures – 159,450 contracts • E-mini S&P MidCap 400 futures – 34,408 contracts • Nikkei 225 futures (yen-based) – 8,491 contracts
Open interest records
• E-mini S&P 500 futures – 1,235,440 positions • E-mini NASDAQ-100 futures – 535,590 positions • E-mini Russell 2000 futures – 183,874 positions • Nikkei 225 futures (yen-based) – 22,852 positions • S&P 500 options – 749,276 positions • E-mini S&P 500 options – 74,744 positions • E-mini NASDAQ-100 options – 2,765 positions
In 2004 CME also introduced both yen- and dollar-basedelectronic contracts and expanded the trading hours in allNikkei 225 Stock Index futures. The electronic yen-basedcontracts, which were launched in February, marked the first
time such products were offered for trading in non-Asianbusiness hours. At the same time, CME introduced elec-tronic dollar-based Nikkei 225 futures, an addition to theirdollar-based counterparts already traded on the floor. Theavailability of the contracts on both venues stimulatedgrowth of 61% in 2004 over the 2003 average daily volume.
Nikkei 225 ADV 2004Dollar-based (open outcry and electronic)
4897 contracts
Nikkei 225 ADV 2004 (first year traded)Yen-based (electronic only)
1188 contracts
Note: You will notice that the Russell 1000 in this year'sguide is called the E-mini Russell 1000. CME changed thename of this product early in 2005 because it has long beenconsidered a part of the E-mini complex of products andthe new name will more accurately reflect the nature of thecontract. All aspects of the product remain the same—samecontract specs, same ticker symbols and trading hours. Theonly thing different is the name.

CME 2005 Equity Index Futures and Options Information Guide 5
SECTION I:
Understandingthe Indexes
6 cme.com
S&P 500, S&P MidCap 400 & S&P SmallCap 600 Indexes
In 1957, Standard & Poor’s (S&P) introduced the well-known S&P 500® Index.
This benchmark of stock market performance is perhaps the most widely
followed in the financial community. The S&P MidCap 400, also developed
by S&P, debuted more than three decades later in 1991. This Index, designed
as a benchmark for mid cap stock market performance measurement, has
become a leading indicator for this market segment. The S&P SmallCap 600
Index was launched in 1994, and completes Standard & Poor’s investable
U.S. index coverage. Together the S&P 500, S&P MidCap 400, S&P SmallCap
600 and their derivative products offer investors unique opportunities in
the financial marketplace. This report is designed to provide investors with
an in depth look at the development and maintenance of the S&P 500,
S&P MidCap 400 and S&P SmallCap 600 indices.
Defining the U.S. Stock Market
The S&P 500 Composite Stock Price Index, as its formal name implies, is a market-value-weighted index (shares outstanding multiplied by stock price)of 500 stocks traded on the New York Stock Exchange, American StockExchange, and the Nasdaq National Market System. The weightings makeeach company’s influence on the respective index’s performance directly proportional to that company’s market value. It is this characteristic that hasmade the S&P 500 Index the investment industry’s standard for measuringthe performance of actual portfolios.
Since its inception, when the initial 500 stocks comprised 90% of the marketvalue of all the companies on the New York Stock Exchange, the S&P 500 hasbeen mandated to include the leading companies in leading industries in theU.S. economy. Accordingly, the S&P 500 has evolved into a large cap index; asof December 31, 2004, the median market cap of the companies in the S&P 500 was $10.605 billion and the S&P 500 had a total market capitalizationof $11.289 trillion, accounting for approximately 75.1% of the market value ofthe more than 7,000 companies in Standard & Poor’s internal database.
Unlike the Fortune 500 (which simply ranks the largest 500 publicly tradedcompanies in the U.S. in terms of sales) or the Russell 1000 (which ranks the1,000 largest companies in terms of market cap), companies have never been chosen for the S&P 500—or removed from it—simply because of theirsize. However, because large cap, smallcap, and medium cap stocks frequentlydisplay significantly different risk/reward profiles, size has long been considereda determinant of asset class. The S&P MidCap 400 Index is a logical extensionof the S&P 500. Along with the S&P SmallCap 600 Index, it provides themeans of making that asset class differentiation among U.S. equities.
The 400 companies in the S&P MidCap 400 Index, which accounted for 7.1%of the S&P database’s capitalization on December 31, 2004, had a medianmarket cap of 2.694 billion, compared with the S&P SmallCap 600’s medianof $759 million. Prior to the launch of the S&P MidCap 400 Index in June 1991,

CME 2005 Equity Index Futures and Options Information Guide 7
there was no readily available, popular stock market benchmark in its marketcapitalization range to compare it to. The alternatives were dominated bycompanies that were either too large or too small.
The S&P MidCap 400 Index, like all S&P equity indices, is a representativesample. It is constructed with the aim of matching, as closely as is practical,the economic sector distribution of the securities universe from which it isdrawn. Subsequent to the August 2, 1999 introduction of the Global IndustryClassification Standard (GICS“), which was created by Standard & Poor’s and Morgan Stanley Capital International (MSCI), S&P uses 10 sectors:Consumer Discretionary, Consumer Staples, Energy, Financials, Health Care,Industrials, Information Technology, Materials, Telecommunication Services,and Utilities. Those sectors are in turn divided into 24 industry groups, 62 industries, and 132 sub-industries, not all of which are included in eachindex. For example, as of December 31, 2004, there are no members of the Drug Retail sub-industry in the S&P MidCap 400, and no members of theCommodity Chemicals sub-industry in the S&P 500. Effective April 30 2005,close of business, GICS“ will consist of 10 sectors, 24 industry groups, 64industries and 139 sub-industries.
Criteria for Index Company Changes
New companies can only enter one of the investable S&P U.S. Indices whenthere is a vacancy. The S&P 500, S&P MidCap 400, and S&P SmallCap 600always contain, respectively, 500, 400, and 600 stocks. All three S&P Indices are mutually exclusive. No stock can be in more than one index at any time;however, Standard & Poor’s can and has transferred stocks from one index to another when conditions warranted such a shift. Companies may not applyfor inclusion in the index, and their agents (including investment bankers andinvestor relations and public relations firms) may not nominate them. The selec-tions are made autonomously—only using public information—on an as-neededbasis by the S&P U.S. Index Committee, which is mandated to run the indicesindependently from Standard & Poor’s other business operations and interests.
Because of the potential price effects on a company’s stock from a change inits index status, the fact that a company is—or is not—being analyzed formembership is considered material nonpublic information. Standard & Poor’stells the companies involved in changes in an S&P Index at the same time that the rest of the world is informed of the decision through its release to thefinancial news media. Under a preannouncement policy adopted in October1989, Standard & Poor’s will make that announcement, whenever possible,up to one week in advance of the actual implementation of the change.
The S&P U.S. Index Committee does not mechanically choose potentialreplacements for companies in an S&P Index. Although the screening of theindex candidates begins with a quantitative system, the selection process follows that screening with detailed fundamental analysis. The accompanyingtable describes the general selection criteria used by the S&P U.S. IndexCommittee to identify potential S&P 500 Index company replacements. Thegeneral criteria used for all the S&P equity indices are the same.
Companies that meet these criteria are further analyzed through an in-depthreview of the public information on each of them. Their market statistics,financial statements, and operations are examined—although the expectedstock price performance of the company is not considered. Standard & Poor’sis attempting to define the market with its indices, not to beat it. The IndexCommittee also looks at a candidate’s effect on its respective industry group.All companies added to the S&P 500, S&P MidCap 400 or the S&P SmallCap600 should represent both the overall index and the industry group withinthat index to which they would be assigned.
The Index Committee votes upon companies that meet the general selectioncriteria and pass the in-depth review. Companies for inclusion in the S&P 500 Index are added to the S&P 500 Index replacement pool. Thosethat meet the S&P MidCap 400 or S&P SmallCap 600 criteria are added to the corresponding replacement pool. Not all companies in a replacementpool are eventually added to the index. Their qualifications for membership

8 cme.com
in the index are monitored on an ongoing basis. If a company no longermeets the selection criteria, it is dropped from the replacement pool.
Removals
Companies are removed from an S&P Index for four main reasons: mergerwith (or acquisition by) another company, restructuring, financial operatingfailure, or because the company no longer meets one or more of the inclusion criteria. Historically, the most common reason for removal has beenmerger or acquisition. S&P Index analysts continually monitor corporateactions of S&P Index constituent companies. Upcoming mergers, acquisitions,and restructurings are analyzed and brought before the Index Committee,which determines the most appropriate action to take for each event.
With extremely rare exceptions, a bankruptcy filing by a company requires an immediate company change in its index. It is simply not possible in thosecases where bankruptcies require immediate removal from the index to makea preannouncement five business days in advance of the change. Althoughinclusion in an S&P index is not an opinion on the investment merits of a cor-poration, it does include the assumption that the company is going to remain in business. The bankrupt company is removed from the index and a company in the index replacement pool is added. A candidate in eachreplacement pool is on standby at all times just for such contingencies.
Companies may be removed if they clearly do not meet the criteria for addition. When this happens, S&P normally indicates why the company isbeing deleted. Size and trading liquidity are key concerns.
The S&P 500, S&P MidCap 400, and S&P SmallCap 600 continue to be the most widely accepted benchmarks for large cap, mid cap, and smallcapstocks respectively. The Chicago Mercantile Exchange successfully tradesfutures and options on futures on the S&P 500 and S&P MidCap Indices, and futures on the S&P SmallCap 600 Index.
Float Adjustment
The S&P 500 and S&P’s other U.S. indices will move to float adjustment during 2005. Under float adjustment, the share counts used in calculating the indices will reflect only those shares that are available to investors ratherthan all of a company’s outstanding shares. Float adjustment excludes shares that are closely held by control groups, other publicly traded com-panies or government agencies.
S&P’s goal is to distinguish strategic shareholders, whose holdings dependon concerns such as maintaining control rather than the economic fortunes ofthe company, from those holders whose investments depend on the stock’sprice and their evaluation of the company’s future prospects.
Share owners acting as investors will consider changes in the stock’s price,earnings or the company’s operations as possible reasons to buy or sell thestock. They hold the stock because they expect it to appreciate in value and believe the stock offers better risk and return opportunities than otherinvestments. Further, a sharp rise or fall in the stock’s price could be a reasonto adjust their positions. The fact that an investor has held a block of sharesfor several years is not evidence that the block is being held for control,rather than investment, reasons.
Standard & Poor’s defined three groups of shareholders whose holdings arepresumed to be for control and are subject to float adjustment. Within eachgroup, the holdings are totaled. In cases where holdings in a group exceed10% of the outstanding shares of a company, the holdings of that group will be excluded from the float-adjusted count of shares to be used in indexcalculations.
9CME 2005 Equity Index Futures and Options Information Guide
The three groups are:
1. Holdings by other publicly traded corporations, venture capital firms, private equity firms, strategic partners or leveraged buy-out groups.
2. Holdings by government entities, including all levels of government in theUnited States or foreign countries.
3. Holdings by current or former officers and directors of the company,founders of the company, or family trusts of officers, directors or founders.In addition, holdings of trusts, foundations, pension funds, employee stock ownership plans or other investment vehicles associated with andcontrolled by the company.
Standard & Poor’s criteria for selecting stocks for its U.S. indices will not bechanged by the shift to float adjustment. In particular, the guidelines for marketcapitalization and indices (greater than $4 billion for the S&P 500, $1–4 billionfor the S&P MidCap 400 and $300 million-$1 billion for the S&P SmallCap600) are not changed and continue to apply to a company’s total, not floatadjusted, market capitalization. Second, the rule requiring at least 50% public float remains. Third, the requirements for liquidity remain in place.
Addition and Deletion Criteria
Additions to the S&P 500, S&P MidCap 400 and S&P SmallCap 600
• U.S. companies.
• Adequate liquidity and reasonable per-share price—the ratio of annual dollar value traded to market capitalization should be 0.3 or greater. Verylow stock prices can affect a stock’s liquidity.
• Market capitalization of $4 Billion or more for the S&P 500, $1 billion—$4 Billion for the S&P MidCap 400 and $300 million—$1 billion for the S&P SmallCap 600. These ranges are reviewed from time to time to assureconsistency with market conditions.
• Financial viability, usually measured as four consecutive quarters of positiveas-reported earnings. As-reported earnings are GAAP Net Income exclud-ing discontinued operations and extraordinary items.
• Public float of at least 50% of the stock.
• Maintaining sector balance for each index, as measured by a comparisonof the GICS sectors in each index and in the market, in the relevant marketcapitalization ranges.
• Initial public offerings (IPOs) should be “seasoned” for 6 to 12 monthsbefore being considered for addition to indices.
• Operating company and not a closed-end fund, holding company, part-nership, investment vehicle or royalty trust. Real Estate Investment Trustsare eligible for inclusion in Standard & Poor’s U.S. indices.
Deletions from the S&P 500, S&P MidCap 400 and S&P SmallCap 600
• Companies involved in mergers, being acquired or significantly restructuredsuch that they no longer meet inclusion criteria.
• Companies which substantially violate one or more of the addition criteria.
Standard & Poor’s believes turnover in index membership should be avoidedwhen possible. The addition criteria are for addition to an index, not for continued membership. As a result, a company in an index that appears toviolate the criteria for addition to that index will not be deleted unless ongoing conditions warrant an index change. When a company is removedfrom an index, Standard & Poor’s will explain the basis for the removal.
Standard & Poor’s, a division of The McGraw-Hill Companies, Inc.

10 cme.com
NASDAQ-100 & NASDAQ Composite Indexes
The NASDAQ-100 Index was created in 1985 with a base value set to 250 onFebruary 1 of that year. After reaching a level of nearly 800 on December 31,1993, the Index level was halved on January 3, 1994. At market close onDecember 18, 1998, the index methodology was changed to a “modifiedcapitalization weighting” to ensure a more diversified index. The newmethodology of the NASDAQ-100 retains the economic attributes of capital-ization weighting; promotes portfolio weight diversification (thereby limitingdomination of the Index by a few large stocks); reduces Index performance distortion by preserving the capitalization ranking of companies; and reducesmarket impact on the smallest component stocks from necessary weightrebalancings. The Nasdaq Stock Market calculates and disseminates theIndex under the ticker symbol NDX every 15 seconds during the trading day.
Under the new methodology, the component stocks in the NASDAQ-100 willbe evaluated quarterly and categorized as either large or small stocks. Thisdepends whether their current weights are greater than the average weightin the Index (i.e., as a 100-stock index, the average weight in the NASDAQ-100 Index is 1.0%) or less than or equal to the average weight in the Index, respectively.
Quarterly evaluations results in an index rebalancing if either one or both of the following two weight distribution requirements are not met. First, thecurrent weight of the single largest stock in the Index must be less than or equal to 24.0%. Second the “collective weight” of those stocks whoseindividual current weights are in excess of 4.5%, when added together, must be less than or equal to 48.0%.
If either one or both of these requirements are not met upon quarterlyreview, a weight rebalancing will be performed in accordance with the fol-lowing plan. First, relating to condition (1), if the current weight of the single largest stock in the Index exceeds 24.0%, then the weights of all large
stocks will be scaled down proportionately towards 1.0% by just enough forthe adjusted weight of the largest stock to be set to 20.0%. Second, relatingto condition (2), for those stocks whose individual current weights oradjusted weights in accordance with the preceding step are in excess of4.5%, if their “collective weight” exceeds 48.0%, then the weights of alllarge stocks will be scaled down to 40%. Weightings of all other index securi-ties will also be reset by reducing or enlarging such weights toward 1.0%,the average weight for the 100 stock index.
The aggregate weight reduction among the large stocks resulting fromeither or both of the above rescalings will then be redistributed to the smallstocks in the following iterative manner. In the first iteration, the weight ofthe largest small stock will be scaled upwards by a factor which sets it equalto the average index weight of 1.0%. The weights of each of the smallerremaining small stocks will be scaled up by the same factor reduced in rela-tion to each stock’s relative ranking among the small stocks such that thesmaller the stock in the ranking, the less the scale-up of its weight.
In the second iteration, the weight of the second largest small stock, alreadyadjusted in the first iteration, will be scaled upwards by a factor which sets itequal to the average index weight of 1.0%. The weights of each of thesmaller remaining small stocks will be scaled up by this same factor reducedin relation to each stock’s relative ranking among the small stocks such that, once again, the smaller the stock in the ranking, the less the scale-up of its weight.
Additional iterations will be performed until the accumulated increase inweight among the small stocks exactly equals the aggregate weight reductionamong the large stocks from rebalancing in accordance with condition (1) and/or condition (2).
CME 2005 Equity Index Futures and Options Information Guide 11
To complete the rebalancing procedure, once the final percent weights ofeach stock in the Index are set, the index share weights will be determined,based upon the last sale prices and aggregate capitalization of the Index atthe close of trading on the Thursday immediately preceding the third Fridayin March, June, September, and December. A complete list of NASDAQ-100stocks and a more detailed description of the index methodology can befound on the Internet at www.nasdaq.com.
The NASDAQ Composite Index is a market-cap weighted index, whichincludes all domestic and international based common type stocks listed onThe NASDAQ Stock Market. The NASDAQ Composite Index is a broadbased Index and includes over 3,000 securities, more than most other stockmarket indices. The Index began on February 5, 1971 at a Base Value of 100.00.

12 cme.com
The Russell 1000 & The Russell 2000 Indexes
RUSSELL 1000
The Russell 1000 index offers investors access to the large cap segment of
the US equity universe. The Russell 1000 index is constructed to provide
a comprehensive and unbiased barometer for the large cap segment and is
reconstituted annually to ensure new and growing equities are reflected.
Market Acceptance
Currently, more than $84 billion is passively invested in the Russell 1000index and more than $177 billion institutional assets use the Russell 1000 astheir benchmark.1 The introduction of the Russell 1000 futures and optionson CME gives investors the opportunity to gain exposure to this market seg-ment. The purpose of this article is to provide investors with a better insightinto how the Russell 1000 index is calculated and managed.
Russell 1000 Distinctions:
Objective Methodology: The importance of objectively reflecting the invest-ing opportunity set is a hallmark of Russell Index methodology. Objectivity is critical for accurate reflection of a segment as subjective rules limit boththe number and variety of securities held in an index, introducing bias, and diminishing the ability of an index to represent the investable market.
Sector Weights (as of December 31, 2004) %
Technology 14.0
Health Care 12.9
Consumer Discretionary 14.5
Consumer Staples 6.9
Integrated Oils 4.7
Other Energy 2.1
Materials & Processing 3.8
Producer Durables 4.3
Autos and Transportation 2.4
Financial Services 22.7
Utilities 7.1
Other 4.5
INDEX CHARACTERISTICS
Capitalization Statistics (as of May 30, 2004)
MV Weighted Average Market Cap ($ millions) 79,500
Median Market Cap ($ millions) 4,000
Largest Company by Market Cap ($ millions) 317,800
Smallest Company by Market Cap ($ millions) 1,600
Fundamental Statistics (as of December 31, 2004)
Price/Book 2.95
Dividend Yield 1.69
P/E Ex-Neg Earnings 19.1
Lt Growth Forecast-IBES (%) 12.1
INDEX CHARACTERISTICS
1Source: Nelson MarketPlace Web database.

CME 2005 Equity Index Futures and Options Information Guide 13
Transparent Rules and Membership: Russell indexes are constructed andmaintained using rules that are easy to understand and fully disclosed onRussell’s public website. Membership in the Russell indexes is also disclosedpublicly on www.russell.com during the annual reconstitution period, both on a preliminary and final basis so that all investors have access.
Complete Reconstitution: Russell indexes are the only US index family that is completely and objectively rebuilt to ensure market segments are trulyrepresented. Many other indexes make changes more often, but such changesare selective and limited to relatively few securities. Selective changes, nomatter how frequent, result in less representative benchmarks.
Float-Adjusted Market Cap Weighting: Securities in the Russell US indexfamily are weighted by available market capitalization, after shares held by significant owners are removed (e.g. Directors, Corporations, etc.). Floatweighting provides investors the achievable portion of the market.
Specifically, after the list of 1,000 eligible Russell 1000 participants is deter-mined based on total market capitalization, the shares outstanding for eachcompany are adjusted for large private holdings and cross ownership, orunavailable shares. This Index counts only the investible portion of the largecap universe, i.e., that segment in which investors can most freely transactshares. Because the spectrum of corporate cross ownership ranges fromalmost completely private to totally public companies, the Russell Indexesespouse the concept of available market capitalization weighting.
Types of unavailable shares:
• ESOP or LESOP shares: Corporations that have Employee Stock OwnershipPlans that comprise 10% or more of the shares outstanding are adjusted.
• Corporate cross-owned shares: When shares of a company in the Index areheld by another company also in the Index, this is considered corporatecross-ownership. Any percentage held in this class will be adjusted.
• Large private and corporate shares: Large private and corporate holdingsare defined as those shares held by an individual, a group of individualsacting together, or a corporation not in the Index that own 10% or moreof the shares outstanding. However, not to be included in this class are institutional holdings which are investment companies, partnerships, insurance companies not in the Index, mutual funds, banks not in theIndex, or venture capitals.
Maintenance of the Russell 1000
Index Reconstitution/Rebalancing: The Russell Indexes are reconstitutedannually to reflect changes in the marketplace. The list of companies isranked based on May 31 total market capitalization, with the actual reconsti-tution effective the last Friday in June of each year. Changes in the con-stituents are pre-announced and subject to change if any major corporateactivity occurs or if any new information is received prior to release.
Deletions: Deletions from the index may occur at reconstitution or when a stock is acquired, delisted, or moves to the pink sheets or OTC bulletinboards. When acquisitions or mergers take place, the stock’s capitalizationmoves to the acquiring stock, hence, mergers have no effect on the indextotal capitalization if the acquiring stock is also a member of the Index.
“No Replacement” Rule: Securities that leave the Index between recon-stitution dates for any reason (e.g., mergers, acquisitions, or other similarcorporate activity) are not replaced. Thus, the number of securities in the indexes over the year will fluctuate according to corporate activity.
Additions: The only additions between reconstitution dates are as a result ofspin-offs and initial public offerings. Spin-off companies are added to theparent company’s index and capitalization tier of membership if the spin-offis large enough. To be eligible, the spun-off company’s total market capital-ization must be greater than the market-adjusted total market capitalizationof the smallest security in the Russell 2000 Index at the latest reconstitution.

Beginning September 2004, eligible IPOs are added to Russell US Indexes at the end of each calendar quarter. IPOs will be added to Russell’s US Index family based on total market capitalization ranking within the market-adjusted capitalization breaks established during the most recent recon-stitution. Market adjustments will be made using the returns of the broadmarket Russell 3000.
Calculation of the Index
The Russell 1000 Index is a market-capitalization-weighted index. Each security in the Index is weighted by its available market capitalization, result-ing in the larger securities’ price changes having a larger impact on overallIndex return than smaller securities. Each company’s available market value iscalculated by multiplying its price by available shares. In cases of a bid-askquote, the bid price is used in the calculation.
The Russell 1000 Index is calculated by Reuters every 15 seconds and is distributed across various data vendor terminals. The market value of theRussell 1000 is stated in the form of an index number which is relative to a base period market value. The market value of the price-only Russell 1000Index was initialized as of December 31, 1986, at a base of 130.00.
14 cme.com
Copyright © Frank Russell Company 2004. All rights reserved.
Frank Russell Company is the owner of the trademarks, service marks, and copyrights related to its indexes.Indexes and/or benchmarks are unmanaged and cannot be invested in directly. Returns represent past performance, are not a guarantee of future performance, and are not indicative of any specific investment.
Russell Investment Group is a registered trade name of Frank Russell Company, a Washington USA corporation, which operates through subsidiaries worldwide. Frank Russell Company is a subsidiary of The Northwestern Mutual Life Insurance Company.RC3607

CME 2005 Equity Index Futures and Options Information Guide 15
RUSSELL 2000
The Russell 2000 index offers investors access to the small cap segment of
the US equity universe. The Russell 2000 index is constructed to provide a
comprehensive and unbiased barometer for the small cap segment and is
reconstituted annually to ensure larger stocks do not distort the performance
and characteristics of the true small cap opportunity set.
Market Acceptance
Since its inception, the Russell 2000 index has become the premier measureof the small-capitalization stocks and is widely followed by US fund man-agers. 98% of institutional small cap mandates choose the Russell 2000 asthe best market representation for their style. Currently, more than $38 billionis passively invested in the Russell 2000 index and more than $377 billioninstitutional assets use the Russell 2000 as their benchmark.1 The February
1993 introduction of the Russell 2000 futures and options on CME gaveinvestors the opportunity to manage small-cap portfolio risk, as well as togain exposure to this market segment. The purpose of this article is to provide investors with a better insight into how the Russell 2000 index is calculated and managed.
Russell 2000 Distinctions:
Objective Methodology: The importance of objectively reflecting the invest-ing opportunity set is a hallmark of Russell Index methodology. Objectivity iscritical for accurate reflection of a segment as subjective rules limit both thenumber and variety of securities held in an index, introducing bias, anddiminishing the ability of an index to represent the investable market.
Capitalization Statistics (as of May 30, 2004)
MV Weighted Average Market Cap (in millions) 866
Median Market Cap ($ millions) 496
Largest Company by Market Cap ($ millions) 1,600
Smallest Company by Market Cap ($ millions) 176
Fundamental Statistics (as of December 31, 2004)
Price/Book 2.42
Dividend Yield 1.04
P/E Ex-Neg Earnings 21.6
Lt Growth Forecast-IBES (%) 14.1
EPS Growth-5 Years 7.8
INDEX CHARACTERISTICS
Sector Weights (as of December 31, 2004) %
Technology 12.6
Health Care 12.0
Consumer Discretionary 18.0
Consumer Staples 1.6
Integrated Oils 0.1
Other Energy 4.8
Materials & Processing 10.2
Producer Durables 7.8
Autos and Transportation 4.5
Financial Services 23.7
Utilities 4.2
Other 0.4
INDEX CHARACTERISTICS
1 Source: Nelson Market Place Web database
Transparent Rules and Membership: Russell indexes are constructed andmaintained using rules that are easy to understand and fully disclosed onRussell’s public website. Membership in the Russell indexes is also disclosedpublicly on www.russell.com during the annual reconstitution period, both on a preliminary and final basis so that all investors have access.
Complete Reconstitution: Russell indexes are the only US index family that is completely and objectively rebuilt to ensure market segments are trulyrepresented. Many other indexes make changes more often, but such changesare selective and limited to relatively few securities. Selective changes, no matter how frequent, result in less representative benchmarks.
Float-Adjusted Market Cap Weighting: Securities in the Russell US indexfamily are weighted by available market capitalization, after shares held bysignificant owners are removed (e.g. Directors, Corporations, etc.). Floatweighting provides investors the achievable portion of the market.
Specifically, after the list of 2,000 eligible Russell 2000 participants is deter-mined based on total market capitalization, the shares outstanding for eachcompany are adjusted for large private holdings and cross ownership, orunavailable shares. This Index counts only the investible portion of the smallstock universe, i.e., that segment in which investors can most freely transactshares. Because the spectrum of corporate cross ownership ranges fromalmost completely private to totally public companies, the Russell Indexesespouse the concept of available market capitalization weighting.
The issue of illiquid unavailable capital is a characteristic of the small stockarena which is directly addressed by weighting each security by its availablecapital. This approach ensures that only the liquid subset of all equity capitalis used in the calculation of the Russell 2000 Index.
Types of unavailable shares:
• ESOP or LESOP shares: Corporations that have Employee Stock OwnershipPlans that comprise 10% or more of the shares outstanding are adjusted.
• Corporate cross-owned shares: When shares of a company in the Index are held by another company also in the Index, this is considered corporatecross-ownership. Any percentage held in this class will be adjusted.
• Large private and corporate shares: Large private and corporate holdingsare defined as those shares held by an individual, a group of individualsacting together, or a corporation not in the Index that own 10% or moreof the shares outstanding. However, not to be included in this class areinstitutional holdings which are investment companies, partnerships, insur-ance companies not in the Index, mutual funds, banks not in the Index, or venture capitals.
The unavailable capital adjustment for 2003 was 22% on the overall Index. In2004 the adjustment was 19.51%. The effect on the economic sector weightsis shown below.
Maintenance of the Russell 2000
Index Reconstitution/Rebalancing: The Russell Indexes are reconstitutedannually to reflect changes in the marketplace. The list of companies isranked based on May 31 total market capitalization, with the actual reconsti-tution effective the last Friday in June of each year. Changes in the con-stituents are pre-announced and subject to change if any major corporateactivity occurs or if any new information is received prior to release.
Deletions: Deletions from the index may occur at reconstitution or when astock is acquired, delisted, or moves to the pink sheets or OTC bulletinboards. When acquisitions or mergers take place, the stock’s capitalizationmoves to the acquiring stock, hence, mergers have no effect on the indextotal capitalization if the acquiring stock is also a member of the Index.
16 cme.com

CME 2005 Equity Index Futures and Options Information Guide 17
“No Replacement” Rule: Securities that leave the Index between reconsti-tution dates for any reason (e.g., mergers, acquisitions, or other similarcorporate activity) are not replaced. Thus, the number of securities in theindexes over the year will fluctuate according to corporate activity.
Additions: The only additions between reconstitution dates are as a result ofspin-offs and initial public offerings. Spin-off companies are added to theparent company’s index and capitalization tier of membership if the spin-offis large enough. To be eligible, the spun-off company’s total market capital-ization must be greater than the market-adjusted total market capitalizationof the smallest security in the Russell 2000 Index at the latest reconstitution.Beginning September 2004, eligible IPOs are added to Russell US Indexes at the end of each calendar quarter. IPOs will be added to Russell’s US Index family based on total market capitalization ranking within the market-adjusted capitalization breaks established during the most recent recon-stitution. Market adjustments will be made using the returns of the broadmarket Russell 3000.
Calculation of the Index
The Russell 2000 Index is a market-capitalization-weighted index. Each secu-rity in the Index is weighted by its available market capitalization, resulting inthe larger securities’ price changes having a larger impact on overall Indexreturn than smaller securities. Each company’s available market value is cal-culated by multiplying its price by available shares. In cases of a bid-askquote, the bid price is used in the calculation.
The Russell 2000 Index is calculated by Reuters every 15 seconds and is dis-tributed across various data vendor terminals. The market value of theRussell 2000 is stated in the form of an index number which is relative to abase period market value. The market value of the price-only Russell 2000Index was initialized as of December 31, 1986, at a base of 135.00.
Copyright © Frank Russell Company 2004. All rights reserved.
Frank Russell Company is the owner of the trademarks, service marks, and copyrights related to its indexes.Indexes and/or benchmarks are unmanaged and cannot be invested in directly. Returns represent past performance, are not a guarantee of future performance, and are not indicative of any specific investment.
Russell Investment Group is a registered trade name of Frank Russell Company, a Washington USA corporation, which operates through subsidiaries worldwide. Frank Russell Company is a subsidiary of TheNorthwestern Mutual Life Insurance Company.RC3607

Overview
In May 1992, Standard and Poor’s and BARRA, Inc. jointly released the S&P 500/BARRA Growth Index and the S&P 500/BARRA Value Index designedto track two of the predominant investment styles in the U.S. equity market.The indexes are constructed by dividing the stocks in the S&P 500 Indexaccording to their corresponding BARRA Book-to-Price risk index factorexposures, which are derived from an individual company’s book-to-priceratio. Each S&P 500 Index company is assigned to either the S&P 500/BARRA Growth Index or the S&P 500/BARRA Value Index, which weredesigned to hold no equity issues in common. The Value (Growth) Index contains those S&P 500 Index companies that have higher (lower) Book-to-Price risk index factor exposures and, as a consequence, higher (lower)book-to-price ratios. As is the case with the S&P 500 Index, each S&P 500/BARRA Growth and Value Index member is assigned a weight within eachindex that is in direct proportion to its market capitalization.
The S&P 500/BARRA Growth and Value Indexes are rebalanced semiannuallyby BARRA, Inc. as of the close of trading on May 31 and on November 30. The rebalancing procedure is based upon the constituent company book-to-price ratios and semiannual rebalance date. The newly-rebalanced constituentsof each index are pre-released by the Equity Services Group of Standard &Poor’s and become effective after the close of trading on June 30 andDecember 31, respectively. This one-month lag between the date of eachsemiannual rebalance and the subsequent effective date of the newly-rebalanced index constituents was implemented to allow ample time to facilitate investments that track the performance of these indexes.
Standard & Poor’s is responsible for all other aspects of maintenance of the Growth and Value Indexes. Most of these maintenance functions are
analogous to those performed by Standard & Poor’s for the S&P 500 Index:monitoring and completing the adjustments for company additions and dele-tions, share changes, stock splits, stock dividends, and stock price adjust-ments due to company restructurings or spin-offs. In addition, Standard &Poor’s performs the appropriate adjustments to the Growth and Value Index Divisors.
Semiannual Rebalance of the Growth and Value Indexes
The S&P 500/BARRA Growth and Value Indexes are each designed to becomprised of approximately 50 percent of the S&P 500 market capitalization.This 50/50 percentage weighting is only approximate, because it is usuallynot possible to divide the S&P 500 Index into two halves of identical marketcapitalization. Moreover, the relative weights of the Growth and ValueIndexes drift away from 50/50 during the months following each rebalance asa result of changes in the relative market capitalization of their constituentcompanies, so they must be moved back to roughly 50/50 again during eachsubsequent semiannual rebalance.
During the rebalancing, the S&P 500 Index members are sorted in decreas-ing order by their corresponding BARRA Book-to-Price risk index factorexposure. Companies are then selected in decreasing order by their BARRABook-to-Price exposure for placement into the newly-rebalanced ValueIndex. Concurrently, a running tally of the total market capitalization is main-tained for each individual S&P 500 Index company selected in this manner.
Those companies that have been selected according to this method areallowed to enter the S&P 500/BARRA Value Index only as long as this runningtally of total market capitalization remains strictly less than 50 percent of that of the S&P 500 Index. Otherwise, the company under consideration is
18 cme.com
S&P 500/Barra Growth & Value Indexes: Methodological Details
Written by: Michael J. Levinson Edited by: Pamela Broughman
Senior Consultant—BARRA Inc. Editor—BARRA, Inc.

CME 2005 Equity Index Futures and Options Information Guide 19
placed into the newly rebalanced S&P 500/BARRA Growth Index. In addition,all S&P 500 Index companies that have not yet been selected for placementinto the Value Index are assigned to the Growth Index. Consequently, thesum of the market capitalization of all companies that have been placed intothe S&P 500/BARRA Value (Growth) Index cannot exceed (be less than) 50% of that of the S&P 500 Index as of each May 31 and November 30 semi-annual rebalance.
As of the semiannual rebalance, any company in the Value Index has aBARRA Book-to-Price risk index factor exposure which is greater than that of any Growth Index company. However, because the relative rankings of the Growth and Value Index company Book-to-Price risk index factor expo-sures may drift significantly during the months following each rebalance as aresult of changes in the book-to-price ratios of the Index constituents, it ispossible for Book-to-Price risk index factor exposures of many Growth Indexcompanies to exceed those of Value Index companies. The S&P 500/BARRAIndexes are then reconstituted as a result of each subsequent semiannualrebalance so that the Value Index constituent Book-to-Price risk index factorexposures are greater than those of the Growth Index.
Occasionally, the Book-to-Price exposure corresponding to two or more S&P 500 Index companies may be identical as of a given semiannual rebalancedate. When this occurs, the semiannual rebalance procedure is modifiedslightly by the addition of a random stock selection process as a tie breaker.Using this methodology, stocks having identical BARRA Book-to-Price risk index factor exposures are selected for random placement into thenewly rebalanced Value Index. Stocks are selected using this tie-breakingmethod only after the selection of those S&P 500 Index members withBARRA Book-to-Price exposures greater than that of the ties. When such tiesexist, it is possible for the Book-to-Price exposure of the company in the
Value Index having the lowest exposure to be identical to that of the GrowthIndex company which has the highest Book-to-Price exposure. However, itshould be noted that this need not occur in every instance of Book-to-Priceexposure ties.
Assignment of S&P 500 Index Additions to Growth and Value
All additions to the S&P 500 Index are assigned to either the Growth or theValue Index. While the procedure employed to create the semiannual list of newly rebalanced S&P 500/BARRA Growth and Value Indexes constituentshas been completely automated, other maintenance procedures for con-stituent companies are performed manually by members of BARRA’s EquityOperations Group. For example, additions to the S&P 500 Index subsequentto each semiannual rebalance are considered individually by the EquityOperations Group for assignment to either the Growth or the Value Index.This Group attempts to perform such assignments objectively and consis-tently whenever the BARRA Book-to-Price Risk index factor exposure data is available for a new S&P 500 Index company.
The first step in making a Growth or Value Index assignment is the determi-nation of the BARRA Book-to-Price risk index factor exposure correspondingto each new S&P 500 company. BARRA recalculates the Book-to-Price riskindex factor exposure corresponding to each of more than 6,900 companiesin its Fundamental Risk Measurement Service Universe (FRMSU) database ona monthly basis as part of its U.S. Equity Model update. The S&P 500/BARRAIndex Book-to-Price Exposure Cutoff value is then used to determinewhether to place a new S&P 500 Index member into the Growth or the ValueIndex. New S&P 500 Index companies are assigned to the Value Index iftheir BARRA Book-to-Price risk index factor exposure is greater than or equal to the most recent semiannual Book-to-Price Exposure Cutoff value;otherwise, new companies are added to the Growth Index.

20 cme.com
More subjective means are sometimes employed to assign a new S&P 500Index company to either Index if it is not possible to estimate its BARRABook-to-Price Risk index factor exposure at least one full business day priorto the effective date of its S&P 500 Index membership. Circumstances that might preclude the immediate availability of BARRA Book-to-Price riskindex factor exposure data most frequently result from the addition of new S&P 500 companies whose shares have only recently been (or are soonto be) made available within the U.S. for trading by the public. Such a new issue usually results from recent corporate actions such as mergers,acquisitions, spin-offs, and other restructurings. In some of these instances,insufficient data is available to calculate the Book-to-Price Risk index factor exposure. When the BARRA Book-to-Price risk index factor exposureis not available for a new S&P 500 Index company, BARRA’s EquityOperations Group attempts to determine an estimate. Once this is accom-plished, the Equity Operations Group proceeds in the manner describedabove to assign a new S&P 500 Index company to either the Growth Indexor the Value Index.

CME 2005 Equity Index Futures and Options Information Guide 21

22 cme.com

CME 2005 Equity Index Futures and Options Information Guide 23
Calculation of the Nikkei 225 Stock Average
Computation Formula for Nikkei 225 Stock Average
a) Issues that do not have a par value of 50 yen are converted into 50 yen par value in computing the sum of stock prices.
b) Three decimal figures are rounded to two decimals.
c) Order of priority in the usage of stock prices is as follows:
1. Present special quote for the market;
2. Present price (or closing price);
3. Standard price (the value used in the order of priority according to theoretical values of ex-rights, special quote of the previous day, andclosing prices of the previous day).
Source: Nihon Keizai Shimbun, Inc.
sum of stock prices for 225 selected issues
divisorNikkei 225 Stock Average =

Index Products Expiration Procedures
Quarterly settlement of S&P 500, E-mini S&P 500, S&P MidCap 400, E-mini MidCap 400, S&P SmallCap 600, SPCTR Futures, S&P 500 BARRA/Growth and Value, E-mini Russell 1000, Russell 2000, and E-mini Russell 2000Index futures and options are based on a Special Opening Quotation of the relevant underlying index. The Special Opening Quotation for each index is based on the opening price of each component stock in that index onexpiration Friday.1
Special Opening Quotations generally differ from the opening index value ofeach index because all stocks do not open immediately. For example, on typi-cal days surveyed by the CME, most S&P stocks open quickly, with around95% open within 15 minutes and 98% open within 30 minutes. Other indiceswith larger numbers of stocks may take longer to open.
Opening Index Values
On typical days CME begins disseminating index values immediately at 8:30 a.m. Chicago time. Because the index value is based on the last price for each stock, the opening index value will reflect the previous day’s closing price for any stock that has yet to open. Thus, the index value almostalways begins at the previous close and then changes as stocks open.Thereafter, the index calculation reflects some stocks not yet open, and other stocks actively trading.
Special Opening Quotation
Special Opening Quotations of the indices generally will be based on theopening values of the component stocks, regardless of when those stocksopen on expiration day. However, if a stock does not open on that day, its last sale price will be used in the Special Opening Quotation. TheSpecial Opening Quotation may or may not be within the cash index prices on expiration day.
CME disseminates periodic updates of the S&P 500 and S&P MidCap 400Special Opening Quotations on the ticker as a text message. These quotationsare based on the opening prices for those stocks that have opened by that time and the last sale price for those stocks that have yet to open. TheRussell 2000 final Special Opening Quotation typically is not received by the Exchange until 4:00 p.m. Chicago time, due to the large number ofstocks. However, a preliminary indication with the percent of stocks open is usually available by 1:00 p.m. Chicago time on expiration day.
24 cme.com
Special Opening Quotations
1 The NYSE or AMEX opening price will be used for stocks listed on the NYSE or AMEX, respectively. The first transaction price will be used for NASDAQ stocks.
2 Expiring in-the-money option contracts will be exercised automatically, absent contrary instructions received by the Clearing House prior to 7:00 p.m. on expiration Friday.

Example of Opening Index Calculations
A sample calculation of the S&P 500 Index and Special Opening Quotation is shown below. When either (1) all the stocks in the index are open, and corrections are finished, or (2) the close of business occurs, whichever is first, the Special Opening Quotations will be finalized. All open expiringfutures and options contracts will be cash-settled to final Special OpeningQuotations.2
This example illustrates the difference between the index and the SpecialOpening Quotation for a simple two-stock index with equal outstandingshares of stock.
Eastern Time
PreviousClose 9:30:00 9:31:02 9:32:24 9:35:17 9:36:42
Stock 1 50.250 N/O 50.375* 50.500 50.625 50.750
Stock 2 33.750 N/O N/O N/O 34.250* 34.375
Index Value 42.00 42.00 42.06 42.13 42.44 42.56
Special OpeningQuotation 42.00 42.06 42.06 42.31** 42.31
Percent Open 0 % 60 % 60 % 100 % 100 %
N/O Not open
* Opening price
* * Official opening index value
CME 2005 Equity Index Futures and Options Information Guide 25

NASDAQ-100 & NASDAQ Composite Index Expiration Procedure
NASDAQ-100 Index futures and options, E-mini NASDAQ-100 and E-miniNASDAQ Composite futures expire on a quarterly cycle, generally the thirdFriday of the contract month. Final settlement of all NASDAQ-100 Indexopen positions are based on the Special Opening Quotation of the NASDAQ-100 Index index, an SOQ which is computed from a five-minute volumeweighted average of each component stock’s opening prices. The E-miniNASDAQ Composite Index futures follow the same procedure. The specialopening quotation of the NASDAQ Composite Index index is an SOQ computed from a five-minute volume weighted average of each componentstock’s opening prices. If a stock does not open, the previous day’s settlement price will be used in the calculation. The chart entitled “EasternStandard Time” illustrates how a stock price is calculated for the SpecialOpening Quotation.
26 cme.com
Eastern Standard Time
Time 9:30:00 9:30:02 9:31:15 9:34:45 9:35:02 Total
Stock 1 Price 56.75 57.00 57.25 57.5 57.75
# Shares PreviousTraded Close
(Not Open) 100 200 50 100
Price x Shares 5700 11450 2875 5775
# of SharesTraded in 5 min. span 450
Price x Shares 25800
Price used for stock 1 in Special Opening Quotation of NASDAQ-100: 57.33333333 (25800/450)

CME 2005 Equity Index Futures and Options Information Guide 27
NIKKEI 225 Expiration Procedure
Nikkei 225 futures and options expire on a quarterly cycle, the second Fridayof the contract month. The final settlement price of the Nikkei 225 futuresand options is based on the Special Opening Quotation of the Nikkei StockAverage, used to settle the Nikkei Stock Average futures at the OsakaSecurities Exchange.
19-Mar-04 1120.1818-Jun-04 1129.6017-Sep-04 1127.0217-Dec-04 1190.45
21-Mar-03 887.1620-Jun-03 1001.5619-Sep-03 1039.6019-Dec-03 1091.61
15-Mar-02 1158.6021-Jun-02 991.3320-Sep-02 846.2420-Dec-02 891.11
6-Mar-01 1156.286-Jun-01 1206.88
21-Sep-01 939.5721-Dec-01 1147.27
17-Mar-00 1451.4816-Jun-00 1475.4415-Sep-00 1480.9315-Dec-00 1318.25
19-Mar-99 1325.6518-Jun-99 1335.82
17-Sep-99 1326.1317-Dec-99 1429.73
20-Mar-98 1095.4519-Jun-98 1107.8418-Sep-98 1020.8818-Dec-98 1180.28
21-Mar-97 786.7620-Jun-97 898.6519-Sep-97 945.8219-Dec-97 943.65
15-Mar-96 640.5021-Jun-96 664.5021-Sep-96 684.7020-Dec-96 761.17
17-Mar-95 496.5516-Jun-95 539.1615-Sep-95 586.6315-Dec-95 617.89
18-Mar-94 470.1117-Jun-94 462.3216-Sep-94 471.5216-Dec-94 458.02
HISTORICAL S&P 500 INDEX FUTURES SPECIAL OPENING QUOTATIONS

28 cme.com
How to Calculate Fair Value
Fair Value is the theoretical assumption of where a futures contract should be priced given such things as the current index level, index dividends, daysto expiration and interest rates. The actual futures price will not necessarilytrade at the theoretical price, as short term supply and demand will causeprice to fluctuate around fair value. Price discrepancies above or below fairvalue should cause arbitrageurs to return the market closer to its fair value.
The following formula is used to calculate fair value for stock index futures: = cash (1 + [r – d] [365 ])
This example shows how to calculate fair value for S&P 500 futures:
Sept. S&P 500 futures price 1053.00 pts
S&P 500 cash index 1051.00 pts
Financing costs/Interest rate 1.15 %
Dividend yield S&P 500 2.13%
Days to expiration of Dec. futures 42 days
Fair Value of futures = Cash (1 + [r – d] [365 ])
= 1051.00 (1 + [.0115 –.0213] [365 ])
= 1049.82
Amount of futures overpricing = 1049.82 – 1051.00
= – 1.18 pts
* Note: In this example fair value is priced below the cash value. This is due to the interest rate being lowerthan the dividend yield.

CME 2005 Equity Index Futures and Options Information Guide 29
SECTION II:
ContractInformation

The S&P 500 is a capitalization-weighted index of 500 large, actively traded U.S. stocks. These stocks are traded on the New York Stock Exchange, theAmerican Stock Exchange and The Nasdaq Stock Market. The primary calculator for the S&P 500 Index is Reuters.
FUTURES OPTIONS
OPENING DATE April 21, 1982 January 28, 1983
TICKER SYMBOLS SP Calls: CS Puts: PS
CONTRACT SIZE $250 x S&P 500 Index futures price One S&P 500 futures contract
STRIKE PRICES N/A 5-point intervals for two nearest contracts, 10-point intervals for deferred months
MINIMUM PRICE .10 index points = $25 per contract FLUCTUATION (TICK) (Futures calendar spreads: .05 index points = $12.50 per contract)
TRADING HOURS 8:30 a.m. – 3:15 p.m. (Open Outcry) (CHICAGO TIME) 3:30 p.m. – 8:15 a.m. (CME® Globex® platform)
(On Sundays and holidays CME Globex trading begins at 5:00 p.m. Daily shutdown for maintenance is 4:30 – 5:00 p.m.)
CONTRACT MONTHS March, June, September, December All 12 calendar months
LAST DAY OF TRADING The Thursday prior to the third Friday March, June, September, December: same date asof the contract month as underlying futures contract; other eight months:
the third Friday of the contract month
POSITION LIMITS 20,000 net long or short in all contract 20,000 futures-equivalent contracts net on the same months combined side of the market in all contract months combined
QUARTERLY FUTURES AND OPTIONS SETTLEMENT PROCEDURES: Cash settlement. All open positions at the close of the final trading day are settled in cash to the Special Opening Quotation (see Special Opening Quotations) on Friday morning of the S&P 500 Index.
OPTION EXERCISE: American Style. An option can be exercised until 7:00 p.m. (Chicago time) on any business day the option is traded. An option that is in-the-money, and has not been exercised prior to the termination of trading shall, in the absence of contrary instructions, be delivered to the Clearing House by7:00 p.m. on the day of determination of the Final Settlement Price, and be automatically exercised.
*Please refer to CME Rules for official specifications.
30 cme.com
S&P 500 Index Futures & Options Contract Highlights*

CME 2005 Equity Index Futures and Options Information Guide 31
E-mini S&P 500 Index Futures & Options Contract Highlights*
The S&P 500 is a capitalization-weighted index of 500 large, actively traded U.S. stocks. These stocks are traded on the New York Stock Exchange, theAmerican Stock Exchange and The Nasdaq Stock Market. The primary calculator for the S&P 500 Index is Reuters.
FUTURES OPTIONS
OPENING DATE September 9, 1997
TICKER SYMBOLS ES Calls: ES Puts: ESAON: EG
CONTRACT SIZE $50 x E-mini S&P 500 Index futures price One E-mini S&P 500 futures contract
STRIKE PRICES N/A 5-point intervals for two nearest contracts, 10-point intervals for deferred months
MINIMUM PRICE .25 index points = $12.50 per contractFLUCTUATION (TICK) (Futures calendar spreads: .05 index points = $2.50 per contract)
TRADING HOURS Virtually 24-hour trading on the CME Globex platform(CHICAGO TIME) (Sundays from 5:00 p.m. to Fridays 3:15 p.m. Daily shutdown for maintenance is 4:30 p.m. – 5:00 p.m.)
CONTRACT MONTHS March, June, September, December All 12 calendar months
LAST DAY OF TRADING Trading can occur up to 8:30 a.m. March, June, September, December: same date (Chicago Time) on the third Friday as underlying futures contract; other eight months: of the contract month the third Friday of the contract month
POSITION LIMITS Position limits work in conjunction withexisting S&P 500 position limits
QUARTERLY FUTURES AND OPTIONS SETTLEMENT PROCEDURES: Cash settlement. All open positions at the close of the final trading day are settled in cash
to the Special Opening Quotation (see Special Opening Quotations) on Friday morning of the S&P 500 Index.
OPTION EXERCISE: AMERICAN STYLE. An option can be exercised until 7:00 p.m. (Chicago time) on any business day the option is traded. An option that isin-the-money, and has not been exercised prior to the termination of trading shall, in the absence of contrary instructions, be delivered to the Clearing Houseby 7:00 p.m. on the day of determination of the Final Settlement Price, and be automatically exercised.
*Please refer to CME Rules for official specifications.
32 cme.com
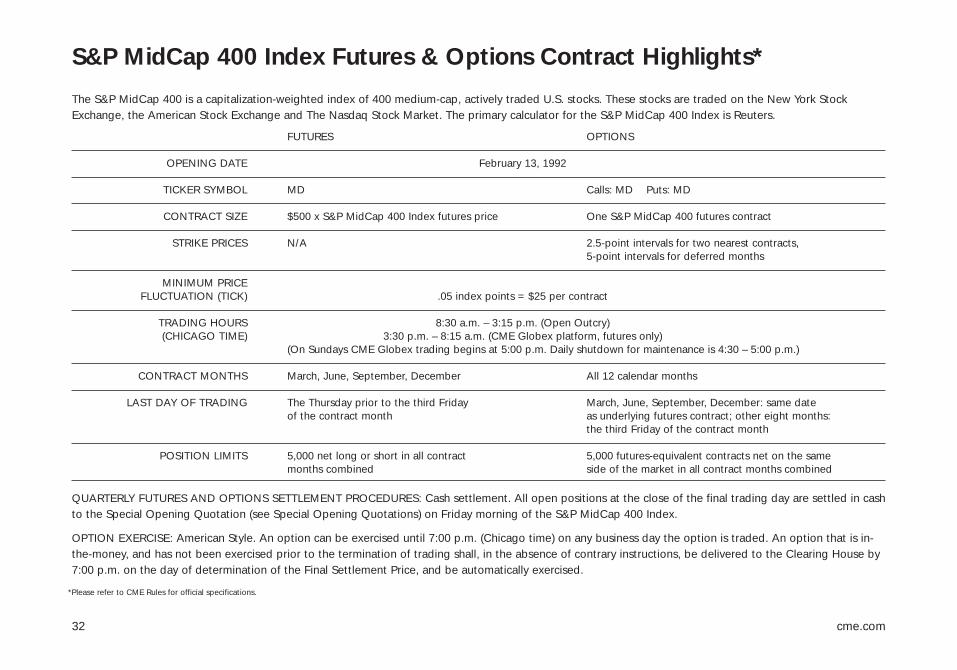
S&P MidCap 400 Index Futures & Options Contract Highlights*
The S&P MidCap 400 is a capitalization-weighted index of 400 medium-cap, actively traded U.S. stocks. These stocks are traded on the New York StockExchange, the American Stock Exchange and The Nasdaq Stock Market. The primary calculator for the S&P MidCap 400 Index is Reuters.
FUTURES OPTIONS
OPENING DATE February 13, 1992
TICKER SYMBOL MD Calls: MD Puts: MD
CONTRACT SIZE $500 x S&P MidCap 400 Index futures price One S&P MidCap 400 futures contract
STRIKE PRICES N/A 2.5-point intervals for two nearest contracts, 5-point intervals for deferred months
MINIMUM PRICE FLUCTUATION (TICK) .05 index points = $25 per contract
TRADING HOURS 8:30 a.m. – 3:15 p.m. (Open Outcry) (CHICAGO TIME) 3:30 p.m. – 8:15 a.m. (CME Globex platform, futures only)
(On Sundays CME Globex trading begins at 5:00 p.m. Daily shutdown for maintenance is 4:30 – 5:00 p.m.)
CONTRACT MONTHS March, June, September, December All 12 calendar months
LAST DAY OF TRADING The Thursday prior to the third Friday March, June, September, December: same dateof the contract month as underlying futures contract; other eight months:
the third Friday of the contract month
POSITION LIMITS 5,000 net long or short in all contract 5,000 futures-equivalent contracts net on the samemonths combined side of the market in all contract months combined
QUARTERLY FUTURES AND OPTIONS SETTLEMENT PROCEDURES: Cash settlement. All open positions at the close of the final trading day are settled in cash to the Special Opening Quotation (see Special Opening Quotations) on Friday morning of the S&P MidCap 400 Index.
OPTION EXERCISE: American Style. An option can be exercised until 7:00 p.m. (Chicago time) on any business day the option is traded. An option that is in-the-money, and has not been exercised prior to the termination of trading shall, in the absence of contrary instructions, be delivered to the Clearing House by7:00 p.m. on the day of determination of the Final Settlement Price, and be automatically exercised.
*Please refer to CME Rules for official specifications.

CME 2005 Equity Index Futures and Options Information Guide 33
E-mini S&P MidCap 400 Index Futures Contract Highlights*
The S&P MidCap 400 is a capitalization-weighted index of 400 medium-cap, actively traded U.S. stocks. These stocks are traded on the New York StockExchange, the American Stock Exchange and The Nasdaq Stock Market. The primary calculator for the S&P MidCap 400 Index is Reuters.
FUTURES
OPENING DATE January 28, 2002
TICKER SYMBOL EMD
CONTRACT SIZE $100 x E-mini S&P MidCap 400 Index futures price
MINIMUM PRICE .10 index points = $10 FLUCTUATION (TICK) (Futures calendar spreads: .05 index points = $5 per contact)
TRADING HOURS Virtually 24-hour trading on the CME Globex platform(CHICAGO TIME) (Sundays from 5:00 p.m. to Fridays 3:15 p.m. Daily shutdown for
maintenance is 4:30 p.m. – 5:00 p.m.)
CONTRACT MONTHS March, June, September, December
LAST DAY OF TRADING Trading can occur up to 8:30 a.m. (Chicago time) on the third Friday of the contract month
POSITION LIMITS Positions work in conjunction with S&P MidCap 400 position limits
QUARTERLY FUTURES SETTLEMENT PROCEDURES: Cash settlement. All open positions at the close of the final trading day are settled in cash to the SpecialOpening Quotation (see Special Opening Quotations) on Friday morning of the S&P MidCap 400 Index.
*Please refer to CME Rules for official specifications.

34 cme.com
S&P SmallCap 600 Index Futures Contract Highlights*
The S&P SmallCap 600 is a capitalization-weighted index of 600 small-cap, actively traded U.S. stocks. These stocks are traded on the New York StockExchange, the American Stock Exchange and The Nasdaq Stock Market. The primary calculator for the S&P SmallCap 600 Index is Reuters.
FUTURES
OPENING DATE November 11, 2002
TICKER SYMBOL SMC
CONTRACT SIZE $200 x S&P SmallCap 600 Index futures price
MINIMUM PRICE .05 index points = $10 FLUCTUATION (TICK)
TRADING HOURS Virtually 24-hour trading on the CME Globex platform(CHICAGO TIME) (Sundays from 5:00 p.m. to Fridays 3:15 p.m. Daily shutdown for
maintenance is 4:30 p.m. - 5:00 p.m.)
CONTRACT MONTHS March, June, September, December
LAST DAY OF TRADING Trading can occur up to 8:30 a.m. (Chicago time) on the third Friday of the contract month
POSITION LIMITS 25,000
QUARTERLY FUTURES SETTLEMENT PROCEDURES: Cash settlement. All open positions at the close of the final trading day are settled in cash to the SpecialOpening Quotation (see Special Opening Quotations) on Friday morning of the S&P SmallCap 600 Index.
*Please refer to CME Rules for official specifications.

CME 2005 Equity Index Futures and Options Information Guide 35
NASDAQ-100 Index Futures & Options Contract Highlights*
The NASDAQ-100 is a modified capitalization-weighted index of 100 of the largest and most active non-financial, domestic stocks traded on The NasdaqStock Market. The index is computed and distributed by The Nasdaq Stock Market.
FUTURES OPTIONS
OPENING DATE April 10, 1996
TICKER SYMBOL ND Calls: ND Puts: ND
CONTRACT SIZE $100 x NASDAQ-100 Index futures price One NASDAQ-100 futures contract
STRIKE PRICES N/A 5-point intervals for nearest contracts,10-point intervals for deferred months
MINIMUM PRICE .50 index points = $50 per contract .05 index points = $5 per contractFLUCTUATION (TICK) (Futures calendar spreads: .05 index points = $5 per contact)
TRADING HOURS 8:30 a.m. – 3:15 p.m. (Open Outcry)(CHICAGO TIME) 3:30 p.m. – 8:15 a.m. (CME Globex platform)
(On Sundays CME Globex trading begins at 5:00 p.m. Daily shutdown for maintenance is 4:30 p.m. – 5:00 p.m.)
CONTRACT MONTHS March, June, September, December All 12 calendar months
LAST DAY OF TRADING The Thursday prior to the third Friday March, June, September, December: same dateof the contract month as underlying futures contract; other eight months:
the third Friday of the contract month
POSITION LIMITS 10,000 net long or short in all contract 10,000 futures-equivalent contracts net on the samemonths combined side of the market in all contract months combined
QUARTERLY FUTURES AND OPTIONS SETTLEMENT PROCEDURES: Cash settlement. All open positions at the close of the final trading day are settled incash to the Special Opening Quotation (see Special Opening Quotations) on Friday morning of the NASDAQ-100 Index, computed from a five-minute volume-weighted average of each component stock’s opening prices.
OPTION EXERCISE: American Style. An option can be exercised until 7:00 p.m. (Chicago time) on any business day the option is traded. An option that is in-the-money, and has not been exercised prior to the termination of trading shall, in the absence of contrary instructions, be delivered to the Clearing House by7:00 p.m. on the day of determination of the Final Settlement Price, and be automatically exercised.
*Please refer to CME Rules for official specifications.

36 cme.com
E-mini NASDAQ-100 Index Futures Contract Highlights*
The NASDAQ-100 is a modified capitalization-weighted index of 100 of the largest and most active non-financial, domestic stocks traded on The NasdaqStock Market. The index is computed and distributed by The Nasdaq Stock Market.
FUTURES OPTIONS
OPENING DATE June 21, 1999 November 22, 2004
TICKER SYMBOL NQ Calls NQ Puts NQ
CONTRACT SIZE $20 x E-mini NASDAQ-100 futures price One E-mini NASDAQ-100 futures contract
STRIKE PRICES NA 5-point intervals for two nearest contracts10-point intervals for deferred months
MINIMUM PRICE .50 index points = $10 per contract .05 index points = $1FLUCTUATION (TICK) (Futures calendar spreads: .05 index points = $1 per contact)
TRADING HOURS Virtually 24-hour trading on the CME Globex platform(CHICAGO TIME) (Sundays from 5:00 p.m. to Fridays 3:15 p.m. Daily shutdown for
maintenance is 4:30 p.m. – 5:00 p.m.)
CONTRACT MONTHS March, June, September, December All 12 calendar months
LAST DAY OF TRADING Trading can occur up to 8:30 a.m. (Chicago time) March, June, September, December: same date as underlyingon the third Friday of the contract month futures contract; other eight months: the third Friday of the
contract month
POSITION LIMITS Position limits work in conjunction withexisting NASDAQ-100 position limits
QUARTERLY FUTURES SETTLEMENT PROCEDURES: Cash settlement. All open positions at the close of the final trading day are settled in cash to the SpecialOpening Quotation (see Special Opening Quotations) on Friday morning of the NASDAQ-100 Index, computed from a five-minute volume-weighted averageof each component stock’s opening prices.
OPTION EXERCISE: American Style. An option can be exercised until 7:00 p.m. (Chicago time) on any business day the option is traded. An option that is in-the-money, and has not been exercised prior to the termination of trading shall, in the absence of contrary instructions, be delivered to the Clearing House by7:00 p.m. on the day of determination of the Final Settlement Price, and be automatically exercised.
*Please refer to CME Rules for official specifications.

CME 2005 Equity Index Futures and Options Information Guide 37
E-mini NASDAQ Composite Index Futures Contract Highlights*
The NASDAQ Composite is a capitalization-weighted index that is designed to represent the performance of NASDAQ securities and includes over 3,000stocks. The index is computed and distributed by The Nasdaq Stock Market.
FUTURES
OPENING DATE October 27, 2003
TICKER SYMBOL QCN
CONTRACT SIZE $20 x E-mini NASDAQ Composite futures price
MINIMUM PRICE .50 index points = $10 per contractFLUCTUATION (TICK) (Futures calendar spreads: .05 index points = $1 per contact)
TRADING HOURS Virtually 24-hour trading on the CME Globex platform(CHICAGO TIME) (Sundays from 5:00 p.m. to Fridays 3:15 p.m. Daily shutdown for
maintenance is 4:30 p.m. – 5:00 p.m.)
CONTRACT MONTHS March, June, September, December
LAST DAY OF TRADING Trading can occur up to 8:30 a.m. (Chicago time)on the third Friday of the contract month
POSITION LIMITS 25,000 net long or short in all contract months combined
QUARTERLY FUTURES SETTLEMENT PROCEDURES: Cash settlement. All open positions at the close of the final trading day are settled in cash to the SpecialOpening Quotation (see Special Opening Quotations) on Friday morning of the NASDAQ Composite Index, computed from a five-minute volume-weightedaverage of each component stock’s opening prices, with a cut-off time of 9:30 a.m. Chicago time.
*Please refer to CME Rules for official specifications.

38 cme.com
Russell 2000 Index Futures & Options Contract Highlights*
The Russell 2000 is a capitalization-weighted index of approximately 2,000 actively traded, small-capitalization U.S. stocks. These stocks are traded on the NewYork Stock Exchange, the American Stock Exchange and The Nasdaq Stock Market. The index is computed and distributed by the Frank Russell Company.
FUTURES OPTIONS
OPENING DATE February 4, 1993
TICKER SYMBOL RL Calls: RL Puts: RL
CONTRACT SIZE $500 x the Russell 2000 Index futures price One Russell 2000 futures contract
STRIKE PRICES N/A 2.5-point intervals for two nearest contracts, 5-point intervals for deferred months
MINIMUM PRICE .05 index points = $25 per contractFLUCTUATION (TICK)
TRADING HOURS 8:30 a.m. – 3:15 p.m. (Open Outcry) (CHICAGO TIME) 3:30 p.m. – 8:15 a.m. (CME Globex platform, futures only)
(On Sundays, CME Globex trading begins at 5:00 p.m. Daily shutdown for maintenance is 4:30 p.m – 5:00 p.m.)
CONTRACT MONTHS March, June, September, December All 12 calendar months
LAST DAY OF TRADING The Thursday prior to the third Friday March, June, September, December: same dateof the contract month as underlying futures contract; other 8 months:
the third Friday of the contract month
POSITION LIMITS 5,000 net long or short in all contract 5,000 futures-equivalent contracts net on the samemonths combined side of the market in all contract months combined
QUARTERLY FUTURES AND OPTIONS SETTLEMENT PROCEDURES: Cash settlement. All open positions at the close of the final trading day are settled incash to the Special Opening Quotation (see Special Opening Quotations) on Friday morning of the Russell 2000 Index.
OPTION EXERCISE: American Style. An option can be exercised until 7:00 p.m. (Chicago time) on any business day the option is traded. An option that is in-the-money, and has not been exercised prior to the termination of trading shall, in the absence of contrary instructions, be delivered to the Clearing House by7:00 p.m. on the day of determination of the Final Settlement Price, and be automatically exercised.
*Please refer to CME Rules for official specifications.

CME 2005 Equity Index Futures and Options Information Guide 39
E-mini Russell 2000 Index Futures Contract Highlights*
The Russell 2000 is a capitalization-weighted index of approximately 2,000 actively traded, small-capitalization U.S. stocks. These stocks are traded on the NewYork Stock Exchange, the American Stock Exchange and The Nasdaq Stock Market. The index is computed and distributed by the Frank Russell Company.
FUTURES OPTIONS
OPENING DATE October 24, 2001 February 14, 2005
TICKER SYMBOL ER2 Calls: ER2 Puts: ER2
CONTRACT SIZE $100 x E-mini Russell 2000 Index futures price One E-mini Russell 2000 futures contract
STRIKE PRICES N/A 2.5-point intervals for two nearest contracts, 5-point intervals for deferred months
MINIMUM PRICE .10 index points = $10 per contractFLUCTUATION (TICK) (Futures calendar spreads: .05 index points = $5 per contract)
TRADING HOURS Virtually 24-hour trading on the CME Globex platform(CHICAGO TIME) (Sundays from 5:00 p.m. to Fridays 3:15 p.m. Daily shutdown for
maintenance is 4:30 p.m. - 5:00 p.m.)
CONTRACT MONTHS March, June, September, December All 12 calendar months
LAST DAY OF TRADING Trading can occur up to 8:30 a.m. (Chicago time) March, June, September, December: same date on the third Friday of the contract month as underlying futures contract, other eight months:
the third Friday of the contract month
POSITION LIMITS Position limits work in conjunction withexisting Russell 2000 position limits
QUARTERLY FUTURES SETTLEMENT PROCEDURES: Cash settlement. All open positions at the close of the final trading day are settled in cash to the SpecialOpening Quotation (see Special Opening Quotations) on Friday morning of the Russell 2000 Index.
OPTION EXERCISE: American Style. An option can be exercised until 7:00 p.m. (Chicago time) on any business day the option is traded. An option that is in-the-money, and has not been exercised prior to the termination of trading shall, in the absence of contrary instructions, be delivered to the Clearing House by7:00 p.m. on the day of determination of the Final Settlement Price, and be automatically exercised.
*Please refer to CME Rules for official specifications.

40 cme.com
E-mini Russell 1000* Index Futures Contract Highlights**
The Russell 1000 is a capitalization-weighted index of approximately 1,000 actively traded, small-capitalization U.S. stocks. These stocks are traded on the NewYork Stock Exchange, the American Stock Exchange and The Nasdaq Stock Market. The index is computed and distributed by the Frank Russell Company.
FUTURES
opening date April 28, 2003
Ticker Symbol RS1
Contract Size $100 x Russell 1000 Index futures price
Minimum Price .10 index points = $10 per contractFluctuation (Tick) (Futures calendar spreads: .05 index points = $5 per contract)
Trading Hours Virtually 24-hour trading on the CME Globex platform(Chicago Time) (Sundays from 5:00 p.m. to Fridays 3:15 p.m. Daily shutdown for
maintenance is 4:30 p.m. – 5:00 p.m.)
Contract Months March, June, September, December
Last Day of Trading Trading can occur up to 8:30 a.m. (Chicago time)on the third Friday of the contract month
Position Limits 25,000 net long or short in all contract months combined
QUARTERLY FUTURES SETTLEMENT PROCEDURES: Cash settlement. All open positions at the close of the final trading day are settled in cash to the SpecialOpening Quotation (see Special Opening Quotations) on Friday morning of the Russell 1000 Index.
CME changed the name of this contract from the Russell 1000 to the E-mini Russell 1000 on February 14, 2005. All aspects of the contract remained the same; only the name was changed.
Please refer to CME Rules for official specifications. **
*

CME 2005 Equity Index Futures and Options Information Guide 41
S&P 500/Barra Growth Index Futures & Options Contract Highlights*
The S&P 500/BARRA Growth Index is a capitalization-weighted index of large, actively traded U.S. stocks. These stocks are traded on the New York StockExchange, the American Stock Exchange and The Nasdaq Stock Market. The primary calculator for the S&P 500/BARRA Growth Index is Reuters.
FUTURES OPTIONS
OPENING DATE November 6, 1995
TICKER SYMBOL SG Calls: SG Puts: SG
CONTRACT SIZE $250 x the S&P 500/BARRA Growth Index futures price One S&P 500/BARRA Growth futures contract
STRIKE PRICES N/A 2.5-point intervals for two nearest contracts,5-point intervals for deferred months
MINIMUM PRICE .10 index points = $25 per contractFLUCTUATION (TICK) (Futures calendar spreads: .05 index points = $12.50 per contact)
TRADING HOURS Virtually 24-hour trading on the CME Globex platform(CHICAGO TIME) (Sundays from 5:00 p.m. to Fridays 3:15 p.m. Daily shutdown for maintenance is 4:30 p.m. – 5:00 p.m.)
CONTRACT MONTHS March, June, September, December All 12 calendar months
LAST DAY OF TRADING The Thursday prior to the third Friday March, June, September, December: same dateof the contract month as underlying futures contract; other 8 months:
the third Friday of the contract month
POSITION LIMITS 20,000 net long or short in all S&P 500/BARRA Growth, 20,000 futures-equivalent S&P 500/BARRA Growth, ValueValue and S&P 500 contract months combined and S&P 500 contracts net on the same side of the market
in all contract months combined
QUARTERLY FUTURES AND OPTIONS SETTLEMENT PROCEDURES: Cash settlement. All open positions at the close of the final trading day are settled in cashto the Special Opening Quotation (see Special Opening Quotations) on Friday morning of the S&P 500/BARRA Growth Index.
OPTION EXERCISE: American Style. An option can be exercised until 7:00 p.m. (Chicago time) on any business day the option is traded. An option that is in-the-money, and has not been exercised prior to the termination of trading shall, in the absence of contrary instructions, be delivered to the Clearing House by7:00 p.m. on the day of determination of the Final Settlement Price, and be automatically exercised.
*Please refer to CME Rules for official specifications.

42 cme.com
S&P 500/Barra Value Index Futures & Options Contract Highlights*
S&P 500/BARRA Value Index Futures and Options are based on and designed to track the S&P 500/BARRA Value Index, a capitalization-weighted index oflarge, actively traded U.S. stocks. These stocks are traded on the New York Stock Exchange, the American Stock Exchange and The Nasdaq Stock Market. Theprimary calculator for the S&P 500/BARRA Value Index is Reuters.
FUTURES OPTIONS
OPENING DATE November 6, 1995
TICKER SYMBOL SU Calls: SU Puts: SU
CONTRACT SIZE $250 x the S&P 500/BARRA Value Index futures price One S&P 500/BARRA Value futures contract
STRIKE PRICES N/A 2.5-point intervals for two nearest contracts,5-point intervals for deferred months
MINIMUM PRICE .10 index points = $25 per contractFLUCTUATION (TICK) (Futures calendar spreads: .05 index points = $12.50 per contract)
TRADING HOURS Virtually 24-hour trading on the CME Globex platform(CHICAGO TIME) (Sundays from 5:00 p.m. to Fridays 3:15 p.m. Daily shutdown for maintenance is 4:30 p.m. – 5:00 p.m.)
CONTRACT MONTHS March, June, September, December All 12 calendar months
LAST DAY OF TRADING Thursday prior to the third Friday March, June, September, December: same dateof the contract month as underlying futures contract; other 8 months:
the third Friday of the contract month)
POSITION LIMITS 20,000 net long or short in all S&P 500/BARRA Value, 20,000 futures-equivalent S&P 500/BARRA Value, GrowthGrowth and S&P 500 contract months combined and S&P 500 contracts net on the same side of the market in
all contract months combined
QUARTERLY FUTURES AND OPTIONS SETTLEMENT PROCEDURES: Cash settlement. All open positions at the close of the final trading day are settled in cash to the Special Opening Quotation (see Special Opening Quotations) on Friday morning of the S&P 500/BARRA Value Index.
OPTION EXERCISE: American Style. An option can be exercised until 7:00 p.m. (Chicago time) on any business day the option is traded. An option that is in-the-money, and has not been exercised prior to the termination of trading shall, in the absence of contrary instructions, be delivered to the Clearing House by7:00 p.m. on the day of determination of the Final Settlement Price, and be automatically exercised.
*Please refer to CME Rules for official specifications.

CME 2005 Equity Index Futures and Options Information Guide 43
Financial SPCTR Futures Contract Highlights*
CME Financial SPCTR futures are based on and designed to track the S&P 500 Financial Sector Index, a capitalization-weighted index of large-cap activelytraded U.S. financial stocks. These stocks are traded on the New York Stock Exchange, the American Stock Exchange and the Nasdaq Stock Market. The pri-mary calculator for the Financial Sector Index is Standard & Poor’s.
FUTURES
OPENING DATE September 23, 2002
TICKER SYMBOL FIN
CONTRACT SIZE $125 x Financial SPCTR futures price
MINIMUM PRICE .10 index points = $12.50 FLUCTUATION (TICK) (Futures calendar spreads: .05 index points = $6.25 per contact)
TRADING HOURS Virtually 24-hour trading on the CME Globex platform(CHICAGO TIME) (Sundays from 5:00 p.m. to Fridays 3:15 p.m. Daily shutdown for
maintenance is 4:30 p.m. – 5:00 p.m.)
CONTRACT MONTHS March, June, September, December
LAST DAY OF TRADING Trading can occur up to 8:30 a.m. (Chicago time) on the third Friday of the contract month
POSITION LIMITS 25,000
QUARTERLY FUTURES SETTLEMENT PROCEDURES: Cash settlement. All open positions at the close of the final trading day are settled in cash to the SpecialOpening Quotation (see Special Opening Quotations) on Friday morning of the Financial SPCTR Index.
*Please refer to CME Rules for official specifications.

44 cme.com
Technology SPCTR Futures Contract Highlights*
CME Technology SPCTR futures are based on and designed to track the S&P 500 Technology Sector Index, a capitalization-weighted index of large-cap actively traded Technology and Telecom stocks. The stocks are traded on the New York Stock Exchange, American Stock Exchange and the Nasdaq StockMarket. The primary calculator for the Technology Sector Index is Standard and Poor’s.
FUTURES
OPENING DATE September 23, 2002
TICKER SYMBOL TEC
CONTRACT SIZE $125 x Technology SPCTR futures price
MINIMUM PRICE .10 index points = $12.50 FLUCTUATION (TICK) (Futures calendar spreads: .05 index points = $6.25 per contact)
TRADING HOURS Virtually 24-hour trading on the CME Globex platform(CHICAGO TIME) (Sundays from 5:00 p.m. to Fridays 3:15 p.m. Daily shutdown for
maintenance is 4:30 p.m. - 5:00 p.m.)
CONTRACT MONTHS March, June, September, December
LAST DAY OF TRADING Trading can occur up to 8:30 a.m. (Chicago time) on the third Friday of the contract month
POSITION LIMITS 25,000
QUARTERLY FUTURES SETTLEMENT PROCEDURES: Cash settlement. All open positions at the close of the final trading day are settled in cash to the SpecialOpening Quotation (see Special Opening Quotations) on Friday morning of the Technology SPCTR Index.
*Please refer to CME Rules for official specifications.

CME 2005 Equity Index Futures and Options Information Guide 45
Nikkei 225 Futures & Options Contract Highlights*
Please note that there are some salient differences in contract specificationsamong the products in the CME Nikkei 225 Futures Complex.
DOLLAR-DENOMINATED YEN-DENOMINATED
TICKER SYMBOLS Open Outcry: NK Open Outcry: Not applicableCME Globex Platform: NKD CME Globex Platform: NIY
CONTRACT SIZE $ 5.00 times Nikkei ¥ 500 times Nikkei 225 225 futures price futures price
PRICE FLUCTUATION 5 index points = 5 index points = (TICK): $25 per contract ¥ 2,500 per contract
CONTRACT MONTHS Mar, Jun, Sep, Dec Mar, Jun, Sep, Dec
OPEN OUTCRY HOURS 08:00 – 15:15 Not applicable(CENTRAL TIME)
GLOBEX TRADING HOURS 03:00 – 15:15 06:00 – 15:15(DAYLIGHT SAVING TIME) reopens 15:30 – 16:30 reopens 15:30 – 16:30
closes 16:30 – 17:00 closes 16:30 – 17:00reopens 17:00 – 18:00 reopens 17:00 – 18:00
GLOBEX TRADING HOURS 02:00 – 15:15 05:00 – 15:15(CENTRAL STANDARD TIME) reopens 15:30 – 16:30 reopens 15:30 – 16:30
closes 16:30 closes 16:30
DAILY SETTLEMENT TIME All trades executed after 15:15 settlement time will havethe next day’s trade date
PRICE LIMITS* Lead Month Settlement Daily Limit (Index Points)0 – 20,000 1,00020,005 – 30,000 1,50030,005 and up 2,000
POSITION LIMITS 5,000 contracts 5,000 contracts
LAST TRADING DAY Business day preceding the second Friday of the contractmonth
FINAL SETTLEMENT PRICE Price Based upon a Special Opening Quotation of theNikkei 225 Stock Average referencing the opening valuesof constituent stocks
Options on dollar-denominated Nikkei 225 futures
OPTIONS
TICKER SYMBOLS Calls: KN Puts: JN
UNDERLYING One dollar-denominated Nikkei 225 Stock Average futurescontract
OPEN OUTCRY HOURS 08:00 – 15:15(CENTRAL TIME)
MINIMUM PRICE Five index points ($25.00)FLUCTUATION (TICK)
CONTRACT MONTHS All 12 calendar months
LAST DAY OF TRADING Quarterly options: same date as underlying futuresOther eight months: the third Friday of the contract month
POSITION LIMITS 5,000 futures-equivalent contracts net on the same side ofthe market in all contract months combined
LAST TRADING DAY Business day preceding the second Friday of the contract month
FINAL SETTLEMENT PRICE Based upon a Special Opening Quotation of the Nikkei 225 Stock Average referencing the opening values of constituent stocks
SETTLEMENT Cash settlement to the Special Opening Quotation of the Nikkei
PROCEDURES Stock Average
OPTION EXERCISE American Style. An option can be exercised until 7:00 p.m.Chicago time on any business day the option is traded. Anoption that is in the money, and has not been exercisedprior to the termination of trading shall, in the absence ofcontrary instructions, be delivered to the Clearing Houseby 7:00 p.m. on the day of determination of the FinalSettlement Price, and be automatically exercised.
*Applicable to both yen- and dollar-denominated contracts

46 cme.com
Nikkei 225 Futures Comparison Chart
EXCHANGE:
START DATE:
CONTRACT SIZE:
PRICE FLUCTUATION(TICK):
CONTRACT MONTHS:
TRADING HOURS:(CHICAGO TIME)
LAST TRADING DAY:
SETTLEMENT:
SETTLEMENT PRICE:
CME $ BASED
September 25, 1990
$5 x Nikkei 225 Stock Average
5 Index points =$25.00 per contract
Mar, Jun, Sep, Dec
During daylight saving time: 3:00 –15:15 (settlement at 15:15), reopeningfrom 15:30 – 16:30, closing from 16:30– 17:00, reopening from 17:00 – 18:00[All trades executed after the 15:15settlement will have the next day’strade date.]
During standard time: 2:00 – 15:15(settlement at 15:15), reopening from15:30 – 16:30 [All trades executedafter the 15:15 settlement will havethe next day’s trade date.]
Chicago time: 8:00 a.m. – 3:15 p.m. (Open Outcry only)
The business day preceding thedetermination of the FinalSettlement Price, usually the businessday preceding the second Friday ofthe contract month.
Cash
Cash settlement. Nikkei futures settleto the Special Opening Quotation(SOQ) of the Nikkei Stock Average,used to settle the Nikkei StockAverage futures at the OsakaSecurities Exchange.
CME ¥ BASED
February 23, 2004
¥500 x Nikkei 225 Stock Average
5 Index points =¥2,500 per contract
Mar, Jun, Sep, Dec
During daylight saving time: 6:00 –15:15 (settlement at 15:15), reopeningfrom 15:30 – 16:30, closing from 16:30– 17:00, reopening from 17:00 – 18:00[All trades executed after the 15:15settlement will have the next day’strade date.]
During standard time: 5:00 - 15:15 (settlement at 15:15), reopening from15:30 – 16:30 [All trades executedafter the 15:15 settlement will havethe next day’s trade date.]
The business day preceding thedetermination of the FinalSettlement Price, usually the businessday preceding the second Friday ofthe contract month.
Cash
Cash settlement. Nikkei futures settleto the Special Opening Quotation(SOQ) of the Nikkei Stock Average,used to settle the Nikkei StockAverage futures at the OsakaSecurities Exchange.
Osaka
September 3, 1988
¥1,000 x Nikkei 225 Stock Average
10 Index points =¥10,000 per contract
Same
Japan time: 9:00 a.m. - 11:00 a.m. &12:30 p.m. - 3:00 p.m.
The business day before the secondFriday of each expiration month. If thesecond Friday is a holiday in Japan, thelast trading day is two business daysbefore the second Friday. All publicholidays in Japan are recognized holidays for this contract.
Cash
Same
SGX
September 3, 1986
¥500 x Nikkei 225 Stock Average
5 Index points =¥2,500 per contract
Same
Japan time:9:00 a.m. - 11:15 a.m. & 12:15 p.m. -3:15 p.m.
Singapore time: 8:00 a.m. - 10:15a.m. & 11:15 a.m. - 2:15 p.m.
Same as Osaka
Cash
Same as Osaka

CME 2005 Equity Index Futures and Options Information Guide 47
Equity Index FLEX Options
S&P 500 S&P 500 S&P Russell
S&P 500 BARRA/Growth BARRA/Value MidCap 400 2000 NASDAQ-100 Nikkei 225
Trading Hours 8:00 a.m.-
(Chicago Time) 8:30 a.m. - 3:15 p.m.3:15 p.m.
Minimum StrikePrice Interval .10 0.05 5
(Index Points)
Option & Call or Put
Exercise Style American or European
Expiration Any business day between creation of the option and the expiration date
Date of the underlying futures contract
Underlying Any underlying futures contract currently available for trading
Contract
Request for • New RFQs can be submitted 5 minutes prior to the opening of trading until 15 minutes before the close
Quote • 10-contract minimum
• 5-minute minimum response time interval required
Note: Equity Index FLEX Options began trading on April 21, 1995

1. Q. What are CME FLEX options?
A. CME flexible options are enhancements to the Exchange’s optionson financial futures. Standard American-style CME options have predefined strike prices, listing procedures, and expiration dates.Flexible options allow users to more precisely tailor the followingoption contract terms to their specific needs:
• Expiration Date—Expiration dates for CME Equity Index FLEXoptions may be specified for any Exchange business day up to andincluding the day of determination of the Final Settlement price of the underlying futures. A new flexible option series may not beopened on its last day of trading.
• Underlying Futures—The underlying futures contract may be chosenindependent of the flexible option expiration date. Any equityindex futures contract eligible for trading may be specified as theunderlying for a CME FLEX option. For example, a December 14,2000, S&P 500 FLEX option could have a September 2001 S&P 500 futures contract as the underlying.
• Strike Price—Flexible option strike prices need not be within the standard option strike ranges. A wide range of strike prices and strike intervals, as fine as an underlying futures tick, may be specified.
• Exercise Style—American- or European-style exercise may be specified.
• Spreads and Combinations—Flexible options may trade in CME recognized combinations, but not with standard options.
• Minimum Order Sizes—Because of the specialized nature of flexible options, equity index flexible options require a minimumorder of 10 FLEX options.
2. Q. What are CME FLEX options trading hours?
A. Flexible options have the same trading hours as standard options,but with the following exceptions: no new Request-For-Quote (RFQ) may be initiated within the last 15 minutes of trading. An RFQmay be submitted up to 5 minutes before the opening of tradinghours; however, trading may not begin until the standard optionstrading begins.
3. Q. How is a flexible option trade initiated and executed?
A. The specialized nature of flexible options trading requires severaladjustments to the standard trade execution process. A five-stepprocedure for the trading and execution of FLEX options is outlined below:
i) Completing and submitting an RFQ card—Trading of flexible options is initiated by RFQs. A bid, offer or two-sided market may be requested. The RFQ card must be delivered to the Exchange’sdesignated flexible option official.
ii) Response Time Interval—Once the RFQ is validated (i.e., theterms of the proposed RFQ qualify as a flexible options trade), a Response Time Interval of five minutes is required, the interval between when the RFQ is validated and when open out-cry trading can begin on that RFQ. The Response Time Intervalallows traders on the floor and other market participants to pricethe requested flexible option.
iii) Open outcry FLEX option trading—Once the Response TimeInterval has elapsed, open outcry trading can begin on the RFQ(bidding or offering may occur at any time during the RTH ses-sion). All Exchange rules governing open outcry trading apply during this process.
48 cme.com
Frequently Asked Questions: FLEX Options

CME 2005 Equity Index Futures and Options Information Guide 49
iv) Post trade pit-side matching—Once the mandatory flexibleoption order form is submitted to the Exchange, a flexible optionconfirmation printout will be generated. All parties to the trademust endorse this printout. Because a large variety of negotiableterms can be specified for a FLEX option trade, each party mustverify the explicit terms of the trade before it is submitted forclearing. This confirmation procedure will minimize any potentialout-trades for flexible options.
v) Back-office—Following endorsement, the flexible option trade is considered matched and the relevant information is transmittedto the clearing firm where the remaining trade information is submitted.
4. Q. What information must be specified for a FLEX option RFQ?
A. In all cases, each FLEX option and all legs of a FLEX option combina-tion must be explicitly specified. Generally, the following information is required:
• Quantity
• Commodity and underlying contract month
• FLEX option expiration date
• Exercise style
• Futures contracts legs and quantity for futures/option combinations
• Strike price may be specified explicitly (e.g., 1100.10) or as a number of ticks away from the at-the-money strike (e.g., 5 ticksout-of-the money).
5. Q. Can FLEX options trade in combinations and spreads?
A. Flexible options trading is permitted in any CME recognizedoption/option or option/futures combinations involving puts, calls, or futures, provided that any combination containing flexible options does not contain standard listed options already available for trading.
6. Q. Once a FLEX option is opened, will it ever be fungible with theCME’s other standard options?
A. Because of the unique terms of a given flexible option, in generalthey will not be fungible with standard options. However, if flexibleoptions become listed for trading as standard options then they will be traded only as standard options.
7. Q. Can FLEX options turn into standard options?
A. It is possible for a flexible option to be converted into a standardoption. Any open flexible option with the exact same contract termsas a standard option will be converted to a standard option oncethat standard option is eligible for trading. If the price of the under-lying future moves so that an option will be listed as a standardoption, the FLEX option is automatically converted into a standardoption. A FLEX option that is converted into a standard option can then trade only as a standard option.
8. Q. How can a FLEX option be offset?
A. Once a FLEX option position is opened it can only be offset or liquidated by entering into a reverse transaction in a flexible optionwith the same exact contract terms or, in the case of American style flexible options, by exercising the option.

50 cme.com
9. Q. How are open FLEX options settled on a daily basis?
A. The Exchange publishes flexible option settlements every day. The pit committees responsible for settling standard options havethe authority and responsibility to determine daily flexible option settlements. In order to settle flexible options in a timely manner,manual procedures may not always be feasible. The Exchange hasdeveloped several calculation tools to assist the pit committees.
• These calculations use appropriate option pricing models that takeinto account exercise style, strike price, underlying futures, and time to expiration for each flexible option. Flexible options settle-ment procedures use implied volatilities based upon related standard option settlements to derive a volatility estimate for eachflexible option.
10. Q. How are FLEX options affected by price limits?
A. For markets with price limits, FLEX options trading is determined by price limits and halts in the respective underlying primary markets. If standard options trading is halted, FLEX options trading also is halted.
11. Q. How do FLEX option exercise and assignment work?
A. FLEX option exercise and assignment work the same as for standardoptions; however, flexible options have special forms.
• As with standard options at expiration, all in-the-money FLEXoptions will be automatically exercised and out-of-the-money FLEX options automatically abandoned, unless explicit instructionshave been submitted to the contrary. A flexible option withEuropean-style exercise may be exercised by the buyer only on the day that the option expires.
• A flexible option with American-style exercise may be exercised by the buyer on any business day that the option is available for trading and also on its expiration date. To exercise the option,the clearing member representing the buyer shall present an exercise notice to the Clearing House by 7:00 p.m. Chicago timeon the day of exercise.
12. Q. What time of day can a FLEX option be exercised?
A. The owner of an American-style flexible option may exercise theoption at any time of the day, but assignment of that exercisedoption takes place following the RTH session. Remember, the under-lying of a flexible option at CME is a futures contract. Exercising a flexible option takes place under similar procedures as standardoptions; exercise and assignment take place after the RTH session.
13. Q. How is performance bond calculated for FLEX options? Are thereany modifications to SPAN?
A. Flexible option positions are included in the portfolios processed usingSPAN. For example, the total portfolio performance bond requirementfor the S&P 500 futures and options will reflect positions in:
• S&P 500 futures;
• standard American options on those futures;
• flexible American options on those futures;
• flexible European options on those futures.
There are absolutely no changes to the SPAN methodology resultingfrom the introduction of FLEX options at the CME. There are, however,some minor changes to the layout of the daily SPAN risk parameter file, and a new version of PC-SPAN is available.

CME 2005 Equity Index Futures and Options Information Guide 51
14. Q. Will FLEX options have an impact on position limits?
A. Yes, all flexible options positions are aggregated with positions heldin standard products; the aggregate position will then be used forposition limit purposes.
15. Q. How can interested parties find out which RFQs are available?
A. RFQs are transmitted as a text message over the CME ticker system.Dedicated monitors in the relevant pits on the trading floor also display the RFQ information.
16. Q. How can I obtain CME Equity Index FLEX Option quotes?
A. CME FLEX Option quotes are available on the following quotationservice:
• Reuters: FLEXOPT (provides information on how to retrieve all of the Exchange’s flexible options)
For example, to retrieve individual CME flexible options: SP/FLX(A-Z)

JANUARYS M T W T F S
1 2 3 4 5 6 7
8 9 10 11 12 13 14
15 16 17 18 19 20 21
22 23 24 25 26 27 28
29 30 31
MAYS M T W T F S
1 2 3 4 5 6
7 8 9 10 11 12 13
14 15 16 17 18 19 20
21 22 23 24 25 26 27
28 29 30 31
APRILS M T W T F S
1
2 3 4 5 6 7 8
9 10 11 12 13 14 15
16 17 18 19 20 21 22
23 24 25 26 27 28 29
30
JUNES M T W T F S
1 2 3
4 5 6 7 8 9 10
11 12 13 14 15 16 17
18 19 20 21 22 23 24
25 26 27 28 29 30
FEBRUARYS M T W T F S
1 2 3 4
5 6 7 8 9 10 11
12 13 14 15 16 17 18
19 20 21 22 23 24 25
26 27 28
2 0 0 6
MARCHS M T W T F S
1 2 3 4
5 6 7 8 9 10 11
12 13 14 15 16 17 18
19 20 21 22 23 24 25
26 27 28 29 30 31
2 0 0 5
JANUARYS M T W T F S
1
2 3 4 5 6 7 8
9 10 11 12 13 14 15
16 17 18 19 20 21 22
23 24 25 26 27 28 29
30 31
FEBRUARYS M T W T F S
1 2 3 4 5
6 7 8 9 10 11 12
13 14 15 16 17 18 19
20 21 22 23 24 25 26
27 28
APRILS M T W T F S
1 2
3 4 5 6 7 8 9
10 11 12 13 14 15 16
17 18 19 20 21 22 23
24 25 26 27 28 29 30
MAYS M T W T F S
1 2 3 4 5 6 7
8 9 10 11 12 13 14
15 16 17 18 19 20 21
22 23 24 25 26 27 28
29 30 31
OCTOBERS M T W T F S
1
2 3 4 5 6 7 8
9 10 11 12 13 14 15
16 17 18 19 20 21 22
23 24 25 26 27 28 29
30 31
NOVEMBERS M T W T F S
1 2 3 4 5
6 7 8 9 10 11 12
13 14 15 16 17 18 19
20 21 22 23 24 25 26
27 28 29 30
MARCHS M T W T F S
1 2 3 4 5
6 7 8 9 10 11 12
13 14 15 16 17 18 19
20 21 22 23 24 25 26
27 28 29 30 31
JUNES M T W T F S
1 2 3 4
5 6 7 8 9 10 11
12 13 14 15 16 17 18
19 20 21 22 23 24 25
26 27 28 29 30
SEPTEMBERS M T W T F S
1 2 3
4 5 6 7 8 9 10
11 12 13 14 15 16 17
18 19 20 21 22 23 24
25 26 27 28 29 30
DECEMBERS M T W T F S
1 2 3
4 5 6 7 8 9 10
11 12 13 14 15 16 17
18 19 20 21 22 23 24
25 26 27 28 29 30 31
AUGUSTS M T W T F S
1 2 3 4 5 6
7 8 9 10 11 12 13
14 15 16 17 18 19 20
21 22 23 24 25 26 27
28 29 30 31
JULYS M T W T F S
1 2
3 4 5 6 7 8 9
10 11 12 13 14 15 16
17 18 19 20 21 22 23
24 25 26 27 28 29 30
31
52 cme.com
2005 Index Trading Calendar
E-mini S&P 500 quarterly futures and options, E-mini NASDAQ-100 quarterly futures& options, E-mini NASDAQ Composite futures, E-mini Russell 2000 quarterlyfutures & options, E-mini Russell 1000 futures, E-mini S&P MidCap 400 futures, S&PSmallCap 600 futures, and SPCTR futures last trading day. Trading can occur up to8:30 a.m. Chicago time on the last trading day for the quarterly E-mini S&P 500futures and options, the E-mini NASDAQ-100 futures & options, E-mini Russell 2000futures & options, E-mini S&P MidCap 400 futures, S&P SmallCap 600 futures, andSPCTR futures.
S&P 500, S&P MidCap 400, Russell 2000, NASDAQ-100, and S&P 500/BARRA Growth & Value quarterly futures and options last trading day
S&P 500, E-mini S&P 500, S&P MidCap 400, Russell 2000, E-mini Russell 2000, NASDAQ-100, E-mini NASDAQ-100, S&P 500/BARRA Growth & Value, and Nikkei 225serial options last trading day
Nikkei 225 quarterly futures & options last trading day

CME 2005 Equity Index Futures and Options Information Guide 53
Holiday Calendar—CME Equity Index Holiday Schedule for 2005
HOLIDAY DATE ON WHICH CME EQUITY INDEX QUADRANT CLOSED (TRADING FLOOR CLOSED)
Dr. Martin Luther King Jr. Day Monday, January 17, 2005
President’s Day Monday, February 21, 2005
Good Friday Friday, March 25, 2005
Memorial Day Monday, May 30, 2005
Independence Day Monday, July 4, 2005
Labor Day Monday, September 5, 2005
Thanksgiving Day Thursday, November 24, 2005
Christmas Day Monday, December 26, 2005
New Year’s Day Monday, January 2, 2006
Note: This is a tentative schedule. Please contact CME for specific closings or visit the CME Web site at www.cme.com

Contract Specifications and Overview
1. Q. How are the E-mini contracts similar to their larger counterpartcontracts?
A. The E-minis and the larger contracts are based on the same underly-ing index (e.g., S&P 500, S&P MidCap 400, NASDAQ-100 andRussell 2000 Indexes).
• The E-minis and the larger contracts are cash-settled to the same indexvalues on quarterly expirations, (the Special Opening Quotation).
• The E-minis and the larger contracts settle daily to the larger contracts’ settlement price.
2. Q. How are E-mini contracts different from the larger contracts?
A. The E-mini contract values are one-fifth the size of the larger contracts.
• The E-mini tick sizes are different.
E-mini S&P 500 tick size is .25, or $12.50 per tick (.05 for calendarspreads = $2.50 per tick) versus a tick size of .10, or $25 per tick (.05 forcalendar spreads = $12.50 per tick) for the big S&P 500 futures contract.
E-mini S&P Midcap 400 tick size is .10, or $10 per tick (.05 for calendarspreads = to $5 per tick) versus a tick size of .05, or $25 per tick (.05 for calendar spreads = $25.00 per tick for the big S&P MidCap400 futures contract.
E-mini Russell 2000 tick size is .10, or $10 per tick (.05 for calendarspreads = to $5 per tick) versus a tick size of .05, or $25 per tick (.05 for calendar spreads = to $25 per tick for the big Russell 2000futures contract.
E-mini NASDAQ-100 has the same tick size of .50 as the big NASDAQ futures. However, the dollar value of the E-mini NASDAQ-
100 tick is $10, while the larger NASDAQ-100 futures is $50. Calendarspread trades for both the E-mini NASDAQ-100 and big NASDAQ-100 futures is .05. The dollar value of the E-mini NASDAQ-100 calen-dar spread is $1, while the larger NASDAQ-100 futures is $5.
• Quarterly E-mini futures can trade up until 8:30 a.m., Chicago timeon expiration day.
• E-mini futures have only two quarterly contracts listed for trading.
• An order for any quantity may be accepted for E-mini futures.However, orders exceeding a specified number of contracts asindicated in the table below must be entered on the CME Globexsystem as multiple entries, each of which must not exceed thespecified number of contracts.
Future Order Futures Calendar Entry Quantity Spread Order Entry
Product Restriction Quantity Restriction
E-mini S&P 500 & 1,500 5,000E-mini NASDAQ-100
All other CME stock 500 5,000index futures
During pit trading hours, orders for 31 or more contracts may betraded on an All-or-None (AON) basis via open outcry for the E-mini S&P 500 and E-mini NASDAQ-100 contracts.
• An order for any quantity may be accepted for E-mini calendarspreads. However, calendar spread orders for E-minis exceeding5,000 contracts per contract month must be entered on the CME Globex trading system as multiple entries each of which must not exceed 5,000 contracts.
54 cme.com
Frequently Asked Questions: E-mini Futures

CME 2005 Equity Index Futures and Options Information Guide 55
3. Q. What E-mini futures contracts months are available for trading?
A. There are two futures contract months listed at all times.
4. Q. How do the quarterly E-mini futures settle and when is the lasttime to trade before expiration?
A. E-mini quarterly contracts expire at the same time and to the sameprice as their larger counterpart contracts. For quarterly futures contracts, trading can occur up to 8:30 a.m., Chicago time, on thethird Friday of the month.
5. Q. Do the E-minis have their own circuit breakers?
A. E-mini futures circuit breakers follow the existing larger futures circuitbreakers.
6. Q. Is there a post-settlement session for futures in the E-minis?
A. No.
7. Q. Are E-mini futures calendar spreads available on the CME Globex platform?
A. Calendar spread orders of any quantity are available on the CMEGlobex platform. However, calendar spread orders exceeding 5,000 spread contracts per contract month must be entered on theCME Globex platform as multiple entries each of which must notexceed 5,000 contracts. Trading in the calendar spread may occur at .05-point intervals for the E-mini S&P 500, E-mini NASDAQ-100, E-mini S&P MidCap 400 and E-mini Russell 2000.
8. Q. Are AON calendar spreads allowed in the E-mini S&P 500 and E-mini NASDAQ-100 futures?
A. No.
9. Q. Are E-mini FLEX options available?
A. E-mini FLEX options are not currently available.
10. Q. Is a position of five E-mini futures contracts financially equivalentto a position of one regular sized larger futures contract on thesame side of the market in the same contract month?
A. Yes. The daily settlement prices for the E-mini futures contracts arethe same as the settlement prices for the corresponding contractmonths of the regular-sized contracts. Accordingly, a customer whohas a long position of five E-mini futures contracts and a short position of one regular-sized futures contract in the same contractmonth is perfectly hedged. CME will impose no initial margin (performance bond) requirements on such a hedged position.
11. Q. May a customer liquidate E-mini futures positions against offset-ting positions in the regular sized futures contract without making additional trades in the market?
A. Yes. With the customer’s consent, a clearing member may offset andliquidate E-mini futures positions against offsetting regular-sized futurespositions held in the same account in a 5:1 ratio of E-mini to regular-sized futures contracts. The positions shall be offset at the previousday’s settlement price. The clearing member shall notify the ClearingHouse of offsetting positions by submitting reports to the ClearingHouse through a special online entry screen designed for that purpose.
12. Q. What are the position limits for the E-minis?
A. Position limits work in conjunction with the existing position limits forthe regular sized contracts. The current position limit for S&P 500futures and options is 20,000 futures equivalents net long or short.The limit encompasses all S&P 500 futures, futures options, E-miniS&P 500 futures, and E-mini futures options. For example, with the

E-mini at one-fifth the size of the S&P 500 futures contract, an entity or an account controller could have 100,000 net E-mini S&P 500futures equivalents, if no other S&P 500 positions were held open.The current position limits for NASDAQ-100 are 10,000, while the S&P MidCap 400 and Russell 2000 contracts are 5,000 futures equiva-lents net long or short.
13. Q. What is the reportable position limit for the E-mini contracts?
A. 25 contracts.
56 cme.com
For the E-mini NASDAQ-100 Futures Q&A, please visit the CME Web site at www.cme.com/e-nasdaq

CME 2005 Equity Index Futures and Options Information Guide 57
Price Limits
10%1*
15%1
Down only. Once a limit offer has been established, trading can occur at or above this limit for 102 minutes or until 2:30 p.m. C.T.3 Trading will halt for twominutes if the primary futures is limit offer at the end of the 102 minutes or at 2:30 p.m. C.T.3 Trading will resume with the 10% limit in effect.
Down only. Prior to 1:30 p.m. C.T., trading can occur at or above this limit. If the primary futures is limit offer, and the NYSE has declared a trading halt (due to a10% decline in the DJIA), trading will halt. Trading will resume with the 15% limit in effect when 50% (capitalization weights) of the underlying S&P 500 stocksreopen. After 1:30 p.m. C.T., once a limit offer has been established, trading can occur at or above this limit for 102 minutes. Trading will halt for two minutes ifthe primary futures is limit offer at the end of the 102 minutes. Trading will resume with the 15% limit in effect.
Down only. Once a limit offer has been established, trading can occur at or above this limit for 102 minutes. Trading will halt for two minutes if the primaryfutures is limit offer at the end of the 102 minutes. Trading will resume with the 20% limit in effect.
Down only. Trading can occur at or above this limit. If the primary futures is limit offer and the NYSE has declared a trading halt (due to a 20% decline in theDJIA), trading will halt (see back panel for more details). Trading will resume with the 20% limit in effect when 50% (capitalization weights) of the underlyingS&P 500 stocks reopen (see inside panel for 2nd day limits).
5%1
RULES% DECLINE
20%1*
2ND DAY LIMITS:
If the primary futures contract is limit offer at the 20% limit at the close ofRegular Trading Hours (RTH) and the cash equity markets fall more than 20%,the following RTH trading session will have modified price limits. The 2.5%and 5% limits will still apply. However, the 2nd Day Limits reduce therestraining impact of the 10% limit. The 10% limit would be in effect for 102minutes or until 2:30 p.m. C.T.3 Trading will halt for two minutes if the pri-
mary futures is limit offer at the end of the 102 minutes or at 2:30 p.m. C.T.3Trading will resume with the 15% limit in effect before 2:30 p.m. C.T. and20% after 2:30 p.m. C.T.3 The 15% limit would be in effect for 102 minutesor until 2:30 p.m. C.T.3 Trading will halt for two minutes if the primary futuresis limit offer at the end of the 102 minutes or at 2:30 p.m. C.T.3 Trading willresume with the 20% limit in effect.
1 These levels are set quarterly. 2 This window can be longer or shorter than 10 minutes for the E-mini contracts depending on when the primary big futures reach their corresponding limit.3 45 minutes before the close of an abbreviated trading session.
* NASDAQ-100, E-mini NASDAQ-100 and E-mini NASDAQ Composite futures have slightly different rules for the 10% and 20% limit.
Please see Frequently Asked Questions: Equity Index Price Limits (pp. 58–62, specifically questions 8, 9 and 11).
Please note:E-mini contracts will halt whenever a halt is declared in the primary big futures contract — except at the 10% limit before 1:30 p.m. C.T. and the 20% limit.S&P 500/BARRA Growth and Value are linked to S&P 500 price limits. See CME rules for details.
Current Price Limits can be found on the Internet at: www.cme.com

58 cme.com
To maintain coordinated trading halts under Second Day procedures, tradingwill halt whenever the NYSE declares a halt, regardless of the futures pricelevel. Futures trading will resume only after 50% (capitalization weights) ofthe underlying S&P 500 stocks reopen.
Nikkei 225
The Daily Price Limit for each month is based on the settlement price of the primary futures contract on the last business day of the previousmonth. There is no Daily Price Limit in a contract on its last day of trading. The Daily Price Limit is determined from the following table:
Primary Futures Settlement Daily Limit (Index points)
0 – 20,000 1,000
20,005 – 30,000 1,500
30,005 and up 2,000
Options Procedures:
S&P 500, E-mini S&P 500, S&P MidCap 400, NASDAQ-100, Russell 2000,and S&P 500/BARRA Growth and Value. Whenever the primary futures contract is officially declared at a limit, options trading halts, except at themaximum daily price limit on an option’s last day of trading. When the primary futures contract trades off the limit or the limit expires, options trading resumes.
Nikkei 225: Options on dollar-denominated futures will continue to tradewhen the primary futures contract is at the limit bid or offer.
NYSE Rule 80A
If the DJIA falls or rises 2% from its previous day’s close, index arbitrageorders in S&P 500 stocks must be stabilizing, i.e., “sell plus” or “buyminus.” The 2% is set quarterly.

CME 2005 Equity Index Futures and Options Information Guide 59
S&P 500, E-MINI S&P 500, S&P MIDCAP 400, E-MINI S&P MIDCAP 400,S&P SMALLCAP 600, SPCTR FUTURES, RUSSELL 2000, E-MINI RUSSELL2000, E-MINI RUSSELL 1000, NASDAQ-100, E-MINI NASDAQ-100, E-MININASDAQ COMPOSITE, S&P 500/BARRA GROWTH & VALUE AND NIKKEI225 FUTURES AND OPTIONS
1. Q. How long has CME had price limits (circuit breakers) in equityindex futures and options?
A. Price limits were instituted in 1988 and have changed many timessince then. The current percentage-based price limit system began on April 15, 1998.
2. Q. How often are U.S. equity price limits set?
A. The absolute price limits are set on a quarterly basis and are basedon percentages of 5%, 10%, 15% and 20%. New limits go into effectat the beginning of each calendar quarter.
3. Q. How are price limit levels determined?
A. The percentages (5%, 10%, 15% and 20%) are based on the averageclosing price of the lead month futures contract in December, March,June and September. The average closing price of the lead monthfutures contract determines the level for the next quarter. For S&P 500,E-mini S&P 500, NASDAQ-100, E-mini NASDAQ-100 and E-miniNASDAQ Composite futures, the 10% limit is computed as 10% ofthat average, rounded down to a multiple of 10 index points. The10% limit for S&P MidCap 400, E-mini S&P MidCap 400, S&P 500/BARRA Growth, S&P 500/ BARRA Value, E-mini Russell 1000, Russell2000 and E-mini Russell 2000 futures is rounded down to a multipleof five index points. The 10% limit for the S&P SmallCap 600 andSPCTR futures is rounded down to a multiple of two index points.The 15% limit for S&P 500, E-mini S&P 500, NASDAQ-100,
S&P SmallCap 600, SPCTR futures, E-mini NASDAQ-100 and E-miniNASDAQ Composite futures is equal to 1.5 times the 10% PriceLimit. The 15% limit for S&P MidCap 400, E-mini S&P MidCap 400,S&P 500/BARRA Growth, S&P 500/BARRA Value, E-mini Russell 1000,Russell 2000 and E-mini Russell 2000 futures is equal to 1.5 times the 10% Price Limit rounded down to a multiple of one index point.The 20% limit is twice the 10% limit. The 5% limit is one-half the 10% limit, rounded down to a multiple of one index point.
4. Q. How does the 5% limit work?
A. The 5% limit is initiated if the lead month futures contract is limitoffered. Once this has occurred, the respective limit (when initiated)is in effect for 10 minutes or until 2:30 p.m., whichever comes first.For example, if a limit offer were established at 10:30 a.m. Chicagotime (C.T.), the limit would be in effect for the next 10 minutes. Thismeans you cannot trade below the limit, but it does allow you totrade at or above it. For example, if a limit offer were established at2:25 p.m. C.T., the limit would only be in effect until 2:30 p.m. C.T.(five minutes). Once again, this means that you cannot trade belowthe limit, but it does allow you to trade at or above the limit.
5. Q. What happens after the 10 minutes has expired for the 5% limit?
A. One of two things can happen. If the lead month futures contract is not limit offered after 10 minutes, trading will continue with thenext limit in effect. If the lead month futures contract is limit offeredafter 10 minutes, trading will halt for two minutes. Once the two minutes has expired, trading will resume with the next limit in effect.
6. Q. Is there any time when the 5% limit is not in effect?
A. Yes. The 5% limit is only in effect until 2:30 p.m. C.T.; this limit doesnot apply after 2:30 p.m. C.T.
Frequently Asked Questions: Equity Index Price Limits

60 cme.com
7. Q. How does the 10% limit work for the S&P 500, E-mini S&P 500,S&P MidCap 400, E-mini S&P MidCap 400, S&P SmallCap 600,SPCTR futures, E-mini Russell 1000, Russell 2000, E-mini Russell2000 and S&P 500/BARRA Growth & Value futures?
A. The 10% limit may work in one of two ways:
1) Prior to 1:30 p.m. C.T., the 10% limit is coordinated with the NewYork Stock Exchange (NYSE). Trading can occur at or above thislimit but not below it. If the lead month futures contract is limitoffered, and the NYSE has declared a trading halt due to a 10%decline in the Dow Jones Industrial Average (DJIA), trading willhalt. Trading will resume with the 15% limit in effect when 50% of the underlying S&P 500 stocks (weighted by market capitalization)reopen.
2) After 1:30 p.m. C.T., the 10% limit for the NYSE is no longer ineffect. CME’s 10% limit then works similar to the 5% limit. Oncethe lead month futures contract is limit offered, the limit is ineffect for 10 minutes. This means that you cannot trade belowthe limit, but you may trade at or above the limit price. After the 10 minutes has expired, one of two things happens. If thelead month futures contract is limit offered after the 10 minutes,trading will halt for two minutes. Once the two minutes hasexpired, trading will resume with the 15% limit in effect. If thelead month futures contract is not limit offered after the 10 minutes, trading will continue, with the 15% limit in effect.
8. Q. How does the 10% limit work for NASDAQ-100, E-mini NASDAQ-100, and E-mini NASDAQ Composite?
A. The 10% limit for these products is very similar to the 5% limit. Oncethe lead month futures contract is limit offered, the limit is in effectfor 10 minutes. This means you cannot trade below the limit, but you
may trade at or above the limit price. After the 10 minutes hasexpired, one of two things happens. If the lead month futures con-tract is limit offered after the 10 minutes, trading will halt for twominutes. Once the two minutes has expired, trading will resume withthe 15% limit in effect. If the lead month futures contract is not limit offered after the 10 minutes, trading will continue with the 15%limit in effect.
9. Q. What happens to the NASDAQ-100, E-mini NASDAQ-100 and E-mini NASDAQ Composite contracts if a halt is declared in theprimary securities market?
A. If there is a halt declared in the primary securities market, trading willstop in the NASDAQ-100, E-mini NASDAQ-100 and E-mini NASDAQComposite regardless of where the markets are. Trading will resumein the NASDAQ-100, E-mini NASDAQ-100 and E-mini NASDAQComposite when the primary securities market reopens for trading.
10. Q. How does the 15% limit work?
A. The 15% limit is very similar to the 5% limit. The 15% limit is initiatedonce the lead month futures contract is limit offered. Once this has occurred, the limit is in effect for 10 minutes. This means youcannot trade below the limit, but it does allow you to trade at or above it. Once the 10 minutes has expired one of two things canhappen. If the lead month futures contract is not limit offered after10 minutes, trading will continue with the 20% limit in effect. If thelead month futures contract is limit offered after 10 minutes, tradingwill halt for two minutes. Once the two minutes has expired, tradingwill resume with the 20% limit in effect.

CME 2005 Equity Index Futures and Options Information Guide 61
11. Q. What is the maximum daily futures and options limit?
A. The maximum daily limit is 20% and is coordinated with the NYSE. Ifthe lead month futures contract is limit offered and the NYSE hasdeclared a trading halt due to a 20% decline in the DJIA, trading willhalt. Trading will resume with the 20% limit in effect if and when 50%of the underlying S&P 500 stocks (weighted by market capitalization)reopen. The NYSE maximum daily limit is based on a 30% decline of the DJIA. Please note that the NASDAQ-100, E-mini NASDAQ-100 and E-mini NASDAQ Composite contracts maximum daily pricelimit is also 20%. If the primary securities market does halt tradingdue to 20% decline in the DJIA, trading will halt in the NASDAQ-100, E-mini NASDAQ-100 and E-mini NASDAQ Composite. Tradingwill resume when the primary securities market reopens.
12. Q. Do the E-mini contracts have the same limits as their respectivelarger contracts?
A. The E-mini S&P 500, E-mini S&P MidCap 400 and E-mini Russell 2000contract have the same limits as their larger futures contracts. Thelarger futures contracts will initiate the 5% and 15% limits. Thismeans these limits will go into effect for the E-mini products oncethe lead month, larger futures contract is limit offered. The E-miniNASDAQ-100 contract also has the same limits as its larger futurescontract. However, the larger NASDAQ-100 futures contract will initiate the 5%, 10% and 15% limits.
13. Q. How do the E-mini 10% and 20% limits work?
A. Please see the answers to questions 7 and 11.
14. Q. Do E-mini futures stop trading when the larger futures halt?
A. Yes, although the E-mini NASDAQ-100 follows slightly different rules than the E-mini S&P 500, E-mini S&P MidCap 400, and E-miniRussell 2000.
The following applies to the E-mini S&P 500, E-mini S&P MidCap 400and E-mini Russell 2000:
• Trading will stop when a halt is determined in the lead month, largerfutures contract, except at the 10% limit before 1:30 p.m. C.T., and atthe 20% limit. For example, if the DJIA is down 10%, trading at theNYSE will be halted (before 1:30 p.m. C.T.) However, if the S&P 500 or E-mini S&P 500 or the S&P MidCap 400 or E-mini S&PMidCap 400 or the Russell 2000 or E-mini Russell 2000 contracts are not limit offered, trading will continue in these products.
• Trading in these mini products and their corresponding larger contractswill halt only at the 10% and 20% limits when each product is limitoffered and the DJIA is also down 10% (before 1:30 p.m. C.T.) or 20%.This means there is the possibility that these mini products and theirlarger counterparts may be halted for trading at different times at the10% (before 1:30 p.m. C.T.) or 20% limits. All of these contracts willact independently on the 10% (before 1:30 p.m. C.T.) and 20% limits.
The following applies to the E-mini NASDAQ-100:• E-mini NASDAQ-100 contracts will stop trading whenever a halt is
determined in the lead month, larger futures contract.
15. Q. Are there second-day limits?
A. Yes. Second-day limits apply if the lead month futures contract islimit offered at the 20% limit at the close of RTH and the cash equitymarkets fall more than 20%. If this happens, the following RTH session will have modified price limits.
16. Q. What are the modified second day price limits?
A. The 5% limit will still apply. However, the 10% limit will have a lessrestraining effect, acting much like the 5% limit. Once a limit offerhas been established in the lead month futures contract, the 10% limit is in effect for 10 minutes or until 2:30 p.m. C.T., whichever

62 cme.com
comes first. You cannot trade below the limit, but you may trade at or above it. After 10 minutes or a 2:30 p.m., one of two things willhappen. If the lead month futures contract is limit offered after10 minutes or at 2:30 p.m. C.T., whichever comes first, trading willhalt for two minutes. Once the two minutes has expired, trading will resume with the 15% limit in effect; after 2:30 p.m. C.T., the 20%limit will be in effect. If the lead month futures contract is not limit offered after 10 minutes or at 2:30 p.m. C.T., whichever comes first,trading will continue, with the 15% limit in effect; after 2:30 p.m.C.T.,the 20% limit will be in effect. The 15% limit will work just like the10% limit. To maintain coordinated trading halts under second dayprocedures, trading will halt whenever the NYSE declares a halt,regardless of the futures price level. Futures trading will resume only after 50% of the capitalization weights of the underlying S&P 500 stocks (weighted by market capitalization) reopen. Pleasenote that after a trading halt in the primary securities market, the NASDAQ-100, E-mini NASDAQ-100 and E-mini NASDAQComposite contracts will resume trading when the primary securitiesmarket reopens.
17. Q. Are CME price limits in effect for both up and down markets?
A. Price limits are in effect for down markets only during RTH sessions.Electronic Trading Hours (ETH) trading and E-mini stock index products non-pit trading hours will have both up and down limits.
18. Q. What are the ETH limits?
A. For CME Globex non-pit trading hours there is a single price limit at5%. Trading may occur only at or above the 5% price limit on the downside and at or below the 5% limit on the upside. If stock indexfutures are limit bid at 8:28 a.m. Chicago time in the lead monthfutures contract, then the 5% limit is removed. CME Globex trading
will be delayed until 6:00 p.m. C.T. if an NYSE trading halt is in effectat 3:00 p.m. C.T. or the lead month futures contract in the big S&P 500 futures is limit offered at 3:15 p.m. C.T.
19. Q. What are the price limits for abbreviated trading sessions?
A. On days that CME closes early for holidays, the 2:30 p.m. C.T. timecriterion changes to 45 minutes before the close of the RTH session.
20. Q. Do U.S. index options on futures halt or trade in conjunction with futures trading halts?
A. Whenever the lead month futures contract is officially declared at a limit, options trading halts, except that there is no maximum dailyprice limit on an option’s last day of trading.
21. Q. What are the daily price limits for Nikkei 225 futures?
A. Nikkei 225 futures daily price limits are determined each month.Limits are based on the settlement price of the lead month futurescontract on the last business day of the previous month. For exam-ple, the settlement price of the March 2002 Nikkei 225 futures con-tract on February 28, 2002, will determine the price limits for theentire month of March 2002. There is no daily price limit in a contracton its last day of trading. The daily price limit is derived from the following table.
Lead Month Daily Limit Futures Settlement (Index Points)
0 – 20,000 1,000 (up & down)
20,005 – 30,000 1,500 (up & down)
30,005 and up 2,000 (up & down)

CME 2005 Equity Index Futures and Options Information Guide 63
22. Q. Are there any price limits on Nikkei 225 options on futures?
A. No. Nikkei 225 options on futures will continue to trade when the lead month futures contract is at a limit bid or offer.
23. Q. How can I find the current CME price limits?
A. Current price limits can always be found on the CME Web site at:www.cme.com

64 cme.com
Frequently Asked Questions: Fair Value Settlement
1. Q. How will settlement prices be determined on the last businessday of each month?
A. Settlement prices for domestic stock index futures and options willbe determined on the basis of their fair value, i.e., by reference to the closing cash index value plus finance charges less anticipateddividends. Because the final cash index value may not be known forseveral minutes past the cash close at 3:00 p.m. (Chicago time), thecash index component of the calculation will be sampled at 3:15 p.m.and settlements shall be made available shortly thereafter. As is thepractice with other Exchange products, fair values will be determinedthrough a survey of market participants. That survey will be con-ducted by Exchange staff. Settlement prices will be made availableshortly after sampling the 3:15 p.m. (Chicago time) cash index values. Consistent with normal practices, CME stock index futures andoptions will close at 3:15 p.m. (Chicago time) on the last businessday of each month when FV settlement procedures are employed.This is fifteen (15) minutes past the normal cash equity market closeat 3:00 p.m. (Chicago time). Throughout the trading day, estimatedpremiums of futures over cash will be posted on three display panelslocated on the equity floor. One display panel is located directlyabove the S&P 500 “sky perch,” another in the southeast cornerunderneath the clock; and, a third panel is located on the south wallabove the visitor’s gallery. These estimates may change as surveydata is compiled and as index values fluctuate. Regular settlementprocedures will be observed on all other trading days apart from the last business day of each month.
2. Q. What products are affected by this procedure?
A. All domestic stock index futures and options will be affected by thisprocedure. That includes the S&P 500, E-mini S&P 500, NASDAQ-100, E-mini NASDAQ-100, E-mini NASDAQ Composite, S&P/BarraGrowth Index, S&P/Barra Value Index, the S&P MidCap 400, E-miniS&P MidCap 400, E-mini Russell 1000, the Russell 2000, E-miniRussell 2000, S&P SmallCap 600 and SPCTR futures. The Nikkei 225is not settled with use of FV procedures and will be closed at 3:15p.m. (Chicago time) in sync with other stock index markets.
3. Q. What is meant by the term “fair value?”
A. Fair value represents the level at which futures theoretically shouldbe priced in relation to cash index values in the absence of transac-tion costs—albeit not where they necessarily will trade. It represents avalue at which arbitrageurs should find no opportunity in buying orselling the cash/futures basis. It is typically calculated as a function ofthe cash or spot index value plus financing charges (often determinedas a function of LIBOR rates) less any dividends that would accruewith the purchase and carry of all index constituents until the finalfutures settlement date.
4. Q. Why is this procedure being implemented?
A. Stock index products on the Exchange normally close and settle fifteen minutes after the daily close of trading in cash equities. Thecash/futures basis may be affected to the extent that futures may fluctuate—sometimes sharply—during those final fifteen minutes. As such, this may become a difficulty for institutional traders practicing coordinated cash/futures strategies. Still, the opportunityto lay off equity market exposures during those fifteen minutes subsequent to the cash close has proven quite beneficial.

CME 2005 Equity Index Futures and Options Information Guide 65
The use of FV settlement procedures is intended to address this so-called “tracking error”—while still permitting trade to continue forfifteen minutes past the 3:00 p.m. cash close.
5. Q. What are the trading hours on days when FV settlement proceduresare applied?
A. Consistent with normal practices, Regular Trading Hours (RTH) forstock index futures and options shall be conducted from 8:30 a.m. to3:15 p.m. (Chicago time) on the last day of each month—unless noti-fied otherwise because of a holiday. As such, this procedure permitstrading to continue for fifteen (15) minutes past the normal 3:00 p.m.(Chicago time) cash close while ensuring that settlements will be tied to cash values. This will be followed, after a brief delay, by athree-minute post-settlement session.
6. Q. How will options be settled on days when FV settlement proce-dures are applied?
A. Options on futures settlement values shall be established on thebasis of the adjusted fair value futures settlements on days when FVsettlement procedures are employed. This is conceptually similar to the procedures normally used to identify daily settlement pricesfor away-from-the-money options or options which simply did nottrade near the close.
7. Q. How will Market-on-Close (MOC) orders be handled on days whenFV settlement procedures are applied?
A. Market-on-Close (MOC) orders shall be handled in the typical fashionon days when FV settlement procedures are applied. In other words,an MOC order becomes a market order to be filled at prevailingprices during the last thirty seconds of the trading session, i.e.,between 3:14:30 and 3:15:00. The executed price may or may notresemble the settlement price.
8. Q. How will the post-close session be conducted on days when FVsettlement procedures are applied?
A. Trading shall be permitted during the post-close session on dayswhen FV settlement procedures are applied at prices within the3:14:30-3:15:00 closing range—per normal practices. Note that theseprices may depart from the fair-value settlement price.
9. Q. How are other exchanges handling settlements on the last day of the month?
A. Other domestic exchanges and market participants are aware of our procedures in this regard. We continue to work with them tocoordinate settlements in related markets.

66 cme.com
Frequently Asked Questions: EFPs
GENERAL
1. Q. What are the specific rules governing EFP transactions?
A. The CME Rules which govern EFP transactions are Rule 538—TRANSFER OF SPOT FOR FUTURES, and Rule 719—TRANSFER OF CASH FOR FUTURES AFTER TERMINATION OF CONTRACT.
2. Q. What is the difference between “EFPs” and “Ex-Pit” transactions?
A. The term “Ex-Pit” refers to any transaction done non-competitively.The only permissible ex-pit transactions are EFPs, defined block tradesand transfers. All EFP transactions must be executed in accordance with either Rule 538 or Rule 719. Transfers may only be made in accor-dance with Rule 853—TRANSFER OF TRADES, and may only occurbetween accounts wherein ownership is identical. Also, transfers maynot be made for offset (with certain exceptions for the correction of errors), while EFP trades may.
3. Q. What is the difference among an “EFP,” a “Cash for FuturesTransaction,” or a “vs. cash transaction?”
A. Nothing. They are simply different terms which describe the sametype of transaction.
4. Q. At what time may I execute an EFP transaction?
A. EFPs may be transacted at any time (except that EFPs done pursuantto Rule 719 are subject to prior approval); however, they are not presumed to be accepted by the CME Clearing House until they arematched, cleared, and the first payment of settlement variation andperformance bond has been confirmed.
5. Q. At what price may I execute an EFP transaction?
A. Any price agreed upon by both parties.
6. Q. What is the primary difference between Rule 538 and Rule 719?
A. Rule 719 specifically refers to an EFP transaction that occurs aftertermination of trading (expiration) in the futures contract, while Rule 538 covers EFP transactions generally.
7. Q. May I do an EFP in any contract at CME?
A. Provided that all of the requirements for either Rule 538 or 719 have been satisfied, an EFP may be executed for any futures contractat CME except E-mini currency and equity products. EFPs on options are specifically prohibited by Rule 538.
8. Q. Are EFPs authorized only at the CME?
A. No. EFPs have been authorized pursuant to the CommodityExchange Act and, while subject to the rules of each individualexchange, may be utilized on any U.S. futures exchange.
9. Q. Can open interest be increased as a result of an EFP?
A. Yes. EFPs can be used to initiate as well as offset positions.
10. Q. Must there be a cash trade during the EFPs transaction?
A. Yes. The seller of the futures contract must simultaneously purchasethe cash commodity, and, in the case of the buyer of the futures contract, he must simultaneously sell the cash commodity as part ofan EFP. In addition, the party which is the seller of the cash or “spot”commodity must have the cash commodity in his possession at the time of the transaction. Transitory EFPs are not allowed in equities,interest rates or agricultural products.

CME 2005 Equity Index Futures and Options Information Guide 67
11. Q. How many parties may there be to an EFP transaction?
A. There may be only two parties to an EFP transaction: one being thebuyer of futures and the seller of spot commodity, the other being theseller of futures and the buyer of spot commodity. Additionally, the twoparties must be different legal entities except in circumstances where in the two parties have common ownership but operate completelyindependently from each other and have separate trading control.
12. Q. What does the word “cash” mean as utilized in the EFP rules?
A. Pursuant to the definition contained in the Rule Book, “cash” isdefined as “the physical or actual commodity.”
13. Q. What types of “cash” commodities/instruments are consideredacceptable for use as the cash side of EFPs?
A. The following describes acceptable and “cash” commodities/instru-ments for EFPs. (This list is not exhaustive.) Questions regarding theacceptability of commodities/instruments not listed below should be addressed to the Market Surveillance group of the CME Divisionof Market Regulation: STOCK INDEX FUTURES: Standardized stockbaskets containing at least 80% of the component stocks of the rele-vant index, and which are highly correlated to the underlying index(R2 = .90 or greater), are acceptable. Also, stock baskets which areoptimized to the relevant index using recognized analytical packagessuch as BARRA or APT Worldtrack may be acceptable. In the case of the Nikkei stock index futures, warrants listed on the AMEX are alsoacceptable. Exchange Traded Funds (“ETF’s”), also known as IndexShares, will also be acceptable provided that they mirror Stock Indexproducts traded on the Exchange (see Special Executive Report S-3554);
In all cases, the cash sides must be equal or nearly equal in quantity/value to the futures utilized.
REPORTING AND CLEARING
14. Q. Are there any special reporting requirements for EFP transactionsat CME?
A. Yes, EFPs are reported to the Clearing House via the EFP Trade EntrySystem (“TES”). Subsequent to clearing, details may be viewedeither on Merquote/IDS or TANDEM screens. Submission proceduresare specified in the EFP Trade Entry System User Manual, while timingrequirements are outlined in Regulatory Advisory #RA-00-17(attached).
15. Q. Are give-up EFPs permissible?
A. Yes; however, the APS/GUS system does not currently accommodateEFPs.
16. Q. Must there be a filling broker indicated for EFPs at trade submission?
A. No. A filling broker is not required for EFPs.
17. Q. Who is responsible for ensuring that the trade is properly submitted?
A. The EFP TES simplifies the process of matching ex-pit transactions by utilizing “one-sided” trade entry. The market maker (also referredto as the Cash Dealer) executing the cash trade, will enter the futures transaction into the TES. The market maker will then notifythe opposite firm’s back office that the EFP trade is ready for acceptance. Specific requirements concerning “one-sided” submissionare contained in the EFP Trade Entry System User Manual which isavailable from the Systems Liaison Group at Ext. 4780.

68 cme.com
18. Q. Are “as of” EFPs permissible?
A. Yes; however, the Clearing House manual states that “as of” EFPswhich are more than one business-day old are prohibited. Therefore,clearing members must use due diligence to ensure that EFPs arepromptly posted and cleared.
19. Q. What information must a trading card or order contain for it to beacceptable for clearing?
A. An acceptable card or order must be legible and contain the following:(a) the buying and selling firms; (b) the contract and contract month;(c) the quantity; (d) the futures price; (e) date executed; and (f) execu-tion time. Also, members must use non pre-sequenced cards.
20. Q. Do EFPs clear through the Clearing House?
A. Yes. All transactions, including EFPs, must be cleared through theClearing House in accordance with the procedures in the ClearingHouse Manual of Operations. All EFP transactions must be key-punched as trade type 9 for clearing purposes by member firms.
21. Q. Must I submit the EFP transaction to the Exchange for priorapproval?
A. An EFP transaction executed after the termination (expiration) of thecontract, pursuant to Rule 719, is subject to the President’s approval(which has been delegated to the Clearing House). In addition, theparties must file with the Clearing House all memoranda necessary toestablish the nature of the transaction.
EFP transactions executed pursuant to Rule 538 need not beapproved by the President, and parties to the transaction need notfile memoranda with the Clearing House to establish the nature of the transaction. However, pursuant to Rule 538, the clearing
members and brokers to the transaction must maintain a full and clearrecord of the transaction with all pertinent memoranda, includingmemoranda establishing ownership of the cash position.
DOCUMENTATION REQUIREMENTS22. Q. What documentation is considered to be “...all pertinent memo-
randa, including memoranda establishing ownership of the cashposition.”
A. The documentation maintained by the parties to the transaction mustinclude:1) All documents relevant to the futures side of the trade (e.g., cards,
orders, and customer account statements);
2) Cash confirmations, invoices, bills of sale, or other documents evidencing all of the terms of the cash side of the transaction,including evidence of payment/settlement of the cash transaction.
CFTC regulations require that the documentation evidencing the cash side of the transaction consist of those documents customarilygenerated in accordance with cash market practices which demon-strate the existence and nature of the cash transactions, including, butnot limited to, contracts, confirmation statements, telex printouts,invoices, warehouse receipts or other documents of title.
23. Q. Are there any other documentation requirements regarding EFPs?
A. Yes. CFTC regulations also require that FCM’s must identify EFP trans-actions on confirmation and monthly account statements delivered to customers. Also, CFTC regulations require a customer of an FCM,IB or member of a contract market to create, retain and produceupon the request of the CFTC, the Justice Department or the con-tract market the cash transaction document.

CME 2005 Equity Index Futures and Options Information Guide 69
24. Q. What is the proper way for a broker to handle an EFP for a customer?
A. A customer order may be executed as an EFP only if the customerindicates that it is for execution in the EFP market. In addition, priorto executing any customer order as an EFP, the floor broker musthave ascertained that all necessary elements of the cash portion ofthe transaction are in place. Also, the order must indicate that thetrade is for execution in the EFP market.
25. Q. If I need additional information with regard to EFPs, whom shouldI contact?
A. Contact Mr. Eric Wolff, Managing Director, Regulatory Affairs, at(312) 930-3255, Mr. Jerry O’Connor, Associate Director, FinancialSurveillance, at (312) 930-3256 or Mr. Steve Mair, Senior Analyst,Division of Market Regulation, at (312) 466-4382.

70 cme.com
Stock Index Futures Exchange Traded Fund Ticker
S&P 500 Index S&P Depositary Receipt (SPDR) Trust SPY
S&P 500 Index iShares S&P 500 Index Fund IVV
NASDAQ-100 Index NASDAQ-100 Trust QQQ
NASDAQ Composite Fidelity Nasdaq Composite Index ONEQ
S&P MidCap 400 Index MidCap SPDR Trust MDY
S&P MidCap 400 Index iShares S&P MidCap 400 Index Fund IJH
Russell 1000 Index iShares Russell 1000 Index Fund IWB
Russell 2000 Index iShares Russell 2000 Index Fund IWM
S&P 500/BARRA Growth Index iShares S&P 500/BARRA Growth Index Fund IVW
S&P 500/BARRA Value Index` iShares S&P 500/BARRA Value Index Fund IVE
Frequently Asked Questions: Exchange Traded Funds Used as EFPs
1. Q. What is an “EFP?”
A. The term “EFP” is an acronym for “Exchange-for-Physicals.” Such a transaction is also sometimes referred to as a “transfer of spot forfutures” and is governed by Exchange Rule 538. An EFP representsan ex-pit transaction consummated by two parties wherein one of the parties is the simultaneous buyer of the “spot” commodity andseller of the futures contract—while the other party is the simultaneousseller of the “spot” commodity and the buyer of the futures contract.The spot seller is required to have in his possession the item to be delivered.
2. Q. What is an “ETF?”
A. An Exchange Traded Fund (ETF)—also known as Index Shares—is ageneric term for a novel type of investment vehicle. The first and most popular product of this type was developed by Amex in the formof SPDRs (S&P Depositary Receipts with a ticker symbol of “SPY”). A SPDR evidences ownership in the SPDR Trust, a unit investment trustthat holds a portfolio of common stocks designed to track the S&P 500.Other Index Share products for other stock indexes traded on theExchange in the form of futures are also available. These securitiestrade on securities exchanges like any other stock. Unlike mutual fundsthat may restrict entry and exit to the close, Index Shares may betraded throughout the session and often trade tick-for-tick vs. futures.
3. Q. Does the use of ETFs in the context of EFPs represent a change in Exchange policy?
A. Yes. In the past, the Exchange recognized the use of a portfolio ofstocks substantially similar in composition to the Stock Index which is the subject of the futures contract as a valid “spot commodity” in the context of an EFP. The use of Exchange Traded Funds or ETFsrepresents a liberalized policy.
4. Q. Why is the Exchange adopting this policy?
A. This EFP facility has been adopted in response to expressed customerdemand. In particular, large institutional players including the marketmakers in index shares have expressed interest in this facility. Notethat EFPs are currently permitted in the context of stock index futuresvs. actual stocks—and that such transactions typically entail unit sizesof $10 million in stocks or better.
The Board intends to review the efficaciousness of the program earlynext year.

CME 2005 Equity Index Futures and Options Information Guide 71
5. Q. Which stock index futures are affected by this policy?
A. Currently, ETFs are available representing the S&P 500, the NASDAQ-100, NASDAQ Composite, the MidCap 400, Russell 1000, Russell2000, S&P/BARRA Growth Index and the S&P/BARRA Value Index.The following list enumerates the ETF products currently recognizedby the Exchange as valid in the context of EFPs. It is the Exchange’s policy to permit the use of other ETFs that mirror specific stockindexes traded on the Exchange in the form of futures as theybecome available.
6. Q. Are there any restrictions on these EFP transactions?
A. Yes. The minimum lot size for such trade is fifty (50) contracts. I.e., 50 “standard” S&P 500 futures, fifty (50) “standard” NASDAQ-100futures, fifty (50) “standard” S&P MidCap 400 futures, or fifty (50) ofany other stock index futures for which Index Shares may be offered.Note that one “creation unit” of 50,000 SPDRs represents 20 standard sized S&P 500 futures; one “creation unit” of 50,000 QQQscorresponds to 12.5 futures; and, one “creation unit” of 25,000MidCap SPDRs corresponds to 20 futures.
EFPs using ETFs are NOT permitted in the context of the E-mini S&P 500, E-mini NASDAQ-100, E-mini S&P MidCap 400 and E-miniRussell 2000 contracts. Consistent with standing Exchange policy—transitory EFPs using ETFs are NOT permitted.
7. Q. What fees are associated with the transaction of an EFP using an ETF?
A. Stock index EFPs—whether conducted vs. an ETF or other validinstruments—is subject to a $1.75/side EFP surcharge. This surcharge is required in addition to other applicable exchange and clearing fees.
8. Q. What are the trade processing requirements for EFPs using an ETF?
A. EFPs using ETFs will be reported to the Exchange for clearing purposesby utilizing the Exchange’s CLEARING 21® EFP Trade Entry System.Like all EFPs, these EFPs must be submitted within one hour of execution. EFPS on ETFs will require the additional entry of an OrderType of “E” to distinguish them from EFPs on Actual Stocks.
9. Q. How does one access the Exchange’s online CLEARING 21 EFPTrade Entry System?
A. The CLEARING 21 EFP Trade Entry System is an online systemenabling a firm to enter, correct or accept the futures side of an EFP transaction. This system was established to simplify the process of matching ex-pit transactions by utilizing one-sided trade entry.The system is readily accessible via 3270 Emulation—while utilizingthe benefits of advanced C21 database technology. 3270 Emulationis available on your firm’s back office or trading floor/booth PCand/or on a C21 workstation. All users with current access to TES areautomatically granted access to the C21 EFP system. Additionalinformation may be found in the CLEARING 21 EFP Trade EntrySystem User Manual made available by the Systems Liaison Group.

72 cme.com
Frequently Asked Questions: Equity Index Block Trading
1. Q. What is a block transaction?
A. It is a privately negotiated futures or option transaction executedapart from the public auction market. A block transaction may be executed either on or off the Exchange trading floor. Thesetrades are governed by CME Rule 526, BLOCK TRANSACTIONS. See the Appendix to this document for the language of Rule 526.
2. Q. How does a block transaction differ from an All-or-None (“AON”)transaction—or from an EFP transaction?
A. An AON transaction is executed by open outcry in a designated areaon the trading floor. A block transaction may be executed privatelyon or off the trading floor provided that all other requirements ofRule 526, BLOCK TRANSACTIONS, are fulfilled. An EFP entails thesimultaneous exchange of a futures position for a corresponding cashposition (i.e., a basis trade) while a block transaction involves onlyfutures, or options on futures.
3. Q. What products currently are eligible for block transactions?
A. For detailed enumeration of markets where block trading is permitted,please refer to the table “Minimum Block Transactions.” The Exchangeintroduced block trading in the futures markets on November 29,2000 and block trading in standard option markets on January 16,2001. Block trading in FLEX options is restricted to the extent thatthe futures contract must be listed and the flex option strike pricemust be at a valid underlying futures price.
4. Q. What are the minimum transaction quantities?
A. The minimum quantities for block transactions are determined by theBoard of Directors and are subject to CFTC approval. The minimumquantities for block trades in various markets are indicated in thetable below. These minimum order size requirements refer to theorder size for individual instruments and recognized spreads or com-binations. For example, a two legged calendar spread in S&P MidCap400 futures may be block traded given a minimum order size of 25 contracts in each leg of the spread—or 50 contracts to comprisethe spread. These minimum order quantity requirements are applicable to single accounts or groups of eligible accounts.
Futures Options
S&P 500 na 250 contracts
NASDAQ-100* 200 (outrights only) 100 contracts
S&P MidCap 400, Russell 2000 50 contracts 250 contracts
S&P 500/BARRA Growth Index,
S&P 500/BARRA Value Index
Nikkei 225, E-mini Russell 1000†, & E-mini NASDAQ Composite†
Technology and Financial 200 NA
SPCTR futures
Minimum Block Transaction Quantities
* NOT applicable to E-mini stock indexes.† NOT available for options.

CME 2005 Equity Index Futures and Options Information Guide 73
5. Q. Who may participate in block transactions?
A. Eligible participants in block transactions are delineated in Part 36.1of CFTC Regulations. Such eligible participants include Exchangemembers and member firms, broker/dealers, government entities,pension funds, commodity pools, corporations, investment compa-nies, insurance companies, depository institutions, and high-networth individuals. Further, Rule 526 provides for the participation ofCommodity Trading Advisors (CTAs) and registered investment advi-sors—with net assets under management of at least $25 million—to conduct block transactions. See the Appendix to this documentfor the language of Rule 526.
6. Q. Can any order of the requisite size be executed as a block transaction?
A. No, the order must specifically be designated as a block transactioneligible by the customer.
7. Q. What are the hours for block trading?
A. Block transactions may be executed any time.
8. Q. Are there any restrictions upon the transaction price of a block trade?
A. Block trades must be transacted at prices that are “fair and reason-able” in light of the size of the order, prices in related cash, futuresand option markets and the circumstances of the participants.Further, the trade price must adhere to the minimum tick and pricevalidation requirements of the market in question.
9. Q. What record keeping and audit trail requirements are attendantto a block trade?
A. The record keeping and audit trail requirements associated with ablock trade are identical to the requirements associated with anyother futures or option transaction. In addition to the normal recordkeeping and audit trail requirements, however, there is the additionalproviso that a Block Trade Report shall be provided to the Exchangewithin five minutes of execution.
10. Q. What information must be included in the Block Trade Report—and to whom must said information be reported?
A. The Block Trade Report shall include: identification of the selling clear-ing member’s firm number, the buying clearing member’s firm num-ber, the contract, contract month, transacted price, quantity and timeof execution. In the case of an option transaction, the Report mustfurther include identification of whether the option is a put or call,and the strike price. If the block trade is executed off the trading flooror during hours outside of Regular Trading Hours, it may be reportedto the CME Globex Control Center (“GCC”) by calling 312-456-2391.If the block trade is executed on the trading floor during RegularTrading Hours, it may be reported to Exchange price reporting staffin the Interest Rate quadrant on the upper trading floor (x2494); or, toExchange price reporting staff in the Equity quadrant on the lowertrading floor (x3935). Note that all block trades executed outside ofRegular Trading Hours must be reported to the GCC.

74 cme.com
11. Q. Block trades must be reported to the Exchange within five minutesof execution for the purposes of price dissemination—who isresponsible for this Block Trade Report?
A. It is the responsibility of the seller (i.e., the seller’s clearing firm—notthe buyer’s clearing firm) to provide the Block Trade Report—whichshall be used for the purposes of price dissemination—in an effort toprevent duplicate reporting of the same transaction. (Both the seller’sand buyer’s clearing firm must also report the trade for the purposesof clearing as described in Question 16.) In the event that the selleris an individual member (e.g., on the trading floor), it is the individualmember’s responsibility to provide the Block Trade Report. In thecase of recognized spreads or combinations executed as a blocktransaction, the seller of the spread or combination is likewise respon-sible for reporting the transaction. In the case of options, the netseller of premium is considered the seller of the spread or combina-tion and is responsible for the provision of the Block Trade Report.
12. Q. Must block trades be “brokered” by an Exchange member orclearing member?
A. No—presuming that the clearing member(s) has so authorized, blocktransactions may be negotiated directly between non-member “eligi-ble participants” (customers). In the event, however, that customersdirectly negotiate block trades, the affected clearing members areresponsible for the timely capture and reporting of all required infor-mation including the time of execution. Clearing members are urged to convey a clear understanding to their customers of theirreporting responsibilities in this regard.
13. Q. Who is responsible for recording the execution time?
A. Ultimately, the clearing member is responsible for providing accurateexecution times to the Exchange.
14. Q. Can spreads or combination trades be executed as block trades?
A. Yes—but all legs of the spread or combination must be within contracts for which block trading is permitted and conform to theminimum order quantity requirements. As such, recognized inter-market spreads or recognized combinations are permitted as long as all contracts involved are approved for block trading. For purposesof complying with the minimum order quantity restrictions, one may aggregate all legs of recognized intra- or inter-market spreadsor combinations. Thus, all legs of a two-legged spread or combina-tion, e.g., calendar spreads, may be aggregated to comply with therequirements. Similarly, all legs of any recognized 3-, 4- or multiple-legged spread or combination may be aggregated for the purposesof complying with the requirements.
15. Q. May eligible account managers use the post execution allocationprocedure for block trades—as specified in Rule 536.E.?
A. Yes—for details, please refer to Rule 536., RECORDS FOR ORDERSAND PERSONAL TRANSACTIONS DURING REGULAR TRADINGHOURS, Part E., Customer’s Orders.

CME 2005 Equity Index Futures and Options Information Guide 75
16. Q. What are the trade entry procedures for submitting block tradesto the clearing system?
A. There is a major difference in the trade entry requirements for blockfutures vs. block option transactions, as summarized below.
BLOCK FUTURES trades must be submitted through the CLEARING21® online EFP system and distinguished from EFPs by entering anorder type “B” in the order type field on the entry screen. Consistentwith the “seller” reporting procedure described in Question 11, theseller is responsible for inputting the trade and allocating it to thebuyer. The buyer will then claim its side of the trade on the system’sclaim screen. Upon a successful claim, confirmation records will berouted back to firms for bookkeeping purposes. Note that, whenreporting spread transactions, each leg must be entered individually.
BLOCK OPTION trades cannot be entered via the online EFP systemlike block futures trades. Rather, block option trades must be enteredvia the Trade Entry System (TES) or submitted as TREX messagesfrom a firm’s back-office trade entry terminal. Like block futurestrades, however, the trade type must be reported as a type “9” andthe order type must be reported as a type “B.” Block option tradesare subject to exchange trade matching. Block options can onlymatch with other block options (order type “B”).
BLOCKED FLEX OPTION trades must be entered by trading floorstaff using the same entry terminals currently used for (non-blocked)flex options and designated as order type “B.” Block trades on FLEXoptions are restricted to Open Outcry trading hours of stock index futures, i.e., 8:30 a.m. to 3:15 p.m. weekdays. Note that block FLEXoption trades must be reported to trading floor staff—not to theGCC—within the normal five minute window.
For firms that receive outbound TREX confirmation records, blockoptions (similar to block futures) will be identified as Trade Type “1”instead of “9” so that the option block is not reported in bookkeepingand customer statements as an EFP. Firms that do not accept TREX confirmation records must ensure that block option trades are notreported to customers as EFP trades.
17. Q. May block trades be given-up?
A. Yes—but with the following distinction between futures and options.Block futures trades may be given-up through the EFP system in thesame manner as EFPs are currently given-up. Block option trades,however, can only be given up through the Give-Up System (“GUS”)and can only be submitted as “memo-adds.” This is because GUScurrently does not accept trades designated as type “9.” Utilizing the“memo-add” process, however, ensures that the TREX routing recordto the claiming firm’s bookkeeping system will be designated as a type “1” or “6”—which is necessary so that the block option tradeis not described as an EFP on the customer statement.
18. Q. Can orders be bunched to constitute one side of a block transaction?
A. Yes.
19. Q. What fees are associated with block transactions?
A. Block transactions shall be assessed a fee as determined by theBoard of Directors. The Board has initially approved a $1.75/side surcharge per contract in addition to other fees normally applicableto the trade of CME futures and options.

76 cme.com
APPENDIX: RULE 526, BLOCK TRANSACTIONS
526.BLOCK TRANSACTIONS: Notwithstanding Rule 520.—TRADING CONFINED TO EXCHANGE FACILITIES—, the Board or a Committeeappointed by the Board shall, from time to time, determine the minimum thresholds for and the commodities in which BlockTransactions (privately negotiated transactions) shall be permitted. The following shall govern Block Transactions:
A. A member may execute a Block Transaction for a specified quantityat or in excess of the applicable minimum threshold designated by the Board.
B. Each party to a Block Transaction must be an Eligible Participant as that term is defined in Commission Regulation §36.1.
C. A member shall not execute any order by means of a BlockTransaction unless that order meets the applicable minimum thresh-old and includes specific instructions to execute a Block Transaction.
D. The price at which a Block Transaction is executed must be “fair and reasonable” in light of (i) the size of such Block Transaction, (ii) the prices and sizes of other transactions in the same contract atthe relevant time, (iii) and the prices and sizes of transactions in other relevant markets, including without limitation the underlyingcash and futures markets, at the relevant time, and (iv) the circum-stances of the parties to such Block Transaction.
E. Block Transactions shall not set off conditional orders (e.g., Stop Orders,MIT Orders, etc.) or otherwise affect orders in the regular market.
F. All Block Transactions must be reported to a designated Exchangeofficial within five minutes of the time of execution. The report mustinclude the contract, contract month, price, and quantity of the transaction. The Exchange shall immediately publish such informationseparately from the reports of transactions in the regular market.
G. Clearing firms must report Block Transactions to the ExchangeClearing House, including the time of execution, in accordance withthe Clearing House Manual of Operations.
H. Brokers executing Block Transactions must maintain a record of saidtransaction, in accordance with Rule 536—RECORDS FOR ORDERSAND PERSONAL TRANSACTIONS DURING REGULAR TRADINGHOURS.
I. In the application of paragraphs A., B., and C. of this Rule to a com-modity trading advisor (“CTA”) registered under the Act, includingwithout limitation any investment advisor registered as such with theSecurities and Exchange Commission that is exempt from regulationunder the Act or Commission Regulations thereunder, with totalassets under management exceeding $25 million, the CTA, and notthe CTA’s customers, shall be the applicable entity for purposes of said paragraphs A., B., and C.
J. In the application of paragraphs A., B., and C. of this Rule to a foreign Person performing a similar role or function to a CTA or invest-ment advisor as described in paragraph I, and subject as such to foreign regulation, with total assets under management exceeding $50 million, the CTA, and not the CTA’s customers, shall be the applicable entity for purposes of said paragraphs A., B., and C.

CME 2005 Equity Index Futures and Options Information Guide 77
SECTION III:
Stocks and IndexInformation

78 cme.com
S&P 500 Index Top 40 Stocks (ranked by market capitalization)
RANK TICKER COMPANY SHARES (MIL.) PRICE ($) MARKET VALUE (MIL.) % OF 500
1 GE General Electric 10572.133 36.5 385882.855 3.42
2 XOM Exxon Mobil Corp. 6451.296 51.26 330693.433 2.93
3 MSFT Microsoft Corp. 10871.590 26.71 290380.169 2.57
4 C Citigroup Inc. 5189.753 48.18 250042.300 2.22
5 WMT Wal-Mart Stores 4234.867 52.82 223685.675 1.98
6 PFE Pfizer, Inc. 7530.995 26.89 202508.456 1.79
7 BAC Bank of America Corp. 4039.177 46.99 189800.927 1.68
8 JNJ Johnson & Johnson 2967.726 63.42 188213.183 1.67
9 AIG American Int'l. Group 2604.571 65.67 171042.178 1.52
10 IBM International Bus. Machines 1664.697 98.58 164105.830 1.45
11 INTC Intel Corp. 6323.000 23.39 147894.970 1.31
12 PG Procter & Gamble 2536.683 55.08 139720.500 1.24
13 JPM JPMorgan Chase & Co. 3562.463 39.01 138971.682 1.23
14 CSCO Cisco Systems 6584.739 19.3 127085.463 1.13
15 MO Altria Group, Inc. 2052.579 61.1 125412.577 1.11
16 VZ Verizon Communications 2768.958 40.51 112170.489 0.99
17 CVX ChevronTexaco Corp. 2118.612 52.51 111248.316 0.99
18 WFC Wells Fargo 1691.869 62.15 105149.658 0.93
19 DELL Dell Inc. 2484.304 42.14 104688.571 0.93
20 KO Coca Cola Co. 2419.436 41.63 100721.121 0.89

CME 2005 Equity Index Futures and Options Information Guide 79
RANK TICKER COMPANY SHARES (MIL.) PRICE ($) MARKET VALUE (MIL.) % OF 500
21 UPS United Parcel Service 1120.793 85.46 95782.970 0.85
22 HD Home Depot 2195.955 42.74 93855.117 0.83
23 TWX Time Warner Inc. 4580.374 19.44 89042.471 0.79
24 PEP PepsiCo Inc. 1684.480 52.2 87929.856 0.78
25 SBC SBC Communications Inc. 3315.414 25.77 85438.219 0.76
26 WB Wachovia Corp. (New) 1603.640 52.6 84351.464 0.75
27 AMGN Amgen 1270.136 64.15 81479.224 0.72
28 EBAY eBay Inc. 662.908 116.28 77082.942 0.68
29 CMCSA Comcast Corp. 2219.891 33.28 73877.972 0.65
30 ABT Abbott Labs 1557.392 46.65 72652.337 0.64
31 TYC Tyco International 2011.602 35.74 71894.655 0.64
32 MRK Merck & Co. 2217.585 32.14 71273.182 0.63
33 AXP American Express 1255.188 56.37 70754.948 0.63
34 ORCL Oracle Corp. 5128.466 13.72 70362.554 0.62
35 QCOM QUALCOMM Inc. 1639.082 42.4 69497.077 0.62
36 FNM Fannie Mae 967.904 71.21 68924.444 0.61
37 LLY Lilly (Eli) & Co. 1131.639 56.75 64220.513 0.57
38 MMM 3M Company 778.534 82.07 63894.285 0.57
39 HPQ Hewlett-Packard 3019.899 20.97 63327.282 0.56
40 VIA.B Viacom Inc. 1705.030 36.39 62046.042 0.55
Source: Standard & Poor’s As of December 31, 2004 For current list of stocks please visit www.standardandpoors.com

80 cme.com
RANK TICKER COMPANY SHARES (MIL.) PRICE ($) MARKET VALUE (MIL.) % OF 400
1 WPO Washington Post 9.570 983.02 9407.501 0.87
2 DHI D.R. Horton 233.218 40.31 9401.018 0.87
3 LEN Lennar Corp. 156.157 56.68 8850.979 0.82
4 HAR Harman Int'l Industries 66.980 127 8506.460 0.79
5 FNF Fidelity Nat'l Fin'l 174.459 45.67 7967.543 0.74
6 MUR Murphy Oil 92.009 80.45 7402.124 0.69
7 LM Legg Mason 100.766 73.26 7382.117 0.68
8 LYO Lyondell Chemical Co. 241.603 28.92 6987.159 0.65
9 WFT Weatherford International Ltd. 135.865 51.3 6969.875 0.65
10 TSN Tyson Foods 352.986 18.4 6494.942 0.60
11 BNK Banknorth Group Inc. 175.873 36.6 6436.952 0.60
12 CZR Caesars Entertainment, Inc. 313.037 20.14 6304.565 0.58
13 SEPR Sepracor Inc. 105.086 59.37 6238.956 0.58
14 MHK Mohawk Industries 66.676 91.25 6084.185 0.56
15 EXPD Expeditors Int'l. 106.565 55.88 5954.852 0.55
16 PDCO Patterson Cos. Inc. 137.194 43.39 5952.848 0.55
17 WFMI Whole Foods Market 62.263 95.35 5936.777 0.55
18 VAR Varian Medical Systems 135.841 43.24 5873.765 0.55
19 SII Smith International 104.877 54.41 5706.358 0.53
20 CTSH Cognizant Technology Solutions 132.963 42.33 5628.324 0.52
S&P MidCap 400 Index Top 40 Stocks (ranked by market capitalization)

CME 2005 Equity Index Futures and Options Information Guide 81
RANK TICKER COMPANY SHARES (MIL.) PRICE ($) MARKET VALUE (MIL.) % OF 400
21 CDWC CDW Corporation 83.104 66.35 5513.950 0.51
22 MCHP Microchip Technology 206.330 26.66 5500.758 0.51
23 NYB New York Community Bancorp 265.153 20.57 5454.197 0.51
24 BTU Peabody Energy 64.611 80.91 5227.676 0.49
25 PETM PETsMART Inc. 145.200 35.53 5158.956 0.48
26 TOL Toll Brothers 74.721 68.61 5126.608 0.48
27 PXD Pioneer Natural Resources 145.805 35.1 5117.756 0.47
28 CBH Commerce Bancorp 79.335 64.4 5109.174 0.47
29 RSG Republic Services 150.786 33.54 5057.362 0.47
30 RE Everest Re Group 56.122 89.56 5026.286 0.47
31 STZ Constellation Brands 107.921 46.51 5019.406 0.47
32 LUK Leucadia National Corp. 71.721 69.48 4983.175 0.46
33 DF Dean Foods (New) 149.031 32.95 4910.571 0.46
34 RDN Radian Group 91.882 53.24 4891.798 0.45
35 ESV ENSCO Int'l. 151.082 31.74 4795.343 0.44
36 DDR Developers Diversified Rlty. 107.816 44.37 4783.796 0.44
37 CVH Coventry Health Care Inc. 89.760 53.08 4764.461 0.44
38 PHS PacifiCare Health Systems Inc. 84.259 56.52 4762.319 0.44
39 MBG Mandalay Resort Group 67.506 70.43 4754.448 0.44
40 CHRW C.H. Robinson Worldwide 85.318 55.52 4736.855 0.44
Source: Standard & Poor’s As of December 31, 2004 For current list of stocks please visit www.standardandpoors.com

82 cme.com
S&P SmallCap 600 Index Top 40 Stocks (ranked by market capitalization)
RANK TICKER COMPANY SHARES (MIL.) PRICE ($) MARKET VALUE (MIL.) % OF 600
1 NVR NVR, Inc. 6.361 769.4 4894.153 0.93
2 NEW New Century Financial Corp. 54.622 63.91 3490.892 0.66
3 PII Polaris Industries 42.801 68.02 2911.324 0.55
4 MDC M.D.C. Hldgs. 32.218 86.44 2784.924 0.53
5 YELL Yellow Roadway Corp. 48.582 55.71 2706.503 0.51
6 MEE Massey Energy Company 76.044 34.95 2657.738 0.50
7 POG Patina Oil & Gas 70.624 37.5 2648.400 0.50
8 FRK Florida Rock Industries 43.357 59.53 2581.042 0.49
9 ROP Roper Industries 42.157 60.77 2561.881 0.49
10 FBP First BanCorp. 40.313 63.51 2560.279 0.49
11 OSK Oshkosh Truck 35.773 68.38 2446.158 0.46
12 TKR Timken Co. 90.272 26.02 2348.877 0.45
13 PPDI Pharmaceutical Product Development 56.533 41.29 2334.248 0.44
14 TSFG South Financial Group 71.081 32.53 2312.265 0.44
15 COO The Cooper Companies 32.725 70.59 2310.058 0.44
16 GPN Global Payments Inc. 38.459 58.54 2251.390 0.43
17 LSTR Landstar System Inc. 30.315 73.64 2232.397 0.42
18 EWBC East West Bancorp 52.385 41.96 2198.075 0.42
19 FLIR FLIR Systems 34.192 63.79 2181.108 0.41
20 EGN Energen Corp. 36.442 58.95 2148.256 0.41
21 SPF Standard Pacific 33.431 64.14 2144.264 0.41

CME 2005 Equity Index Futures and Options Information Guide 83
RANK TICKER COMPANY SHARES (MIL.) PRICE ($) MARKET VALUE (MIL.) % OF 600
22 BGG Briggs & Stratton 51.532 41.58 2142.701 0.41
23 HUG Hughes Supply 66.029 32.35 2136.038 0.40
24 AVID Avid Technology 33.959 61.75 2096.968 0.40
25 ATO Atmos Energy Corp. 76.519 27.35 2092.795 0.40
26 UCBH UCBH Holdings, Inc. 45.501 45.82 2084.856 0.40
27 UGI UGI Corp. 50.955 40.91 2084.569 0.39
28 IEX IDEX Corp. 50.631 40.5 2050.556 0.39
29 SHU Shurgard Storage Centers 46.488 44.01 2045.937 0.39
30 CAI CACI International Services 29.228 68.13 1991.304 0.38
31 MOGN MGI PHARMA, Inc. 70.921 28.01 1986.497 0.38
32 SUG Southern Union 82.352 23.98 1974.801 0.37
33 CPO Corn Products Int'l 36.308 53.56 1944.656 0.37
34 FMT Fremont Gen'l 77.085 25.18 1941.000 0.37
35 CERN Cerner Corp. 36.337 53.17 1932.038 0.37
36 ESS Essex Property Trust 22.949 83.8 1923.126 0.36
37 MRX Medicis Pharmaceutical 54.703 35.11 1920.622 0.36
38 RESP Respironics Inc. 35.18 54.36 1912.385 0.36
39 AGP AMERIGROUP Corp. 25.025 75.66 1893.392 0.36
40 WTNY Whitney Holding 41.992 44.99 1889.220 0.36
Source: Standard & Poor’s As of December 31, 2004 For current list of stocks please visit www.standardandpoors.com

84 cme.com
NASDAQ-100 Index Top 40 Stocks (ranked by modified market capitalization)DEPOSITORY
RANK TICKER COMPANY MULTIPLIER (MIL.) PRICE ($) MARKET* VALUE (MIL.) % OF 100
1 MSFT Microsoft Corporation 7023.961 26.71 187609.998 7.43
2 QCOM QUALCOMM Inc. 3713.323 42.40 157444.895 6.23
3 EBAY eBay Inc. 928.690 116.28 107988.073 4.27
4 INTC Intel Corporation 4159.023 23.39 97279.547 3.85
5 CSCO Cisco Systems, Inc. 4418.954 19.30 85285.812 3.38
6 NXTL Nextel Commmunications, Inc. 2616.607 30.00 78498.210 3.11
7 DELL Dell Inc. 1716.752 42.14 72343.929 2.86
8 AMGN Amgen Inc. 1112.020 64.15 71336.083 2.82
9 AAPL Apple Computer, Inc. 1053.379 64.40 67837.607 2.68
10 SBUX Starbucks Corporation 1037.913 62.36 64724.254 2.56
11 CMCSA Comcast Corporation 1787.660 33.28 59493.324 2.35
12 ORCL Oracle Corporation 4016.748 13.72 55109.782 2.18
13 YHOO Yahoo! Inc. 1241.413 37.68 46776.441 1.85
14 BIIB Biogen Idec Inc. 681.090 66.61 45367.404 1.80
15 IACI InterActive Corp. 1346.764 27.62 37197.621 1.47
16 MXIM Maxim Intergrated Products, Inc. 856.090 42.39 36289.655 1.44
17 ERTS Electronic Arts Inc. 578.186 61.68 35662.512 1.41
18 SYMC Symantec Corporation 1381.614 25.76 35590.376 1.41
19 GENZ Genzyme Corporation 540.373 58.07 31379.460 1.24
20 BBBY Bed Bath & Beyond Inc. 760.176 39.83 30277.810 1.20

CME 2005 Equity Index Futures and Options Information Guide 85
DEPOSITORYRANK TICKER COMPANY MULTIPLIER (MIL.) PRICE ($) MARKET* VALUE (MIL.) % OF 100
21 LLTC Linear Technology Corporation 770.859 38.76 29878.494 1.18
22 PCAR PACCAR Inc. 365.772 80.48 29437.330 1.17
23 RIMM Research In Motion Ltd. 352.748 82.42 29073.490 1.15
24 APOL Apollo Group, Inc. 351.919 80.71 28403.382 1.12
25 AMAT Applied Materials Inc. 1649.702 17.10 28209.904 1.12
26 GILD Gilead Sciences, Inc. 800.830 34.99 28021.041 1.11
27 BMET Biomet, Inc. 640.274 43.39 27781.488 1.10
28 ADBE Adobe Systems Inc. 439.292 62.74 27561.180 1.09
29 TEVA Teva Pharmaceutical Industries Ltd. 863.955 29.86 25797.696 1.02
30 XLNX Xilinx, Inc. 867.962 29.65 25735.073 1.02
31 NTAP Network Appliance Corp. 704.707 33.22 23410.366 0.93
32 VRTS Veritas Software Corp. 810.478 28.55 23139.146 0.92
33 PAYX Paychex, Inc. 673.951 34.08 22968.250 0.91
34 AMZN Amazon.com Inc. 508.920 44.29 22540.066 0.89
35 COST Costco Wholesale Corp. 464.094 48.41 22466.790 0.89
36 SPLS Staples Inc. 628.235 33.71 21177.801 0.84
37 KLAC KLA Tencor Corp. 444.906 46.58 20723.721 0.82
38 ALTR Altera Corp. 983.568 20.70 20359.857 0.81
39 SIRI Sirius Satellite Radio Inc. 2569.169 7.65 19654.142 0.78
40 INTU Intuit Inc. 442.787 44.01 19487.055 0.77
Source: Standard & Poor’s As of December 31, 2004 NASDAQ-100 is a modified market capitalization-weighted indexFor current list of stocks please visit www.nasdaq.com

% OFRANK TICKER COMPANY SHARES (MIL.) PRICE ($) MARKET VALUE (MIL.) COMPOSITE
1 MSFT Microsoft Corporation 10865.000 26.71 290204.150 8.87
2 INTC Intel Corporation 6323.000 23.39 147894.970 4.52
3 CSCO Cisco Systems, Inc. 6584.739 19.30 127085.462 3.88
4 DELL Dell Inc. 2484.304 42.14 104688.570 3.20
5 AMGN Amgen Inc. 1270.136 64.15 81479.224 2.49
6 EBAY eBay Inc. 662.908 116.28 77082.942 2.35
7 ORCL Oracle Corporation 5128.466 13.72 70362.553 2.15
8 QCOM QUALCOMM Inc. 1639.082 42.40 69497.076 2.12
9 YHOO Yahoo! Inc. 1374.819 37.68 51803.179 1.58
10 CMCSA Comcast Corporation 1359.059 33.28 45229.483 1.38
11 NXTL Nextel Commmunications, Inc. 1081.627 30.00 32448.810 0.99
12 AMAT Applied Materials Inc. 1698.233 17.10 29039.784 0.89
13 CMCSK Comcast Corp. 851.388 32.84 27959.581 0.85
14 FITB Fifth Third Bancorp 561.293 47.28 26537.933 0.81
15 AAPL Apple Computer, Inc. 402.058 64.40 25892.535 0.79
16 SBUX Starbucks Corporation 397.406 62.36 24782.238 0.76
17 COST Costco Wholesale Corp. 469.072 48.41 22707.775 0.69
18 BIIB Biogen Idec Inc. 333.552 66.61 22217.898 0.68
19 ERTS Electronic Arts Inc. 305.332 61.68 18832.877 0.58
20 SYMC Symantec Corporation 703.410 25.76 18119.841 0.55
86 cme.com
NASDAQ Composite Top 40 Stocks (ranked by market capitalization)

CME 2005 Equity Index Futures and Options Information Guide 87
% OFRANK TICKER COMPANY SHARES (MIL.) PRICE ($) MARKET VALUE (MIL.) COMPOSITE
21 SUNW Sun Microsystems Inc. 3363.075 5.38 18093.343 0.55
22 AMZN Amazon.com Inc. 408.052 44.29 18072.623 0.55
23 IACI InterActive Corp. 628.010 27.62 17345.636 0.53
24 SPLS Staples Inc. 497.903 33.71 16784.310 0.51
25 RIMM Research In Motion Ltd. 187.697 82.42 15469.986 0.47
26 GILD Gilead Sciences Inc. 432.916 34.99 15147.730 0.46
27 ADBE Adobe Systems Inc. 238.627 62.74 14971.457 0.46
28 APOL Apollo Group Inc. 184.760 80.71 14911.979 0.46
29 JNPR Juniper Networks 537.613 27.19 14617.697 0.45
30 PCAR PACCAR Inc. 173.723 80.48 13981.227 0.43
31 MXIM Maxim Intergrated Products, Inc. 325.248 42.39 13787.262 0.42
32 TEVA Teva Pharmaceutical Industries Ltd. 449.698 29.86 13427.982 0.41
33 GENZ Genzyme Corporation 229.469 58.07 13325.264 0.41
34 PAYX Paychex, Inc. 378.196 34.08 12888.919 0.39
35 VRTS Veritas Software Corp. 422.130 28.55 12051.811 0.37
36 BBBY Bed Bath & Beyond Inc. 300.931 39.83 11986.081 0.37
37 NTAP Network Appliance Corp. 358.783 33.22 11918.771 0.36
38 LLTC Linear Technology Corporation 307.042 38.76 11900.947 0.36
39 GOOG Google Inc. 57.857 193.10 11172.186 0.34
40 BMET Biomet, Inc. 253.142 43.39 10983.831 0.34
Source: The Nasdaq Stock MarketAs of December 31, 2004 For current list of stocks please visit www.nasdaq.com

DEPOSITORYRANK TICKER COMPANY MULTIPLIER (MIL.) PRICE ($) MARKET* VALUE (MIL.) % OF 100
1 BYD Boyd Gaming Corp. 45.509 41.6500 1895.450 0.166
2 NEW New Century Financial 39.862 63.9100 2547.580 0.223
3 GT Goodyear Tire & Rubber 152.195 14.6600 2231.179 0.195
4 FBP First Bancorp Pr 34.385 63.5100 2183.791 0.191
5 PENN Penn National Gaming Inc. 32.008 60.5500 1938.084 0.169
6 TEX Terex Corp. 49.300 47.6500 2349.145 0.205
7 CBG Cb Richard Ellis Group. 25.225 33.5500 846.299 0.074
8 CCK Crown Holdings Inc. 165.146 13.7400 2269.106 0.198
9 GTW Gateway Inc. 222.690 6.0100 1338.367 0.117
10 LI Laidlaw International 103.806 21.4000 2221.448 0.194
11 JOYG Joy Global Inc. 50.843 43.4300 2208.111 0.193
12 VRX Valeant Pharma Intl. 83.780 26.3500 2207.603 0.193
13 LSTR Landstar Systems Inc. 29.802 73.6400 2194.619 0.192
14 OSG Overseas Shipholdng Grp. 26.902 55.2000 1484.990 0.130
15 EGN Energen Corp. 36.343 58.9500 2142.420 0.187
16 THO Thor Industries Inc. 35.799 37.0500 1326.353 0.116
17 WLK Westlake Chemical Corp. 11.768 33.4000 393.051 0.034
18 EWBC East West Bancorp Inc. 50.246 41.9600 2108.322 0.184
19 CPN Calpine Corp. 443.828 3.9400 1748.682 0.153
20 ATO Atmos Energy Corp. 76.519 27.3500 2092.795 0.183
88 cme.com
Russell 2000 Index Top 40 Stocks (ranked by market capitalization)

CME 2005 Equity Index Futures and Options Information Guide 89
Russell 2000 Index Top 40 Stocks (ranked by market capitalization)
Membership determined by market value—May 31, 2004. Ranked by total market value—December 31, 2004. Weights determined by available market value
DEPOSITORYRANK TICKER COMPANY MULTIPLIER (MIL.) PRICE ($) MARKET* VALUE (MIL.) % OF 100
21 TSO Tesoro Corp. 65.516 31.8600 2087.340 0.182
22 SGMS Scientific Games Corp. 76.521 23.8400 1824.261 0.159
23 CBRL Cbrl Group Inc. 49.598 41.8500 2075.676 0.181
24 TPX Tempur Pedic Intl Inc. 18.801 21.2000 398.581 0.035
25 ATI Allegheny Technologies 95.283 21.6700 2064.783 0.180
26 CMS Cms Energy Corp. 194.726 10.4500 2034.887 0.178
27 IEX Idex Corp. 50.143 40.5000 2030.792 0.177
28 IDC Interactive Data Corp. 36.758 21.7400 799.119 0.070
29 O Realty Income Corp. 39.614 50.5800 2003.676 0.175
30 PXP Plains Exploration & Pro 77.000 26.0000 2002.000 0.175
31 BZH Beazer Homes Usa Inc. 13.692 146.2100 2001.907 0.175
32 CYT Cytec Industries Inc. 38.881 51.4200 1999.261 0.175
33 KRO Kronos Worldwide Inc. 3.133 40.7500 127.670 0.011
34 CGI Commerce Group Inc. 24.264 61.0400 1481.075 0.129
35 RGF R & G Financial Corp. 27.798 38.8800 1080.786 0.094
36 CAI Caci International Inc. 29.136 68.1300 1985.036 0.173
37 BRCD Brocade Communications 259.397 7.6400 1981.793 0.173
38 BSG Bisys Group Inc. 120.361 16.4500 1979.938 0.173
39 AMG Affiliated Managers Grp. 24.354 67.7400 1649.740 0.144
40 SUG Southern Union Co. 66.164 23.9800 1586.613 0.139
Source: Russell Investment GroupAs of December 31, 2004 For current list of stocks please visit www.russell.com

% OFRANK TICKER COMPANY SHARES (MIL.) PRICE ($) MARKET VALUE (MIL.) COMPOSITE
1 GE General Electric Co. 10554.348 36.5000 385233.702 3.207
2 XOM Exxon Mobil Corp. 6540.046 51.2600 335242.758 2.791
3 MSFT Microsoft Corp. 9175.489 26.7100 245077.311 2.040
4 C Citigroup Inc. 5171.484 48.1800 249162.099 2.074
5 WMT Wal Mart Stores Inc. 2564.677 52.8200 135466.239 1.128
6 PFE Pfizer Inc. 7630.536 26.8900 205185.113 1.708
7 BAC Bank Of America Corp. 4077.594 46.9900 191606.142 1.595
8 JNJ Johnson & Johnson 2968.603 63.4200 188268.802 1.567
9 AIG American Intl Group 2297.846 65.6700 150899.547 1.256
10 IBM Intl Business Machines 1685.371 98.5800 166143.873 1.383
11 INTC Intel Corp. 6468.000 23.3900 151286.520 1.259
12 PG Procter & Gamble Co. 2570.598 55.0800 141588.538 1.179
13 JPM Jpmorgan Chase & Co. 3563.335 39.0100 139005.698 1.157
14 CSCO Cisco Systems Inc. 6761.489 19.3000 130496.738 1.086
15 MO Altria Group Inc. 2050.803 61.1000 125304.063 1.043
16 CVX Chevrontexaco Corp. 2140.106 52.5100 112376.966 0.936
17 VZ Verizon Communications 2770.312 40.5100 112225.339 0.934
18 DELL Dell Inc. 2531.661 42.1400 106684.195 0.888
19 WFC Wells Fargo & Co. 1687.552 62.1500 104881.357 0.873
20 KO Coca Cola Co. 2109.298 41.6300 87810.076 0.731
90 cme.com
Russell 1000 Index Top 40 Stocks (ranked by market capitalization)

CME 2005 Equity Index Futures and Options Information Guide 91
Russell 1000 Index Top 40 Stocks (ranked by market capitalization)
Membership determined by market value—May 31, 2004. Ranked by total market value—December 31, 2004. Weights determined by available market value.
% OFRANK TICKER COMPANY SHARES (MIL.) PRICE ($) MARKET VALUE (MIL.) COMPOSITE
21 UPS United Parcel Service 571.472 85.4600 48837.997 0.407
22 HD Home Depot Inc. 2241.908 42.7400 95819.148 0.798
23 PEP Pepsico Inc. 1707.026 52.2000 89106.757 0.742
24 TWX Time Warner Inc. 4386.255 19.4400 85268.797 0.710
25 SBC Sbc Communications Inc. 3311.878 25.7700 85347.096 0.711
26 WB Wachovia Corp. 1608.258 52.6000 84594.371 0.704
27 AMGN Amgen Inc. 1295.705 64.1500 83119.476 0.692
28 EBAY Ebay Inc. 519.314 116.2800 60385.832 0.503
29 CMCSA Comcast Corp. 2141.539 33.2800 71270.418 0.593
30 ABT Abbott Laboratories 1559.676 46.6500 72758.885 0.606
31 AXP American Express Co. 1128.360 56.3700 63605.653 0.530
32 MRK Merck & Co Inc. 2222.109 32.1400 71418.583 0.595
33 ORCL Oracle Corp. 3776.756 13.7200 51817.092 0.431
34 FNM Federal Natl Mtg Assoc. 969.103 71.2100 69009.825 0.575
35 QCOM Qualcomm Inc. 1620.386 42.4000 68704.366 0.572
36 MMM 3M Co. 782.114 82.0700 64188.096 0.534
37 LLY Lilly Eli & Co. 974.746 56.7500 55316.836 0.461
38 HPQ Hewlett Packard Co. 3051.552 20.9700 63991.045 0.533
39 VIA.B Viacom Inc. 1503.670 36.3900 54718.551 0.456
40 KFT Kraft Foods Inc. 266.706 35.6100 9497.401 0.079
Source: Russell Investment GroupAs of December 31, 2004 For current list of stocks please visit www.russell.com

92 cme.com
% OFRANK TICKER COMPANY SHARES (MIL.) PRICE ($) MARKET VALUE (MIL.) GROWTH
1 GE General Electric 10572.133 36.5 385882.855 6.86
2 XOM Exxon Mobil Corp. 6451.296 51.26 330693.433 5.88
3 MSFT Microsoft Corp. 10871.590 26.71 290380.169 5.16
4 WMT Wal-Mart Stores 4234.867 52.82 223685.675 3.98
5 JNJ Johnson & Johnson 2967.726 63.42 188213.183 3.34
6 IBM International Bus. Machines 1664.697 98.58 164105.830 2.92
7 INTC Intel Corp. 6323.000 23.39 147894.970 2.63
8 PG Procter & Gamble 2536.683 55.08 139720.500 2.48
9 CSCO Cisco Systems 6584.739 19.3 127085.463 2.26
10 MO Altria Group, Inc. 2052.579 61.1 125412.577 2.23
11 DELL Dell Inc. 2484.304 42.14 104688.571 1.86
12 KO Coca Cola Co. 2419.436 41.63 100721.121 1.79
13 UPS United Parcel Service 1120.793 85.46 95782.970 1.70
14 HD Home Depot 2195.955 42.74 93855.117 1.67
15 PEP PepsiCo Inc. 1684.480 52.2 87929.856 1.56
16 AMGN Amgen 1270.136 64.15 81479.224 1.45
17 EBAY eBay Inc. 662.908 116.28 77082.942 1.37
18 ABT Abbott Labs 1557.392 46.65 72652.337 1.29
19 MRK Merck & Co. 2217.585 32.14 71273.182 1.27
20 AXP American Express 1255.188 56.37 70754.948 1.26
S&P 500/BARRA Growth Index Top 40 Stocks (ranked by market capitalization)

CME 2005 Equity Index Futures and Options Information Guide 93
% OFRANK TICKER COMPANY SHARES (MIL.) PRICE ($) MARKET VALUE (MIL.) GROWTH
21 ORCL Oracle Corp. 5128.466 13.72 70362.554 1.25
22 QCOM QUALCOMM Inc. 1639.082 42.4 69497.077 1.24
23 LLY Lilly (Eli) & Co. 1131.639 56.75 64220.513 1.14
24 MMM 3M Company 778.534 82.07 63894.285 1.14
25 MDT Medtronic Inc. 1208.725 49.67 60037.371 1.07
26 UNH United Health Group Inc. 653.629 88.03 57538.961 1.02
27 WYE Wyeth 1334.196 42.59 56823.408 1.01
28 UTX United Technologies 511.043 103.35 52816.294 0.94
29 YHOO Yahoo Inc. 1374.819 37.68 51803.180 0.92
30 BMY Bristol-Myers Squibb 1945.607 25.62 49846.451 0.89
31 DD Du Pont (E.I.) 993.193 49.05 48716.117 0.87
32 DOW Dow Chemical 942.970 49.51 46686.445 0.83
33 TGT Target Corp. 895.426 51.93 46499.472 0.83
34 LOW Lowe's Cos. 772.761 57.59 44503.306 0.79
35 G Gillette Co. 992.811 44.78 44458.077 0.79
36 BA Boeing Company 839.597 51.77 43465.937 0.77
37 BUD Anheuser-Busch 790.068 50.73 40080.150 0.71
38 SLB Schlumberger Ltd. 588.743 66.95 39416.344 0.70
39 WAG Walgreen Co. 1021.979 38.37 39213.334 0.70
40 FDC First Data 829.846 42.54 35301.649 0.63
Source: Standard and Poor’sAs of December 31, 2004 For current list of stocks please visit www.standardandpoors.com

94 cme.com
S&P 500/BARRA Value Index Top 40 Stocks (ranked by market capitalization)% OF
RANK TICKER COMPANY SHARES (MIL.) PRICE ($) MARKET VALUE (MIL.) VALUE
1 C Citigroup Inc. 5189.753 48.18 250042.300 4.42
2 PFE Pfizer, Inc. 7530.995 26.89 202508.456 3.58
3 BAC Bank of America Corp. 4039.177 46.99 189800.927 3.35
4 AIG American Int'l. Group 2604.571 65.67 171042.178 3.02
5 JPM JPMorgan Chase & Co. 3562.463 39.01 138971.682 2.45
6 VZ Verizon Communications 2768.958 40.51 112170.489 1.98
7 CVX ChevronTexaco Corp. 2118.612 52.51 111248.316 1.96
8 WFC Wells Fargo 1691.869 62.15 105149.658 1.86
9 TWX Time Warner Inc. 4580.374 19.44 89042.471 1.57
10 SBC SBC Communications Inc. 3315.414 25.77 85438.219 1.51
11 WB Wachovia Corp. (New) 1603.640 52.6 84351.464 1.49
12 CMCSA Comcast Corp. 2219.891 33.28 73877.972 1.30
13 TYC Tyco International 2011.602 35.74 71894.655 1.27
14 FNM Fannie Mae 967.904 71.21 68924.444 1.22
15 HPQ Hewlett-Packard 3019.899 20.97 63327.282 1.12
16 VIA.B Viacom Inc. 1705.030 36.39 62046.042 1.10
17 MWD Morgan Stanley 1094.573 55.52 60770.693 1.07
18 COP ConocoPhillips 690.233 86.83 59932.931 1.06
19 USB U.S. Bancorp 1867.158 31.32 58479.389 1.03
20 DIS Walt Disney Co. 2043.283 27.8 56803.267 1.00
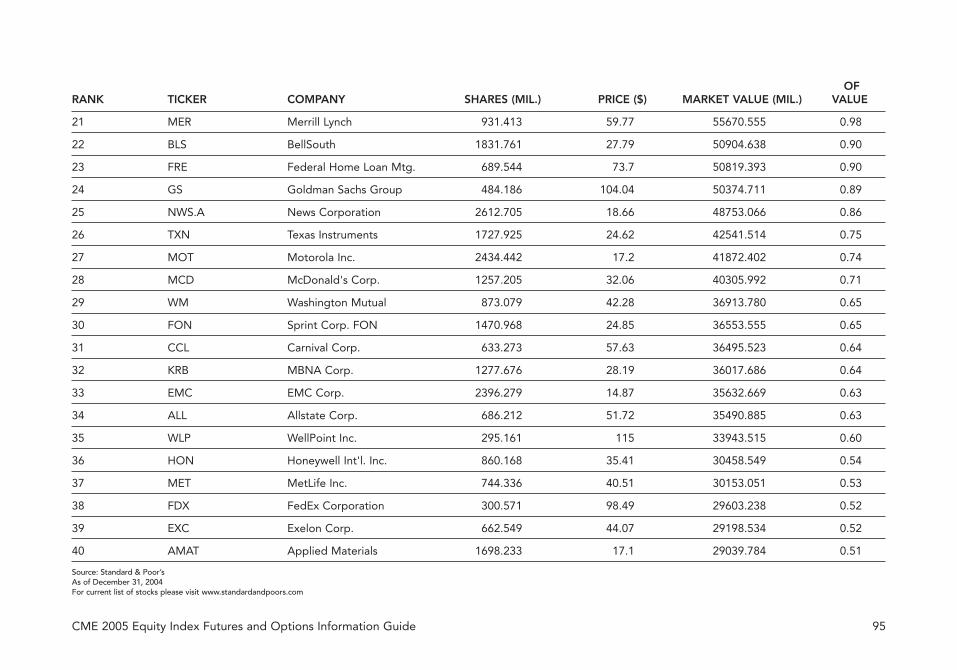
CME 2005 Equity Index Futures and Options Information Guide 95
OFRANK TICKER COMPANY SHARES (MIL.) PRICE ($) MARKET VALUE (MIL.) VALUE
21 MER Merrill Lynch 931.413 59.77 55670.555 0.98
22 BLS BellSouth 1831.761 27.79 50904.638 0.90
23 FRE Federal Home Loan Mtg. 689.544 73.7 50819.393 0.90
24 GS Goldman Sachs Group 484.186 104.04 50374.711 0.89
25 NWS.A News Corporation 2612.705 18.66 48753.066 0.86
26 TXN Texas Instruments 1727.925 24.62 42541.514 0.75
27 MOT Motorola Inc. 2434.442 17.2 41872.402 0.74
28 MCD McDonald's Corp. 1257.205 32.06 40305.992 0.71
29 WM Washington Mutual 873.079 42.28 36913.780 0.65
30 FON Sprint Corp. FON 1470.968 24.85 36553.555 0.65
31 CCL Carnival Corp. 633.273 57.63 36495.523 0.64
32 KRB MBNA Corp. 1277.676 28.19 36017.686 0.64
33 EMC EMC Corp. 2396.279 14.87 35632.669 0.63
34 ALL Allstate Corp. 686.212 51.72 35490.885 0.63
35 WLP WellPoint Inc. 295.161 115 33943.515 0.60
36 HON Honeywell Int'l. Inc. 860.168 35.41 30458.549 0.54
37 MET MetLife Inc. 744.336 40.51 30153.051 0.53
38 FDX FedEx Corporation 300.571 98.49 29603.238 0.52
39 EXC Exelon Corp. 662.549 44.07 29198.534 0.52
40 AMAT Applied Materials 1698.233 17.1 29039.784 0.51
Source: Standard & Poor’s As of December 31, 2004 For current list of stocks please visit www.standardandpoors.com

% OFRANK TICKER COMPANY SHARES (MIL.) PRICE ($) MARKET VALUE (MIL.) FINANCIAL
1 C Citigroup Inc. 5189.753 48.18 250042.300 2.22
2 BAC Bank of America Corp. 4039.177 46.99 189800.927 1.68
3 AIG American Int'l. Group 2604.571 65.67 171042.178 1.52
4 JPM JPMorgan Chase & Co. 3562.463 39.01 138971.682 1.23
5 WFC Wells Fargo 1691.869 62.15 105149.658 0.93
6 WB Wachovia Corp. (New) 1603.640 52.6 84351.464 0.75
7 AXP American Express 1255.188 56.37 70754.948 0.63
8 FNM Fannie Mae 967.904 71.21 68924.444 0.61
9 MWD Morgan Stanley 1094.573 55.52 60770.693 0.54
10 USB U.S. Bancorp 1867.158 31.32 58479.389 0.52
11 MER Merrill Lynch 931.413 59.77 55670.555 0.49
12 FRE Federal Home Loan Mtg. 689.544 73.7 50819.393 0.45
13 GS Goldman Sachs Group 484.186 104.04 50374.711 0.45
14 WM Washington Mutual 873.079 42.28 36913.780 0.33
15 KRB MBNA Corp. 1277.676 28.19 36017.686 0.32
16 ALL Allstate Corp. 686.212 51.72 35490.885 0.31
17 MET MetLife Inc. 744.336 40.51 30153.051 0.27
18 PRU Prudential Financial 513.000 54.96 28194.480 0.25
19 STI SunTrust Banks 370.774 73.88 27392.783 0.24
20 FITB Fifth Third Bancorp 561.293 47.28 26537.933 0.24
96 cme.com
Financial SPCTR Index Top 40 Stocks

CME 2005 Equity Index Futures and Options Information Guide 97
% OFRANK TICKER COMPANY SHARES (MIL.) PRICE ($) MARKET VALUE (MIL.) FINANCIAL
21 BK Bank of New York 776.902 33.42 25964.065 0.23
22 NCC National City Corp. 677.539 37.55 25441.589 0.23
23 STA St. Paul Travelers Cos. 669.462 37.07 24816.956 0.22
24 LEH Lehman Bros. 269.418 87.48 23568.687 0.21
25 BBT BB&T Corporation 552.368 42.05 23227.074 0.21
26 SLM SLM Corporation 429.829 53.39 22948.570 0.20
27 CFC Countrywide Financial Corp. 580.418 37.01 21481.270 0.19
28 COF Capital One Financial 242.717 84.21 20439.199 0.18
29 HIG Hartford Financial Svc. Gp. 293.711 69.31 20357.109 0.18
30 AFL AFLAC Inc. 505.984 39.84 20158.403 0.18
31 GDW Golden West Financial 306.206 61.42 18807.173 0.17
32 BEN Franklin Resources 249.384 69.65 17369.596 0.15
33 MMC Marsh & McLennan 526.927 32.9 17335.898 0.15
34 PGR Progressive Corp. 200.204 84.84 16985.307 0.15
35 RF Regions Financial Corp. (New) 464.790 35.59 16541.876 0.15
36 STT State Street Corp. 333.411 49.12 16377.148 0.15
37 PNC PNC Bank Corp. 282.638 57.44 16234.727 0.14
38 SCH Charles Schwab 1346.976 11.96 16109.833 0.14
39 CB Chubb Corp. 191.559 76.9 14730.887 0.13
40 SPG Simon Property Group, Inc. 221.167 64.67 14302.870 0.13
Source: Standard & Poor’s As of December 31, 2004 For current list of stocks please visit www.standardandpoors.com

% OFRANK TICKER COMPANY SHARES (MIL.) PRICE ($) MARKET VALUE (MIL.) TECHNOLOGY
1 MSFT Microsoft Corp. 10871.590 26.71 290380.169 13.32
2 IBM International Bus. Machines 1664.697 98.58 164105.830 7.52
3 INTC Intel Corp. 6323.000 23.39 147894.970 6.78
4 CSCO Cisco Systems 6584.739 19.3 127085.463 5.83
5 VZ Verizon Communications 2768.958 40.51 112170.489 5.14
6 DELL Dell Inc. 2484.304 42.14 104688.571 4.80
7 SBC SBC Communications Inc. 3315.414 25.77 85438.219 3.92
8 ORCL Oracle Corp. 5128.466 13.72 70362.554 3.23
9 QCOM QUALCOMM Inc. 1639.082 42.4 69497.077 3.19
10 HPQ Hewlett-Packard 3019.899 20.97 63327.282 2.90
11 YHOO Yahoo Inc. 1374.819 37.68 51803.180 2.38
12 BLS BellSouth 1831.761 27.79 50904.638 2.33
13 TXN Texas Instruments 1727.925 24.62 42541.514 1.95
14 MOT Motorola Inc. 2434.442 17.2 41872.402 1.92
15 FON Sprint Corp. FON 1470.968 24.85 36553.555 1.68
16 EMC EMC Corp. 2396.279 14.87 35632.669 1.63
17 FDC First Data 829.846 42.54 35301.649 1.62
18 NXTL Nextel Communications 1111.287 30 33338.610 1.53
19 AMAT Applied Materials 1698.233 17.1 29039.784 1.33
20 AAPL Apple Computer 402.058 64.4 25892.535 1.19
98 cme.com
Technology SPCTR Index Top 40 Stocks

CME 2005 Equity Index Futures and Options Information Guide 99
% OFRANK TICKER COMPANY SHARES (MIL.) PRICE ($) MARKET VALUE (MIL.) TECHNOLOGY
21 ADP Automatic Data Processing Inc. 582.538 44.35 25835.560 1.18
22 ERTS Electronic Arts 305.332 61.68 18832.878 0.86
23 CA Computer Associates Intl. 585.643 31.06 18190.072 0.83
24 SUNW Sun Microsystems 3363.075 5.38 18093.344 0.83
25 AT ALLTEL Corp. 303.758 58.76 17848.820 0.82
26 LU Lucent Technologies 4420.636 3.76 16621.591 0.76
27 GLW Corning Inc. 1402.239 11.77 16504.353 0.76
28 SYMC Symantec Corp. 634.188 25.76 16336.683 0.75
29 XRX Xerox Corp. 953.591 17.01 16220.583 0.74
30 T AT&T Corp. (New) 795.869 19.06 15169.263 0.70
31 ADBE Adobe Systems 238.627 62.74 14971.458 0.69
32 ADI Analog Devices 375.840 36.92 13876.013 0.64
33 MXIM Maxim Integrated Prod 325.248 42.39 13787.263 0.63
34 PAYX Paychex Inc. 378.196 34.08 12888.920 0.59
35 VRTS Veritas Software 422.130 28.55 12051.812 0.55
36 NTAP Network Appliance 358.783 33.22 11918.771 0.55
37 LLTC Linear Technology Corp. 307.042 38.76 11900.948 0.55
38 EDS Electronic Data Systems 513.852 23.1 11869.981 0.54
39 A Agilent Technologies 485.606 24.1 11703.105 0.54
40 LXK Lexmark Int'l Inc. 129.088 85 10972.480 0.50
Source: Standard & Poor’s As of December 31, 2004 For current list of stocks please visit www.standardandpoors.com

100 cme.com
Nikkei 225 Top 40 Stocks (ranked by market capitalization)SHARES OUTSTANDING* PRICE MARKET VALUE
RANK CODE COMPANY (000) (YEN) (000’S YEN)
1 T7203 Toyota Motor 3,609,997 4170 15,053,689,542
2 T9437 NTT Docomo 50,180 189000 9,484,020,000
3 T9432 Nippon Telegraph & Telephone 15,741 460000 7,240,956,140
4 T8306 Mitsubishi Tokyo Financial 6,545 1040000 6,807,167,120
5 T8411 Mizuho Financial Group 11,941 516000 6,161,540,520
6 T7201 Nissan Motor 4,520,715 1114 5,036,076,635
7 T7267 Honda Motor 939,414 5310 4,988,289,482
8 T7751 Canon 887,977 5530 4,910,510,504
9 T8316 Sumitomo Mitsui Financial Group 6,237 745000 4,646,231,240
10 T4502 Takeda Pharmaceutical 889,272 5160 4,588,645,558
11 T6752 Matsushita Electric Industrial 2,453,053 1626 3,988,664,986
12 T6758 Sony 926,457 3960 3,668,770,338
13 T9501 Tokyo Electric Power 1,352,868 2515 3,402,461,840
14 T8307 UFJ Holdings 5,139 621000 3,191,028,993
15 T8604 Nomura Holdings 1,965,920 1494 2,937,084,271
16 T8766 Millea Holdings 1,787 1520000 2,716,312,960
17 T8183 Seven-Eleven Japan 822,890 3230 2,657,934,648
18 T6902 Denso 884,069 2745 2,426,768,617
19 T6501 Hitachi 3,368,126 710 2,391,369,500
20 T8308 Resona Holdings 11,375,110 208 2,366,022,910

CME 2005 Equity Index Futures and Options Information Guide 101
SHARES OUTSTANDING* PRICE MARKET VALUERANK CODE COMPANY (000) (YEN) (000’S YEN)
21 T9433 KDDI 4,241 552000 2,340,965,760
22 T2914 Japan Tobacco 2,000 1170000 2,340,000,000
23 T9020 East Japan Railway 4,000 570000 2,280,000,000
24 T8058 Mitsubishi 1,567,283 1324 2,075,082,041
25 T9503 Kansai Electric Power 962,699 2080 2,002,413,354
26 T4901 Fuji Photo Film 514,626 3740 1,924,700,223
27 T6753 Sharp 1,110,700 1673 1,858,200,911
28 T9502 Chubu Electric Power 736,857 2460 1,812,668,680
29 T8264 Ito-Yokado 418,718 4300 1,800,486,046
30 T4063 Shin-Etsu Chemical 426,433 4200 1,791,017,676
31 T5108 Bridgestone 863,102 2040 1,760,728,735
32 T9984 Softbank 351,477 4990 1,753,869,362
33 T5411 JFE Holdings 587,235 2925 1,717,663,188
34 T5401 Nippon Steel 6,806,981 251 1,708,552,225
35 T6954 Fanuc 239,508 6700 1,604,705,724
36 T8802 Mitsubishi Estate 1,299,185 1200 1,559,022,065
37 T6971 Kyocera 191,309 7890 1,509,430,298
38 T4452 Kao 574,444 2620 1,505,042,497
39 T7752 Ricoh 744,912 1977 1,472,691,178
40 T8031 Mitsui 1,583,687 919 1,455,408,649
Source: Nihon Keizai Shimbun, Inc.As of December 31, 2004
*Shares Outstanding is the number of shares issued—not the number of shares listed.

COMPANY SYMBOL EXCHANGE
Advantest Corporation ATE NYSE
Canon Inc. CAJ NYSE
Hitachi, Ltd. HIT NYSE
Honda Motor Co., Ltd. HMC NYSE
Konami Corporation KNM NYSE
Kubota Corporation KUB NYSE
Kyocera Corporation KYO NYSE
Matsushita Electric Industrial Co. Ltd. MC NYSE
Mitsubishi Tokyo Financial Group, Inc. MTF NYSE
Nidec Corporation NJ NYSE
Nippon Telegraph and Telephone Corporation NTT NYSE
Nissin Co. Ltd. NIS NYSE
Nomura Holdings, Inc. NMR NYSE
NTT DoComo, Inc. DCM NYSE
ORIX Corporation IX NYSE
Pioneer Electronic Corporation PIO NYSE
COMPANY SYMBOL EXCHANGE
Sony Corporation SNE NYSE
TDK Corporation TDK NYSE
Toyota Motor Corporation TM NYSE
CSK Coporation CSKKY NASDAQ
Dai’ei, Inc. DAIEY NASDAQ
Fuji Photo Film Co., Ltd. FUJIY NASDAQ
Internet Initiative Japan, Inc. IIJI NASDAQ
Kirin Brewery Company, Limited KNBWY NASDAQ
Makita Corp. MKTAY NASDAQ
Millea Holdings Inc. MLEA NASDAQ
Mitsui & Company, Ltd. MITSY NASDAQ
NEC Corporation NIPNY NASDAQ
Nissan Motor Co., Ltd. NSANY NASDAQ
Sanyo Electric Co., Ltd. SANYY NASDAQ
Trend Micro Inc. WI TMIC NASDAQ
Wacoal Corp. WACLY NASDAQ
Sources: NYSE and The Nasdaq Stock Market
102 cme.com
Japanese ADRs

CME 2005 Equity Index Futures and Options Information Guide 103
Sector BreakdownCONSUMER CONSUMER HEALTH INFORMATION TELECOM
DISCRETIONARY STAPLES ENERGY FINANCIALS CARE INDUSTRIALS TECHNOLOGY MATERIALS SERVICES UTILITIES
% % % % % % % % % %
S&P 500 11.9 10.5 7.2 20.6 12.7 11.8 16.1 3.1 3.3 2.9
S&P MidCap 400 19.4 4.5 6.8 18.5 10.8 12.8 14.6 5.3 0.5 6.8
S&P SmallCap 600 17.3 3.4 5.7 15.6 12.3 19.5 15.9 6.1 0.3 4.0
S&P 500/BARRA Growth 10.4 18.3 7.4 2.4 17.6 15.7 24.3 2.7 0.7 0.5
S&P 500/BARRA Value 13.3 2.7 6.9 38.8 7.8 7.9 7.9 3.5 5.8 5.4
INFORMATION COMPUTER RETAIL/ PHARMA-TECHNOLOGY SOFTWARE/ WHOLESALE OTHER CEUTICALS & CONSUMER TRANSPOR-
HARDWARE SERVICES TRADE SERVICES BIOTECHNOLOGY TELECOM MANUFACTURING HEALTH GOODS TATION
% % % % % % % % % %
NASDAQ-100 33.87 20.59 12.04 11.69 9.72 4.31 3.33 2.54 1.13 0.78
INFORMATION COMPUTER PHARMA- RETAIL/TECHNOLOGY SOFTWARE/ OTHER CEUTICALS & WHOLESALE MANU- CONSUMER TRANSPOR-
HARDWARE SERVICES FINANCIALS SERVICES BIOTECHNOLOGY TRADE FACTURING HEALTH TELECOM GOODS TATION RESOURCES UTILITIES
% % % % % % % % % % % % %
NASDAQ Composite 25.91 21.10 10.67 9.66 9.23 7.87 4.55 3.91 2.29 2.27 1.53 0.86 0.15
CONSUMER CONSUMER OTHER FINANCIAL HEALTH PRODUCER MATERIALS & AUTO & INTEGRATEDDISCRETIONARY STAPLES OTHER ENERGY SERVICES CARE DURABLES TECHNOLOGY PROCESSING TRANSPORTATION UTILITIES OILS OTHER
% % % % % % % % % %Russell 1000 14.5 6.9 2.1 22.7 12.9 4.3 14.0 3.8 2.4 7.1 4.7 4.5
Russell 2000 18.0 1.6 0.4 23.7 12.0 7.8 12.6 10.2 4.5 4.2 0.1 0.4
Sources: Standard and Poor’s, NASDAQ Stock Market, Russell Investment Group, Nihon Keizai Shimbun, Inc. and CME As of December 31, 2004

S&P 500 INDEX
Location Number of Issues Percent by Capitalization
NYSE Issues 425 84.6
AMEX Issues 1 0.1
NASDAQ Issues 74 15.3
S&P MIDCAP 400 INDEX
Location Number of Issues Percent by Capitalization
NYSE Issues 285 74.0
AMEX Issues 2 0.8
NASDAQ Issues 113 25.2
S&P SMALLCAP 600 INDEX
Location Number of Issues Percent by Capitalization
NYSE Issues 317 58.2
AMEX Issues 6 1.3
NASDAQ Issues 277 40.5
S&P 500/BARRA GROWTH INDEX
Location Number of Issues Percent by Capitalization
NYSE Issues 136 75.1
NASDAQ Issues 42 24.9
Sources: Standard & Poor‘s and Russell Investment Group As of December 31, 2004
• Nikkei 225 stocks are all listed on the Tokoyo Stock Exchange.
• NASDAQ-100 and NASDAQ Composite stocks are all listed on the Nasdaq Stock Market.
S&P 500/BARRA VALUE INDEX
Location Number of Issues Percent by Capitalization
NYSE Issues 289 94.1
AMEX Issues 1 0.1
NASDAQ Issues 32 5.8
RUSSELL 1000 INDEX
Location Number of Issues Percent by Capitalization
NYSE Issues 761 82.8
AMEX Issues 5 0.1
NASDAQ Issues 224 17.1
RUSSELL 2000 INDEX
Location Number of Issues Percent by Capitalization
NYSE Issues 738 49.88
AMEX Issues 53 1.57
NASDAQ Issues 1230 48.53
Pacific Issues 1 0.02
FINANCIAL SECTOR INDEX (SPCTR FUTURES)
Location Number of Issues Percent by Capitalization
NYSE Issues 74 96.7
NASDAQ Issues 8 3.3
TECHNOLOGY SECTOR INDEX (SPCTR FUTURES)
Location Number of Issues Percent by Capitalization
NYSE Issues 45 44.6
NASDAQ Issues 45 55.4
104 cme.com
Market Location of Underlying Issues

CME 2005 Equity Index Futures and Options Information Guide 105
S&P 500 INDEX
Stock Capitalization (millions)
Largest 385,882.855
Median 10,605.429
Average 22,577.140
Smallest 748.745
S&P MIDCAP 400 INDEX
Stock Capitalization (millions)
Largest 9,407.501
Median 2,363.606
Average 2,694.303
Smallest 344.418
*RUSSELL 2000 INDEX
Stock Capitalization (millions)
Largest 3,610.389
Median 560.543
Average 703.074
Smallest 59.209
*RUSSELL 1000 INDEX
Stock Capitalization (millions)
Largest 385,233.702
Median 4,526.073
Average 13,181.741
Smallest 495.227
†NASDAQ-100 INDEX
Stock Capitalization (millions)
Largest 187,609.998
Median 15,035.398
Average 25,266.902
Smallest 3,837.101
S&P 500/BARRA GROWTH INDEX
Stock Capitalization (millions)
Largest 385,882.855
Median 13,928.620
Average 31,610.795
Smallest 967.994
S&P 500/BARRA VALUE INDEX
Stock Capitalization (millions)
Largest 250,042.300
Median 9,221.283
Average 17,583.381
Smallest 748.745
Market Capitalization Comparisons

S&P SMALLCAP 600 INDEX
Stock Capitalization (millions)
Largest 4,894.153
Median 758.763
Average 879.647
Smallest 68.562
S&P FINANCIAL SECTOR INDEX (SPCTR FUTURES)
Stock Capitalization (millions)
Largest 250,042.300
Median 13,681.229
Average 28,416.341
Smallest 3,266.632
S&P TECHNOLOGY SECTOR INDEX (SPCTR FUTURES)
Stock Capitalization (millions)
Largest 290,380.169
Median 8,603.621
Average 24,231.537
Smallest 1,297.282
NASDAQ COMPOSITE INDEX
Stock Capitalization (millions)
Largest 290,204.150
Median 188.705
Average 1,009.934
Smallest 0.071
Sources: Standard & Poor’s, Russell Investment Group, and The Nasdaq Stock Market As of December 31, 2004
*Membership determined by total market value—May 31, 2004Ranked by total market value—December 31, 2004 †NASDAQ-100 is a modified market capitalization-weighted index
106 cme.com
Market Capitalization Comparisons

CME 2005 Equity Index Futures and Options Information Guide 107
SECTION IV:
Statistical Data

108 cme.com
Historical Volatilities and Price Returns
HISTORICAL VOLATILITIES
S&P RUSSELL RUSSELL NASDAQ- NASDAQ S&P SMALLCAP
S&P 500 MIDCAP 400 2000 1000 100 COMPOSITE 600 NIKKEI 225
% % % % % % % %
2004 11.09 13.34 17.96 11.10 18.41 16.96 16.52 18.02
2003 17.04 16.38 18.88 16.78 25.59 22.22 17.40 23.03
2002 25.96 25.09 25.13 26.40 42.99 34.91 24.38 25.86
2001 21.56 22.91 23.37 22.06 55.70 43.31 NA 29.32
2000 22.23 27.17 29.19 23.19 56.63 48.75 NA 22.71
1999 18.05 16.18 14.23 17.74 33.31 27.28 NA 20.49
1998 20.34 21.23 20.25 20.08 32.34 26.56 NA 27.14
1997 18.18 14.33 13.12 17.29 27.06 18.52 NA 27.92
1996 11.80 11.61 10.70 11.65 22.55 15.43 NA 15.69
1995 7.80 9.88 8.20 7.93 22.22 13.33 NA 22.74
PRICE RETURNS
S&P RUSSELL RUSSELL NASDAQ- NASDAQ S&P SMALLCAP
S&P 500 MIDCAP 400 2000 1000 100 COMPOSITE 600 NIKKEI 225
% % % % % % %
2004 8.99 15.16 17.00 9.49 10.44 8.59 21.59 7.61
2003 26.38 34.02 45.37 27.54 49.12 50.01 37.53 24.45
2002 –23.37 –15.45 –21.58 –22.94 –37.58 –31.53 –15.32 –18.63
2001 –13.04 –1.63 1.03 –13.59 –32.65 –21.05 NA –23.52
2000 –10.14 16.21 –4.20 –8.84 –36.84 –39.29 NA –27.19
1999 19.53 13.35 19.62 19.46 101.95 85.59 NA 36.79
1998 26.67 17.68 –3.45 25.12 85.31 39.63 NA –9.28
1997 31.01 30.44 20.52 30.49 20.63 21.64 NA –21.19
1996 20.26 17.32 14.76 19.72 42.54 22.71 NA –2.55
1995 34.11 28.56 26.21 34.44 42.54 39.92 NA 0.74
Sources: CME Equity Index Products, Bloomberg, and Reuters

CME 2005 Equity Index Futures and Options Information Guide 109
Correlation Matrices of Daily Returns
2004S&P S&P RUSSELL RUSSELL NASDAQ- NASDAQ NIKKEI
S&P 500 MIDCAP 400 SMALLCAP 1000 2000 100 COMPOSITE 225
S&P 500 100.00S&P MidCap 400 90.89 100.00S&P SmallCap 600 87.71 95.20 100.00Russell 1000 99.84 92.69 89.22 100.00Russell 2000 87.80 95.95 98.57 89.46 100.00NASDAQ 100 87.52 84.86 83.40 89.97 86.02 100.00NASDAQ Composite 89.68 89.82 89.21 90.56 91.99 98.20 100.00Nikkei 225 37.87 43.12 38.39 38.97 39.75 38.73 40.28 100.00
2003S&P S&P RUSSELL RUSSELL NASDAQ- NASDAQ NIKKEI
S&P 500 MIDCAP 400 SMALLCAP 600 1000 2000 100 COMPOSITE 225
S&P 500 100.00S&P MidCap 400 92.53 100.00S&P SmallCap 600 85.77 94.86 100.00Russell 1000 99.91 93.81 87.11 100.00Russell 2000 85.39 94.61 98.34 86.77 100.00NASDAQ 100 90.46 88.28 84.33 90.80 86.14 100.00NASDAQ Composite 91.58 91.39 89.25 92.14 91.21 98.91 100.00Nikkei 225 40.47 42.27 45.94 40.97 44.11 39.91 41.83 100.00
2002S&P RUSSELL NASDAQ- S&P 500/ S&P 500/ S&P NIKKEI
S&P 500 MIDCAP 400 2000 100 BARRA GROWTH BARRA VALUE SMALLCAP 600 225
S&P 500 100.00S&P MidCap 400 94.95 100.00Russell 2000 88.73 95.19 100.00NASDAQ 100 87.41 86.45 84.41 100.00S&P 500/BARRA Growth 97.18 90.52 84.75 88.36 100.00S&P 500/BARRA Value 97.23 93.66 87.53 80.60 91.11 100.00S&P SmallCap 600 89.58 95.09 98.05 80.96 86.10 89.39 100.00Nikkei 225 37.43 37.72 38.19 34.68 37.82 37.21 37.80 100.00
Sources: CME Equity Index Products, Bloomberg, and Reuters Note: U.S. taken as lead trade date for correlations to NK 225

110 cme.com
Index Dividend Yield
2004S&P S&P RUSSELL RUSSELL
DATE 500 MIDCAP 400 2000 1000
Jan. 1.63 1.06 0.95 1.65Feb. 1.63 1.06 0.97 1.65Mar. 1.68 1.07 0.98 1.69Apr. 1.73 1.13 1.04 1.75May 1.71 1.13 1.04 1.74Jun. 1.70 1.09 1.04 1.69Jul. 1.79 1.17 1.13 1.79
Aug. 1.80 1.19 1.16 1.79Sep. 1.79 1.16 1.11 1.78Oct. 1.78 1.14 1.10 1.77Nov. 1.74 1.10 1.04 1.73Dec. 1.72 1.08 1.04 1.69
2003S&P S&P RUSSELL RUSSELL
DATE 500 MIDCAP 400 2000 1000
Jan. 1.89 1.28 1.56 1.92Feb. 1.93 1.30 1.63 1.96Mar. 1.92 1.30 1.57 1.95Apr. 1.78 1.22 1.47 1.81May 1.70 1.13 1.33 1.74Jun. 1.70 1.13 1.17 1.73Jul. 1.77 1.12 1.11 1.78
Aug. 1.75 1.10 1.07 1.76Sep. 1.79 1.12 1.09 1.79Oct. 1.69 1.11 1.01 1.70Nov. 1.69 1.08 0.99 1.69Dec. 1.63 1.08 1.00 1.64
2002S&P S&P RUSSELL RUSSELL
DATE 500 MIDCAP 400 2000 1000
Jan. 1.63 1.24 1.28 1.41Feb. 1.70 1.23 1.33 1.44Mar. 1.59 1.14 1.24 1.39Apr. 1.72 1.15 1.22 1.48May 1.73 1.17 1.28 1.51Jun. 1.87 1.26 1.95 1.62Jul. 1.98 1.40 1.43 1.76
Aug. 1.95 1.37 1.45 1.75Sep. 2.14 1.43 1.57 1.97Oct. 1.99 1.37 1.52 1.82Nov. 1.90 1.27 1.40 1.73Dec. 2.03 1.37 1.48 1.85
2001S&P S&P RUSSELL RUSSELL
DATE 500 MIDCAP 400 2000 1000
Jan. 1.44 1.19 1.37 1.16Feb. 1.59 1.31 1.47 1.27Mar. 1.66 1.43 1.55 1.37Apr. 1.57 1.31 1.45 1.27May 1.55 1.28 1.42 1.26Jun. 1.56 1.24 1.24 1.28Jul. 1.51 1.21 1.31 1.30
Aug. 1.60 1.24 1.35 1.39Sep. 1.76 1.40 1.57 1.51Oct. 1.69 1.36 1.49 1.48Nov. 1.61 1.26 1.37 1.38Dec. 1.60 1.22 1.27 1.38
Sources: Standard & Poor’s, BARRA and Russell Investment Group

CME 2005 Equity Index Futures and Options Information Guide 111
SECTION V:
Quote VendorGuides
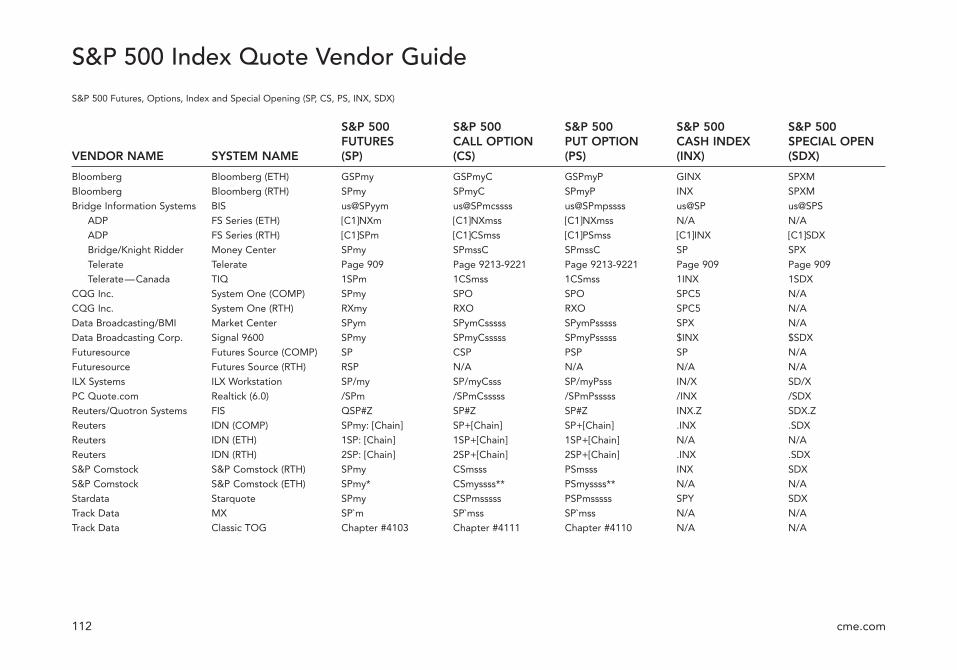
112 cme.com
S&P 500 Index Quote Vendor Guide
S&P 500 Futures, Options, Index and Special Opening (SP, CS, PS, INX, SDX)
S&P 500 S&P 500 S&P 500 S&P 500 S&P 500FUTURES CALL OPTION PUT OPTION CASH INDEX SPECIAL OPEN
VENDOR NAME SYSTEM NAME (SP) (CS) (PS) (INX) (SDX)
Bloomberg Bloomberg (ETH) GSPmy GSPmyC GSPmyP GINX SPXM
Bloomberg Bloomberg (RTH) SPmy SPmyC SPmyP INX SPXM
Bridge Information Systems BIS us@SPyym us@SPmcssss us@SPmpssss us@SP us@SPS
ADP FS Series (ETH) [C1]NXm [C1]NXmss [C1]NXmss N/A N/A
ADP FS Series (RTH) [C1]SPm [C1]CSmss [C1]PSmss [C1]INX [C1]SDX
Bridge/Knight Ridder Money Center SPmy SPmssC SPmssC SP SPX
Telerate Telerate Page 909 Page 9213-9221 Page 9213-9221 Page 909 Page 909
Telerate—Canada TIQ 1SPm 1CSmss 1CSmss 1INX 1SDX
CQG Inc. System One (COMP) SPmy SPO SPO SPC5 N/A
CQG Inc. System One (RTH) RXmy RXO RXO SPC5 N/A
Data Broadcasting/BMI Market Center SPym SPymCsssss SPymPsssss SPX N/A
Data Broadcasting Corp. Signal 9600 SPmy SPmyCsssss SPmyPsssss $INX $SDX
Futuresource Futures Source (COMP) SP CSP PSP SP N/A
Futuresource Futures Source (RTH) RSP N/A N/A N/A N/A
ILX Systems ILX Workstation SP/my SP/myCsss SP/myPsss IN/X SD/X
PC Quote.com Realtick (6.0) /SPm /SPmCsssss /SPmPsssss /INX /SDX
Reuters/Quotron Systems FIS QSP#Z SP#Z SP#Z INX.Z SDX.Z
Reuters IDN (COMP) SPmy: [Chain] SP+[Chain] SP+[Chain] .INX .SDX
Reuters IDN (ETH) 1SP: [Chain] 1SP+[Chain] 1SP+[Chain] N/A N/A
Reuters IDN (RTH) 2SP: [Chain] 2SP+[Chain] 2SP+[Chain] .INX .SDX
S&P Comstock S&P Comstock (RTH) SPmy CSmsss PSmsss INX SDX
S&P Comstock S&P Comstock (ETH) SPmy* CSmyssss** PSmyssss** N/A N/A
Stardata Starquote SPmy CSPmsssss PSPmsssss SPY SDX
Track Data MX SP`m SP`mss SP`mss N/A N/A
Track Data Classic TOG Chapter #4103 Chapter #4111 Chapter #4110 N/A N/A

CME 2005 Equity Index Futures and Options Information Guide 113
E-mini S&P 500 Index Quote Vendor Guide
CME E-mini S&P 500 Stock Price Index Futures, Options, All-or-None, and Indexes (ES, EG, INX, SDX)
E-MINI E-MINI E-MINI E-MINIS&P 500 S&P 500 S&P 500 S&P 500 S&P 500 S&P 500FUTURES (ES) CALL OPTION PUT OPTION ALL-OR-NONE CASH SPECIAL(CME GLOBEX (ES) (CME GLOBEX (ES) (CME GLOBEX (EG) (OPEN INDEX OPEN
VENDOR NAME SYSTEM NAME PLATFORM ONLY) PLATFORM ONLY) PLATFORM ONLY) (OUTCRY ONLY) (INX) (SDX)
Bloomberg Bloomberg ESmy <INDEX> ESmyC <INDEX> ESmyP <INDEX> EGmy <INDEX> INX SPXM
Bridge Information Systems BIS us@ESyym us@ESmcsssss us@ESmpsssss us@EGyym us@SP us@SPS
ADP FS Series [C1]ESm [C1]ESmss [C1]ESmss [C1]ETm [C1]INX [C1]SDX
Knight Ridder Money Center ESmy ESmssC ESmssP EGmy SP SPX
Telesphere Telesphere ESym ESymCssss ESymPssss EGym SP SD
Telerate Telerate Page 9220 Pages 19933-19935 Pages 19933-19935 Page 9220 Page 909 Page 909
& 19944-19946 (CONT’D) & 19944-19946 (CONT’D)
Telerate Canada—TIQ Telerate Canada—TIQ 1ESm 1ESmss 1ESmss 1EGm 1INX 1SDX
CQG Inc. System One EPmy N/A N/A N/A SPC5 N/A
CQG Inc. CQG for Windows EPmy EPO EPO EPL SPC5 N/A
Data Broadcasting/BMI Market Center ESym ESymCsssss ESymPsssss EGym SPX N/A
Data Broadcasting Corp. ES my ES myCssss ES myPssss EG my $INX $SDX
Data Transmissions Network @ESym N/A N/A N/A INX SDX
Futuresource Futures Source ES CES PES GES SP N/A
ILX Systems ILX Workstation ES/my ES/myCsss ES/myPsss EG/my IN/X SD/X
PC Quote.com Realtick (6.0) /ESmy /ESmyCsssss /ESmyPsssss /EGm /INX /SDX
PC Quote.com Market Smart /ESym /ESymCsssss /ESymCsssss /EGm /INX /SDX
Reuters/Quotron FIS QES#Z ES#Z ES#Z QET#Z INX.Z SDX.Z
Reuters IDN (COMP) ES: [Chain] ES+[Chain] ES+[Chain] ET: [Chain] .INX .SDX
Reuters IDN (ETH) 1ES: [Chain] 1ES+[Chain] 1ES+[Chain] N/A N/A N/A
Reuters IDN (RTH) N/A N/A N/A 2ET: [Chain] .INX .SDX
S&P Comstock S&P Comstock ESmy* ESmyssss** ESmyssss** EGmy INX SDX
Stardata Starquote ESmy CESmsssss PESmsssss EGmy SPY SDX
Track Data MX ES`m ES`mss ES`mss N/A N/A N/A
Track Data Classic TOG Chapter 17400 Chapter 17400 Chapter 17400 Chapter ? N/A N/A

114 cme.com
S&P MidCap 400 Index Quote Vendor Guide
S&P MidCap 400 Futures, Options, Index and Special Opening (MD, IDX, SLX)
S&P MIDCAP S&P MIDCAP S&P MIDCAP S&P MIDCAP S&P MIDCAP400 FUTURES 400 CALL 400 PUT 400 CASH 400 SPECIAL
VENDOR NAME SYSTEM NAME (MD) OPTION (MD) OPTION (MD) INDEX (IDX) OPEN (SLX)
Bloomberg Bloomberg (ETH) GMDmy GMDmyC GMDmyP GIDX GSLX
Bloomberg Bloomberg (RTH) MDmy MDmyC MDmyP IDX SLX
Bridge Information Systems BIS us@MCyym us@MCmcssss us@MCmpssss us@MC us@MCS
ADP FS Series (ETH) [C1]NIm [C1]NImss [C1]NImss N/A N/A
ADP FS Series (RTH) [C1]MDm [C1]MDmss [C1]MDmss [C1]IDX [C1]SLX
Knight Ridder Money Center SCmy SCmssssC SCmssssP SIX SID
Telerate Telerate Page 909 N/A N/A Page 909 Page 909
Telerate — Canada TIQ 1MDm 1MDmss 1MDmss 1IDX 1SLX
CQG Inc. System One (COMP) MImy N/A N/A MIC5 N/A
CQG Inc. System One (RTH) ROmy N/A N/A MIC5 ?
Data Broadcasting/BMI Market Center MDym MDymCssss MDymPssss MDY N/A
Data Broadcasting Corp. Signal 9600 MDmy MDmyCsssss MDmyPsssss $IDX $SLX
Futuresource Futures Source (COMP) MD CMD PMD MD N/A
Futuresource Futures Source (RTH) RMD N/A N/A N/A N/A
ILX Systems ILX Workstation MD/my MD/myCsss MD/myPsss ID/X SL/X
PC Quote.com Realtick (6.0) /MDm /MDmCsssss /MDmPsssss /IDX /SLX
Reuters/Quotron FIS QMD#Z MD#Z MD#Z IDX.Z SLX.Z
Reuters IDN (COMP) MD:[Chain] MD+[Chain] MD+[Chain] .IDX .SLX
Reuters IDN (ETH) 1MD:[Chain] 1MD+[Chain] 1MD+[Chain] N/A N/A
Reuters IDN (RTH) 2MD:[Chain] 2MD+[Chain] 2MD+[Chain] .IDX .SLX
S&P Comstock S&P Comstock (RTH) MDmy MDmsss MDmsss IDX SLX
S&P Comstock S&P Comstock (ETH) MDmy* MDmyssss** MDmyssss** IDX SLX
Stardata Starquote MDmy CMDmsssss PMDmsssss IDX SLX
Track Data MX MD`m MD`mss MD`mss MD`A N/A
Track Data Classic TOG Chapter #13200 Chapter #13200 Chapter #13200 N/A N/A

CME 2005 Equity Index Futures and Options Information Guide 115
E-mini S&P MidCap 400 Index Quote Vendor Guide
E-mini S&P MidCap 400 Futures (EMD)
E-MINI S&P MIDCAP 400 FUTURES (EMD)
VENDOR NAME SYSTEM NAME (CME GLOBEX PLATFORM ONLY)
Bloomberg Bloomberg FAmy<index>
CGI Group Inc. Starquote EMDmy
CQG Inc. CQG for Windows EMDmy
Data Transmission Network @MFmy
E-Signal eSignal Mcmy
E-Signal/BMI Market Center EMDym
Futuresource Futures Source EMD
Hyperfeed/PC Quote /EV ym
ILX Systems ILX Workstation MF/my
Reuters IDN (ETH) DM: [Chain]
Bridge BIS us@EMDyym
Telerate Telerate EMD.1.CM
Telesphere Telesphere EMDym
S&P Comstock S&P Comstock MMmy*
Sungard PowerPartner 1EZm
Track Data MX NX`M
*Second year month codes are used for the CME Globex platform—refer to Comstock for a listing.

116 cme.com
S&P SmallCap 600 Futures Quote Vendor Guide
S&P SmallCap 600 Futures, Index (SMC, SPC)
S&P SMALLCAP 600 S&P SMALLCAP 600
VENDOR NAME SYSTEM NAME FUTURES (SMC) CASH INDEX (SPC)
Bloomberg Bloomberg GNmy<index> SPC<index>
CGI Group Inc. Starquote SMC SPC
CQG Inc. CQG for Windows
Data Transmission Network
E-Signal eSignal S6my S6 X0
E-Signal/BMI Market Center S6ym SPC
Futuresource Futures Source SMC SMCY
Hyperfeed/PC Quote /MCym /CPY
ILX Systems ILX Workstation HS/my WV/Y
Reuters IDN (ETH) SMC: my SPC: [Chain]
Bridge BIS us@SMCyym us@SPCyym
Telerate Telerate SMC.1.CM NA
Telesphere Telesphere SMCym SPCym
S&P Comstock S&P Comstock SKmy SPCY
SunGard PowerPartner 1SMC* 1SPCY
Track Data MX SMC` SMC`A
*SunGard will be using this to denote the month

CME 2005 Equity Index Futures and Options Information Guide 117
NASDAQ-100 Index Quote Vendor Guide
NASDAQ-100 Futures, Options, Index and Special Opening (ND, IQX, OQX)
NASDAQ-100 NASDAQ-100 NASDAQ-100 NASDAQ-100 NASDAQ-100INDEX FUTURES INDEX CALL INDEX PUT CASH INDEX INDEX SPECIAL
VENDOR NAME SYSTEM NAME (ND) OPTION (ND) OPTION (ND) (IQX) OPEN (OQX)
Bloomberg Bloomberg (ETH) GNDmy GNDmyC GNDmyP N/A N/A
Bloomberg Bloomberg (RTH) NDmy NDmyC NDmyP IQX OQX
Bridge Information Systems BIS us@NDyym us@NDmcssss us@NDmpssss us@IQA us@OQS
ADP FS Series (ETH) [C1]DNm [C1]DNmss [C1]DNmss N/A N/A
ADP FS Series (RTH) [C1]NCm [C1]NCmss [C1]NCmss [C1]IQX [C1]OQX
Knight Ridder NQmyy NQmssC NQmssP IQX OQX
Telerate Telerate Page 52059 N/A N/A Page 52059 N/A
Telerate — Canada TIQ [C1]NDm [C1]NDmss [C1]NDmss [C1]IQX [C1]OQX
CQG Inc. CQG/Windows NDmy ND ND NDC N/A
Data Broadcasting/BMI Market Center NDym NDymCsssss NDymPsssss NDY NDS
Data Broadcasting Corp. ND my ND myCsss ND myPsss IQX OQX
Data Transmissions Network NDym NDymCssssss NDymPssssss IQX OQX
Futuresource Futures Source (COMP) NQ CNQ PNQ NQY N/A
Futuresource Future Source (ETH) GNQ CNQ PNQ N/A N/A
Futuresource Futures Source (RTH) RNQ CNQ PNQ NQY N/A
ILX Systems ILX Workstation ND/my ND/my sss ND/myPsss IQ/X OQ/X
PC Quote.com /NDm /NDmCsssss /NDmPsssss /IQX /OQX
Reuters/Quotron Systems FIS QND#Z ND#Z ND#Z IQX.Z OQX.Z
Reuters IDN (COMP) NDmy: [Chain] ND+[Chain] ND+[Chain] .IQX .OQX
Reuters IDN (ETH) 1ND: [Chain] 1ND+[Chain] 1ND+[Chain] N/A N/A
Reuters IDN (RTH) 2ND: [Chain] 2ND+[Chain] 2ND+[Chain] .IQX .OQX
S&P Comstock S&P (RTH) NDmy NDmsss NDmsss IQX OQX
S&P Comstock S&P (ETH) NDmy* NDmyssss** NDmyssss** N/A N/A
Stardata Starquote NDmy CNDmsssss PNDmsssss IQX OQX
Track Data MX ND`m ND`mss ND`mss N/A N/A
Track Data Classic TOG Chapter 28300 Chapter 28310 Chapter 28311 N/A N/A

118 cme.com
E-mini NASDAQ-100 Index Quote Vendor Guide
CME E-mini NASDAQ-100 Futures, All-or-None, and Indexes (NQ, NV, IQX, OQX)
E-MINI E-MININASDAQ-100 NASDAQ-100 NASDAQ-100 NASDAQ-100FUTURES (NO) ALL-OR-NONE CASH SPECIAL(CME GLOBEX (NV) (OPEN INDEX OPEN
VENDOR NAME SYSTEM NAME PLATFORM ONLY) OUTCRY ONLY) (IQX) (OQX)
Bloomberg Bloomberg NQmy <INDEX> NWmy <INDEX> IQX OQX
Bridge Information Systems BIS us@NQyym us@NVyym us@ND [email protected]
ADP FS Series [C1]NQm [C1]NVm [C1]IQX [C1]OQX
Knight Ridder Money Center NSmy NVmy IQX OQX
Telerate Telerate Page 52059 Page ? Page ? Page ?
Telerate—Canada TIQ 1NQm 1NVm 1IQX 1OQX
Telesphere Telesphere NQym NVym IQX OQX
CQG Inc. System One NQmy N/A IQX N/A
CQG Inc. CQG for Windows NQmy NVL IQX N/A
Data Broadcasting/BMI Market Center NQym NVym IQX N/A
Data Broadcasting Corp. NQ my NV my $IQX $OQX
Data Transmissions Network @NQym N/A IQX OQX
Futuresource Futures Source EN (composite) REN IQX N/A
ILX Systems ILX Workstation NQ/my NV/my IQ/X OQ/X
PC Quote Realtick (6.0) /NQmy /NVm /IQX /OQX
PC Quote Market Smart /NQym /NVm /IQX /OQX
Reuters/Quotron FIS QNQ#Z QNV#Z IQX.Z OQX.Z
Reuters IDN (COMP) NQ: [Chain] NV: [Chain] .IQX .OQX
Reuters IDN (ETH) 1NQ: [Chain] N/A N/A N/A
Reuters IDN (RTH) N/A 2NV: [Chain] .IQX .OQX
S&P Comstock S&P Comstock NQmy* NVmy IQX OQX
Stardata Starquote NQmy NVmy IQX OQX
Track Data MX NQ`m N/A N/A N/A

CME 2005 Equity Index Futures and Options Information Guide 119
E-mini NASDAQ Composite Quote Vendor Guide
E-mini NASDAQ Composite Futures, Index (QCN, QCX)
E-MINI NASDAQ NASDAQ COMPOSITECOMPOSITE FUTURES CASH
VENDOR NAME SYSTEM NAME CME GLOBEX (QCN) (QCX)
Bloomberg Bloomberg NL QCX
CGI Group Inc. Starquote QCN QCXY
CQG Inc. CQG for Windows ENC ENC5
Data Transmission Network @QCN QCX.X
E-Signal eSignal QCN my QCX A0
E-Signal/BMI Market Center QCN ym QCNY
Futuresource Futures Source QCN QCN
Hyperfeed/PC Quote /QCym /QXY
ILX Systems ILX Workstation NP IS
Reuters IDN (ETH) 0#QCN: .QCX
Bridge BIS us@QCNyym us@QCN
Telerate Telerate [email protected] n/a
Telesphere Telesphere QCNym QCNyM
S&P Comstock S&P Comstock QCmy QCXY
Sungard PowerPartner 1QCN* 1QCX*
Track Data MX QCN' QCN`A
TradeStation TradeStation QCN $QCX

120 cme.com
Russell 2000 Index Quote Vendor Guide
Russell 2000 Futures, Options, Index (RL, IUX)
RUSSELL 2000 RUSSELL 2000 RUSSELL 2000 RUSSELL 2000FUTURES CALL OPTION PUT OPTION CASH INDEX
VENDOR NAME SYSTEM NAME (RL) (RL) (RL) (IUX)
Bloomberg Bloomberg (ETH) GRLmy GRLmyC GRLmyP GIUX
Bloomberg Bloomberg (RTH) RLmy RLmyC RLmyP IUX
BRIDGE INFORMATION SYSTEMS BIS us@RLyym us@RLmcssss us@RLmpssss us@RL
ADP FS Series (ETH) [C1]NRm [C1]NRmss [C1]NRmss N/A
ADP FS Series (RTH) [C1]RLm [C1]RLmss [C1]RLmss [C1]IUX
Knight Ridder Money Center RLmy RLmsssC RLmsssP IUX
Telerate Telerate Page N/A Page N/A Page N/A Page N/A
Telerate—Canada TIQ 1RLm 1RLmss 1RLmss 1IUX
CQG Inc. System One (COMP) RImy N/A N/A RIC5
CQG Inc. System One (RTH) RRmy N/A N/A RIC5
Data Broadcasting/BMI Market Center RLym RLymCsssss RLymPsssss RLY
Data Broadcasting Corp. Signal 9600 RLmy RLmyCsssss RLmyPsssss $IUX
Futuresource Futures Source (COMP) RT CRT PRT RT
Futuresource Futures Source (RTH) RRT N/A N/A N/A
ILX Systems ILX Workstation RL/my RL/myCsss RL/myPsss IU/X
PC Quote.com Realtick (6.0) /RLm /RLmCsssss /RLmPsssss /IUA
PC Quote.com Market Smart
Reuters/Quotron FIS QRL#Z RL#Z RL#Z IUX.Z
Reuters IDN (COMP) RLmy: [Chain] RL+[Chain] RL+[Chain] .IUX
Reuters IDN (ETH) 1RL: [Chain] 1RL+[Chain] 1RL+[Chain] N/A
Reuters IDN (RTH) 2RL:[Chain] 2RL+[Chain] 2RL+[Chain] .IUX
S&P Comstock S&P Comstock (RTH) RLmy RLmssss RLmssss IUX
S&P Comstock S&P Comstock (ETH) RLmy* RLmyssss** RLmyssss** IUX
Stardata Starquote RLmy CRLmsssss PRLmsssss IUX
Track Data MX RU`m RU`mss RU`mss RU`A
Track Data Classic TOG Chapter 16700 Chapter 16700 Chapter 16700 N/A

CME 2005 Equity Index Futures and Options Information Guide 121
E-mini Russell 2000 Index Quote Vendor Guide
Russell 2000 Futures, Options, Index (RL, IUX)
E-MINI RUSSELL 2000FUTURES (ER2)
RUSSELL 2000 RUSSELL 2000 (CME GLOBEX VENDOR NAME SYSTEM NAME PLATFORM ONLY)
Bloomberg Bloomberg RRmy<index>
Bridge Information Systems BIS us@SR2yym
ADP FS Series 1ER2m
Telerate Telerate N/A
Telerate—Canada TIQ N/A
Telesphere Telesphere SR2ym
CGI Group Inc. Starquote ER2my
CQG Inc. CQG for Windows ER2my
E-Signal AA Aamy
E-Signal/BMI Market Center ER2ym
Data Transmissions Network † @ER2my
Futuresource Futures Source ERT
ILX Systems ILX Workstation RI/my
Hyperfeed/PC Quote † /EBmy
Reuters IDN (ETH) RE: [Chain]
S&P Comstock S&P Comstock MRmy*
Track Data MX NO’m
*Second year month codes are used for the CME Globex platform—refer to Comstock for a listing.
Note: This is the first CME futures contract to use a three-character ticker symbol.

122 cme.com
Russell 1000 Quote Vendor Guide
Russell 1000 Futures & Index (RS1, RUX)
RUSSELL 1000 RUSSELL 1000 RUSSELL 1000 RUSSELL 1000VENDOR NAME SYSTEM NAME FUTURES CASH INDEX
Bloomberg Bloomberg RSA<index> RUX<index>
CGI Group Inc. Starquote RS1 RUXY
CQG Inc. CQG for Windows RS1 RS1C5
Data Transmission Network @RS1 RUI
E-Signal eSignal RS1 my RUX A0
E-Signal/BMI Market Center RS1 ym RUXY
FutureSource Futures Source RX RXY
Hyperfeed/PC Quote /RGym /RJY
ILX Systems ILX Workstation RH RX/Y
Reuters IDN (ETH) <0#RSS:> <.RUXY>
Bridge BIS [email protected] us@RUX
Telerate Telerate [email protected] us@RUX
Telesphere Telesphere RSSym RUX
S&P Comstock S&P Comstock RTmy RUXY
Sungard PowerPartner 1RR 1RUXY
RZ`M,
RZ`U,
RZ`Z,
Track Data MX RZ`H RZ`A
*Second year month codes are used for the CME Globex platform—refer to Comstock for a listing.

CME 2005 Equity Index Futures and Options Information Guide 123
S&P 500/Barra Growth Index Quote Vendor Guide
S&P 500/BARRA Growth Futures, Options, Index and Special Opening (SG, IGX, SKX)
S&P 500/ S&P 500/ S&P 500/ S&P 500/ S&P 500/BARRA GROWTH BARRA GROWTH BARRA GROWTH BARRA GROWTH BARRA GROWTH
VENDOR NAME SYSTEM NAME FUTURES (SG) CALL OPT. (SG) PUT OPT. (SG) CASH INDEX (IGX) SPEC.OPEN (SKX)
Bloomberg Bloomberg (ETH) GSGmy GSGmyC GSGmyP GIGX GSKX
Bloomberg Bloomberg (RTH) SGmy SGmyC SGmyP IGX SKX
Bridge Information Systems BIS us@SGyym us@SGmcssss us@SGmpssss us@SG
us@SPS
ADP FS Series (ETH) [C1]ZYm [C1]ZYmss [C1]ZYmss N/A N/A
ADP FS Series (RTH) [C1]SGm [C1]SGmss [C1]SGmss [C1]IGX [C1]SKX
Knight Ridder SGmy SGmssC SGmssP SGIG SGSK
Telerate Telerate Page 968 Page 968 Page 968 Page ? Page 909
Telerate—Canada TIQ 1SGm 1SGmss 1SGmss 1IGX 1SKX
CQG Inc. System One (COMP) SGmy SGO SGO SGC5 N/A
CQG Inc. System One (RTH) SGmy SGO SGO SGC5 N/A
Data Broadcasting/BMI Market Center SGym SGymCsssss SGymPsssss SGX N/A
Data Broadcasting Corp. Signal 9600 (ETH) SGmy SGmyCsssss SGmyPsssss $IGX $SKX
Data Broadcasting Corp. Signal 9600 (RTH) SGmy SGmyCsssss SGmyPsssss $IGX $SKX
Futuresource Futures Source (COMP) SG CSG PSG SG N/A
Futuresource Futures Source (RTH) RSG N/A N/A N/A N/A
ILX Systems ILX Workstation SG/my SG/my sss SG/myPsss IG/X SK/X
PC Quote.com /SGm /SGmCsssss /SGmPsssss /IGX /SKX
Reuters/Quotron Systems FIS QSG#Z SG#Z SG#Z IGX.Z SKX.Z
Reuters IDN (COMP) SGmy: [Chain] SG+[Chain] SG+[Chain] .IGX .SKX
Reuters IDN (ETH) 1SG: [Chain] 1SG+[Chain] 1SG+[Chain] N/A N/A
Reuters IDN (RTH) 2SG: [Chain] 2SG+[Chain] 2SG+[Chain] .IGX .SKX
S&P Comstock S&P Comstock (RTH) SGmy CSmssss PSmssss IGX SKX
S&P Comstock S&P Comstock (ETH) SGmy* CSmyssss** PSmyssss** N/A N/A
Stardata Starquote SGmy CSGmsssss PSGmsssss SG SKX
Track Data MX SG`m SG`mss SG`mss N/A N/A
Track Data Classic TOG Chapter 22603 Chapter 22611 Chapter 22610 N/A N/A

124 cme.com
S&P 500/Barra Value Index Quote Vendor Guide
S&P 500/BARRA Value Futures, Options, Index and Special Opening (SU, IVX, SZX)
S&P 500/ S&P 500/ S&P 500/ S&P 500/ S&P 500/BARRA VALUE BARRA VALUE BARRA VALUE BARRA VALUE BARRA VALUE
VENDOR NAME SYSTEM NAME FUTURES (SU) CALL OPT. (SU) PUT OPT. (SU) CASH INDEX (IVX) SPEC.OPEN (SZX)
Bloomberg Bloomberg (ETH) GSUmy GSUmyC GSUmyP GIVX GSZX
Bloomberg Bloomberg (RTH) SUmy SUmyC SUmyP IVX SZX
Bridge Information Systems BIS us@SUyym us@SUmcssss us@SUmpssss us@SU us@SPS
ADP FS Series (ETH) [C1]ZZm [C1]ZZmss [C1]ZZmss N/A N/A
ADP FS Series (RTH) [C1]SUm [C1]SUmss [C1]SUmss [C1]IVX [C1]SZX
Knight Ridder SUmy SUmssC SUmssP SUIV SUSZ
Telerate Telerate Page 968 Page 968 Page 968 Page ? Page 909
Telerate—Canada TIQ 1SUm 1SUmss 1SUmss 1IVX 1SZX
CQG Inc. System One (COMP) SUmy SUO SUO SVC5 N/A
CQG Inc. System One (RTH) SUmy SUO SUO SVC5 N/A
Data Broadcasting/BMI Market Center SUym SUymCsssss SUymPsssss SVX N/A
Data Broadcasting Corp. Signal 9600 (ETH) SUmy SUmyCsssss SUmyPsssss $IVX $SZX
Data Broadcasting Corp. Signal 9600 (RTH) SUmy SUmyCsssss SUmyPsssss $IVX $SZX
Futuresource Futures Source (COMP) SU CSU PSU SU N/A
Futuresource Futures Source (RTH) RSU N/A N/A N/A N/A
ILX Systems ILX Workstation SU/my SU/my sss SU/myPsss IV/X SZ/X
PC Quote.com /SUm /SUmCsssss /SUmPsssss /IVX /SZX
Reuters/Quotron Systems FIS QSU#Z SU#Z SU#Z IVX.Z SZX.Z
Reuters IDN (COMP) SUmy: [Chain] SU+[Chain] SU+[Chain] .IVX .SZX
Reuters IDN (ETH) 1SU: [Chain] 1SU+[Chain] 1SU+[Chain] N/A N/A
Reuters IDN (RTH) 2SU: [Chain] 2SU+[Chain] 2SU+[Chain] .IVX .SZX
S&P Comstock S&P Comstock (RTH) SUmy CSmsss PSmsss IVX SZX
S&P Comstock S&P Comstock (ETH) SUmy* CSmyssss** PSmyssss** N/A N/A
Stardata Starquote SUmy CSUmsssss PSUmsssss SU SZX
Track Data MX SU`m SU`mss SU`mss N/A N/A
Track Data Classic TOG Chapter 22703 Chapter 22711 Chapter 22710 N/A N/A

CME 2005 Equity Index Futures and Options Information Guide 125
SPCTR Stock Index Futures and Cash Index Quote Vendor Guide
S&P 500 S&P 500 FINANCIAL FINANCIAL TECHNOLOGY TECH/TELECOMSPCTR* INDEX — SPCTR* INDEX — FUTURES (FIN) FINANCIAL FUTURES (TEC) TECHNOLOGY (CME GLOBEX SPCTR* (CME GLOBEX SPCTR*PLATFORM CASH INDEX PLATFORM CASH INDEX
VENDOR NAME SYSTEM NAME ONLY) (SPS) ONLY) (SPL)
Bloomberg Bloomberg JZmy<index> SPF<index> VFmy<index> SPL<index>
CGI Group Inc. Starquote FIN SPS TEC SPL
CQG Inc. CQG for Windows FINmy SFPS TECmy SLPS
Data Transmission Network @FIN NA @TEC NA
E-Signal eSignal FSmy FS A0my TSmy TS A0my
E-Signal/BMI Market Center FSmy FS A0my TSmy TS A0my
Futuresource Futures Source FIN FINY TEC TECY
Hyperfeed/PC Quote /FIN ym /SPSym /TEC ym /SPL ym
ILX Systems ILX Workstation FR/my FN/Y TR/my TG/Y
Reuters IDN (ETH) FIN: [Chain] .SPSY TEC: [Chain] .SPLY
Bridge BIS us@FINyym us@SPS us@TECyym us@SLP
Telerate Telerate NA NA NA NA
Telesphere Telesphere FNIym SPS TCEym SPL
S&P Comstock S&P Comstock FImy* SPSY TEmy* SPLY
SunGard PowerPartner 1FINm 1SPSY 1TECm 1SPLY
Track Data MX FIN` FIN`A TEC` TEC`A
*Second year month codes are used for the CME Globex platform—refer to Comstock for a listing.

126 cme.com
Nikkei 225 Quote Vendor Guide
Nikkei 225 Futures, Options, Index (NK, KN, JN)
NIKKEI 225 NIKKEI 225 CALL NIKKEI 225 PUT NIKKEI 225 VENDOR NAME SYSTEM NAME FUTURES (NK) OPTION (KN) OPTION (JN) SPOT (TOKYO)
Bloomberg NXmy NXmyC NXmyP NXY
Bridge Information Systems BIS QQNKm QQNK xx QQNK xx NIKI&J*
ADP FS Series [C1]NKm [C1]KNmxx [C1]JNmxx NIKI.X*
Knight Ridder Money Center NKmyy NKmsssC NKmsssP NO or NIX
Telerate Telerate Page 631 36616-36623 36616-36623 Page 4 or 3952
Telerate— Canada TIQ 1NKm 1KNmxx 1JNmxx JN
Commodity Quote Graphics System One NKmy NKO NKO
Commodity Quote Graphics TQ 20/20 NKmy NKO NKO
Commodity Quotations Inc. Comstock NKmy KNmsss JNmsss .SIYY*
Data Broadcasting Corp. FNN Market Watch NKm NKmyCsssss NKmyPsssss $NKY
Data Broadcasting Corp. FNN Signal NKm NKmyCsssss NKmyPsssss $NKY
Data Broadcasting Corp. FNN Quotrex NKm $NKY
Futuresource Market Edge NK CNK PNK NK*
Futuresource Futures Source NK CNK PNK NK*
ILX Systems NK/ NK/msssss NK/msssss NK/Y*
PC Quote.com /NKm /NKmCsssss /NKmPsssss /NKY
Reuters IDN NKmy:[Chain] NKmy + [Chain] NKmy + [Chain] .NIKI
Reuters/Quotron Systems FIS NKm.Z NK.Z#Z NK.Z#Z NKX.Z
Stardata Starquote NKmy CNKmsssss PNKmsssss NKYK [Index]*
* Nikkei 225 Spot Index is not updated real-time—value displayed is closing price only.

CME 2005 Equity Index Futures and Options Information Guide 127
Quote Vendor Guide Key
All letters in capitals, numbers, and special characters should be typed in exactly where they appear.
y = Last digit of year (i.e., 5 for 2005)
yy = Last two digits of year (i.e., 05 for 2005)
m = Month Code as follows:
Jan Feb Mar Apr May Jun Jul Aug Sep Oct Nov Dec
F G H J K M N Q U V X Z
mmm = Three character month (i.e., JAN, FEB, MAR, and so on)
s = Each ‘s’ represents a digit of the strike price.
x = Each ‘x’ is a special character code representing a strike price (consult your system handbook for the proper strike price codes).
[ ] = Items in square brackets represent a special key unique to that particular vendor’s system.
N/A = Not Available
? = Codes or page numbers not available at press time
a = A-L for calls from Jan through Dec
b = M-X for puts from Jan through Dec
c = A-L for month code Jan to Dec
d = A-J for year code 0 to 9
RTH = Regular Trading Hours (open outcry/pit trading)
ETH = Electronic Trading Hours (CME Globex platform)
Day = Combined information from both RTH and ETH sessions
* = Second year month codes are used for the CME Globex platform—refer to Comstock for a listing
** = First year month codes for calls and Second year month codes for puts the CME Globex platform— refer to Comstock for a listing.
The information in this guide is believed to be accurate. However, CME assumes no responsibility for errors or omissions. Please contact your quote vendor for additional information.

128 cme.com
Contact Lists
CME www.cme.com
CME Product Information—Equity Products: [email protected]
Tina Lemieux, Director ...................................................................... (312) 930-3151David Lerman, Associate Director .................................................... (312) 648-3721Brett Vietmeier, Associate Director .................................................. (312) 930-3394Mark Omens, Associate Director ...................................................... (312) 930-8545Tom Boggs, Associate Director ........................................................ (312) 930-3038CME Washington Office.................................................................... (202) 223-6965CME London Office ........................................................................44 20 7623 2550CME Tokyo Office ............................................................................(813) 5403-4828
Quote Retrieval Services—[email protected]
Marilee RadeckiAssociate Director, Market Data Operations.................................... (312) 930-8193
EFP Information
Jerry O’ConnorAssociate Director, Financial Surveillance ........................................ (312) 930-3256
Performance Bond Information—CME Clearing House: [email protected]
Dale MichaelsDirector, Risk Management .............................................................. (312) 930-3062
STANDARD & POOR’S www.standardandpoors.com
Robert BarrieraIndex Products/Services .................................................................... (212) 438-3515
THE NASDAQ MARKET www.nasdaq.com or www.nasdaqtrader.com
Lisa ChaneyNASDAQ Financial Products ............................................................ (301) 978-8281
BARRA, INC., S&P BARRA INDEX www.barra.com
S&P 500 BARRA/Growth and ValueIndex Direct Line..............................................................................(510) 649-4294
FRANK RUSSELL COMPANY www.russell.com
Kevin LohmanGlobal Sales ManagerRussell Indexes & Data Licensing...................................................... (253) 396-6352Lori RichardsProduct Manager .............................................................................. (253) 798-5729
NIKKEI AMERICA
Yihsuan Wu........................................................................................ (212) 261-6245
CME
North American Quote Vendor Customer Service Contact List
Bloomberg ......................................................................................(212) 318-2000Bridge Information Systems ............................................................(800) 325 -DATA
ADP ............................................................................................(800) 829-1600Telerate ......................................................................................(800) 535-5435Telerate—Canada ......................................................................(416) 365-7171
CQG Inc. ..........................................................................................(312) 939-1903Data Broadcasting/BMI....................................................................(800)436-4036Data Broadcasting Corp. ................................................................(800) 762-7538FutureSource....................................................................................(800) 678-8333ILX Systems ......................................................................................(800) 654-5657PC Quote.com ................................................................................(800) 225-5657Reuters ............................................................................................(800) 435-0101S&P Comstock ................................................................................(914) 381-7000Stardata............................................................................................(800) 387-8194Track Data ........................................................................................(312) 427-5530

CME 2005 Equity Index Futures and Options Information Guide 129
The information within this publication has been compiled by CME for general information purposes only.Although every attempt has been made to ensure the accuracy of the information, CME assumes no respon-sibility for any errors or omissions. Additionally, all examples in this publication are hypothetical fact situations,used for explanation purposes only, and should not be considered investment advice or the results of actualmarket experience. All matters pertaining to rules and specifications herein are made subject to and aresuperseded by the official CME rules. Current CME rules should be consulted in all cases concerning contractspecifications.
“S&P 500/BARRA Growth Index” and “S&P 500/BARRA Value Index” are joint trademarks of The McGraw-HillCompanies, Inc. and BARRA, Inc. and have been licensed for use by CME.
“Standard & Poor’s,®” “Standard & Poor’s 500,®” “S&P,®” “S&P 500,®” “S&P MidCap 400” and “S&P SmallCap600,” are trademarks of The McGraw-Hill Companies, Inc. and have been licensed for use by CME. The products are not sponsored by, endorsed, sold or promoted by Standard & Poor's and Standard & Poor'smakes no representation regarding the advisability of investing therein.
The Russell 2000® Index and Russell 1000® Index are registered trademarks of Frank Russell Company. FrankRussell Company assumes no liability in connection with the trading of any contract based on the Russell2000 Index or Russell 1000 Index.
Nikkei™ and Nikkei 225™ are trademarks of Nihon Keizai Shimbun Inc. and have been licensed for use byCME in connection with the trading of Futures and Futures Options (Products) based on the Nikkei StockAverage (Nikkei 225). Nikkei Stock Average or Nikkei 225, as it is called sometimes, is owned by and propertyof Nihon Keizai Shimbun Inc. The products are not issued, endorsed, sold or promoted by Nihon Keizai ShimbunInc. or its subsidiaries. NIHON KEIZAI SHIMBUN INC. AND ITS SUBSIDIARIES MAKE NO WARRANTIES ANDBEAR NO LIABILITY WITH RESPECT TO SUCH PRODUCTS.
FLEX® is a registered trademark of the Chicago Board Options Exchange, Inc.
NASDAQ®, NASDAQ-100®, the NASDAQ-100 Index® and the NASDAQ Composite Index® are trademarks ofThe Nasdaq Stock Market, Inc. (with which its affiliates are the Corporations), and are licensed for use by CME.The NASDAQ-100® Index futures, E-mini NASDAQ-100 Index® futures and NASDAQ Composite Index®
futures have not been passed on by the Corporations as to their legality or suitability. The NASDAQ-100®
Index futures, E-mini NASDAQ-100 Index® futures and NASDAQ Composite Index® futures are not issued,endorsed, sold or promoted by the Corporations. THE CORPORATIONS MAKE NO WARRANTIES ANDBEAR NO LIABILITY WITH RESPECT TO SUCH PRODUCTS.
“GSCI®” is a registered trademark of GS&Co. and has been licensed for use by CME.
The Globe logo, Globex®, E-miniTM, CME®, SPCTR® and CLEARING 21® are trademarks of CME. All other trade-marks are the property of their respective owners.
IX15/4M/0205

CME–CHICAGO
20 South Wacker DriveChicago, Illinois 60606-7499Tel: 1 312 930 1000Fax: 1 312 466 4410E-mail: [email protected]
CME–LONDON
Pinnacle House23-26 St. Dunstan’s HillLondon EC3R 8HN, EnglandTel: +44 (0) 20 7623 2550Fax: +44 (0) 20 7623 2565E-mail: [email protected]
CME–SYDNEY
Level 17, BNP Paribus Centre60 Castlereagh StreetSydney NSW 2000, AustraliaTel: +61 612 9231 7475Fax: +61 612 9231 7476E-mail: [email protected]
CME–TOKYO
Level 16, Shiroyama JT Trust Tower4-3-1 Toranomon, Minato-kuTokyo 105-6016, Japan Tel: +81 3 5403 4828Fax: +81 3 5403 4646E-mail: [email protected]
INTERNET
www.cme.com
IX15/4M/0205
CME® EQUITY INDEX FUTURES AND OPTIONS