Embed Size (px)
Citation preview

CMBANNUAL REPORT 2003
■ ■ ■
CM
BAN
NUAL R
EPORT 2003

The illustrations in this annual report are by the graphic
and poster designer Lucien De Roeck (1915-2002).
He worked on the layout of various newspapers and illus-
trated numerous brochures, books and magazines.
In 1954, he won, with his “Star”, the design contest for the
emblem and poster of the World Exhibition in Brussels, the
Expo 58.
The port of Antwerp fascinated this gifted artist and painter
and was his continuing source of inspiration.Amidst the cranes
and the loading bridges, he made sketches of the outlines
of thousands of vessels, from the cockleshell to the most
majestic passenger liners.
©Fondation Lucien De Roeck Stichting : [email protected]

Annual report for the year 2003 presented to
the annual general shareholders’ meeting on May 11, 2004
COMPAGNIE MARITIME BELGE
CMB sa■ ■ ■


5 CMB Group in brief 6 Main activities 9 Chairman’s statement
10 Corporate Governance
DIRECTORS’ REPORT
16 Highlights for the year 2003 20 Currency and interest exposure 21 The CMB share
Review and consolidated key figures per division:
24 Bocimar- dry bulk 26 Euronav – tankers 28 Holding
30 Appropriation account 31 Shareholders’ diary
CONSOLIDATED ACCOUNTS
34 Balance sheet 36 Income statement 38 Accounting policy notes
50 Cash flow statement 51 Auditor’s report
STATUTORY ACCOUNTS
54 Balance sheet 55 Income statement
CONTENTS

4
CMB

CMB, Compagnie Maritime Belge, is a maritime group with registered offices in Antwerp.
Its shares are quoted on Euronext Brussels and are also included in the Next 150 index and
the quality market segment NextPrime.
Aside from the holding activities, the Group’s main activities are mainly related to the ship-
ping industry, i.e. transport of dry cargo and crude oil.
CMB GROUP IN BRIEF
Turnover of the Group ...............................................................Shareholders' equity ....................................................................Cash flow.......................................................................................Investments for the year .............................................................Financial charges ...........................................................................
Pre-tax results:- operating results .......................................................................- financial results..........................................................................- extraordinary results ...............................................................- total ............................................................................................Taxation.........................................................................................Equity accounting .........................................................................Results after taxation...................................................................Group share ..................................................................................Third party share..........................................................................
in EUR per CMB shareShareholders' equity ....................................................................Cash flow.......................................................................................Group share ..................................................................................
Dividend: gross.............................................................................net ................................................................................
Highest/lowest stock market quotation....................................Number of CMB shares ...............................................................
2003in millions of EUR
45527313314421
41
58632–
6161–
37.1418.108.27
5.003.75
64.00 / 28.677,350,000
2002in millions of EUR
48431419813046
–54–291314831
46451
41.3226.055.92
2002in millions of EUR
80654419937176
–31–531132941
26251
71.5826.183.29
pro forma after partial demerger
5
2.001.50
63.50 / 33.257,600,000

■
BOCIMAR
DRY BULK
For the transport of dry bulk cargo (mainly coal, iron ore and
grain), BOCIMAR operates a modern fleet consisting of owned
and chartered-in vessels, mostly of the capesize (> 140,000 dwt)
and panamax (60,000 to 80,000 dwt) type.
At the end of 2003 Bocimar operated a fleet consisting of
16 – fully or partially owned - capesize vessels (of which
7 are under construction or on order). Also 6 panamax and
3 handymax units are under construction.
6
DRY BULK
MAIN ACTIVITIES
The activities of the CMB Group
can be summarised as follows:
CMB

■
EURONAV
TANKERS
This division incorporates the participating interest in EURONAV
LUXEMBOURG and EURONAV sa. Euronav operates a fleet consisting
mainly of VLCCs (> 250,000 dwt).
At the end of 2003, the Euronav fleet consisted of 11 – fully or partially
owned - VLCCs (of which 3 are under construction or on order). Also
2 panamax tankers are under construction.
Together with AP Møller, OSG and Reederei “Nord” Klaus E. Oldendorff,
Euronav is one of the current partners in TANKERS INTERNATIONAL,
which was set up in 2000.
■
HOLDING
This division includes among others the following Group
companies: CMB INTERNATIONAL (co-ordination centre)
and RESLEA (real estate). With its subsidiary HESSENATIE
LOGISTICS, the CMB Group is represented in the logistics
sector.
7
HOLDINGTANKERS


9
Ladies and Gentlemen,
The board of directors was saddened on learning of the demise of Mr Paul-Emile Corbiau, Honorary Chairman of CMB, on 10 December 2003.
Mr Corbiau contributed to the development of the CMB Group for almost twenty years - of which ten as Chairman. The board of directors
would like to take this opportunity to re-express its heart-felt condolences to his family.
For CMB, 2003 was a year full of important events and developments.
The most important one, without doubt, was the partial demerger of the company, through the spin-off of its gas transport and offshore
business into Exmar, which became effective on 20 June 2003 when an extraordinary general shareholders’ meeting approved CMB sa’s
partial demerger into CMB sa and Exmar sa.
The markets for the transport of dry bulk saw an unprecedented evolution. However, because of the previously taken freight cover
- mainly on the basis of derivatives - Bocimar was not able to benefit from this rise of the markets and closes the year with a loss.
Despite the high volatility, the markets for the transport of crude oil – on average over the year – remained very strong. Euronav
therefore closes the year with a very good result.
On 24 March 2003, the 20% remaining stake in Hesse-Noord Natie was sold. After this sale CMB no longer has any interest in the
port activities’ sector.
The consolidated result for the financial year 2003 amounts to EUR 61 million. The result for 2002 amounted to EUR 26 million.
The consolidated cash flow amounts to EUR 133 million, compared to EUR 199 million for the year 2002.
The board of directors will propose to the annual general meeting of shareholders of 11 May 2004 to distribute a gross dividend of
EUR 5.00 per share (EUR 3.75 net per share). Subject to the approval of the annual general shareholders’ meeting, the dividend
will be paid on 14 May 2004.
Taking into account the recent evolution of the shipping markets in which CMB operates, it appears that 2004 will be a good year.
Etienne Davignon

10
Working procedures
In the course of 2003 CMB’s board of directors convened five times. Aside from the subjects dictated by
law – closing of the accounts, the annual and the half year report, preparing press releases or preparing
the annual general meetings – the board deliberated on the following items: company strategy and
structure, budgets, interim results and forecasts, survey of the day-to-day affairs of the major subsidiaries,
investments and disinvestments in fixed assets and participating interests, portfolio and treasury, fleet and
acquisition and sale of its own shares.
The board members always receive in advance a detailed file covering the agenda of the upcoming board
meeting.
In 2003, apart from the above-mentioned customary agenda items, the board of directors deliberated on:
- decision to submit, to an extraordinary general meeting, the proposal to spin-off the industrial gas
shipping and offshore activities into a new Belgian company, “Exmar”;
- in preparation of mentioned extraordinary general meeting:
- application for a fiscal ruling confirming the fiscal neutrality of the partial demerger,
- discussion of the valuation report as prepared by UBSW/Fortis Bank,
- preparation of the demerger proposal and other reports,
- preparation of Exmar’s draft articles of association and modification of CMB’s articles of association,
- preparation of a report with respect to authorised capital for both CMB and Exmar,
- preparation of the prospectus,
- within the framework of Corporate Governance, preparation of a proposal for the composition of
the board of directors, the audit committee and the nominating and remuneration committee
of Exmar as well as CMB (after the partial demerger);
- proposal to withdraw own shares;
- after approval of the partial demerger: composition of the executive committee and delegation of
powers and of the audit committee;
- decision to reduce the depreciation period for tankers from 25 to 20 years; change of the valuation rules;
- introduction of the new accounting standard IFRS: update;
- Belgian flag and tonnage tax regime.
All decisions of the board are taken in accordance with article 22 of the by-laws which inter alia states that
the chairman has a casting vote in case of deadlock. To date, this has not been necessary.
Since the extraordinary general meeting of 9 May 2003, the by-laws provide that the members of the
board remain in office for a period not exceeding three years. The by-laws of the company do not
provide an age-limit for the members of the board.
CORPORAT E GOVERNANCE
B O A R D O F D I R E C T O R S

11
Members
Executive directors:
Marc Saverys, director since 1991 and managing director since 1992Born in 1954. His mandate expires at the annual general meeting of 2006.
Virginie Saverys, director since 1993 Born in 1960. Her mandate expires at the annual general meeting of 2004.
Ludwig Criel, director since 1991Born in 1951. His mandate expires at the annual general meeting of 2006.
Non-Executive Directors:
Etienne Davignon1, director since 1985, chairman since 2002Born in 1932. Chairman of CMB from 1989 until 1998 and reappointed chairman of the board of
directors on March 27, 2002. His mandate expires at the annual general meeting of 2005. His main
function outside CMB is vice-chairman of SUEZ-TRACTEBEL.
Jean Peterbroeck1, director since 1993Born in 1936. His mandate expires at the annual general meeting of 2005. His main function outside
CMB is chairman of Petercam.
Nicolas Saverys, director since 1991Born in 1958. His mandate expires at the annual general meeting of 2004. His main function outside
CMB is managing director of Exmar.
Philippe Van Damme, director since 1997Born in 1964. His mandate expires at the annual general meeting of 2004.
Eric Verbeeck1, director since 2001Born in 1944. His mandate expires at the annual general meeting of 2004. His main function outside
CMB is managing director of Interbuild.
1 Independent directors
The mandates of Mrs. Virginie Saverys and Messrs. Nicolas Saverys, Philippe Van Damme and Eric Verbeeck
expire at the annual general meeting of 11 May 2004. These directors are all re-eligible and the board
proposes to renew their mandates for a period of three years.

12
The audit committee consists of three directors of which two independent, and has the following
activities:
- to thoroughly examine the semi-annual and annual financial reports of CMB, before the corresponding
board meeting;
- to make recommendations to the board on the appointment and release of the auditor and the level
of the audit fee;
- to watch over the independence of the auditor;
- to review the audit scope and approach of their assignment as proposed by the auditor;
- permanent supervision of the final audit files;
- to discuss and evaluate the conclusions of the interim and year-end audit reviews;
- to investigate all identified risk areas;
- to evaluate the organisational set-up and the competencies of the internal audit department;
- to approve the internal audit plan, the activities of the internal audit department and ensure
coordination between external and internal auditors. The committee must ensure that the internal
audit department has sufficient (material and human) resources at its disposal and that it has sufficient
esteem within the organisation to be able to carry out its goals in an effective manner;
- to evaluate the major findings emanating from every internal review including the local management’s
responses to these;
- to assess the adequacy of the internal control system;
- to grant permission to the auditors to supply other services than those defined by Law;
- to evaluate any other matters at the request of the board of directors;
- to report on the activities of the committee to the board of directors.
MembersJean Peterbroeck – chairman
Etienne DavignonLudwig Criel
In 2003 the audit committee met three times.
AUDIT COMMITTEE

13
The nominating and remuneration committee has three directors of which two independent, and has
the following tasks:
- to make recommendations to the board of directors with respect to the remuneration of executive
directors, members of the management and of the senior staff. The extent and nature of the
remuneration should be in accordance with the function and the benefit to the company;
- to ensure that the principles of Corporate Governance are abided by;
- to evaluate the independence of external directors;
- to ensure that the most valuable candidates are submitted for appointment;
- make recommendations to the board of directors with respect to the appointment of directors.
MembersEtienne Davignon – chairman
Jean PeterbroeckMarc Saverys
The nominating and remuneration committee met once.
The chairman informs the board of directors and makes the recommendations as discussed.
KLYNVELD PEAT MARWICK GOERDELER
Bedrijfsrevisoren
Permanent representativesTheo Erauw
Helga Platteau
The mandate of the auditor expires after the annual general meeting of 11 May 2004. The board of direc-
tors will propose to said annual general meeting to nominate as joint auditors Mrs. Helga Platteau and
KPMG Bedrijfsrevisoren with Mr. Serge Cosijns as permanent representative.
Execut i ve commit teeThe board of directors delegates the day-to-day management of the company to an executive committee
set up in accordance with article 524bis of the Code of Companies.
The executive committee convenes on a weekly basis.
The board of directors appoints the members of the executive committee.
MembersMarc Saverys – chairman
Ludwig CrielPatrick RodgersVirginie SaverysBenoît Timmermans
AUDITOR
NOMINATING AND REMUNERATION COMMITTEE
DAY-TO-DAY MANAGEMENT
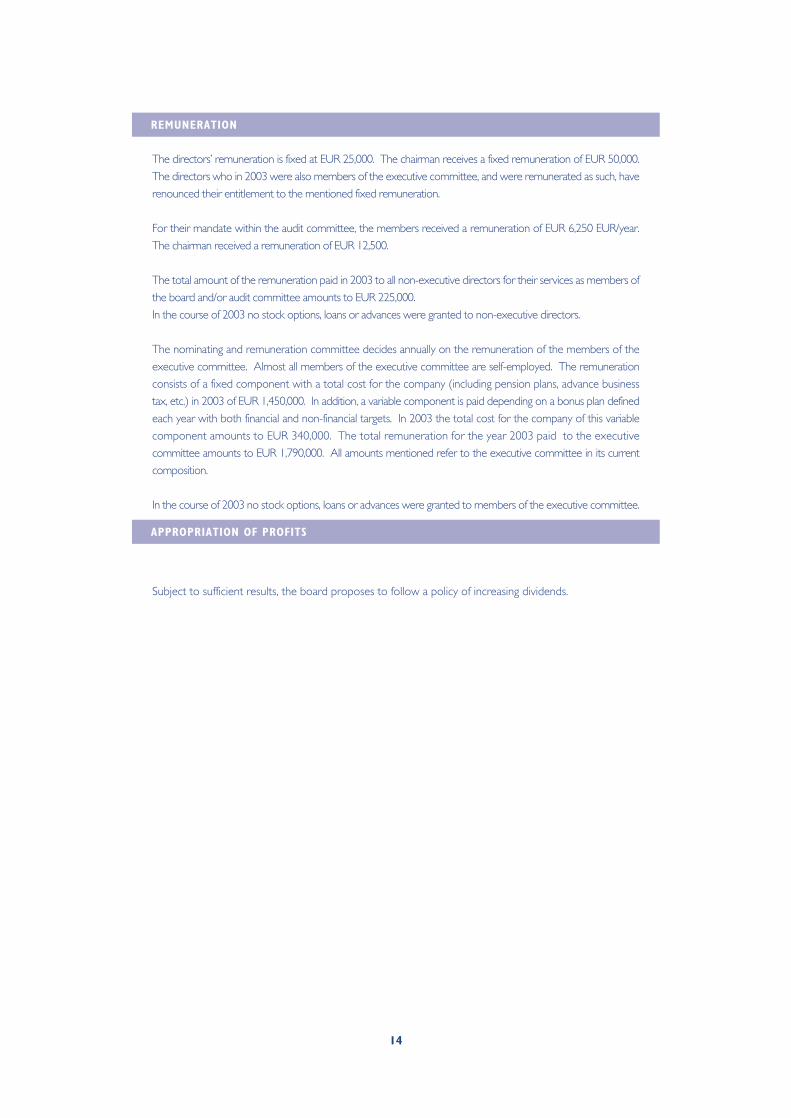
The directors’ remuneration is fixed at EUR 25,000. The chairman receives a fixed remuneration of EUR 50,000.
The directors who in 2003 were also members of the executive committee, and were remunerated as such, have
renounced their entitlement to the mentioned fixed remuneration.
For their mandate within the audit committee, the members received a remuneration of EUR 6,250 EUR/year.
The chairman received a remuneration of EUR 12,500.
The total amount of the remuneration paid in 2003 to all non-executive directors for their services as members of
the board and/or audit committee amounts to EUR 225,000.
In the course of 2003 no stock options, loans or advances were granted to non-executive directors.
The nominating and remuneration committee decides annually on the remuneration of the members of the
executive committee. Almost all members of the executive committee are self-employed. The remuneration
consists of a fixed component with a total cost for the company (including pension plans, advance business
tax, etc.) in 2003 of EUR 1,450,000. In addition, a variable component is paid depending on a bonus plan defined
each year with both financial and non-financial targets. In 2003 the total cost for the company of this variable
component amounts to EUR 340,000. The total remuneration for the year 2003 paid to the executive
committee amounts to EUR 1,790,000. All amounts mentioned refer to the executive committee in its current
composition.
In the course of 2003 no stock options, loans or advances were granted to members of the executive committee.
Subject to sufficient results, the board proposes to follow a policy of increasing dividends.
14
REMUNERATION
APPROPRIATION OF PROFITS

15
DIRECTORS’ REPORT

16
H I G H L I G H T S F O R T H E Y E A R 2 0 0 3
J A N U A R Y
3 January : Bocimar sells the Mineral Century (1995-161,175 dwt).The capital loss realised on this sale amounts to USD 4 million.
24 January : Bocimar sells the Mineral Colombia (1997-150,393 dwt).This sale generates a capital loss of USD 4 million.
31 January : Bocimar orders a capesize vessel with the Chinese yard SWS.The delivery of this vessel is scheduled for October 2004.
F E B R U A R Y
19 February : Bocimar sells the El Dorado (1987-148,982 dwt).On this sale a small capital loss is realised.
20 February : Euronav and Wah Kwong order a VLCC unit of 318,000 dwt with Hyundai Heavy Industries(Korea).
The delivery is scheduled for the third quarter of 2004.
27 February : Euronav sells the Limburg (2000-298,997 dwt).Following the terrorist attack, a settlement was reached with the insurance company and Euronav wascompensated for the damage. Taking into account the indemnity received from the insurance companyand the sale proceeds, Euronav realises a capital gain of approximately USD 5 million.
M A R C H
3 March : Announcement that CMB is considering the demerger of its industrial gas shipping andoffshore activities into Exmar.
7 March : Euronav sells the Pacific Power (1988-245,653 dwt).On this sale a capital loss of USD 12 million is realised.
24 March : CMB sells the remaining 20% participating interest in Hesse-Noord Natie to PSA.The sale price amounts to EUR 121 million and CMB realises a capital gain of approximately EUR 55 million on this sale.
27 March : CMB’s board of directors decides to present to an extraordinary general meeting aproposal to demerge its industrial gas transport and offshore activities into a new Belgiancompany “Exmar”.
A P R I L
4 april : Euronav sells the Zeeland (2001-298,977 dwt).The capital gain realised on this sale amounts to approximately USD 3 million.
24 april : Euronav sells the Picardie (1999-299,167 dwt).On this sale a capital loss of USD 6 million was realised.

30 april : Entarco sells its 40% stake in the Chaconia (1990-28,070 cbm).This sale generates a capital loss of EUR 4 million.
M A Y
19 May : The Board of Directors approves the demerger of its industrial gas shipping and offshore activities into Exmar.
The board decides to submit said demerger to the approval of an extraordinary general meeting tobe held on Friday 20 June 2003. CMB also obtains a ruling that confirms the tax neutrality of the proposed demerger.
J U N E
20 June: The spin-off of the industrial gas transport and offshore activities into Exmar is approvedby the extraordinary general shareholders’ meeting.
By means of this transaction CMB’s gas transport business is spun off and transferred into a new Belgian listed public limited liability company “Exmar”. The activities relating to the transport of dry bulk (Bocimar) and of crude oil (Euronav) will remain within CMB. The partial demerger has retroactive effect as of 1 March 2003. Following the demerger all share-holders of CMB receive new Exmar shares.
The approval of the partial demerger is followed by a number of private exchange operations betweenthe three major shareholders of all or part of their CMB and Exmar shares respectively so that eachof them receives, principally, shares in the company where his or her management responsibility lies.This exchange of shares is effected outside the Stock Exchange on terms and conditions that arenot higher than the market price.
23 June: First listing of Exmar on the First Market of Euronext Brussels under the symbol “EXM”and admission to listing of 1,047,466 CMB shares.
The Indicative Relative Value of CMB (after the partial demerger) and of Exmar in the total value ofCMB (before the partial demerger) has been fixed at 39% for Exmar and 61% for CMB. As a result,the initial reference price, amounts to EUR 23.20 for the Exmar share and to EUR 36.30 for the CMBshare (after the partial demerger), calculated on the basis of the closing price of the CMB share on19 June 2003 (EUR 59.50).
Furthermore, up until before the partial demerger only 6,302,534 CMB shares (of the 7,350,000shares) are listed on the First Market of Euronext Brussels. At the occasion of the partial demerger,and the issuing of the prospectus, CMB has applied for the admission to list the remaining 1,047,466shares, so that all 7,350,000 CMB shares are listed. Following the approval by Euronext Brussels allshares are listed as from 23 June.
25 June: Incorporation of the Belgian limited liability company Euronav.Shortly after its incorporation, this company decides to apply for the tonnage tax system, which wasgranted in the autumn.
30 June: Euronav acquires 50% of the FPSO Farwah.Within the framework of the partial demerger, Euronav acquires 50% of the shares of Palliser ShippingLimited from Exmar. This company owns the FPSO (Floating Production Storage and Offloading Unit)Farwah, a unit used in a long term time charter agreement with a company belonging to the Total Group.
17
18
J U L Y
1 July : Euronav, Frontline and OSG decide to unwind a number of joint ventures.Within the framework of this agreement Euronav, acquires full ownership of the companies GoldenLagoon Corporation (owner of the Pacific Lagoon) and Ichiban Transport Corporation (owner of theIchiban). At the same time, the participating interests in the owning companies of the Ariake, Hakata,Sakura, and Tanabe are sold. This restructuring gives rise to an exceptional capital loss of approximately USD 5 million.
29 July : Euronav sa acquires the Pacific Lagoon (1999-305,839 dwt).This vessel flies the Belgian flag and is operated with application of the tonnage tax system.
A U G U S T
19 August : The Mineral Azalea (1999 – 171,199 dwt) joins Bocimar’s fleet of owned vessels.Bocimar acquires this vessel (previously Sea Azalea), chartered in on long term from Imabari (Japan), by exercising its purchase option.
S E P T E M B E R
29 September : Bocimar increases its participating interest in Pacific Basin to 9.4%.
30 September : Euronav acquires Total Services Maritimes SA and M/T Provence SA from Total TransportMaritime SA
Subsequently the companies’ names are changed into Euronav Services Maritimes SA and M/TTanker SA, respectively.Pursuant to this purchase, Euronav takes over the bareboat charter of the tanker Provence(1995 – 285,365 dwt) for a period of three years.
O C T O B E R
17 October : Euronav sa acquires the Namur (2000-298,552 dwt).This vessel is also operated under Belgian flag with application of the tonnage tax regime.
N O V E M B E R
4 November : Bocimar acquires the Mineral China (previously Bagru) (2003 – 171,448 dwt).Bocimar operates this newbuilding vessel under Belgian flag
D E C E M B E R
30 December : Exmar repays its debt to CMB entirely.Within the framework of the partial demerger a loan amounting to USD 60 million was granted toExmar, to be repaid by the end of June 2006 at the latest. Additionally Exmar was also granted a shortterm credit line amounting to maximum USD 46 million, to be repaid on 31 December 2003 at the latest.Both loans were repaid in full. As from that moment Exmar and CMB no longer have any financialrelationship.

19
The following events, which occurred after closing of the accounts, should be mentioned:
J A N U A R Y 2 0 0 4
2 January : Bocimar acquires the Mineral Viking (2001-172,964 dwt).This vessel flies the Belgian flag.
20 January : Euronav sa acquires the Savoie (1993-306,430 dwt).Euronav acquires the Savoie (previously Berge Sigval) from Bergesen. The vessel will be operated underBelgian flag with application of the tonnage tax regime, as from mid 2004.The Berge Sigval’s sister vessel, the Shinyo Landes (previously Berge Stavanger) is acquired by the ShinyoGroup and Univan and time chartered to Euronav.
28 January : Purchase and resale of the Poterne (1994-151,044 dwt).Bocimar acquires this vessel by exercising its purchase option. The vessel is resold immediately andBocimar realises a capital gain of approximately USD 14 million on this vessel.
F E B R U A R Y 2 0 0 4
2 February : Bocimar acquires the Mineral Marvel (previously Marvelous) (2000-169,225 dwt).Bocimar acquires this vessel, chartered in on long term, by exercising its purchase option.
13 February : Bocimar and Wah Kwong sell the newbuilding vessel Oshima 10384 (2004-55,500 dwt).This handymax unit will be delivered in September 2004. On this sale Bocimar will realise a capital gainof approximately USD 8 million.
23 February : Bocimar sells the Mineral Dragon (2003-149,782 dwt).The delivery of this vessel is scheduled for mid July. The capital gain realised on this sale amounts toapproximately USD 22 million.
24 February : Bocimar acquires the Mineral Kiwi (2004-170,000 dwt).Following the delivery this newbuilding double hull capesize vessel is immediately brought under Belgian flag.
.
M A R C H 2 0 0 4
4 March : CMB and Wah Kwong order two chemical tankers (19,700 dwt) from the Fukuoka yard(Japan).
These vessels will be delivered in December 2006 and January 2007.
9 March : Bocimar and Wah Kwong sell the newbuilding vessel Oshima 10385 (2005-55,500 dwt).This handymax unit will be delivered in March 2005. On this sale Bocimar will realise a capital gain ofapproximately USD 8 million.
12 March : Sale of the Mineral Venture (1996-150,393 dwt).The sale of this vessel, in joint venture with Wah Kwong, generates a capital gain of approximately USD6 million for Bocimar.
15 March : Bocimar exercises its purchase option on the Sea Lotus (1999-72,270 dwt) and Sea Daisy(1999-73,000 dwt).
The delivery of the ships, currently on charter with Bocimar, is scheduled for September andOctober 2004.

20
Bocimar and Euronav have little or no exposure to currency fluctuations. Practically all revenuesand expenses are expressed in USD. Only part of the operating expenses is expressed in EUR.This currency exposure is not covered.
All outstanding shipping loans are expressed in USD. All ship financing contracts provide a floatinginterest rate. The interest rate risk is actively managed by means of various financial instrumentssuch as IRS and caps & floors. Approximately 40% of the shipping debt is covered in this manner.Taking into account the evolution of the interest rates during 2003, the mark-to-market value ofthe derivatives portfolio shows a substantial capital loss. As it concerns a capital loss related to anactive cover, it is recorded in the results when the interest hedge products expire.
Evolution average rate of exchange USD/EUR 2002-2003
CURRENCY AND INTEREST EXPOSURE
in EUR1.30
1.25
1.20
1.15
1.10
1.05
1.00
0.95
0.90
0.85
0.80Jan
2002Feb Mar Apr May Jun Jul Aug Sep Oct Nov Dec
2002Jan
2003Feb Mar Apr May Jun Jul Aug Sep Oct Nov Dec
2003

21
CMB’s Extraordinary Shareholders’ Meeting of 9 May 2003 decided to withdraw 250,000 own shares,bought by the company. This withdrawal was completed without decreasing the capital but through thecancellation of EUR 12,934,934.81 of the reserves unavailable for distribution. Since this transaction thecapital is represented by 7,350,000 shares.
In the course of 2003 CMB acquired 117,200 of its own shares on the stock exchange for a total amountof EUR 4,840,963. None of the own shares were sold.
Early 2004 a further 234,046 own shares were acquired on the stock exchange for a total amount of EUR18,070,285. CMB also sold 1,246 shares through the Stock Exchange for a total amount of EUR 107,779.
All transactions were carried out in accordance with the mandate given to the board of directors by theextraordinary shareholders’ meeting of 20 June 2003.
It will be proposed to the Extraordinary General Meeting of 11 May 2004, to withdraw 350,000 of theown shares, bought by the company. This withdrawal will be completed without decreasing the capitalbut through the cancellation of EUR 22,829,973.22 of the reserves unavailable for distribution. After thistransaction the capital will be represented by 7,000,000 shares.
On 25 March 2004 the shareholders’ structure is as follows:
Evolutions stock quotation CMB share 2003
THE CMB SHARE
in EUR70.00
65.00
60.00
55.00
50.00
45.00
40.00
35.00
30.00
25.00
20.00
The stock data from before the demerger were adjusted onbasis of the indicative relative value of CMB and Exmar asused for the partial demerger, i.e. 61% for CMB and 39% forExmar.
shares %
Saverco sa 2,800,763 38.11%Victrix sa 1,061,232 14.44%CMB sa 350,000 4.76%
Third parties 3,138,005 42.69%
7,350,000 100.00%


2424
C M B
BOCIMARInternational sa
BOCIMARLUX S.A.
100%
100%
100%
BOCIMAR FAREAST HOLDINGS
Group
BOCIMAR

2525
Evolutions volumes transported
(in million EUR)
Turnover
Operating results
Financial results
Extraordinary results
Net results after taxation
of which : Group share
Third party share
Cash flow
Depreciation
of which : goodwill
Fixed assets
Amounts payable after one year
Number of employees
2002
196
–49
–10
0
–59
–59
0
–18
32
0
204
147
23
2003
281
–55
–5
0
–60
–60
0
–32
13
0
218
148
24
C o n s o l i d a t e d k e y f i g u r e sin million tons
2003 was undoubtedly an exceptional year for the dry bulksector. Exceptional because of the strong markets fromJanuary until August, which, from September onwards, roseto unprecedented levels.
At the beginning of the year the average freight rate for acapesize vessel amounted to USD 25,000/day, by the endof the year, however, the market had soared to an averagerate of USD 80,000/day. The evolution in the panamax andhandymax markets was similar.
The growth of the Chinese economy in general (9%) andof industrial production in particular (17%) resulted in aspectacular increase in the volumes of iron ore, coal and grainto be transported. This caused, in its turn, a serious disruptionin the logistics chain – a considerable number of vessels weredelayed in the most important loading and discharge ports– this combined with the limited number of newbuildingvessels entering the market, resulted in the previouslymentioned market evolution.In the course of the year 2002, Bocimar covered its panamaxand capesize fleet by means of “freight derivatives” or “ForwardFreight Agreements” (FFA) for the years 2003 and 2004. Takinginto account the extreme evolution of the capesize and
panamax freight markets a loss amounting to USD 102 millionwas taken up in the 2003 accounts.
In the course of 2003 Bocimar decided to bring two newly ac-quired capesize vessels – the Mineral Viking (2001-172,964 dwt)and the Mineral China (2003-171,448 dwt) – under Belgian flag.In the course of 2004 additional vessels will be brought underBelgian flag.
During recent months the capesize, panamax and handymaxmarkets have remained very strong and there are currentlyno signs of a possible weakening. The FFAs (Forward FreightAgreements) show the same evolution, which means that themarket as such is taking on board the possibility of firm freightmarkets for an extended period of time.
For 2004 it is expected that the continuing growth of theChinese demand for iron ore and coal and further inefficienciesin the logistics chain will compensate for the supply of new-buildings, as a consequence of which the markets will remainvery strong. Bocimar looks upon 2004 with confidence. Witha strong portfolio of time charters and an average of sevenvessels on the spot market, 2004 is set to be an excellentyear.
Average capesize earnings (Mar 2001 - Mar 2004)
in USD/day
Source : Clarkson Research Studies
AVERAGE FREIGHT RATES in USD/day(modern vessels) 2002 2003 2004
(19 Mar)*
trip charter- capesize 11,654 37,536 88,380- panamax 7,284 19,091 41,13712 month time charter- capesize 14,674 31,197 72,385- panamax 8,881 17,254 43,802Source : Clarkson Research Studies
* Average until
110,000
100,000
90,000
80,000
70,000
60,000
50,000
40,000
30,000
20,000
10,000
0
coal
ores
crude oil
grain
others
* volume Bocimar & partners
60
50
40
30
20
10
0
1994 1995 1996 1997 1998 1999 2000* 2001* 2002* 2003*
Mar ‘01 Mar ‘04

26
C M B
100%
EURONAV
EURONAVLUXEMBOURG
GroupEURONAV sa
100% 100%
27
(in million EUR)
Turnover
Operating results
Financial results
Extraordinary results
Net results after taxation
of which : Group share
Third party share
Cash flow
Depreciation
of which : goodwill
Fixed assets
Amounts payable after one year
Number of employees
2002
95
3
–18
2
–18
–18
0
35
53
0
707
432
22
2003
135
66
–5
–5
54
54
0
88
29
0
415
189
19
C o n s o l i d a t e d k e y f i g u r e s
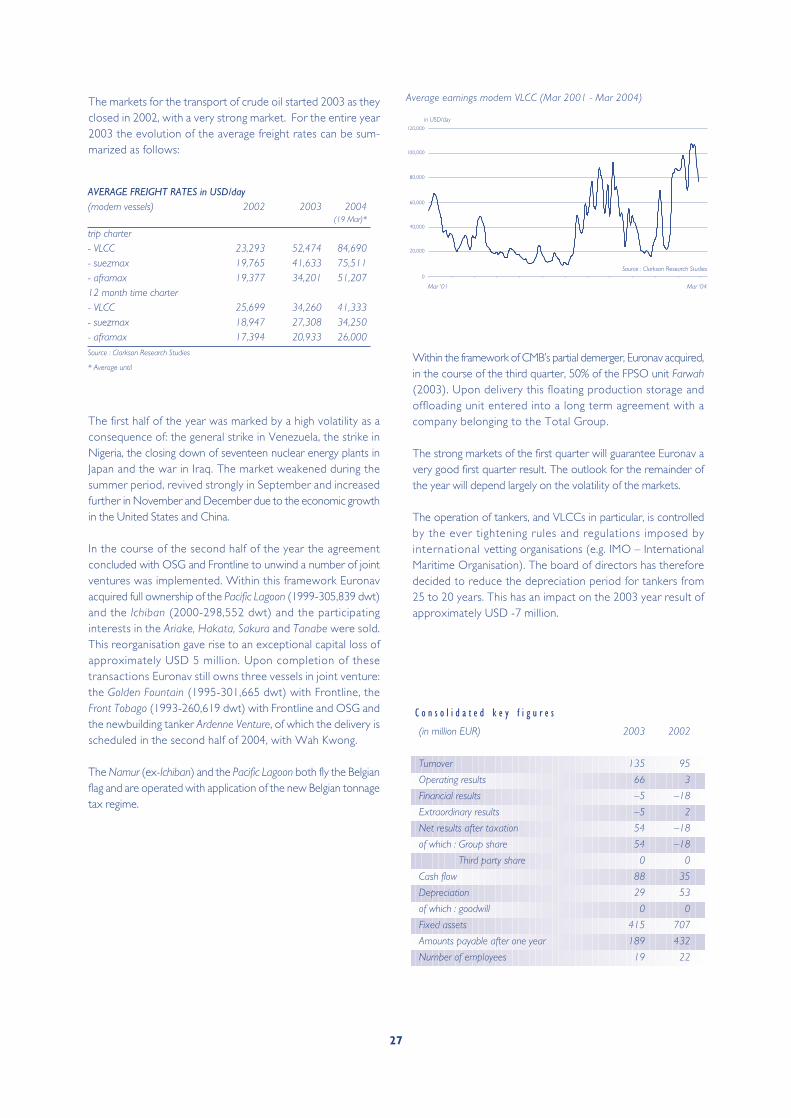
Average earnings modern VLCC (Mar 2001 - Mar 2004)The markets for the transport of crude oil started 2003 as theyclosed in 2002, with a very strong market. For the entire year2003 the evolution of the average freight rates can be sum-marized as follows:
The first half of the year was marked by a high volatility as aconsequence of: the general strike in Venezuela, the strike inNigeria, the closing down of seventeen nuclear energy plants inJapan and the war in Iraq. The market weakened during thesummer period, revived strongly in September and increasedfurther in November and December due to the economic growthin the United States and China.
In the course of the second half of the year the agreementconcluded with OSG and Frontline to unwind a number of jointventures was implemented. Within this framework Euronavacquired full ownership of the Pacific Lagoon (1999-305,839 dwt)and the Ichiban (2000-298,552 dwt) and the participatinginterests in the Ariake, Hakata, Sakura and Tanabe were sold.This reorganisation gave rise to an exceptional capital loss ofapproximately USD 5 million. Upon completion of thesetransactions Euronav still owns three vessels in joint venture:the Golden Fountain (1995-301,665 dwt) with Frontline, theFront Tobago (1993-260,619 dwt) with Frontline and OSG andthe newbuilding tanker Ardenne Venture, of which the delivery isscheduled in the second half of 2004, with Wah Kwong.
The Namur (ex-Ichiban) and the Pacific Lagoon both fly the Belgianflag and are operated with application of the new Belgian tonnagetax regime.
Within the framework of CMB’s partial demerger, Euronav acquired,in the course of the third quarter, 50% of the FPSO unit Farwah(2003). Upon delivery this floating production storage andoffloading unit entered into a long term agreement with acompany belonging to the Total Group.
The strong markets of the first quarter will guarantee Euronav avery good first quarter result. The outlook for the remainder ofthe year will depend largely on the volatility of the markets.
The operation of tankers, and VLCCs in particular, is controlledby the ever tightening rules and regulations imposed byinternational vetting organisations (e.g. IMO – InternationalMaritime Organisation). The board of directors has thereforedecided to reduce the depreciation period for tankers from25 to 20 years. This has an impact on the 2003 year result ofapproximately USD -7 million.
Source : Clarkson Research Studies
in USD/day120,000
100,000
80,000
60,000
40,000
20,000
0
AVERAGE FREIGHT RATES in USD/day(modern vessels) 2002 2003 2004
(19 Mar)*
trip charter- VLCC 23,293 52,474 84,690- suezmax 19,765 41,633 75,511- aframax 19,377 34,201 51,20712 month time charter- VLCC 25,699 34,260 41,333- suezmax 18,947 27,308 34,250- aframax 17,394 20,933 26,000Source : Clarkson Research Studies
* Average until
Mar ‘01 Mar ‘04

C M B
28
RESLEA saCMBInternational sa
HESSENATIELOGISTICS sa
100% 100% 50%
HOLDING

29
(in million EUR)
Turnover
Operating results
Financial results
Extraordinary results
Net results after taxation
of which : Group share
Third party share
Cash flow
Depreciation
of which : goodwill
Fixed assets
Amounts payable after one year
Number of employees
2002
194
–8
3
117
111
110
1
185
18
0
273
66
303
2003
40
–7
11
63
67
67
0
77
6
0
117
45
299
C o n s o l i d a t e d k e y f i g u r e s
The consolidated result of this division mainly consists ofthe results recorded for CMB (holding), CMB International(co-ordination centre), Hessenatie Logistics (logistics sector),and the real estate company Reslea (50%).
The result of the holding division is mainly due to the capitalgain of EUR 55 million realised on the sale of the remaining20% stake in Hesse-Noord Natie on 24 March 2003. The resultwas also positively influenced by the additional payment madeby PSA in the course of the third quarter. As agreed at thetime of the partial demerger this additional payment, for a totalamount of EUR 5 million, was divided between CMB and Exmarin proportion to the indicative relative value (61% - 39%). Theimpact on the CMB results therefore amounts to EUR 3 million.
Within the framework of the partial demerger, CMB sold itsparticipating interest in the insurance broker Belgibo to Exmar,on 30 June 2003, which generated a capital gain of EUR 3 million.Furthermore on 30 November 2003 50% of the stake held inReslea was sold to Exmar, on which a capital gain of EUR 2 millionwas realised. Reslea owns, amongst others, the buildings whereCMB and Exmar have their registered offices.

APPROPRIATION ACCOUNT
The result to be allocated for the financial year amounts to EUR 353,179.32. Together with the transferof EUR 100,874,491.86 from the previous financial year, this gives a profit balance to be appropriated of:
To the general shareholders’ meeting of 11 May 2004, it will be proposed to distribute a gross dividendfor the financial year 2003, of EUR 5.00 per share. As a result, the distribution of the profit will be as follows:
- dividends . . . . . . . . . . . . . . . . . . . . . . . . . . . . . . . . . . . . . . . . . . . . . . . . . . . . . . . . . . . . . . 35,000,000.00 EUR- capital and reserves . . . . . . . . . . . . . . . . . . . . . . . . . . . . . . . . . . . . . . . . . . . . . . . . . . . . . 14,995,859.72 EUR- carried forward . . . . . . . . . . . . . . . . . . . . . . . . . . . . . . . . . . . . . . . . . . . . . . . . . . . . . . . . . 51,231,811.46 EUR
After deduction of the withholding tax, the net dividend will be made payable in the amount of:
The net dividend will be payable to the holders of registered shares on 14 May 2004. They will alsobe payable to the holders of bearer shares from the aforementioned date onwards against deliveryof coupon no. 15 at the counters of the offices and branches of Fortis Bank, Dexia Bank and Petercam.
Antwerpen, 25 March 2004THE BOARD OF DIRECTORS
30
EUR 101,227,671.18
EUR 3.75 per share(EUR 2.00 per share for the financial year 2002)

31
Dividends payable as from 14 May 2004
Publication of half year results 2004 Friday 30 July 2004
Announcement of third quarter results 2004 Friday 29 October 2004
Announcement of fourth quarter results 2004 Friday 28 January 2005
Announcement of first quarter results 2005 Friday 29 April 2005
Annual General Meeting second Tuesday of May at 14h30
2005 : Tuesday 10 May
SHAREHOLDERS’ DIARY

32

33
conso l ida ted account s

34
consolidated balance sheetf o r t h e y e a r e n d e d 3 1 D e c e m b e r , 2 0 0 3
ASSETS
FIXED ASSETS . . . . . . . . . . . . . . . . . . . .
II. Intangible assets . . . . . . . . . . . . . . . . . .III. Consolidation differences . . . . . . . . . . . . . . .IV. Tangible assets . . . . . . . . . . . . . . . . . . .
Vessels . . . . . . . . . . . . . . . . . . . . .A. Land and buildings . . . . . . . . . . . . . . . . .B. Plant, machinery and equipment . . . . . . . . . . . .C. Furniture and vehicles . . . . . . . . . . . . . . . .D. Leasing and other similar rights . . . . . . . . . . . . .E. Other tangible assets . . . . . . . . . . . . . . . .F. Assets under construction and advance payments . . . . . .
V. Financial assets . . . . . . . . . . . . . . . . . . .A. Enterprises accounted for using the equity method
1. Participating interests . . . . . . . . . . . . . . .2. Amounts receivable . . . . . . . . . . . . . . .
B. Other enterprises1. Shares . . . . . . . . . . . . . . . . . . .2. Amounts receivable . . . . . . . . . . . . . . .
CURRENT ASSETS . . . . . . . . . . . . . . . . . .
VI. Amounts receivable after one year . . . . . . . . . . . .A. Trade debtors . . . . . . . . . . . . . . . . . .B. Other amounts receivable . . . . . . . . . . . . . .
VIII. Amounts receivable within one year . . . . . . . . . . .A. Trade debtors . . . . . . . . . . . . . . . . . .B. Other amounts receivable . . . . . . . . . . . . . .
IX. Investments . . . . . . . . . . . . . . . . . . .A. Own shares . . . . . . . . . . . . . . . . . .B. Other investments and deposits . . . . . . . . . . . .
X. Cash at bank and in hand . . . . . . . . . . . . . . .XI. Deferred charges and accrued income . . . . . . . . . .
TOTAL ASSETS . . . . . . . . . . . . . . . . . . .
2002(in millions of EUR)
1,073
– –
944 840 62 5
16 3 1
17 129
65 –
3 61
196
3 – 3
95 31 64 25 12 13 26 47
1,269
2003(in millions of EUR)
714
– –
679 550 54 4
13 – 1
57 35
– –
11 24
200
1 –1
72 56 16 67 5
62 9
51
914
2002(in millions of EUR)
1,874
– –
1,697 1,369
64 5
17 5 1
236177
65 –
3 109
255
– – –
124 61 63 34 12 22 37 60
2,129
pro forma after partial demerger

35
LIABILITIES
CAPITAL AND RESERVES . . . . . . . . . . . . . . .
I. Capital . . . . . . . . . . . . . . . . . . . . .II. Share premium account . . . . . . . . . . . . . . . .IV. Reserves . . . . . . . . . . . . . . . . . . . . .V. Consolidation differences . . . . . . . . . . . . . . .VI. Translation differences . . . . . . . . . . . . . . . .VII. Investment grants . . . . . . . . . . . . . . . . . .
MINORITY INTERESTS . . . . . . . . . . . . . . .
VIII. Minority interests . . . . . . . . . . . . . . . . . .
PROVISIONS AND DEFERRED TAXES . . . . . . . . .
IX. Provisions and deferred taxes . . . . . . . . . . . . .A. Provisions for liabilities and charges
1. Pensions and similar obligations . . . . . . . . . . .2. Taxation . . . . . . . . . . . . . . . . . . .3. Major repairs and maintenance . . . . . . . . . . . .4. Other liabilities and charges . . . . . . . . . . . .
B. Deferred taxes . . . . . . . . . . . . . . . . . .
CREDITORS . . . . . . . . . . . . . . . . . . . . .
X. Amounts payable after one year . . . . . . . . . . . . .A. Financial debts
3. Leasing and other similar obligations . . . . . . . . .4. Credit institutions . . . . . . . . . . . . . . . .5. Other loans . . . . . . . . . . . . . . . . . .
B. Trade debts1. Suppliers . . . . . . . . . . . . . . . . . . .
XI. Amounts payable within one year . . . . . . . . . . . .A. Current portion of amounts payable after one year . . . . . .B. Financial debts
1. Credit institutions . . . . . . . . . . . . . . . .2. Other loans . . . . . . . . . . . . . . . . . .
C. Trade debts1. Suppliers . . . . . . . . . . . . . . . . . . .
D. Advances received on contracts in progress . . . . . . . .E. Taxes, remuneration and social security
1. Taxes . . . . . . . . . . . . . . . . . . . .2. Remuneration and social security . . . . . . . . . . .
F. Other amounts payable . . . . . . . . . . . . . . .
XII. Accrued charges and deferred income . . . . . . . . . .
TOTAL LIABILITIES . . . . . . . . . . . . . . . . .
2002(in millions of EUR)
544
90 20
418 –
16 –
1
1
75
75
2 –
15 58 –
1,509
1,035
66 859 110
–
403 129
128 5
88 3
19 4
27
71
2,129
2002(in millions of EUR)
314
50 9
248 –7 –
–
–
40
40
2 –8
30 –
915
603
8 530 65
–
273 76
121 5
41 3
4 2
21
39
1,269
2003(in millions of EUR)
273
50 9
261 –
–47 –
–
–
51
51
1 –9
41 –
590
346
–311 35
–
208 55
37 2
71 –
3 2
38
36
914
pro forma after partial demerger

36
I. Operating income . . . . . . . . . . . . . . . . .A. Turnover . . . . . . . . . . . . . . . . . . . .B. Increase (+); Decrease (–) in stocks, work and contracts in progressD. Other operating income . . . . . . . . . . . . . . .
II. Operating charges . . . . . . . . . . . . . . . . . .A. Raw materials, consumables and goods for resale
1. Purchases . . . . . . . . . . . . . . . . . .B. Services and other goods. . . . . . . . . . . . . . .C. Remuneration, social security costs and pensions . . . . . . .D. Depreciation of and other amounts written off formation expenses,
intangible and tangible fixed assets . . . . . . . . . . . .E. Increase (+); Decrease (–) in amounts written off stocks,
contracts in progress and trade debtors . . . . . . . . . .F. Increase (+); Decrease (–) in provisions for liabilities and charges .G. Other operating charges . . . . . . . . . . . . . . .I. Depreciation of consolidation differences . . . . . . . . .
III. Operating result . . . . . . . . . . . . . . . . . .
IV. Financial income . . . . . . . . . . . . . . . . . .A. Income from financial fixed assets . . . . . . . . . . . .B. Income from current assets . . . . . . . . . . . . . .C. Other financial income . . . . . . . . . . . . . . .
V. Financial charges . . . . . . . . . . . . . . . . . .A. Interest and other debt charges . . . . . . . . . . . .B. Increase (+); Decrease (–) in amounts written off current assets,
other than those mentioned under II.E. . . . . . . . . . .D. Other financial charges . . . . . . . . . . . . . . .
VI. Result on ordinary activities before income taxes . . . . . . .
VII. Extraordinary income . . . . . . . . . . . . . . . .B. Adjustments to amounts written off financial fixed assets . . . .C. Adjustments to provisions for extraordinary liabilities and charges .D. Gain on disposal of fixed assets. . . . . . . . . . . . .E. Other extraordinary income . . . . . . . . . . . . .
VIII. Extraordinary charges . . . . . . . . . . . . . . . .A. Extraordinary depreciation of and extraordinary amounts
written off formation expenses, intangible and tangible fixed assets. .B. Amounts written off financial fixed assets . . . . . . . . .C. Provisions for extraordinary liabilities and charges . . . . . . .D. Loss on disposal of fixed assets . . . . . . . . . . . . .E. Other extraordinary charges . . . . . . . . . . . . .G. Extraordinary depreciation of consolidation differences . . . . .
consolidated income statementf o r t h e y e a r e n d e d 3 1 D e c e m b e r , 2 0 0 3
2002(in millions of EUR)
839 806
– 33
870
– 696 40
129
– –16 21 –
–31
50 16 8
26
103 76
2 25
–84
159 – –
159 –
46
– 1
40 2 3 –
2002(in millions of EUR)
506 484
– 22
560
– 404 28
103
– 7
18 –
–54
38 13 9
16
67 46
2 19
–83
159 – –
159 –
28
– 1
24 2 1 –
2003(in millions of EUR)
541 455
– 86
537
– 304 18
48
– 14
153 –
4
28 3 6
19
27 21
- 6
5
64 – –
64 –
6
– 1 – 5 – –
pro forma after partial demerger

37
IX. Result for the period before income taxes . . . . . . . . .
X. Deferred taxes . . . . . . . . . . . . . . . . . . .A. Transfer to deferred taxes . . . . . . . . . . . . . .B. Transfer from deferred taxes . . . . . . . . . . . . .
XI. Income taxes . . . . . . . . . . . . . . . . . . .A. Income taxes . . . . . . . . . . . . . . . . . .B. Adjustment of income taxes and write-back of tax provisions . . .
XII. Result for the period . . . . . . . . . . . . . . . . .
XIII. Share in the result of the enterprises accounted for using the equity method . . . . . . . . . . . . .
A. Profits . . . . . . . . . . . . . . . . . . . . .B. Losses . . . . . . . . . . . . . . . . . . . . .
XIV. Consolidated result . . . . . . . . . . . . . . . . .
A. Share of minority interests in the result . . . . . . . . . .
B. Share of the Group in the result . . . . . . . . . . . . .
2002(in millions of EUR)
29
–– –
4 5
–1
25
1 1 –
26
1
25
2002(in millions of EUR)
48
–– –
3 4
–1
45
1 1 –
46
1
45
2003(in millions of EUR)
63
–– –
2 2 –
61
–– –
61
–
61
pro forma after partial demerger

38
I. INTRODUCTION
At the end of the accounting year 2003 the consolidation scope consists of 68 enterprises (130 at the end of 2002). 14 new enterprises weretaken up into the consolidation scope. 76 enterprises left the consolidation scope: 46 following the partial demerger of CMB, 8 were liquidated,18 following the sale of the remaining 20% of Hesse-Noord Natie and 4 following the restructuring of some of the joint ventures of Euronav.
The most important event of the year was, undoubtedly, the partial demerger of CMB’s industrial gas transport and offshore activities intoExmar, that was completed successfully on 20 June 2003. The partial demerger had retroactive effect as of 1 March 2003. However, CMB’sconsolidated income statement no longer takes into account any contribution from the gas activity for the first two months of the year. Thismethod is applied in accordance with article 107,1 and 107,3 of the Royal Decree of 30 January 2001.
II. CONSOLIDATED SUBSIDIARIES AND ENTERPRISES ACCOUNTED FOR USING THE EQUITY METHOD
Name Registered offices Country Method %
Bocimar International (Group) De Gerlachekaai 20, 2000 Antwerpen 1 BE F 100 CMB International nv De Gerlachekaai 20, 2000 Antwerpen 1 BE F 100CMB nv De Gerlachekaai 20, 2000 Antwerpen 1 BE F 100Euronav nv De Gerlachekaai 20, 2000 Antwerpen 1 BE F 100Euronav Luxembourg (Group) 20, rue de Hollerich, 1740 Luxembourg LU F 100
F Full consolidation% Controlling interest
This list is limited to the most important enterprises in the consolidation scope. The full list will be deposited and can be obtained at theregistered offices of the consolidating enterprise.
III. SUBSIDIARIES NOT FULLY CONSOLIDATED AND JOINT SUBSIDIARIES NOT PROPORTIONALLY CONSOLIDATED(IN APPLICATION OF ARTICLE 107), AND ENTERPRISES NOT ACCOUNTED FOR USING THE EQUITY METHOD(IN APPLICATION OF ARTICLE 157)
The full list will be deposited and can be obtained at the registered offices of the consolidating enterprise.
IV. ENTERPRISES OTHER THAN THOSE REFERRED TO IN I AND II, IN WHICH THE ENTERPRISES INCLUDED IN THECONSOLIDATION AND THOSE EXCLUDED FROM THE CONSOLIDATION, PURSUANT TO ARTICLES 107 AND 108,HOLD AT LEAST 10% OF THE CAPITAL
Annual Equity Net resultName Registered offices VAT number % accounts Currency in 000 in 000
Clarkson PLC 12 Camomille street, London EC3A 7BP - GB GB 245 9035 56 16 31.12.2002 GBP 16,983 2,772
V. CONSOLIDATION CRITERIA
All affiliated enterprises and enterprises linked by participating interests are consolidated. The result of the subsidiaries are included as fromthe date of acquisition up to the date of disposal.
Fu l l c o n s o l i d a t i o nEnterprises in which the Group owns more than 50% of the share capital or exercises a de facto control, are fully consolidated.
The assets and liabilities of these enterprises are incorporated in full in the consolidated balance sheet in substitution of the book value of thecorresponding investments. This method reveals consolidation differences and identifies the share of minority interests.
The expenses and revenues of these enterprises are added to those of CMB. The consolidated results for the financial year are allocatedbetween Group and minority interests.
P r opo r t i o na l c o n s o l i d a t i o nJointly managed companies are proportionally consolidated.
The assets, liabilities, income and charges of these joint subsidiaries are incorporated in the consolidated accounts in proportion to the rightsheld by the Group, in substitution of the book value of the corresponding investments.
This method reveals consolidation differences.
The equ i t y me t hodThe enterprises in which the Group holds 20 up to 50% of the share capital are included on an equity basis. Financial institutions whose activities donot directly relate to the Group’s activities, are included using the equity method, even when the Group holds more than a 50% participating interest.
accounting policy notes

39
In the consolidated balance sheet, the book value of these enterprises is substituted by the Group’s share in their shareholders’ equity. Likewise,the income statement records the Group’s share in the results of the financial year in substitution of the dividends received during the year.
Exemp t i o n sSubsidiaries are not included in the consolidated accounts if it is not possible to obtain the information necessary for their inclusion withoutdisproportionate expense or undue delay (Art. 107,3° of the Royal Decree of January 30, 2001).
VI. VALUATION RULES
The valuation rules for consolidation are the valuation rules of the consolidating company, completed with some specific rules, appropriatefor consolidation purposes.In case of important differences, adjustments are always made for fully or proportionally consolidated enterprises.For enterprises accounted for using the equity method, important adjustments are only made in as far as the necessary data is available.
VALUATION RULES FOR THE DIFFERENT HEADINGS OF THE CONSOLIDATED ACCOUNTS
A . I . F o rma t i o n e xpen s e sFormation expenses are charged to expense during the year in which they are incurred.
A . I I . I n t a n g i b l e a s s e t sThe intangible assets are recorded at acquisition cost and amortised at a minimum rate of 20% a year. Goodwill is amortised according tothe rules defined by the Board of Directors, case per case, with a maximum period of 20 years.
A . I I I . P o s i t i v e c on s o l i d a t i o n d i f f e r e n c e sA consolidation difference is revealed by comparing the book value of the investment with the Group’s share in the shareholders’ equity ofthe company concerned, taking into account the proportion of the results of the current year until the date of acquisition. All consolidatingdifferences are, as far as possible, booked to the assets and liabilities item concerned. Any important positive balance is booked under theheading ‘Consolidation differences’ and is amortised according to the rules defined by the Board of Directors, case per case, with a maximumperiod of 20 years. Any important negative balance is treated as such (cf. L.V. Negative consolidation differences). In the remaining cases thebalance is taken into the results.
A . I V . Tang i b l e a s s e t sBecause of their importance, a separate heading is used for vessels. Tangible assets are recorded at acquisition cost, supplementary expensesincluded. The interim interests relating to major investments are recorded under this heading and are depreciated as from the date ofcommissioning of the assets concerned.
Vessels are depreciated on a straight line basis, based on a maximum expected economic life in the Group without taking into account anyresidual value:
bulk vessels: maximum expected economic life of 20 yearstankers: maximum expected economic life of 20 yearsgas vessels: maximum expected economic life of 30 yearscontainer vessels: maximum expected economic life of 25 years
Furthermore, the board of directors can decide to record an additional irreversible depreciation on ‘surplus prices’ paid for assets as aconsequence of extreme circumstances. In which case, the decision of the board of directors will be explained in a note to the consolidated accounts.The other tangible assets are depreciated on a straight line basis, based on rules fixed in relation to the expected economic life of theseassets in the Group, without taking into account any residual value, namely yearly:
Buildings . . . . . . . . . . . . . . . . . 3% Cars and trucks . . . . . . . . . . . . . . . . . . . . .20%Leasing . . . . . . . . . . . . . . . . . . 4% Tractors . . . . . . . . . . . . . . . . . . . . . . . . . . 17%Warehouses . . . . . . . . . . . . . . . 5% Data processing material . . . . . . . . . . . . 33%Machinery and equipment . . . . . . . 20% Quay and gantry cranes . . . . . . . . . . . 6.67%Furniture . . . . . . . . . . . . . . . . 10% Straddle carriers . . . . . . . . . . . . . . . . . 12.50%
A .V . F i n an c i a l a s s e t sShares are valued at their acquisition cost. The additional expenses relating to their acquisition are not recorded as an asset but are recordedunder the heading ‘Other financial charges’ in the financial year during which they occur.Depreciation is applied when the estimated value of the shares is lower than the book value and if the thus determined loss has a permanentcharacter. The estimated value of each share is determined at the end of each financial year by means of a single criterion or several criteria.For investments quoted on the stock exchange, the quotation is taken into account. For investments not quoted on the stock exchange thelatest balance sheet is taken into consideration, unless more significant data are available.
A .V I . Amoun t s r e c e i v ab l e a f t e r o n e y ea rThe amounts receivable are stated in the balance sheet at their nominal value. Reductions in value are recorded when receipt on the duedate of all or part is uncertain.
A .V I I . S t o c k s and c on t r a c t s i n p r o g r e s sThe raw and auxiliary materials are valued by the method of the weighed average prices.

40
A .V I I I . Amoun t s r e c e i v ab l e w i t h i n o n e y ea rThe amounts receivable are stated in the balance sheet at their nominal value. Reductions in value are recorded when receipt on the duedate of all or part is uncertain.
A . IX . I n v e s tmen t s a ndA .X . Ca sh a t b ank and i n h andThe investments are valued at acquisition cost and the cash at bank and in hand at nominal value. The additional costs, relating to theiracquisition are not recorded as an asset but are recorded under the heading ‘Other financial charges’ in the financial year during which theyare incurred. The investments and the cash at bank and in hand are written down if the realisable value is lower than their book value.For investments quoted on the stock exchange, the quotation is taken into account. For investments not quoted on the stock exchange thelatest balance sheet is taken into consideration, unless more significant data are available.
L . I . Cap i t a l ,L . I I . S ha r e p r em i um a c c oun t a ndL . I V . R e s e r v e sThey are recorded in the balance sheet at nominal value.
L . V . Nega t i v e c on s o l i d a t i o n d i f f e r e n c e sA consolidation difference is revealed by comparing the book value of the participating interest with the Group’s share in the shareholders’equity of the company concerned, taking into account the proportion of the results of the current year until the date of acquisition. Possibleallocations are made to the provisions for liabilities and charges, when significant losses are to be expected in the near future for the companyconcerned. The remaining balance can be entered under the heading ‘Capital and reserves’.
L . V I . T r an s l a t i o n d i f f e r e n c e scf. Conversion of foreign currency
L . IX . P r o v i s i o n s f o r l i a b i l i t i e s a nd c ha r g e sProvisions are made systematically for periodical vessel surveys, costs of dry-docking, settlement of claims, pending claims and otheroperating risks. Legal retirement obligations are booked following local legislation.
L .X . Amoun t s pa yab l e a f t e r o n e y ea r a ndL .X I . Amoun t s pa yab l e w i t h i n o n e y ea rThese are recorded in the balance sheet at nominal value.
R . I& I I Ope r a t i n g r e s u l tAt the end of the financial year, income and charges relating to non-terminated voyages - for vessels operated directly by the enterprise -are recorded in the income statement on a pro rata basis. If deemed necessary, a provision is made for future losses relating to non-terminated voyages. This provision is calculated per division. Profit or loss resulting from the sale of vessels and containers is recorded underthe heading ‘Other operating income or charges’. The entitlements assigned to the directors or other claimants, booked in the appropriationaccount, are charged during the year.
CONVERS ION OF FORE IGN CURRENCY
Fo rma t i o n e xpen s e s , f i x e d a s s e t s a nd s t o c k sThe assets are booked at their value in Euro at standard rate* except when foreign currencies were bought in cash or on credit, in whichcase the rate actually paid is applied.
Amoun t s r e c e i v ab l e a nd s t o c k sIncoming invoices are booked at the standard rate of the date of receipt. The effected payments are booked at the same rate, except whenforeign currencies were bought in cash, in which case the rate actually paid is applied. The outgoing invoices are booked at standard rate ofthe day of issue. Possible differences in price on receipt of payment are booked in turnover.
C l o s i n g o f t h e f i n an c i a l y e a rFormation expenses, fixed assets (amounts receivable excluded), stocks as well as debts in foreign currencies initiated for the acquisition ofvessels in foreign currency, are expressed at the rate of exchange of the day of recording (historic rate). The other amounts receivable andthe liabilities in foreign currency are valued at the closing rate**. If the difference in the rate of exchange is a loss, it is transferred to theincome statement. If it is a profit, it is entered under the heading ‘Accrued charges and deferred income’.
Annua l a c c oun t s i n f o r e i g n c u r r e n c yThe annual accounts expressed in foreign currency are converted into Euro, using the closing rate for the balance sheet and the average rate*** for the income statement. Shareholders’ equity is expressed at its historical value. The difference brought out in relation to the closingrate is entered under the heading ‘Translation differences’ in the Group equity. The exchange difference between the closing rate and theaverage rate on the results is also entered under this heading.
* The standard rate is determined at the beginning of each month and remains valid for the entire month, provided no important fluctuations occur. The rate is based on the rate for the last working day of the preceding month.
** The closing rate is the exchange rate on the last working day of the year. *** The average rate is the average of the exchange rates on the last working day of each month of the financial year.

F i n an c i a l i n s t r umen t s ( d e r i v a t i v e s )Premiums received or paid are taken up in the income statement under the heading ‘Operating results’ upon closing of the contracts. At theend of the financial year, all on-going financial operations are individually evaluated, after which, if necessary, provisions for liabilities andcharges will be made. Those operations which have not been finalised at year-end are detailed under the heading XV of the AccountingPolicy Notes ‘Rights and commitments not reflected in the balance sheet’.
VII. STATEMENT OF INTANGIBLE ASSETS(Heading II. of assets) ( i n m i l l i o n s o f EUR )
a) Acquisition costAt the end of the preceding year . . . . . . . . . . . . . . . . . . .Movements during the year:– Partial demerger . . . . . . . . . . . . . . . . . . . . . . . . . . .– Changes in the consolidation scope . . . . . . . . . . . . . . . .– Acquisitions including own construction . . . . . . . . . . . . . .– Transfers from one heading to another . . . . . . . . . . . . . .– Translation differences . . . . . . . . . . . . . . . . . . . . . . . .At the end of the financial year . . . . . . . . . . . . . . . . . . .
c) Depreciation and amounts written offAt the end of the preceding year . . . . . . . . . . . . . . . . . . .Movements during the year:– Partial demerger . . . . . . . . . . . . . . . . . . . . . . . . . . .– Changes in the consolidation scope . . . . . . . . . . . . . . . .– Recorded . . . . . . . . . . . . . . . . . . . . . . . . . . . . . . .– Transfers from one heading to another . . . . . . . . . . . . . .– Translation differences . . . . . . . . . . . . . . . . . . . . . . . .At the end of the financial year . . . . . . . . . . . . . . . . . . .
d) Net book value at the end of the financial year (a)-(c) . . . . . .
Goodwill
16
–16–––––
16
–16–––––
–
Otherintangible
assets
–
––––––
–
––––––
–
Research anddevelopment
expenses
–
–– – – ––
–
–– – – ––
–
Concessions,patents,
licences etc.
–
––––––
–
––––––
–
a) Acquisition costAt the end of the preceding year . . . . . . . . .Movements during the year:– Partial demerger . . . . . . . . . . . . . . . . .– Changes in the consolidation scope . . . . . .– Acquisitions, including own construction . . .– Sales . . . . . . . . . . . . . . . . . . . . . . .– Cancellations . . . . . . . . . . . . . . . . . .– Transfers from one heading to another . . . .– Changes in consolidation method . . . . . . .– Translation differences . . . . . . . . . . . . .At the end of the financial year . . . . . . . . .
c) Depreciation and amounts written offAt the end of the preceding year . . . . . . . . .Movements during the year:– Partial demerger . . . . . . . . . . . . . . . . .– Changes in the consolidation scope . . . . . .– Recorded . . . . . . . . . . . . . . . . . . . .– Sales . . . . . . . . . . . . . . . . . . . . . . .– Cancellations . . . . . . . . . . . . . . . . . .– Transfers from one heading to another . . . .– Changes in consolidation method . . . . . . .– Translation differences . . . . . . . . . . . . .At the end of the financial year . . . . . . . . .
d) Net book value at the end of the financialyear (a)-(c) . . . . . . . . . . . . . . . . . . . .
Assetsunder
constructionand advance
payments
236
–219–
65––
–17–
–857
–
–––––––––
57
Othertangible
assets
1
––––––––1
–
–––––––––
1
Leasingand other
similarrights
7
–2–1–
–3––––1
2
–––
–1––––1
–
Furnitureand
equipment
28
–3–1––––
–1–221
11
–2–12–––
–1–18
13
Plant,machinery
andequipment
10
––––––––
10
5
––1–––––6
4
Landand
buildings
87
–6–3–––
–9–
75
23
–4–3–––
–1–
21
54
Vessels
1,953
–8873574
–382–
17–
–151659
584
–3582
42–133
–––
–28109
550
41
VIII. STATEMENT OF TANGIBLE FIXED ASSETS(Heading IV. of assets) ( i n m i l l i o n s o f EUR )

At the end of 2003, the consolidated fleet consisted of 18 owned vessels, compared to 48 at the end of 2002. A totalof 8 vessels were sold, 1 newbuilding was delivered and 2 vessels were acquired. Within the framework of the partialdemerger of CMB, 22 gas vessels were deconsolidated and 1 FPSO was included in the consolidation scope.Following the restructuring of some of the joint ventures of Euronav, 4 tankers were deconsolidated and theparticipating interest in 2 tankers increased to 100%.
The most important movements during the financial year are:
Net value on December 31, 2002 . . . . . . . . . .Partial demerger . . . . . . . . . . . . . . . . . . . .Change in the consolidation scope . . . . . . . . .Acquisitions . . . . . . . . . . . . . . . . . . . . . .Delivery of vessels under construction . . . . . . .Depreciation . . . . . . . . . . . . . . . . . . . . . .Sales and cancellations . . . . . . . . . . . . . . . .Translation differences . . . . . . . . . . . . . . . .
Net value on December 31, 2003 . . . . . . . . . .
Gas
537–529
–––
–––8–
–
Total
1,369–529
337417
–42–249–123
550
Tankers
650–
–17––
–27–187–85
334
Dry bulk
182––
7417
–13–54–34
172
FPSO
––
50––
–2–
–4
44
1. Participating interestsa) Acquisition cost
At the end of the preceding year . . . . . . . . . . . . . . . . . . . . . . . . . . . . . . . . . .Movements during the year:– Partial demerger . . . . . . . . . . . . . . . . . . . . . . . . . . . . . . . . . . . . . . . . . .– Change in the consolidation scope . . . . . . . . . . . . . . . . . . . . . . . . . . . . . . . .– Dividends . . . . . . . . . . . . . . . . . . . . . . . . . . . . . . . . . . . . . . . . . . . . . .– Result for the year . . . . . . . . . . . . . . . . . . . . . . . . . . . . . . . . . . . . . . . . .– Increase (+), decrease (-) of capital . . . . . . . . . . . . . . . . . . . . . . . . . . . . . . .– Acquisitions . . . . . . . . . . . . . . . . . . . . . . . . . . . . . . . . . . . . . . . . . . . . .– Sales . . . . . . . . . . . . . . . . . . . . . . . . . . . . . . . . . . . . . . . . . . . . . . . . .– Transfers from one heading to another . . . . . . . . . . . . . . . . . . . . . . . . . . . . .– Transfers from the heading IX.B. Other investments and deposits . . . . . . . . . . . . . .– Change in consolidation method . . . . . . . . . . . . . . . . . . . . . . . . . . . . . . . . .– Translation differences . . . . . . . . . . . . . . . . . . . . . . . . . . . . . . . . . . . . . . .At the end of the financial year . . . . . . . . . . . . . . . . . . . . . . . . . . . . . . . . .
Enterprisesconsolidated
on equity basis
65
––––––
–65–––––
Otherenterprises
10
–1–––2–––7–
–117
IX. STATEMENT OF FINANCIAL FIXED ASSETS(Heading V. of assets) ( i n m i l l i o n s o f EUR )
The assets under construction can be summarised as follows:Four capesize vessels in China . . . . . . . . . . . . . . . . . . . . . . . . . . . . . . . . . . . .Four panamax vessels in China . . . . . . . . . . . . . . . . . . . . . . . . . . . . . . . . . . . .Two handymax vessels in joint venture in Japan . . . . . . . . . . . . . . . . . . . . . . . . . .Advance payments on one handymax and three capesize vessels to be delivered in 2004 . . .Two VLCCs in South Korea . . . . . . . . . . . . . . . . . . . . . . . . . . . . . . . . . . . . .Two panamax tankers in Japan . . . . . . . . . . . . . . . . . . . . . . . . . . . . . . . . . . . .Advance payment on one VLCC to be delivered in 2004 . . . . . . . . . . . . . . . . . . . . .
Total . . . . . . . . . . . . . . . . . . . . . . . . . . . . . . . . . . . . . . . . . . . . . . . . . .
1951
111434
57
Taking into account the ever tightening rules and regulations imposed by international vetting organisations (e.g. IMO) andclassification societies with respect to the operation of tankers, and VLCCs in particular, CMB’s board of directors decid-ed to reduce the depreciation period for tankers from 25 to 20 years. On a yearly basis and based on the current fleet,this will have an impact of USD 7 million on the 2003 result.
During the last months of 2003 - at the time the capesize markets rose to unseen heights - Bocimar purchased threecapesize vessels. These vessels were acquired for a price that includes a certain ‘surplus price’, which reflects the promptdelivery of the vessels, allowing them to take immediate advantage of the extreme high spot markets. The Board ofDirectors decided to depreciate this ‘surplus price’ – on top of the normal depreciation – over a period of two years pervessel. The total ‘surplus price’ paid amounts to USD 11.7 million and the pro-rata depreciation charge is as follows: USD0.3 million for 2003, USD 5.4 million for 2004, USD 5.6 million for 2005 and USD 0.4 million for 2006.
42

43
Hesse-Noord Natie group . . . . . . . . . . . . . . . . . . . . . . . . . . . . . . . . . .Capital losses realised on the sale of fixed assets . . . . . . . . . . . . . . . . . . . . .
Total . . . . . . . . . . . . . . . . . . . . . . . . . . . . . . . . . . . . . . . . . . . . . .
2. Amounts receivableNet book value at the end of the preceding year . . . . . . . . . . . . . . . . . . . . .Movements during the year:– Partial demerger . . . . . . . . . . . . . . . . . . . . . . . . . . . . . . . . . . . . . .– Change in the consolidation scope . . . . . . . . . . . . . . . . . . . . . . . . . . . .– Additions . . . . . . . . . . . . . . . . . . . . . . . . . . . . . . . . . . . . . . . . . .– Reimbursements . . . . . . . . . . . . . . . . . . . . . . . . . . . . . . . . . . . . . .– Amounts written off . . . . . . . . . . . . . . . . . . . . . . . . . . . . . . . . . . . .– Write back of amounts written off . . . . . . . . . . . . . . . . . . . . . . . . . . . .– Transfers from one heading to another . . . . . . . . . . . . . . . . . . . . . . . . .– Change in consolidation method . . . . . . . . . . . . . . . . . . . . . . . . . . . . .– Translation differences . . . . . . . . . . . . . . . . . . . . . . . . . . . . . . . . . . .Net book value at the end of the financial year . . . . . . . . . . . . . . . . . . . .Accumulated amounts written off on amounts receivable at the end of the financial year . .
2003
––
–
– – – – – – – – –––––
109
–47 –4012–2–1 – – 1
–824–
Hesse-Noord Natie group . . . . . . . . . . . . . . . . . . . . . . . . . . . . . . . . . .Other participating interests . . . . . . . . . . . . . . . . . . . . . . . . . . . . . . . . .
Total . . . . . . . . . . . . . . . . . . . . . . . . . . . . . . . . . . . . . . . . . . . . . .
The net book value of the enterprises accounted for using the equity method can be detailed as follows:2003
––
–
2002
65–
65
The contribution to the result of the enterprises accounted for using the equity method is as follows:
2002
1–
1
These amounts receivable represent the non-eliminated part of advances given to joint ventures in the dry bulk and tankersdivisions. A similar amount can be found under the heading "Amounts payable after one year - Other loans".
c) Amounts written offAt the end of the preceding year . . . . . . . . . . . . . . . . . . . . . . . . . . . . . . . . . .Movements during the year:– Partial demerger . . . . . . . . . . . . . . . . . . . . . . . . . . . . . . . . . . . . . . . . . .– Change in the consolidation scope . . . . . . . . . . . . . . . . . . . . . . . . . . . . . . . .– Recorded . . . . . . . . . . . . . . . . . . . . . . . . . . . . . . . . . . . . . . . . . . . . . .– Written back . . . . . . . . . . . . . . . . . . . . . . . . . . . . . . . . . . . . . . . . . . . .– Sales . . . . . . . . . . . . . . . . . . . . . . . . . . . . . . . . . . . . . . . . . . . . . . . . .– Transfers from one heading to another . . . . . . . . . . . . . . . . . . . . . . . . . . . . .– Change in consolidation method . . . . . . . . . . . . . . . . . . . . . . . . . . . . . . . . .– Translation differences . . . . . . . . . . . . . . . . . . . . . . . . . . . . . . . . . . . . . . .At the end of the financial year . . . . . . . . . . . . . . . . . . . . . . . . . . . . . . . . .
Net book value at the end of the financial year (a)-(c) . . . . . . . . . . . . . . . . . . . . . .
Enterprisesconsolidated
on equity basis
––––––––––––
Otherenterprises
7
–1–––––––6
11

XIII. PROVISIONS FOR LIABILITIES AND CHARGES(Heading IX. of liabilities) ( i n m i l l i o n s o f EUR )
2003 2002
Dry bulk . . . . . . . . . . . . . . . . . . . . . . . . . . . . . . . . . . . . . . . . . . . . . . 16 5Tankers . . . . . . . . . . . . . . . . . . . . . . . . . . . . . . . . . . . . . . . . . . . . . . 8 8Gas . . . . . . . . . . . . . . . . . . . . . . . . . . . . . . . . . . . . . . . . . . . . . . . . . – 19Holding . . . . . . . . . . . . . . . . . . . . . . . . . . . . . . . . . . . . . . . . . . . . . . 27 43
Total . . . . . . . . . . . . . . . . . . . . . . . . . . . . . . . . . . . . . . . . . . . . . . . . 51 75
44
Net book value at the end of the preceding year . . . . . . . . . . . . . . . . . . . . . .Movements during the year:– Increase in the percentage held . . . . . . . . . . . . . . . . . . . . . . . . . . . . . .– Decrease in the percentage held . . . . . . . . . . . . . . . . . . . . . . . . . . . . .– Transfer to the income statement . . . . . . . . . . . . . . . . . . . . . . . . . . . . .– Depreciation recorded . . . . . . . . . . . . . . . . . . . . . . . . . . . . . . . . . . .Net book value at the end of the financial year . . . . . . . . . . . . . . . . . . . . .
XII. STATEMENT OF CONSOLIDATION DIFFERENCES AND DIFFERENCES RESULTINGFROM THE APPLICATION OF THE EQUITY METHOD ( i n m i l l i o n s o f EUR )
Positiveconsolidation
difference
–
–––––
Negativeconsolidation
difference
–
–––––
Own shares
CMB . . . . . . . . . . . . . . . . . . . . . . . . . . . . . . . . . . . . . . . . . . . . . .Entarco . . . . . . . . . . . . . . . . . . . . . . . . . . . . . . . . . . . . . . . . . . . . .
Total . . . . . . . . . . . . . . . . . . . . . . . . . . . . . . . . . . . . . . . . . . . . . .
At the end of the preceding year . . . . . . . . . . . . . . . . . . . . . . . . . . . . . . . . . . . . . . . . . . . . . . . . .Movements during the year:– Partial demerger . . . . . . . . . . . . . . . . . . . . . . . . . . . . . . . . . . . . . . . . . . . . . . . . . . . . . . . . .– Group share in the result of the financial year . . . . . . . . . . . . . . . . . . . . . . . . . . . . . . . . . . . . . . . . .– Dividends . . . . . . . . . . . . . . . . . . . . . . . . . . . . . . . . . . . . . . . . . . . . . . . . . . . . . . . . . . . . .– Withdrawal of 250,000 own shares . . . . . . . . . . . . . . . . . . . . . . . . . . . . . . . . . . . . . . . . . . . . . .At the end of the financial year . . . . . . . . . . . . . . . . . . . . . . . . . . . . . . . . . . . . . . . . . . . . . . .
2003
5–
5
2002
210
12
418
–17061
–35–13261
X. INVESTMENTS(Heading IX. of assets) ( i n m i l l i o n s o f EUR )
XI. STATEMENT OF THE RESERVES(Heading IV. of liabilities) ( i n m i l l i o n s o f EUR )

45
XIV. STATEMENT OF AMOUNTS PAYABLE ( i n m i l l i o n s o f EUR )
A. Analysis of liabilities, originally payable after one year, according to their residual term
Financial liabilities2. Unsubordinated debentures . . . . . . . . . . . . . . . . . . . . .3. Leasing and other similar obligations . . . . . . . . . . . . . . . .4. Credit institutions . . . . . . . . . . . . . . . . . . . . . . . . . . .5. Other loans . . . . . . . . . . . . . . . . . . . . . . . . . . . . . .Trade debts1. Suppliers . . . . . . . . . . . . . . . . . . . . . . . . . . . . . . . .
Total . . . . . . . . . . . . . . . . . . . . . . . . . . . . . . . . .
Dry bulk . . . . . . . . . . . . . . . . . . . . . . . . . . . . . . . . .Tankers . . . . . . . . . . . . . . . . . . . . . . . . . . . . . . . . . .Holding . . . . . . . . . . . . . . . . . . . . . . . . . . . . . . . . . .Intercompany accounts . . . . . . . . . . . . . . . . . . . . . . . . .
Total . . . . . . . . . . . . . . . . . . . . . . . . . . . . . . . . . . .
Between 1and
5 years
––
1727
–
179
Not morethan
1 year
––
523
–
55
Over5 years
––
13928
–
167
Leasingdebts
––––
–
Creditinstitutions
10716143–
311
Otherloans
5282–
35
307
307
B. Secured liabilitiesReal guarantees given on the assets of the enterpriseFinancial liabilities4. Credit institutions . . . . . . . . . . . . . . . . . . . . . . . . . . . . . . . . . . . . . . . . . . . . . . . . . . . . . . . . . .
Total . . . . . . . . . . . . . . . . . . . . . . . . . . . . . . . . . . . . . . . . . . . . . . . . . . . . . . . . . . . . . .
The changes in comparison to the previous financial year are explained as follows:
On December 31, 2002 . . . . . . . . . . . . . . . . . . . . . . . .Partial demerger . . . . . . . . . . . . . . . . . . . . . . . . . . . . .Change in the consolidation scope . . . . . . . . . . . . . . . . . .Transfers to the heading:‘Current portion of amounts payable after one year’ . . . . . . . .Early repayments . . . . . . . . . . . . . . . . . . . . . . . . . . . .New loans . . . . . . . . . . . . . . . . . . . . . . . . . . . . . . . .Refinancing . . . . . . . . . . . . . . . . . . . . . . . . . . . . . . . .Change of consolidation method . . . . . . . . . . . . . . . . . . .Translation differences . . . . . . . . . . . . . . . . . . . . . . . . .
On December 31, 2003 . . . . . . . . . . . . . . . . . . . . . . . .
The "early repayments" relate mainly to the repayment of working capital loans (EUR 5 million), the sale of three bulk vessels(EUR 25 million), four tankers (EUR 125 million) and 40% in a gas vessel (EUR 3 million).
The new loans with credit institutions relate to the financing of: three bulk vessels (EUR 70 million) of which one in jointventure. The new loans under the heading other loans represent the non-eliminated part of advances granted to jointventure companies in the course of the year 2003 (EUR 12 million) (cfr. Financial Assets - amounts receivable).
Refinancing concerns one bulk vessel, two tankers and an office building.
The changes in the consolidation scope concern the entry into the consolidation of the FPSO joint venture (EUR +35 millionwith credit institutions) and the deconsolidation of a number of joint ventures of Euronav (EUR -84 million).
Leasingdebts
66–57
–
––8–––
–1
–
Creditinstitutions
859–329–11
–64–151
7011–9
–65
311
Otherloans
110–45–38
–3–41212–
–9
35

46
A. Operating results
Net turnover2003 2002
Dry bulk . . . . . . . . . . . . . . . . . . . . . . . . . . . . . . . . . . . . . . . . . . . . . . . . . . 281 196Tankers . . . . . . . . . . . . . . . . . . . . . . . . . . . . . . . . . . . . . . . . . . . . . . . . . . . 135 95Gas . . . . . . . . . . . . . . . . . . . . . . . . . . . . . . . . . . . . . . . . . . . . . . . . . . . . . – 327Insurance . . . . . . . . . . . . . . . . . . . . . . . . . . . . . . . . . . . . . . . . . . . . . . . . . . – 58Holding . . . . . . . . . . . . . . . . . . . . . . . . . . . . . . . . . . . . . . . . . . . . . . . . . . . 40 136Intercompany accounts . . . . . . . . . . . . . . . . . . . . . . . . . . . . . . . . . . . . . . . . . . –1 –6
Total . . . . . . . . . . . . . . . . . . . . . . . . . . . . . . . . . . . . . . . . . . . . . . . . . . . . 455 806
Other operating income On the sale of vessels the following capital gains were realised:
2003 2002
Dry bulk vessels . . . . . . . . . . . . . . . . . . . . . . . . . . . . . . . . . . . . . . . . . . . . . . – –Tankers . . . . . . . . . . . . . . . . . . . . . . . . . . . . . . . . . . . . . . . . . . . . . . . . . . . 8 4Gas vessels . . . . . . . . . . . . . . . . . . . . . . . . . . . . . . . . . . . . . . . . . . . . . . . . . – 11
Total . . . . . . . . . . . . . . . . . . . . . . . . . . . . . . . . . . . . . . . . . . . . . . . . . . . . 8 15
Services and other goods2003 2002
Dry bulk . . . . . . . . . . . . . . . . . . . . . . . . . . . . . . . . . . . . . . . . . . . . . . . . . . . 230 200Tankers . . . . . . . . . . . . . . . . . . . . . . . . . . . . . . . . . . . . . . . . . . . . . . . . . . . 52 54Gas . . . . . . . . . . . . . . . . . . . . . . . . . . . . . . . . . . . . . . . . . . . . . . . . . . . . . – 298Insurance . . . . . . . . . . . . . . . . . . . . . . . . . . . . . . . . . . . . . . . . . . . . . . . . . . – 47Holding . . . . . . . . . . . . . . . . . . . . . . . . . . . . . . . . . . . . . . . . . . . . . . . . . . . 23 104Intercompany accounts . . . . . . . . . . . . . . . . . . . . . . . . . . . . . . . . . . . . . . . . . . –1 –7
Total . . . . . . . . . . . . . . . . . . . . . . . . . . . . . . . . . . . . . . . . . . . . . . . . . . . . . 304 696
Other operating chargesOn the sale of vessels the following capital losses were realised:
2003 2002
Dry bulk vessels . . . . . . . . . . . . . . . . . . . . . . . . . . . . . . . . . . . . . . . . . . . . . . – 9Tankers . . . . . . . . . . . . . . . . . . . . . . . . . . . . . . . . . . . . . . . . . . . . . . . . . . . – –Gas vessels . . . . . . . . . . . . . . . . . . . . . . . . . . . . . . . . . . . . . . . . . . . . . . . . . 4 2
Total . . . . . . . . . . . . . . . . . . . . . . . . . . . . . . . . . . . . . . . . . . . . . . . . . . . . 4 11
B. Personnel
1. The average number of persons employed by the fully consolidated enterprises (of which in Belgium: 320) . . . . . . . . . 350Workers . . . . . . . . . . . . . . . . . . . . . . . . . . . . . . . . . . . . . . . . . . . . . . . . . . . . . . . . 146Employees . . . . . . . . . . . . . . . . . . . . . . . . . . . . . . . . . . . . . . . . . . . . . . . . . . . . . . . 140Executives . . . . . . . . . . . . . . . . . . . . . . . . . . . . . . . . . . . . . . . . . . . . . . . . . . . . . . . . 57Management staff . . . . . . . . . . . . . . . . . . . . . . . . . . . . . . . . . . . . . . . . . . . . . . . . . . . 7Personnel charges for the fully consolidated enterprises . . . . . . . . . . . . . . . . . . . . . . . . . . . . . . . . . 18Remuneration and social security . . . . . . . . . . . . . . . . . . . . . . . . . . . . . . . . . . . . . . . . . . . 17Pension charges . . . . . . . . . . . . . . . . . . . . . . . . . . . . . . . . . . . . . . . . . . . . . . . . . . . . 1
2. The average number of persons employed by the proportionally consolidated enterprises . . . . . . . . . . . . . . 1(of which in Belgium: 1)Workers . . . . . . . . . . . . . . . . . . . . . . . . . . . . . . . . . . . . . . . . . . . . . . . . . . . . . . . . –Employees . . . . . . . . . . . . . . . . . . . . . . . . . . . . . . . . . . . . . . . . . . . . . . . . . . . . . . . 1Executives . . . . . . . . . . . . . . . . . . . . . . . . . . . . . . . . . . . . . . . . . . . . . . . . . . . . . . . . –Management staff . . . . . . . . . . . . . . . . . . . . . . . . . . . . . . . . . . . . . . . . . . . . . . . . . . . –Personnel charges for the proportionally consolidated enterprises . . . . . . . . . . . . . . . . . . . . . . . . . . . –Remuneration and social security . . . . . . . . . . . . . . . . . . . . . . . . . . . . . . . . . . . . . . . . . . . –Pension charges . . . . . . . . . . . . . . . . . . . . . . . . . . . . . . . . . . . . . . . . . . . . . . . . . . . . –
XV. INCOME STATEMENT ( i n m i l l i o n s o f EUR )

47
C. Financial results
Financial income2003 2002
Dry bulk . . . . . . . . . . . . . . . . . . . . . . . . . . . . . . . . . . . . . . . . . . . . . . . . . . . 2 8Tankers . . . . . . . . . . . . . . . . . . . . . . . . . . . . . . . . . . . . . . . . . . . . . . . . . . . 10 5Gas . . . . . . . . . . . . . . . . . . . . . . . . . . . . . . . . . . . . . . . . . . . . . . . . . . . . . – 17Insurance . . . . . . . . . . . . . . . . . . . . . . . . . . . . . . . . . . . . . . . . . . . . . . . . . . – 12Holding . . . . . . . . . . . . . . . . . . . . . . . . . . . . . . . . . . . . . . . . . . . . . . . . . . . 19 17Intercompany accounts . . . . . . . . . . . . . . . . . . . . . . . . . . . . . . . . . . . . . . . . . . –3 –9
Total . . . . . . . . . . . . . . . . . . . . . . . . . . . . . . . . . . . . . . . . . . . . . . . . . . . . . 28 50
Positive exchange differences amounting to EUR 19 million were recorded under the heading 'Other financial income'(EUR 25 million in 2002).
Debt charges2003 2002
Dry bulk . . . . . . . . . . . . . . . . . . . . . . . . . . . . . . . . . . . . . . . . . . . . . . . . . . . 5 11Tankers . . . . . . . . . . . . . . . . . . . . . . . . . . . . . . . . . . . . . . . . . . . . . . . . . . . 12 19Gas . . . . . . . . . . . . . . . . . . . . . . . . . . . . . . . . . . . . . . . . . . . . . . . . . . . . . – 38Insurance . . . . . . . . . . . . . . . . . . . . . . . . . . . . . . . . . . . . . . . . . . . . . . . . . . – –Holding . . . . . . . . . . . . . . . . . . . . . . . . . . . . . . . . . . . . . . . . . . . . . . . . . . . 7 16Intercompany accounts . . . . . . . . . . . . . . . . . . . . . . . . . . . . . . . . . . . . . . . . . . –3 –8
Total . . . . . . . . . . . . . . . . . . . . . . . . . . . . . . . . . . . . . . . . . . . . . . . . . . . . . 21 76
Negative exchange differences amounting to EUR 4 million were recorded under the heading ‘Other financial charges’(EUR 14 million in 2002).
D. Extraordinary results
Extraordinary income (Heading VII. of the income statement) . . . . . . . . . . . . . . . . . . . . . . . . . . . . . . 64- capital gain on the sale of the remaining 20% of the participating interest in Hesse-Noord Natie . . . . . . . . . . . . . 58- capital gain on the sale of the participating interest in Belgibo . . . . . . . . . . . . . . . . . . . . . . . . . . . . . . . . . 3- capital gain on the sale of 50% of the participating interest in Reslea . . . . . . . . . . . . . . . . . . . . . . . . . . . . . 2- capital gain on the sale of other financial and other tangible assets. . . . . . . . . . . . . . . . . . . . . . . . . . . . . . . 1
Extraordinary charges (Heading VIII. of the income statement) . . . . . . . . . . . . . . . . . . . . . . . . . . . . . 6- write-off on various financial assets . . . . . . . . . . . . . . . . . . . . . . . . . . . . . . . . . . . . . . . . . . . . . . . . 1- capital loss on the sale of the participating interests in 4 joint ventures of Euronav . . . . . . . . . . . . . . . . . . . . 5
E. Consolidated results Consolidated Share of the Minorityresult Group interests
Dry bulk . . . . . . . . . . . . . . . . . . . . . . . . . . . . . . . . . . . . . . . . . . . . –60 –60 –Tankers . . . . . . . . . . . . . . . . . . . . . . . . . . . . . . . . . . . . . . . . . . . . . 54 54 –Holding . . . . . . . . . . . . . . . . . . . . . . . . . . . . . . . . . . . . . . . . . . . . . 67 67 –
Total . . . . . . . . . . . . . . . . . . . . . . . . . . . . . . . . . . . . . . . . . . . . . . 61 61 –
F. Cash flow2003 2002
Dry bulk . . . . . . . . . . . . . . . . . . . . . . . . . . . . . . . . . . . . . . . . . . . . . . . . . . . –32 –18Tankers . . . . . . . . . . . . . . . . . . . . . . . . . . . . . . . . . . . . . . . . . . . . . . . . . . . 88 35Gas . . . . . . . . . . . . . . . . . . . . . . . . . . . . . . . . . . . . . . . . . . . . . . . . . . . . . – –3Insurance . . . . . . . . . . . . . . . . . . . . . . . . . . . . . . . . . . . . . . . . . . . . . . . . . . – 63Holding . . . . . . . . . . . . . . . . . . . . . . . . . . . . . . . . . . . . . . . . . . . . . . . . . . . 77 122
Total . . . . . . . . . . . . . . . . . . . . . . . . . . . . . . . . . . . . . . . . . . . . . . . . . . . . . 133 199
The definition of cash flow was adopted from the National Bank of Belgium.

48
A. 1. Personal guarantees, given or irrevocably promised by the enterprises included in the consolidation as a security forthird parties’ debts or commitmentsof which:– maximum amount for which other commitments of third parties are guaranteed by the enterprise . . . . . . . . . . .
2. Real guarantees, given or irrevocably promised by the enterprises included in the consolidation on their own assets,as a security of debts and commitments1. of enterprises included in the consolidation
Mortgages:– Book value of immovable properties mortgaged . . . . . . . . . . . . . . . . . . . . . . . . . . . . . . . . . . . . . . .– Amount of the registration . . . . . . . . . . . . . . . . . . . . . . . . . . . . . . . . . . . . . . . . . . . . . . . . . . .
These amounts represent the original mortgage registered and should be read in conjunction with the amounts asmentioned in Note XIV.
Pledges of businesses:– Amount of the registration . . . . . . . . . . . . . . . . . . . . . . . . . . . . . . . . . . . . . . . . . . . . . . . . . . .Pledges of other assets:– Book value of assets so pledged . . . . . . . . . . . . . . . . . . . . . . . . . . . . . . . . . . . . . . . . . . . . . . . .
4.a. Important commitments to acquire fixed assets . . . . . . . . . . . . . . . . . . . . . . . . . . . . . . . . . . . . .– Dry bulk . . . . . . . . . . . . . . . . . . . . . . . . . . . . . . . . . . . . . . . . . . . . . . . . . . . . . . . .– Tankers . . . . . . . . . . . . . . . . . . . . . . . . . . . . . . . . . . . . . . . . . . . . . . . . . . . . . . . . .– Holding . . . . . . . . . . . . . . . . . . . . . . . . . . . . . . . . . . . . . . . . . . . . . . . . . . . . . . . . .
4.b. Important commitments to dispose of fixed assets . . . . . . . . . . . . . . . . . . . . . . . . . . . . . . . . . . .– Dry bulk . . . . . . . . . . . . . . . . . . . . . . . . . . . . . . . . . . . . . . . . . . . . . . . . . . . . . . . .– Tankers . . . . . . . . . . . . . . . . . . . . . . . . . . . . . . . . . . . . . . . . . . . . . . . . . . . . . . . . .– Holding . . . . . . . . . . . . . . . . . . . . . . . . . . . . . . . . . . . . . . . . . . . . . . . . . . . . . . . . .
5.a. Rights relating to transactions– on interest rates (IRS - Interest Rate Swaps) . . . . . . . . . . . . . . . . . . . . . . . . . . . . . . . . . . . . . . . . .– on currencies . . . . . . . . . . . . . . . . . . . . . . . . . . . . . . . . . . . . . . . . . . . . . . . . . . . . . . . . . . .– currencies bought . . . . . . . . . . . . . . . . . . . . . . . . . . . . . . . . . . . . . . . . . . . . . . . . . . . . . . . .– floors, caps and puts (bought) . . . . . . . . . . . . . . . . . . . . . . . . . . . . . . . . . . . . . . . . . . . . . . . . .– bunkerswaps . . . . . . . . . . . . . . . . . . . . . . . . . . . . . . . . . . . . . . . . . . . . . . . . . . . . . . . . . . .– forward freight agreements . . . . . . . . . . . . . . . . . . . . . . . . . . . . . . . . . . . . . . . . . . . . . . . . . . .
5.b. Commitments relating to transactions– on interest rates (IRS - Interest Rate Swaps) . . . . . . . . . . . . . . . . . . . . . . . . . . . . . . . . . . . . . . . . .– on currencies . . . . . . . . . . . . . . . . . . . . . . . . . . . . . . . . . . . . . . . . . . . . . . . . . . . . . . . . . . .– currencies sold . . . . . . . . . . . . . . . . . . . . . . . . . . . . . . . . . . . . . . . . . . . . . . . . . . . . . . . . . .– floors, caps and calls (sold) . . . . . . . . . . . . . . . . . . . . . . . . . . . . . . . . . . . . . . . . . . . . . . . . . . .– bunkerswaps . . . . . . . . . . . . . . . . . . . . . . . . . . . . . . . . . . . . . . . . . . . . . . . . . . . . . . . . . . .– forward freight agreements . . . . . . . . . . . . . . . . . . . . . . . . . . . . . . . . . . . . . . . . . . . . . . . . . . .
B. Technical guarantees in respect of sales or services already provided– Bank guarantees . . . . . . . . . . . . . . . . . . . . . . . . . . . . . . . . . . . . . . . . . . . . . . . . . . . . . . . . . . . .– Guarantees given by third parties . . . . . . . . . . . . . . . . . . . . . . . . . . . . . . . . . . . . . . . . . . . . . . . . . .– Guarantees given to third parties . . . . . . . . . . . . . . . . . . . . . . . . . . . . . . . . . . . . . . . . . . . . . . . . . . .
C. Significant litigations and other rights and commitments– Time charter rights (till 2007) . . . . . . . . . . . . . . . . . . . . . . . . . . . . . . . . . . . . . . . . . . . . . . . . . . . . .– Time charter commitments (till 2010) . . . . . . . . . . . . . . . . . . . . . . . . . . . . . . . . . . . . . . . . . . . . . . . .– Leasing rights (till 2015) . . . . . . . . . . . . . . . . . . . . . . . . . . . . . . . . . . . . . . . . . . . . . . . . . . . . . . . .– Leasing commitments (till 2004) . . . . . . . . . . . . . . . . . . . . . . . . . . . . . . . . . . . . . . . . . . . . . . . . . . .– Balance sheet guarantees following the sale of the participating interest in Hesse-Noord Natie . . . . . . . . . . . . . . .– Balance sheet guarantees following the sale of the participating interest in Naviga . . . . . . . . . . . . . . . . . . . . . . .– Price increase mechanism agreed with SMAP following the sale of the participating interest in Naviga
based on the evolution of the Eurostoxx . . . . . . . . . . . . . . . . . . . . . . . . . . . . . . . . . . . . . . . . . . . . . .
D. Retirement and survivors’ pensions in favour of personnel or executives, at the expense of the enterprises includedin the consolidationPersonnel who meet certain requirements, are entitled to a supplementary retirement and survivors’ pension, determinedin accordance with the salary and the number of years of service with the enterprise. The mathematical reserves resultingfrom yearly allocations charged to the income statement are paid over to an insurance company.
41
477391
–
1447
107
336–
20153
1124
336–
54257
1110
4––
29842965–
p.m.p.m.
p.m.
XVI. RIGHTS AND COMMITMENTS NOT REFLECTED IN THE BALANCE SHEET ( i n m i l l i o n s o f EUR )
274173
–
107––
49
Affiliated enterprises not included in the consolidation1. Financial fixed assets
– Participating interests and shares . . . . . . . . . . . . . . . . . . . . . . . . . . . . . . . . . . . . . . . . . . . . . . . . .2. Amounts receivable
– after one year . . . . . . . . . . . . . . . . . . . . . . . . . . . . . . . . . . . . . . . . . . . . . . . . . . . . . . . . . . . .– within one year . . . . . . . . . . . . . . . . . . . . . . . . . . . . . . . . . . . . . . . . . . . . . . . . . . . . . . . . . . .
5. Personal and real guarantees, given or irrevocably promised by enterprises included in the consolidation, as a security ofdebts or commitments of affiliated enterprises not included in the consolidation . . . . . . . . . . . . . . . . . . . . . . .
Enterprises not included in the consolidation but linked by participating interests1. Financial fixed assets
– Participating interests and shares . . . . . . . . . . . . . . . . . . . . . . . . . . . . . . . . . . . . . . . . . . . . . . . . .2. Amounts receivable
– within one year . . . . . . . . . . . . . . . . . . . . . . . . . . . . . . . . . . . . . . . . . . . . . . . . . . . . . . . . . . .
2
1–
–
1
–
A. 4. Direct and indirect remuneration and pensionsTo the directors . . . . . . . . . . . . . . . . . . . . . . . . . . . . . . . . . . . . . . . . . . . . . . . . . . . . . . . . . . . . 1
XVIII. FINANCIAL RELATIONS WITH THE DIRECTORS ( i n m i l l i o n s o f EUR )
XVII. RELATIONSHIPS WITH AFFILIATED ENTERPRISES NOT INCLUDED IN THE CONSOLIDATIONAND WITH ENTERPRISES NOT INCLUDED IN THE CONSOLIDATION BUT LINKED BYPARTICIPATING INTERESTS ( i n m i l l i o n s o f EUR )
XIX. MAJOR EXCHANGE RATES
2003 2002 closing rate average rate closing rate average rate
GBP . . . . . . . . . . . . . . . . . . . . . . . . . . . . . . . 0.704800 0.688900 0.650500 0.626300JPY . . . . . . . . . . . . . . . . . . . . . . . . . . . . . . . . 135.050000 130.867500 124.390000 117.327500USD . . . . . . . . . . . . . . . . . . . . . . . . . . . . . . . 1.263000 1.123900 1.048700 0.937200

50
Share of the Group in the result . . . . . . . . . . . . . . . . . . . . . . . . . . . . . . . . . . . . . . . . . . .Share of minority interests in the result . . . . . . . . . . . . . . . . . . . . . . . . . . . . . . . . . . . . . . .Results of the enterprises accounted for using the equity method, less dividends . . . . . . . . . . . . . . .Depreciation . . . . . . . . . . . . . . . . . . . . . . . . . . . . . . . . . . . . . . . . . . . . . . . . . . . . . .Amounts written off . . . . . . . . . . . . . . . . . . . . . . . . . . . . . . . . . . . . . . . . . . . . . . . . . .Provisions . . . . . . . . . . . . . . . . . . . . . . . . . . . . . . . . . . . . . . . . . . . . . . . . . . . . . . . .Capital gains and losses on the sale of fixed assets . . . . . . . . . . . . . . . . . . . . . . . . . . . . . . . . .Movements in the short term assets and liabilities* . . . . . . . . . . . . . . . . . . . . . . . . . . . . . . . .
CASH FLOW FROM OPERATIONAL ACTIVITIES . . . . . . . . . . . . . . . . . . . . . . . . . . . . . .
Acquisition of fixed assets . . . . . . . . . . . . . . . . . . . . . . . . . . . . . . . . . . . . . . . . . . . . . . .New loans . . . . . . . . . . . . . . . . . . . . . . . . . . . . . . . . . . . . . . . . . . . . . . . . . . . . . . .Sales of fixed assets . . . . . . . . . . . . . . . . . . . . . . . . . . . . . . . . . . . . . . . . . . . . . . . . . .Reimbursement of loans . . . . . . . . . . . . . . . . . . . . . . . . . . . . . . . . . . . . . . . . . . . . . . .Translation differences . . . . . . . . . . . . . . . . . . . . . . . . . . . . . . . . . . . . . . . . . . . . . . . .
CASH FLOW FROM INVESTMENT ACTIVITIES . . . . . . . . . . . . . . . . . . . . . . . . . . . . . . .
Movements in investment grants . . . . . . . . . . . . . . . . . . . . . . . . . . . . . . . . . . . . . . . . . . .Movements in translation differences . . . . . . . . . . . . . . . . . . . . . . . . . . . . . . . . . . . . . . . .Movements in minority interests . . . . . . . . . . . . . . . . . . . . . . . . . . . . . . . . . . . . . . . . . . .New long term working capital loans . . . . . . . . . . . . . . . . . . . . . . . . . . . . . . . . . . . . . . . .Movements in working capital loans . . . . . . . . . . . . . . . . . . . . . . . . . . . . . . . . . . . . . . . . .Movements in own shares . . . . . . . . . . . . . . . . . . . . . . . . . . . . . . . . . . . . . . . . . . . . . .Dividends to be paid . . . . . . . . . . . . . . . . . . . . . . . . . . . . . . . . . . . . . . . . . . . . . . . . .
CASH FLOW FROM FINANCING ACTIVITIES . . . . . . . . . . . . . . . . . . . . . . . . . . . . . . . .
Partial demerger . . . . . . . . . . . . . . . . . . . . . . . . . . . . . . . . . . . . . . . . . . . . . . . . . . . .
TOTAL CASH FLOW . . . . . . . . . . . . . . . . . . . . . . . . . . . . . . . . . . . . . . . . . . . . . . . .
Movements in investments . . . . . . . . . . . . . . . . . . . . . . . . . . . . . . . . . . . . . . . . . . . . . .Movements in cash at bank and in hand . . . . . . . . . . . . . . . . . . . . . . . . . . . . . . . . . . . . . . .Movements in financial debts payable within one year . . . . . . . . . . . . . . . . . . . . . . . . . . . . . . .
NET MOVEMENT IN INVESTMENTS AND SIMILAR FUNDS . . . . . . . . . . . . . . . . . . . . . .
* Other than investments, cash at bank and in hand and financial debts payable within one year.
2003(in millions of EUR)
61––
481
14–6526
85
–235201373
–27555
119
– –63
– –
–25–6
–35
–129
31
106
40 –2894
106
2002(in millions of EUR)
25 1
–1 129
6 24
–163 –8
13
–458 339 403
–263 112
133
– –90 –3 –
–110 –11 –15
–229
–
–83
–119 –14 50
–83
cash flow statement CMB group
51
Statutory auditor's report on the consolidated accounts submitted tothe general shareholders' meeting of CMB sa C o n s o l i d a t e d a c c o u n t s f o r t h e y e a r e n d e d D e c e m b e r 3 1 , 2 0 0 3In accordance with legal and statutory requirements, we are reporting to you on the completion of the mandate which you have entrusted to us.
We have audited the consolidated financial statements for the year ended December 31, 2003 with a balance sheet total of EUR 914 million anda profit for the year of EUR 61 million (share of the Group). These consolidated financial statements have been prepared under the responsibilityof the board of directors of the company. The financial statements of a number of companies included in the consolidated accounts, with a totalbalance sheet of EUR 680 million and a consolidated result for the year of EUR 73 million, have been audited by other auditors on which we haverelied to express our opinion. In addition we have reviewed the directors’ report.
Unqualified audit opinion on the consolidated financial statements
Our audit was performed in accordance with the standards of the "Institut des Reviseurs d'Entreprises-Instituut der Bedrijfsrevisoren". Thosestandards require that we plan and perform the audit to obtain reasonable assurance about whether the consolidated financial statements are freeof material misstatement, taking into account the Belgian legal and regulatory requirements applicable to the consolidated financial statements.
In accordance with those standards, we considered the administrative and accounting organisation of the Group, as well as the system of internalcontrol. The Group’s management has provided us with all explanations and information which we required for our audit. We examined, on a testbasis, the evidence supporting the amounts included in the consolidated financial statements. We assessed the accounting policies used and thesignificant accounting estimates made by the company and the overall presentation of the consolidated financial statements. We believe that ouraudit provides a reasonable basis for our opinion.
In our opinion, taking into account the prevailing legal and regulatory requirements, the consolidated financial statements of CMB sa for the yearended December 31, 2003 present fairly the financial position of the Group and the results of its operations and the disclosures made in the notesto the financial statements are adequate.
Additional assertion and information
As required by generally accepted auditing standards the following additional assertion and information are provided. This assertion andinformation do not alter our audit opinion on the consolidated financial statements.
– The consolidated directors’ report contains the information required by law and is in accordance with the consolidated financial statements.We refer to the consolidated directors’ report in which the comparative pro forma consolidated financial accounts as per December 31, 2002have been included. We have reviewed these pro forma consolidated financial accounts as per December 31, 2002. These pro formaconsolidated financial accounts have been established by management of the company.Our review has been performed in accordance with the appropriate recommendations issued by the Institut des Reviseurs d’Entreprises –Instituut der Bedrijfsrevisoren and consists mainly of an analytical review and discussions with management.The scope of this review is less than the scope of an audit performed in accordance with the generally accepted auditing standards.Nevertheless, our review did not reveal any facts or elements which might lead to the conclusion that the pro forma consolidated financialaccounts as per December 31, 2002 have not been established in conformity of the valuation rules of the company.
Antwerp, April 14, 2004Klynveld Peat Marwick Goerdeler
Reviseurs d'Entreprises
Statutory Auditorrepresented by
H. Platteau Th. ErauwReviseur d’Entreprises Reviseur d’Entreprises

52

53
The annual accounts of CMB sa are given hereafter in summarised form. In accordance with the Company Law,the annual accounts of CMB sa, together with the annual report and the statutory auditor's report have been
deposited with the National Bank of Belgium.These documents can be obtained upon demand at the registered offices of the company.
The statutory auditor did not express any reservations in respect of the annual accounts of CMB sa.
s ta tu tor y account s

54
ASSETS
FIXED ASSETS . . . . . . . . . . . . . . . . . . . . . . . . . . . . . . . . . . . . . . . . .
II. Intangible assets . . . . . . . . . . . . . . . . . . . . . . . . . . . . . . . . . . . . . . .III. Tangible assets . . . . . . . . . . . . . . . . . . . . . . . . . . . . . . . . . . . . . . . .IV. Financial assets . . . . . . . . . . . . . . . . . . . . . . . . . . . . . . . . . . . . . . . .
CURRENT ASSETS . . . . . . . . . . . . . . . . . . . . . . . . . . . . . . . . . . . . . .
VII. Amounts receivable within one year . . . . . . . . . . . . . . . . . . . . . . . . . . . .VIII. Investments . . . . . . . . . . . . . . . . . . . . . . . . . . . . . . . . . . . . . . . . . .IX. Cash at bank and in hand . . . . . . . . . . . . . . . . . . . . . . . . . . . . . . . . . .X. Deferred charges and accrued income . . . . . . . . . . . . . . . . . . . . . . . . . . .
TOTAL ASSETS . . . . . . . . . . . . . . . . . . . . . . . . . . . . . . . . . . . . . . . . .
LIABILITIES
CAPITAL AND RESERVES . . . . . . . . . . . . . . . . . . . . . . . . . . . . . . . . .
I. Capital . . . . . . . . . . . . . . . . . . . . . . . . . . . . . . . . . . . . . . . . . . . .II. Share premium account . . . . . . . . . . . . . . . . . . . . . . . . . . . . . . . . . . .IV. Reserves . . . . . . . . . . . . . . . . . . . . . . . . . . . . . . . . . . . . . . . . . . .V. Accumulated profits . . . . . . . . . . . . . . . . . . . . . . . . . . . . . . . . . . . . .
PROVISIONS FOR LIABILITIES AND CHARGES . . . . . . . . . . . . . . . . . .
VII. Provisions and deferred taxes . . . . . . . . . . . . . . . . . . . . . . . . . . . . . . . .
CREDITORS . . . . . . . . . . . . . . . . . . . . . . . . . . . . . . . . . . . . . . . . . . .
VIII. Amounts payable after one year . . . . . . . . . . . . . . . . . . . . . . . . . . . . . .IX. Amounts payable within one year . . . . . . . . . . . . . . . . . . . . . . . . . . . . .X. Accrued charges and deferred income . . . . . . . . . . . . . . . . . . . . . . . . . . .
TOTAL LIABILITIES . . . . . . . . . . . . . . . . . . . . . . . . . . . . . . . . . . . . . .
balance sheet of CMB saf o r t h e y e a r e n d e d 3 1 D e c e m b e r , 2 0 0 3
2002(in 1,000 of EUR)
770,026
–936
769,090
56,862
21,22622,003
50313,130
826,888
2002(in 1,000 of EUR)
437,846
90,00020,294
141,646185,906
44,430
44,430
344,612
70,131262,95511,526
826,888
2003(in 1,000 of EUR)
487,905
–606
487,299
6,823
1,3104,876
392245
494,728
2003(in 1,000 of EUR)
190,527
50,0009,488
79,80751,232
26,150
26,150
278,051
39,008237,710
1,333
494,728

55
income statement of CMB saf o r t h e y e a r e n d e d 3 1 D e c e m b e r , 2 0 0 3
I. Operating income . . . . . . . . . . . . . . . . . . . . . . . . . . . . . . . . . . . . . . . . .II. Operating charges . . . . . . . . . . . . . . . . . . . . . . . . . . . . . . . . . . . . . . . . .
III. Operating result . . . . . . . . . . . . . . . . . . . . . . . . . . . . . . . . . . . . . . . . .
IV. Financial income . . . . . . . . . . . . . . . . . . . . . . . . . . . . . . . . . . . . . . . . . .V. Financial charges . . . . . . . . . . . . . . . . . . . . . . . . . . . . . . . . . . . . . . . . . .
VI. Result on ordinary activities before taxes . . . . . . . . . . . . . . . . . . . . . . . . . . .
VII. Extraordinary income . . . . . . . . . . . . . . . . . . . . . . . . . . . . . . . . . . . . . . .VIII. Extraordinary charges . . . . . . . . . . . . . . . . . . . . . . . . . . . . . . . . . . . . . . .
IX. Result for the year before taxes . . . . . . . . . . . . . . . . . . . . . . . . . . . . . . . .
X. Income taxes . . . . . . . . . . . . . . . . . . . . . . . . . . . . . . . . . . . . . . . . . . . .
XI. Result for the year . . . . . . . . . . . . . . . . . . . . . . . . . . . . . . . . . . . . . . . .XIII. Result for the year available for appropriation . . . . . . . . . . . . . . . . . . . . . . . .
appropriation account
A. Result to be appropriated . . . . . . . . . . . . . . . . . . . . . . . . . . . . . . . . . . . .C. Transfers to capital and reserves . . . . . . . . . . . . . . . . . . . . . . . . . . . . . . . .D. Result to be carried forward . . . . . . . . . . . . . . . . . . . . . . . . . . . . . . . . . .F. Distribution of result . . . . . . . . . . . . . . . . . . . . . . . . . . . . . . . . . . . . . . .
2002(in 1,000 of EUR)
58,22859,149
–921
162,49621,934
139,641
4,175123,358
20,458
11
20,44720,447
2002(in 1,000 of EUR)
203,4782,371
185,90615,200
2003(in 1,000 of EUR)
8,65912,701
–4,042
11,43211,296
–3,906
4,834558
370
17
353353
2003(in 1,000 of EUR)
101,22814,99651,23235,000

56