Embed Size (px)
Citation preview

NeuroImage 17, 583–591 (2002)doi:10.1006/nimg.2002.1223
Cluster Significance Testing Using the BootstrapWilliam F. Auffermann, Shing-Chung Ngan, and Xiaoping Hu
Department of Radiology and Center for Magnetic Resonance Research, University of Minnesota Medical School,Minneapolis, Minnesota 55455
Received October 8, 2001
Many of the statistical methods currently employedto analyze fMRI data depend on a response template.However, the true form of the hemodynamic response,and thereby the response template, is often unknown.Consequently, cluster analysis provides a complemen-tary, template-free method for exploratory analysis ofmultidimensional fMRI data sets. Clustering algo-rithms currently being applied to fMRI data separatethe data into a predefined number of clusters (k). Apoor choice of k will result in erroneously partitioningwell-defined clusters. Although several clustering al-gorithms have been successfully applied to fMRI data,techniques for statistically testing cluster separationare still lacking. To address this problem we suggest amethod based on Fisher’s linear discriminant and thebootstrap. Also introduced in this paper is a measurebased on the projection of multidimensional data fromtwo clusters onto the vector, maximizing the ratio ofthe between- to the within-cluster sums of squares.The resulting one-dimensional distribution may bereadily visualized and used as a heuristic for estimat-ing cluster homogeneity. These methods are demon-strated for the self-organizing maps clustering algo-rithm when applied to event-related fMRI data. © 2002
Elsevier Science (USA)
Key Words: cluster analysis; homogeneity; statistics;bootstrap; functional MRI.
INTRODUCTION
Functional magnetic resonance imaging (fMRI) hasbecome a powerful tool for studying brain function andhas generated an enormous amount of interest (Ban-dettini et al., 1997; Kim et al., 1997; Ogawa et al., 1998;Turner, 1992). Most fMRI experiments are based onblood oxygenation level-dependent contrast (Ogawa etal., 1990a,b,c; Thulborn et al., 1982) resulting from theparamagnetic nature of deoxyhemoglobin. Neuronalactivation is believed to cause an increase in regionalblood flow without a proportional increase in the re-gional oxygen consumption rate (Fox et al., 1986). Con-sequently, vascular deoxyhemoglobin concentrationsdecrease, leading to an increase in T2 and T2*, result-
583
ing in an elevation of intensity in T2- and T2*-weightedMR images.
Many methods for analyzing fMRI data have beenintroduced. The majority of fMRI practitioners cur-rently use statistical techniques to determine whethervoxels of the brain show task-related signal variation.Some commonly used statistical methods includecross-correlation (Rabe-Hesketh et al., 1997), t tests(Ardekani et al., 1998), and variations of the generallinear model (Friston et al., 1995b). While these meth-ods have been successfully applied to fMRI, they maynot be appropriate for all types of fMRI data. In par-ticular, these methods may not be applicable to studiesin which the form of the hemodynamic response isunclear. In such cases, it may also be desirable to usestatistical methods which are less template dependent.
Statistical clustering has found recent application infMRI, particularly event-related fMRI. Clustering of-fers a relatively unsupervised approach for partition-ing data into self-similar groups without prior knowl-edge of the form of the fMRI response. Clusteringtechniques include hierarchical clustering (Anderberg,1973; Goutte et al., 1999), K-means clustering (Fischeret al., 1999; Goutte et al., 1999; MacQueen, 1976), fuzzyclustering (Bezdek, 1981; Cherkassky et al., 1998;Golay et al., 1996), and self-organizing maps (SOM)(Fischer and Henning, 1999; Kohonen, 1990; Ngan etal., 1999).
Some work has recently been performed in examin-ing the homogeneity of a cluster. For example, themethods proposed by Baumgartner et al. essentiallypurify a cluster by removing data points that do notsatisfy some minimum measure of intracluster similar-ity (Baumgartner et al., 1999, 2000). However, no workhas been done in fMRI to assess the statistical signif-icance associated with partitioning one cluster into twoclusters or the inverse problem of combining two clus-ters into one cluster.
While clustering and cluster purification haveproven useful for analyzing fMRI data, there are notechniques in the MRI literature which quantify thestatistical probability that one group actually corre-sponds to one cluster as opposed to two or more clus-
1053-8119/02 $35.00© 2002 Elsevier Science (USA)
All rights reserved.

ters. One method to statistically address this questionis the ratio of the between- and the within-cluster sumsof squares (Engelman et al., 1969). However, thismethod is applicable only to one-dimensional data.This test has been modified for multidimensional databy Lee (1979) using the union-intersection technique(Roy, 1957). Under certain constraints, the union-in-tersection modification is equivalent to Fisher’s lineardiscriminant function (Rencher, 1998). The techniquepresented here is based on the method described byLee (1979) and uses Fisher’s linear discriminant func-tion (FLDF) as the statistical measure.
The present method is applied to fMRI data in a waywhich closely parallels the work of Engelman and Har-tigan (1969) and Lee (1979) with two exceptions. Thecluster validation technique proposed by Lee (1979)looked for the partitioning of one cluster that wouldminimize the within-cluster sums of squares. Since thequestion addressed in this paper is whether two groupsgenerated by a clustering algorithm are significantlyseparated, repartitioning is not needed. In addition,the method demonstrated by Lee (1979) originally es-timated the significance of the results by comparingthe test statistic for the data to the distribution result-ing from a Monte Carlo simulation. However, the boot-strap is used here, since it makes no parametric as-sumptions and has been found to give better estimatesof the significance of the FLDF statistic. The distribu-tion of the FLDF statistic is known in some instances,particularly if the hypothesized distance betweengroup means is zero. However, the data analyzed herehave been partitioned into nonoverlapping groups by aclustering algorithm and no theoretical approximationis known (discussed in detail under Theory).
The present technique will find applications in fMRIdata clustering since the data analyst will seldom knowthe appropriate number of clusters in a data set. Clus-tering the fMRI time series using a predetermined num-ber of clusters may accidentally separate a well-definedcluster into two or more clusters. The FLDF method maybe used in a hypothesis-driven fashion to quantitativlytest the validity of the data partitioning, when the usersuspects the clusters have been erroneously partitioned.
The method presented here is applied to data acquiredusing an event-related design with a constant inter-stimulus interval. Note that this method is not restrictedto such designs and can, in principle, be used for othertypes of studies. This test is applied to a visually cuedmotor activation study to demonstrate its utility in vali-dating clusters produced by a clustering algorithm.
THEORY
Cluster Significance
In cluster analysis the data analyst will frequentlywant to know if two clusters are significantly sepa-
rated. A statistic measuring cluster separation may beused to determine if two data clusters are better rep-resented as a single merged cluster. The null and al-ternative hypotheses addressing this issue can be ex-pressed as H0, the clusters are not distinct and shouldbe merged; and HA, the clusters are distinct and shouldnot be merged. The FLDF method is introduced in thenext section to address this issue.
The Test Statistic
The test assumes two p-variate clusters X1 and X2 ofsizes (n1 � p) and (n2 � p), respectively, where ni
indicates the number of objects in the ith cluster. Thistest assumes that the data have been jointly standard-ized (described under Methods). We are interested indetermining the distance between the two multivariateclusters relative to the intracluster variance. This dis-tance is a function of the intercentroid vector d,
d � x� 2 � x� 1 , (1)
where x� i is the mean vector for the ith cluster. The teststatistic of choice is FLDF. Denote the FLDF test sta-tistic, z, as
z � maxai
� ai �Bai
ai �Wai� ,
where ai is some normalized column vector of length p,B and W are the between- and within-cluster sums-of-squares matrices, respectively. Specifically,
B �n1n2
n1 � n2dd�
and
W � �n1 � n2 � 2� Sp ,
where Sp is the pooled covariance matrix (see Appen-dix). It can be shown that z is maximized when ai � a,the first normalized eigenvector of W�1B (Mardia et al.,1979). For the case of two groups it can be shown(Johnson et al., 1998) that
a �Sp
�1d
�Sp�1d�
, (2)
where Sp�1 is the inverse of the pooled covariance ma-
trix, �y� represents the magnitude of y (see Appendix),and the vector a has been normalized. Consequently,the test statistic can be expressed as
584 AUFFERMANN, NGAN, AND HU

z �a�Ba
a�Wa. (3)
In the case of two clusters, the test statistic can alsobe written as
z � cn�d�Sp�1 d� , (4)
where cn � �n1n2�/��n1 � n2��n1 � n2 � 2��. Since theconstant cn is a function of cluster size only and notseparation, it will not be included in the final expres-sion:
z � d�Sp�1d . (5)
This reformulation results in the most common formof FLDF (Johnson and Wichern, 1998) and is similar toHotelling’s T2 test (Rencher, 1998). Since the bootstrapwill be used to estimate the significance of this statis-tic, omitting cn will not affect the resulting significancelevel.
Hypotheses Testing
For an fMRI data set denote zobs as the observedvalue of the test statistic. The null hypothesis (H0) ofdistinct clusters should be accepted if zobs is withinsome critical distance of z for one multivariate normalcluster. Conversely, H0 should be rejected if zobs differsfrom z for one multivariate normal cluster by morethan some critical distance. The value of z for a singlemultivariate normal cluster will depend on the numberof variables and the sizes of the two partitioned clus-ters.
Estimating Statistical Significance
The significance of the observed value of the FLDFstatistic, zobs, is estimated using the bootstrap. Thebootstrap is a technique that empirically estimates thedistribution of a statistic for a data sample (Efron et al.,1983, 1998). For the FLDF statistic, “determining ex-act percentage points analytically seems intractable”(Lee, 1979). The distribution for an F test (similar to aHotelling’s T2 test) such as described by Chatfield et al.(1980) in Eq. 7.26 assumes (under the null hypothesis)that the empirical group means are random variableswith equal theoretical means and covariance matrices.However, a clustering algorithm “pushes” these theo-retical means apart, such that they will not be equal.Consequently, using an F distribution which assumesthat the empirical means behave as random variableswith equal theoretical means is not appropriate. Con-sequently, a computer-intensive method like the boot-strap must be used instead.
Once two clusters are selected, the data are adjustedto create “null hypothesis data.” That is, the distancebetween cluster centroids is adjusted until it is thesame as between two clusters from multivariate nor-mal data. The necessity of this step and fine points ofits implementation are discussed in detail by Efron andTibsharani (1998). Basically, the bootstrap will givethe distribution of a statistic for a particular data set.However, to conduct a significance test, the data mustbe reduced to null hypothesis data (H0 data). Then thetest statistic for the original sample may be comparedto the bootstrap values for the H0 data and a p valuecan be estimated for the test statistic, similar to theway in which a p value is estimated if the statistic isknown to be normally distributed.
Specifically, the distance between cluster centroidsis adjusted such that z � �0, to produce two new ma-trices X1
H0 and X2H0, where �0 represents the true value
of z for data when the null hypothesis is true. Since thedistance between the clusters for multivariate data is afunction of their covariance matrix, the normalizeddistance must be used (z) instead of the raw distance.Note that �0 is estimated using Monte Carlo simula-tion, as described under Methods.
The adjusted data clusters are then used as thepopulation for bootstrap resampling to give X*1 and X*2.Note that X*i ( j, ●) � Xi
H0(uj, ●), where uj is a uniformlydistributed random integer such that uj � [1,ni], jindicates the row (case/voxel) number, i indexes thecluster number, and ● indicates all the columns (vari-ables) for the jth case. The resampling is performed Btimes, producing B sets of resampled vectors, whichwill serve as bootstrap populations for the FLDF sta-tistic. The value of z*j is calculated for each of the Bbootstrap resamplings, resulting in
�z* j� � �z* 1, z*2, . . . , z*B� . (6)
Denote the bootstrap p value corresponding to zobs aspb value (zobs), the fraction of values of {z* j} that lieabove zobs. That is,
pb value�zobs� �#�z* j � zobs�
B, (7)
where #�●� denotes the cardinality of the set, and j �[1,B].
METHODS
fMRI Data Collection
The FLDF method is demonstrated on fMRI datacollected during an activation study. A visually cuedmotor paradigm was used, in which binocular, full-fieldvisual stimulation was presented to the subject using
585CLUSTER SIGNIFICANCE TESTING

LED goggles flashing at 8 Hz. In this paradigm, thesubject was asked to perform a finger opposition taskduring the visual stimulation, which was turned on for5.4 s in epochs of length 19.2 s. All subjects providedinformed consent prior to the experiment. An obliqueslice traversing the visual and motor areas was imagedduring this study. The data set was acquired on a 1.5-TSiemens Vision Scanner. The data consisted of 1984images (one slice, 1984 images per slice) acquired witha T2*-weighted EPI sequence (TR/TE 300/60 ms, fieldof view 22 � 22 cm, slice thickness 5 mm, FA 55°). Theexperiment consisted of 31 epochs, with 64 imagesacquired per epoch. In this event-related study, a con-stant interstimulus interval was used.
Preprocessing of fMRI Data, Outlier Analysis
The FLDF method makes the assumption that clus-ters are normally distributed. While this is a relativelygood approximation, the clustering algorithms will oc-casionally include elements that do not belong in thecluster and violate this assumption. This issue hasbeen previously dealt with in fMRI (Baumgartner etal., 1999), in a manner analogous to outlier tests inregression analysis. Consequently, for the fMRI datapresented in this paper, all clusters were tested foroutliers by examining the distribution of the externallystudentized residuals of each cluster (Weisberg, 1985).Objects which showed a large deviation from otherobjects in the cluster were removed prior to FLDFanalysis. Note that the number of objects removed froma cluster was usually less than 10% of the objectsoriginally assigned to that cluster by the clusteringalgorithm.
Standardization of fMRI Data
The test assumes that the two multivariate dataclusters X1 and X2, of sizes (n1 � p) and (n2 � p),respectively, have been jointly standardized. That is,for
X � �X0,1X0,2
� ,
where X0,i represents the ith original data matrix, thestandardized matrix can be expressed as
Xi� j,●�� � �X0,i� j,●�� � x� �S�1/2 for all j � �1,ni� ,
where Xi( j,●) denotes the jth row (case/voxel) of thestandardized matrix Xi, x� is the mean of X, and S is thesample covariance matrix (see Appendix).
Estimation of �0
Since there is no analytical expression for �0, it mustbe estimated using Monte Carlo simulation. First a
multivariate normal cluster with p uncorrelated vari-ables and n � n1 n2 cases is generated, where n1
represents the size of the smaller cluster. Because theexperimental clusters have been standardized, the co-variance matrices for the simulated clusters are set tothe identity matrix. A clustering algorithm is used toartificially partition this single group into two clusters.As the test statistic is a function of n1 and n2, we wouldideally throw away the results of a simulation if thenumber of elements in the simulated clusters does notmatch those in the data. However, this makes thesimulation very time consuming.
Consequently, we relax the restriction and allow thesize of the smaller cluster in the simulation to be atleast as large as the smaller cluster in the actual data.That is, we allow the values of n1,sim and n2,sim to satisfythe inequalities
n1 � n � n1,sim � n1
n2 � nsim,2 � n2 � n,
where n is some small integer. For the results shownin this paper we take n � 5. The value of �0 is approx-imated by the mean value of z for 500 multivariatenormal clusters satisfying the simulated cluster sizerestriction previously mentioned.
FLDF Test Statistic Validation on Simulated Data
To demonstrate the validity of using the bootstrapfor hypothesis testing, a simulation was conducted onmultivariate normal data. One multivariate normalcluster was simulated with n � 1000 and p � 5. TheFLDF statistic was computed, as well as 1000 boot-strap z* values. The distribution of z* was comparedwith the distribution of z for 5000 simulated multivar-iate normal clusters. The comparison was performedqualitatively using a frequency polygon and quantita-tively using the Kolmogrov–Smirnov (KS) goodness-of-fit test (Lindgren, 1993), in that the KS test wascarried out after the empirical distributions were ap-proximated with kernel density estimates (Simonoff,1996).
FLDF Test Statistic Applied to Experimental fMRI Data
Clustering was performed on the voxel time coursesaveraged across epochs. The fMRI data were clusteredusing an SOM algorithm on a 3 � 3 grid (Fischer andHenning, 1999; Ngan and Hu, 1999). Two pairs ofclusters were selected to demonstrate the FLDFmethod. The cluster pairs selected were (2,3) and (2,1)for study A and (2,3) and (1,3) for study B. The ob-served value of the test statistic, zobs was computed andits significance was estimated using the bootstrap with5000 bootstrap replications. Kernel density estimates
586 AUFFERMANN, NGAN, AND HU

(KDE) were used to graphically illustrate the separa-tion between clusters (Simonoff, 1996). To accomplishthis, data from cluster Xi were reduced to one dimen-sion, xi � Xia. The resulting distributions were scaledby the estimated value of �0 to adjust for differences incluster size. Both distributions were smoothed with thesame Gaussian kernel.
RESULTS
FLDF Test Statistic Validation on Simulated Data
The bootstrap distribution of z is compared with theMonte Carlo distribution using a frequency polygon inFig. 1. The close agreement of the two distributionsindicates that the bootstrap generated a distributionequivalent to that of the Monte Carlo simulation ofmultivariate normal clusters. This qualitative observa-tion is supported by the p value of 0.95 for the KSgoodness-of-fit test, which means that, at a significancelevel of 0.05, we can accept the null hypothesis that thebootstrap distribution of z is equal to the Monte Carloestimate. Note that our simulation was performed forthe case in which the distribution of the clusters isknown to demonstrate the utility of the bootstrap.
FLDF Test Statistic Applied to fMRI Data
The centroids for each cluster are shown in Fig. 2.Clusters (2,3) and (2,1) of sizes n1 � 93 and n2 � 162,respectively, were selected for the first application ofFLDF. The data from the two clusters were projectedonto the vector a and are shown in Fig. 3a. The KDEclearly shows a separation between the two clusters.This separation is supported by the observed value forthe FLDF statistic, zobs � 26.5, corresponding to abootstrap pb value of less than 0.001. Consequently, wecan reject H0 at a significance level of 0.05 for these twoclusters. As is shown in Fig. 4a, the two clusters are
also spatially separated, supporting the decision toavoid merging the clusters.
The data from clusters (2,3) and (1,3) of sizes n1 � 93and n2 � 49, respectively, were projected onto thevector a giving the one-dimensional distribution shownin Fig. 3b. This KDE shows a lack of clear separation
FIG. 1. Frequency polygons of z for Monte Carlo simulation(solid line) and the bootstrap (circles).
FIG. 2. Plots of SOM centroids.
FIG. 3. Kernel density estimates of the 1D data projections fortwo sets of SOM clusters. Both kernel density estimates underwentthe same amount of smoothing. (a) Clusters (2,1) and (2,3). (b)Clusters (1,3) and (2,3).
587CLUSTER SIGNIFICANCE TESTING

between the two clusters. This lack of separation issupported by the observed value of the FLDF statistic,zobs � 21.6, corresponding to a bootstrap pb value of0.70. Consequently, H0 is accepted at a significancelevel of 0.05 and the two clusters can be merged. Figure4b shows that the two clusters spatially colocalize,supporting the merging of the two clusters.
DISCUSSION
Projection of Multidimensional Data as a Heuristic
The performance of cluster analysis on multidimen-sional data is hard to assess due to the difficulty ofvisualizing the multidimensional clusters. Suggestedin this paper is a technique for assessing the distribu-tion of two clusters by projection onto the vector a,which maximizes the FLDF statistic. This provides anintuitive method for visualizing the data which is fastand easy to apply. For example, if the data analystssimply want a rough idea of the relationships betweenthe multidimensional clusters in their fMRI data set,they may use this projection as an exploratory tool. Iffurther quantification of this relationship is desired,the presented method may be used.
Bootstrap Significance Testing
While applicable to most statistics, the bootstrap isnot commonly used since it is time consuming and aparametric estimate is usually adequate. For multivar-iate clusters defined by a clustering algorithm, there isno formal parametric theory predicting the distribu-tion of z. Consequently, in this paper, the bootstrap hasbeen used for significance testing. An alternativemethod would be to perform a Monte Carlo simulationand use the quantiles of the FLDF statistic’s distribu-tion for a significance test. However, it has been em-pirically observed that the bootstrap provides moreaccurate estimates (results not included here). Conse-quently, the bootstrap percentile method has been se-lected for significance estimation (Efron and Gong,1983; Efron and Tibshirani, 1998).
An alternative method for conducting a bootstrapsignificance test for two clusters would be to do thefollowing. Estimate �0 (as described previously), adjustthe cluster centroids, perform bootstrap resampling,pool these clusters, recluster the data, and estimatez* j. However, this was found to take much longer andled to results similar to those from the method pre-sented in this paper.
Dependence of FLDF on Cluster Size
The sensitivity of the FLDF statistic is optimal forclusters of approximately equal size. If the two clustersdiffer in size by more than a factor of 4, the sensitivityof the test is greatly reduced. This can be understood ifwe consider that the uncertainty of the cluster geome-try (covariance matrix) is a function of the sample size.In this paper the restriction requiring the simulatedcluster to have the same number of elements as thedata clusters is relaxed for computational efficiency, asmentioned under Methods. Since the test statistictends to be smaller for clusters of increasingly dissim-ilar sizes, this will result in a significance test that is
FIG. 4. Anatomical image with cluster map overlaid. (a) Cluster(2,3) is shown in red and (2,1) is shown in yellow. (b) Cluster (2,3) isshown in red and (1,3) is shown in yellow.
588 AUFFERMANN, NGAN, AND HU
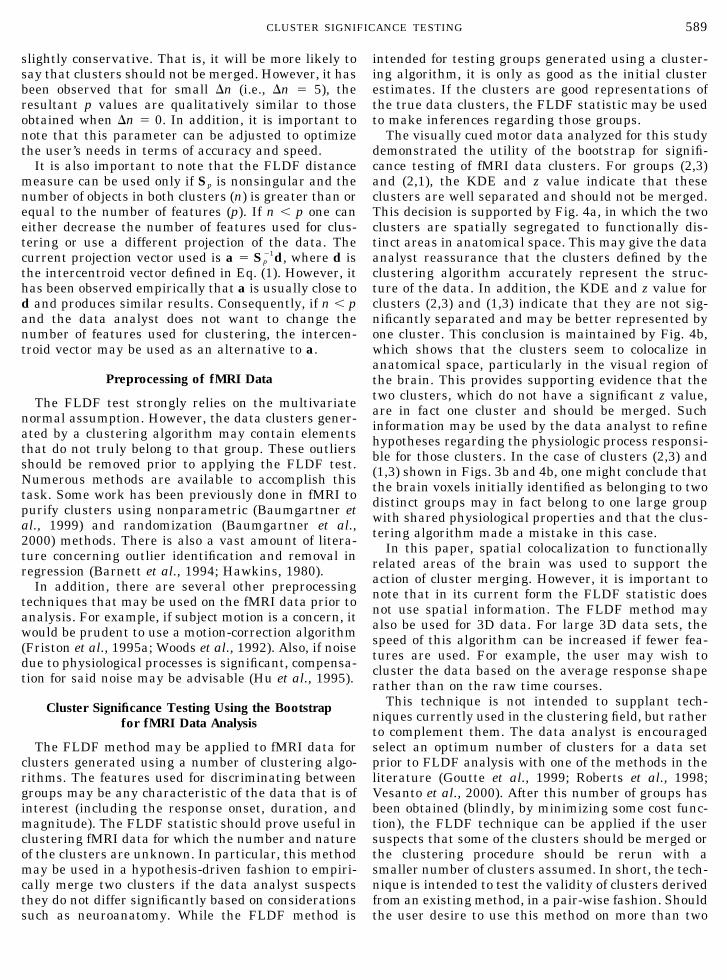
slightly conservative. That is, it will be more likely tosay that clusters should not be merged. However, it hasbeen observed that for small n (i.e., n � 5), theresultant p values are qualitatively similar to thoseobtained when n � 0. In addition, it is important tonote that this parameter can be adjusted to optimizethe user’s needs in terms of accuracy and speed.
It is also important to note that the FLDF distancemeasure can be used only if Sp is nonsingular and thenumber of objects in both clusters (n) is greater than orequal to the number of features (p). If n � p one caneither decrease the number of features used for clus-tering or use a different projection of the data. Thecurrent projection vector used is a � Sp
�1d, where d isthe intercentroid vector defined in Eq. (1). However, ithas been observed empirically that a is usually close tod and produces similar results. Consequently, if n � pand the data analyst does not want to change thenumber of features used for clustering, the intercen-troid vector may be used as an alternative to a.
Preprocessing of fMRI Data
The FLDF test strongly relies on the multivariatenormal assumption. However, the data clusters gener-ated by a clustering algorithm may contain elementsthat do not truly belong to that group. These outliersshould be removed prior to applying the FLDF test.Numerous methods are available to accomplish thistask. Some work has been previously done in fMRI topurify clusters using nonparametric (Baumgartner etal., 1999) and randomization (Baumgartner et al.,2000) methods. There is also a vast amount of litera-ture concerning outlier identification and removal inregression (Barnett et al., 1994; Hawkins, 1980).
In addition, there are several other preprocessingtechniques that may be used on the fMRI data prior toanalysis. For example, if subject motion is a concern, itwould be prudent to use a motion-correction algorithm(Friston et al., 1995a; Woods et al., 1992). Also, if noisedue to physiological processes is significant, compensa-tion for said noise may be advisable (Hu et al., 1995).
Cluster Significance Testing Using the Bootstrapfor fMRI Data Analysis
The FLDF method may be applied to fMRI data forclusters generated using a number of clustering algo-rithms. The features used for discriminating betweengroups may be any characteristic of the data that is ofinterest (including the response onset, duration, andmagnitude). The FLDF statistic should prove useful inclustering fMRI data for which the number and natureof the clusters are unknown. In particular, this methodmay be used in a hypothesis-driven fashion to empiri-cally merge two clusters if the data analyst suspectsthey do not differ significantly based on considerationssuch as neuroanatomy. While the FLDF method is
intended for testing groups generated using a cluster-ing algorithm, it is only as good as the initial clusterestimates. If the clusters are good representations ofthe true data clusters, the FLDF statistic may be usedto make inferences regarding those groups.
The visually cued motor data analyzed for this studydemonstrated the utility of the bootstrap for signifi-cance testing of fMRI data clusters. For groups (2,3)and (2,1), the KDE and z value indicate that theseclusters are well separated and should not be merged.This decision is supported by Fig. 4a, in which the twoclusters are spatially segregated to functionally dis-tinct areas in anatomical space. This may give the dataanalyst reassurance that the clusters defined by theclustering algorithm accurately represent the struc-ture of the data. In addition, the KDE and z value forclusters (2,3) and (1,3) indicate that they are not sig-nificantly separated and may be better represented byone cluster. This conclusion is maintained by Fig. 4b,which shows that the clusters seem to colocalize inanatomical space, particularly in the visual region ofthe brain. This provides supporting evidence that thetwo clusters, which do not have a significant z value,are in fact one cluster and should be merged. Suchinformation may be used by the data analyst to refinehypotheses regarding the physiologic process responsi-ble for those clusters. In the case of clusters (2,3) and(1,3) shown in Figs. 3b and 4b, one might conclude thatthe brain voxels initially identified as belonging to twodistinct groups may in fact belong to one large groupwith shared physiological properties and that the clus-tering algorithm made a mistake in this case.
In this paper, spatial colocalization to functionallyrelated areas of the brain was used to support theaction of cluster merging. However, it is important tonote that in its current form the FLDF statistic doesnot use spatial information. The FLDF method mayalso be used for 3D data. For large 3D data sets, thespeed of this algorithm can be increased if fewer fea-tures are used. For example, the user may wish tocluster the data based on the average response shaperather than on the raw time courses.
This technique is not intended to supplant tech-niques currently used in the clustering field, but ratherto complement them. The data analyst is encouragedselect an optimum number of clusters for a data setprior to FLDF analysis with one of the methods in theliterature (Goutte et al., 1999; Roberts et al., 1998;Vesanto et al., 2000). After this number of groups hasbeen obtained (blindly, by minimizing some cost func-tion), the FLDF technique can be applied if the usersuspects that some of the clusters should be merged orthe clustering procedure should be rerun with asmaller number of clusters assumed. In short, the tech-nique is intended to test the validity of clusters derivedfrom an existing method, in a pair-wise fashion. Shouldthe user desire to use this method on more than two
589CLUSTER SIGNIFICANCE TESTING
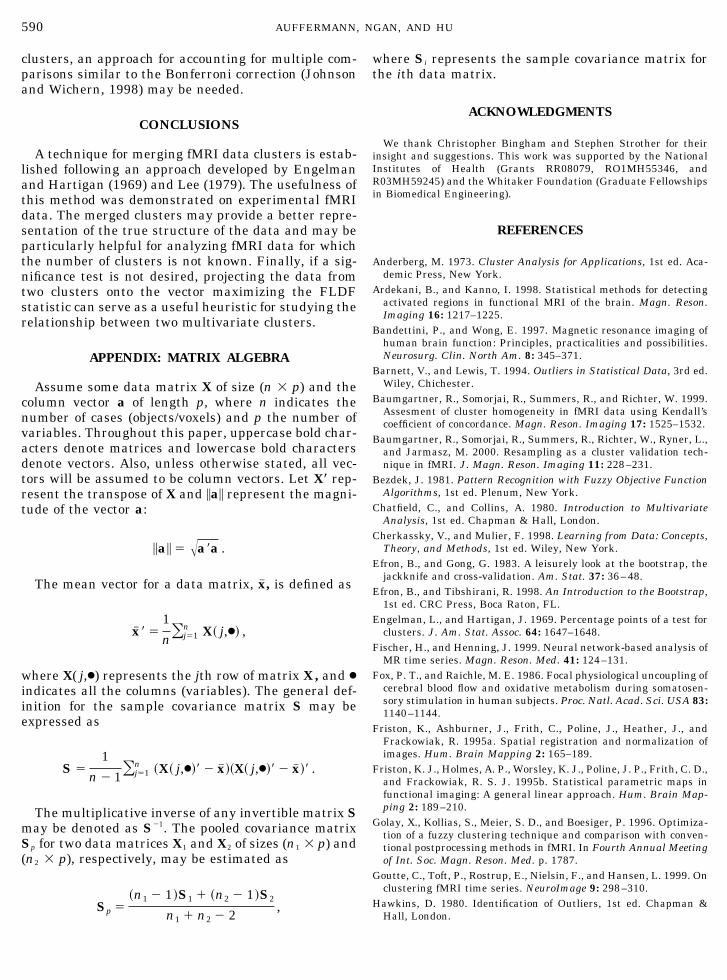
clusters, an approach for accounting for multiple com-parisons similar to the Bonferroni correction (Johnsonand Wichern, 1998) may be needed.
CONCLUSIONS
A technique for merging fMRI data clusters is estab-lished following an approach developed by Engelmanand Hartigan (1969) and Lee (1979). The usefulness ofthis method was demonstrated on experimental fMRIdata. The merged clusters may provide a better repre-sentation of the true structure of the data and may beparticularly helpful for analyzing fMRI data for whichthe number of clusters is not known. Finally, if a sig-nificance test is not desired, projecting the data fromtwo clusters onto the vector maximizing the FLDFstatistic can serve as a useful heuristic for studying therelationship between two multivariate clusters.
APPENDIX: MATRIX ALGEBRA
Assume some data matrix X of size (n � p) and thecolumn vector a of length p, where n indicates thenumber of cases (objects/voxels) and p the number ofvariables. Throughout this paper, uppercase bold char-acters denote matrices and lowercase bold charactersdenote vectors. Also, unless otherwise stated, all vec-tors will be assumed to be column vectors. Let X� rep-resent the transpose of X and �a� represent the magni-tude of the vector a:
�a� � �a�a .
The mean vector for a data matrix, x� , is defined as
x� � �1
n�j�1n X� j,●� ,
where X( j,●) represents the jth row of matrix X , and ●indicates all the columns (variables). The general def-inition for the sample covariance matrix S may beexpressed as
S �1
n � 1�j�1n �X� j,●�� � x� ��X� j,●�� � x� �� .
The multiplicative inverse of any invertible matrix Smay be denoted as S�1. The pooled covariance matrixSp for two data matrices X1 and X2 of sizes (n1 � p) and(n2 � p), respectively, may be estimated as
Sp ��n1 � 1�S1 � �n2 � 1�S2
n1 � n2 � 2,
where Si represents the sample covariance matrix forthe ith data matrix.
ACKNOWLEDGMENTS
We thank Christopher Bingham and Stephen Strother for theirinsight and suggestions. This work was supported by the NationalInstitutes of Health (Grants RR08079, RO1MH55346, andR03MH59245) and the Whitaker Foundation (Graduate Fellowshipsin Biomedical Engineering).
REFERENCES
Anderberg, M. 1973. Cluster Analysis for Applications, 1st ed. Aca-demic Press, New York.
Ardekani, B., and Kanno, I. 1998. Statistical methods for detectingactivated regions in functional MRI of the brain. Magn. Reson.Imaging 16: 1217–1225.
Bandettini, P., and Wong, E. 1997. Magnetic resonance imaging ofhuman brain function: Principles, practicalities and possibilities.Neurosurg. Clin. North Am. 8: 345–371.
Barnett, V., and Lewis, T. 1994. Outliers in Statistical Data, 3rd ed.Wiley, Chichester.
Baumgartner, R., Somorjai, R., Summers, R., and Richter, W. 1999.Assesment of cluster homogeneity in fMRI data using Kendall’scoefficient of concordance. Magn. Reson. Imaging 17: 1525–1532.
Baumgartner, R., Somorjai, R., Summers, R., Richter, W., Ryner, L.,and Jarmasz, M. 2000. Resampling as a cluster validation tech-nique in fMRI. J. Magn. Reson. Imaging 11: 228–231.
Bezdek, J. 1981. Pattern Recognition with Fuzzy Objective FunctionAlgorithms, 1st ed. Plenum, New York.
Chatfield, C., and Collins, A. 1980. Introduction to MultivariateAnalysis, 1st ed. Chapman & Hall, London.
Cherkassky, V., and Mulier, F. 1998. Learning from Data: Concepts,Theory, and Methods, 1st ed. Wiley, New York.
Efron, B., and Gong, G. 1983. A leisurely look at the bootstrap, thejackknife and cross-validation. Am. Stat. 37: 36–48.
Efron, B., and Tibshirani, R. 1998. An Introduction to the Bootstrap,1st ed. CRC Press, Boca Raton, FL.
Engelman, L., and Hartigan, J. 1969. Percentage points of a test forclusters. J. Am. Stat. Assoc. 64: 1647–1648.
Fischer, H., and Henning, J. 1999. Neural network-based analysis ofMR time series. Magn. Reson. Med. 41: 124–131.
Fox, P. T., and Raichle, M. E. 1986. Focal physiological uncoupling ofcerebral blood flow and oxidative metabolism during somatosen-sory stimulation in human subjects. Proc. Natl. Acad. Sci. USA 83:1140–1144.
Friston, K., Ashburner, J., Frith, C., Poline, J., Heather, J., andFrackowiak, R. 1995a. Spatial registration and normalization ofimages. Hum. Brain Mapping 2: 165–189.
Friston, K. J., Holmes, A. P., Worsley, K. J., Poline, J. P., Frith, C. D.,and Frackowiak, R. S. J. 1995b. Statistical parametric maps infunctional imaging: A general linear approach. Hum. Brain Map-ping 2: 189–210.
Golay, X., Kollias, S., Meier, S. D., and Boesiger, P. 1996. Optimiza-tion of a fuzzy clustering technique and comparison with conven-tional postprocessing methods in fMRI. In Fourth Annual Meetingof Int. Soc. Magn. Reson. Med. p. 1787.
Goutte, C., Toft, P., Rostrup, E., Nielsin, F., and Hansen, L. 1999. Onclustering fMRI time series. NeuroImage 9: 298–310.
Hawkins, D. 1980. Identification of Outliers, 1st ed. Chapman &Hall, London.
590 AUFFERMANN, NGAN, AND HU

Hu, X., Le, T. H., Parrish, T., and Erhard, P. 1995. Retrospectiveestimation and correction of physiological fluctuation in functionalMRI. Magn. Reson. Med. 34: 201–212.
Johnson, R., and Wichern, D. 1998. Applied Multivariate StatisticalAnalysis, 4th ed. Prentice–Hall, Upper Saddle River, NJ.
Kim, S. G., and Ugurbil, K. 1997. Functional magnetic resonanceimaging of the human brain. J. Neurosci. Methods 74: 229–243.
Kohonen, T. 1990. The self-organizing map. Proc. IEEE 78: 1464–1480.Lee, K. 1979. Multivariate tests for clusters. J. Am. Stat. Assoc. 74:
708–714.Lindgren, B. 1993. Statistical Theory, 4th ed. Chapman & Hall, New
York.MacQueen, J. 1976. Some methods for classification and analysis of
multivariate observations. In Proceedings of the 5th Berkeley Sym-posium on Mathematical Statistics and Probability 1: 281–297.
Mardia, K., Kent, J., and Bibby, J. 1979. Multivariate Analysis, 1sted. Academic Press, London.
Ngan, S., and Hu, X. 1999. Analysis of functional magnetic resonanceimaging data using self-organizing mapping with spatial connec-tivity. Magn. Reson. Med. 41: 939–946.
Ogawa, S., and Lee, T.-M. 1990a. Magnetic resonance imaging ofblood vessels at high fields: In vivo and in vitro measurements andimage simulation. Magn. Reson. Med. 16: 9–18.
Ogawa, S., Lee, T.-M., Kay, A. R., and Tank, D. W. 1990b. Brainmagnetic resonance imaging with contrast dependent on bloodoxygenation. Proc. Natl. Acad. Sci. USA 87: 9868–9872.
Ogawa, S., Lee, T.-M., Nayak, A. S., and Glynn, P. 1990c. Oxygen-ation-sensitive contrast in magnetic resonance image of rodentbrain at high magnetic fields. Magn. Reson. Med. 14: 68–78.
Ogawa, S., Menon, R., Kim, S., and Ugurbil, K. 1998. On the char-acteristics of functional magnetic resonance imaging of the brain.Annu. Rev. Biophys. Biomol. Struct. 27: 447–474.
Rabe-Hesketh, S., Bullmore, E., and Brammer, M. 1997. The analy-sis of functional magnetic resonance images. Stat. Methods Med.Res. 6: 215–237.
Rencher, A. 1998. Multivariate Statistical Inference and Applica-tions, 1st ed. Wiley, New York.
Roberts, S., Husmeier, D., Rezek, L., and Penny, W. 1998. Bayesianapproaches to Gaussian mixture modeling. IEEE Trans. PatternAnal. Mach. Intell. 20: 1133–1143.
Roy, S. 1957. Some Aspects of Multivariate Analysis, 1st ed. Wiley,New York.
Simonoff, J. 1996. Smoothing Methods in Statistics, 1st ed. Springer,New York.
Thulborn, K. R., Waterton, J. C., Mattews, P. M., and Radda, G. K.1982. Oxygenation dependence of the transverse relaxation time ofwater protons in whole blood at high field. Biochem. Biophys. Acta714: 265–270.
Turner, R. 1992. Magnetic resonance imaging of brain function.Am. J. Physiol. Imaging 7: 136–145.
Vesanto, J., and Alhoniemi, E. 2000. Clustering of the self organizingmap. IEEE Trans. Neural Netw. 11: 586–600.
Weisberg, S. 1985. Applied Linear Regression, 2nd ed. Wiley, NewYork.
Woods, R. P., Mazziotta, J. C., and Cherry, S. R. 1992. Rapid auto-mated algorithm for aligning and reslicing PET images. J. Com-put. Assisted Tomogr. 16: 620–633.
591CLUSTER SIGNIFICANCE TESTING