Embed Size (px)
Citation preview

Cloud Feedbacks on Climate: A Challenging Scientific Problem
Joel NorrisScripps Institution of Oceanography
Fermilab ColloquiumMay 12, 2010

4th IPCC: Key Uncertainties
• “Cloud feedbacks (particularly from low clouds) remain the largest source of uncertainty [to climate sensitivity].”
• “Surface and satellite observations disagree on total and low-level cloud changes over the ocean.”
• “Large uncertainties remain about how clouds might respond to global climate change.”
• “Cloud feedbacks are the primary source of intermodel differences in equilibrium climate sensitivity…”

Why a challenging problem?
• We have no fundamental theory for how global cloudiness should respond to greenhouse warming
• We have no numerical models that produce sufficiently realistic simulations of global cloudiness
• We have no stable system to monitor changes in global cloudiness and radiation on multidecadal time scales

Outline
• Theory
• Numerical Modeling
• Observations
• Marine Boundary Layer Clouds
• Recent Results
• Recommendations

Theory

A Simple Atmosphere
emittedsurface flux
absorbedsurface fluxfraction
solar flux
absorbedsolar fluxfraction 1p
emittedatmospheric fluxemissivity
absorbedatmospheric flux
surface
top ofatmosphere
transmittedsurface fluxfraction 1
reflectedsolar fluxfraction p

A Simple Atmosphere
Top of Atmosphere
(1 – p) S0 / 4 = Ta4 + (1 – ) Ts
4
Atmosphere
Ts4 = 2 Ta
4
Surface
(1 – p) S0 / 4 = Ts4 – Ta
4

How are Ts and related?
If emissivity increases (more CO2)
surface temperature Ts increases
4/1
0
24
1
ST p
s

The Simplest Climate Theory
sTT
FE
E
FF
F upward radiation flux at top of atmosphere
E external parameter (e.g., CO2, solar output)
Ts global surface temperature
no internal feedbacks

The Simplest Climate Theory
EE
FT BB
0
If equilibrium (F = 0) and zero internal feedbacks, then
where
341
ssBB
TT
F
Planckradiativeresponse

Allow Internal Feedbacks
Ik internal parameter
e.g., cloud, snow/ice, water vapor, vertical temperature profile (lapse rate)
k
ss
k
ks T
dT
dI
I
FT
T
FE
E
FF

Allow Internal Feedbacks
If equilibrium (F = 0), then
where
k kBB
s
TT
1
1
0
s
k
kk dTdI
IF
1

Net Feedback on Climate
This can be rewritten as
where
sum ofindividualfeedbacks
k k
BB
kkff
fTTs
1
10

f > 0 positive feedback: internal response of climate system exacerbates externally forced warming
f < 0 negative feedback: internal response of climate system mitigates externally forced warming
Net Feedback on Climate
This can be rewritten as
fTTs
1
10

high sensitivity: strong warming for a given forcing
low sensitivity: weak warming for a given forcing
Climate Sensitivity
fBB
1
EE
FTs
Climate sensitivity is the ratio of temperature response to external forcing

Individual Major Feedbacks
• Snow/ice albedo feedback – obviously positive
• Lapse rate feedback – small negative
• Water vapor feedback – almost certainly positive
• Cloud feedback – sign unknown, maybe positive

Water Vapor Feedback
water vapor is a greenhouse gas (the strongest), so
where q is water vapor mixing ratio (kg water vapor per kg dry air)
sBB
wv
BBwv dT
dq
q
Ff
0q
F

Water Vapor Feedback
where r is relative humidity and qsat is saturation water vapor mixing ratio
qsat rapidly increases with temperature
r controlled by turbulent dynamics of the atmosphere
s
sats
satsat
ss dT
drq
dT
dqrrq
dT
d
dT
dq

Saturation Mixing Ratio
From Hartmann’s Global Physical Climatology

Water Vapor Feedback
use values for location of maximum emission to space: r 0.4, T 250 K, qsat 1 g/kg
q 0.1 g/kg (10% change) for either:
T 2.5 K (1% change)
r 0.1 (25% change)
rqTdT
dqrq sat
sat

Water Vapor Feedback
• To first order, water vapor feedback is controlled by saturation vapor dependence on temperature
• Changes in relative humidity have second order influence
Good understanding of dynamical control of humidity not required for basic knowledge of water vapor feedback

Cloud Feedback
reflection of solar radiation
where C can represent multiple cloud characteristics
sBBcld dT
dC
C
Ff
0C
F0
C
F cloud greenhouse effect
sign of net radiation flux depends on type of cloud

Cloud Radiative Effects
low-level cloud
reflection >> 0
greenhouse ~ 0
cools the earth
high-level cloud
reflection ~ 0
greenhouse << 0
warms the earth
thick cloud
reflection >> 0
greenhouse << 0
(reflection + greenhouse) ~ 0

Comparison with CO2
• Reflection of solar radiation by all clouds:+48 W m-2
• Reduction in outgoing thermal radiation by all clouds: –31 W m-2
• Net cloud radiative effect of all clouds:+17 W m-2 more radiation to space
• Reduction in outgoing thermal radiation by CO2 increase since 1750 (280 380 ppm):
–1.6 W m-2

Comparison with CO2
1.6 W m-2 (35% increase in CO2) equal to either:
• 3% change in the reflection of solar radiation by clouds
• 5% change in the reduction of outgoing thermal radiation by clouds
• 9% change in net effect of clouds on radiation

Cloud Response to Temperature
clouds exist where r ≥ 1, absent where r < 1
r controlled by turbulent dynamics of the atmosphere
ss dT
dr
dr
dC
dT
dC

Cloud Feedback
• Changes in clouds on the order of 1% can have major impacts on Earth’s radiation budget
• Radiative impacts of different cloud types can have opposite sign
• Changes in relative humidity have first order influence
Good understanding of dynamical control of humidity is required for basic knowledge of cloud feedback

Numerical Modeling

Numerical Models
Global or smaller-domain numerical models explicitly solve equations at scales above the grid resolution
T,q
T,qwindssolar radiationthermal radiationtemperaturemoisture

Numerical Models
Processes at scales below the grid resolution must be parameterized (approximated in terms of grid-scale values)
cloudssmall-scalecirculations
100 km
1 km

Numerical Models
• Ideally, sub-grid turbulence should be homogeneous, isotropic, and cascade downscale to viscous dissipation
• Turbulence with these characteristics typically occurs only at scales less than 10-100 meters
• Global climate models must parameterize turbulence that is inhomogeneous, non-isotropic, and non-linear
• Cloud parameterizations do not represent the underlying processes with sufficient accuracy

Cloud Feedbacks in Models
Change in cloud radiation effects due to 2 x CO2
warming is completely inconsistent between models!
figure from Ringer et al. (2006)
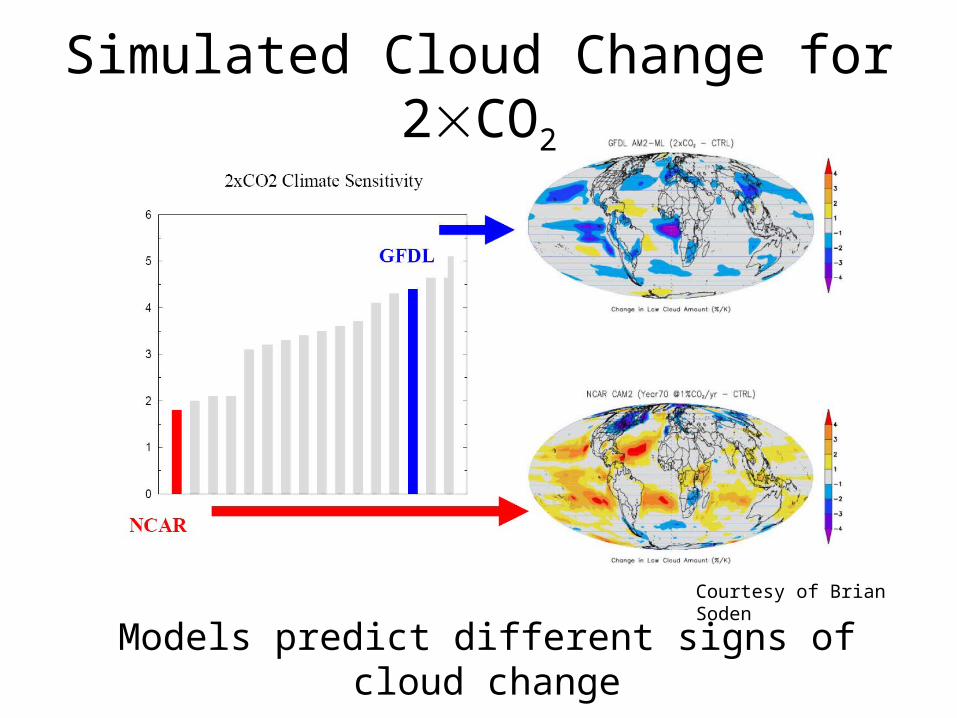
Models predict different signs of cloud change
Simulated Cloud Change for 2CO2
Courtesy of Brian Soden

Numerical Models
• Global climate models do not correctly and consistently simulate cloudiness and its radiative effects
• Model climate sensitivity (warming per CO2 increase) depends most on what is understood least (cloud parameterizations)

Observations

Cloud Observations
• Surface visual observations of clouds have had a consistent (?) identification procedure since 1950
• Semi-standardized observations of clouds from weather satellites are available since the early 1980s
• Observing systems are designed for monitoring weather, not climate – no built-in long-term stability!

Surface and SatelliteCloud

Low-level cloudiness is the largest contributor to the
apparent artifact in total amount (not shown).
Satellite Cloud Record

Low-level cloudiness is the largest contributor to the
apparent artifact in total amount (not shown).
Satellite Cloud Record

Statistical Correction to Data
before after

Cloud Observations
• Surface and satellite cloud records are dominated by spurious variability
• Observational uncertainty is much larger than the magnitude of significant radiative impacts on climate
• Statistical correction of data can provide more realistic regional variability
• Very precise after-the-fact calibration must be applied to satellite observations to produce a climate-ready dataset

Marine Boundary Layer Clouds

Low-Level Cloud and Net Radiation
Low-level clouds and especially marine stratocumulus cool the planet (solar reflection by clouds greater than greenhouse effect of clouds)
Cloud with tops below 680 mb (less than 3 km)
Hartmann et al. 1992

Subtropical Marine Boundary Layer
sea surface
temperatureinversion
moistboundarylayer
dryfreetroposphere
cloudlayer
subcloudlayer
Td T
500 to2000 m
50+ m

Subtropical Marine Boundary Layer
sea surface
temperatureinversion
moistboundarylayer
dryfreetroposphere
cloudlayer
subcloudlayer
ws < 0subsidence
divergence
entrainment
we
ws = 0
subsidence entrainment

Subtropical Marine Boundary Layer
sea surface
temperatureinversion
moistboundarylayer
dryfreetroposphere
cloudlayer
subcloudlayer
subsidence
divergence
entrainment
drying and heating
moistening and heating
radiative cooling
advection frommidlatitudes
entrainmentdrying + drizzle
entrainment +surface warming
radiative +advective cooling
surface moistening
drizzle loss

Subtropical Marine Boundary Layer
sea surface
temperatureinversion
moistboundarylayer
dryfreetroposphere
cloudlayer
subcloudlayer
subsidence
divergence
entrainment
drying and heating
moistening and heating
radiative cooling
buoyancygeneration
entrainment +dissipation
negativebuoyancy
positivebuoyancy
convection andturbulent mixing
advection frommidlatitudes
drizzle loss

Boundary Layer Structure and Clouds
surface
inversion
cloudlayer
surfacelayer
qt e
well-mixedboundary layer
Stratocumulus
eqt
Cumulus
conditionallyunstable
boundary layer
stablelayer
qt e
cloud layerdecoupled from
surface layer
Cu-under-Sc

Recent Results
collaborators: Amy Clement and Robert Burgman

NE Pacific Decadal Variability
Does a cloud feedback promote decadal variability in sea surface temperature and circulation?

Line- total cloud
Bars- low cloud
NE Pacific Decadal Variability
warm sea surface temperatureweak sea level pressure
weak wind(corrected for artifacts)
less stratocumulus cloudmore ocean heating
less boundary-layer cooling

NE Pacific Decadal VariabilityBasin-wide regression on NE Pacific SST time series

models with wrong sign r(cloud,SST)
Correct signr and robustsimulation
Observed rNE Pacific cloud and meteorology
Is this feedback present in IPCC AR4 models?
models with wrong sign r(cloud,LTS)
wrong sign r(cloud,SLP)
wrong sign r(cloud,500)

HadGEM1 2CO2 ChangeObserved Decadal 2CO2 Simulation
cloud change
2CO2 cloud and circulation changes
resemble observed decadal
cloud and circulation changes

Circulation and Cloud Feedbacks
• On decadal time scales, decreased stratocumulus cloud cover is associated with warmer sea surface temperature and weaker atmospheric circulation
• Likely regional positive cloud feedback on decadal timescales due to solar warming of ocean and reduced cooling of atmospheric boundary layer
• Only one robust IPCC AR4 model reproduces correct sign for all 5 cloud-meteorological correlations
• This model exhibits stratocumulus decrease and weaker circulation for 2CO2 that resembles observed pattern

Conclusion
Cloud feedback on climate is a challenging problem but progress is slowly being made

Recommendations
• We need a stable observational system to monitor global cloudiness and radiation on decadal time scales
• We need greater integration between observations, numerical modeling, and theory (inside and outside of parameterizations)
• We need comprehensive quantitative understanding of cloud and meteorological co-variability in observations and models
• We need new ideas!

Thank You!