Embed Size (px)
Citation preview

Cloture Reform Reconsidered
Eric Schickler† Gregory Wawro‡
October 29, 2003
Abstract : This paper investigates the impact of the adoption of cloture by the U.S. Senate in
1917, assessing the degree to which the rule affected lawmaking in the institution. We develop
a simple model which helps to explain the puzzle behind why senators chose a supermajority
cloture rule when it was generally possible to pass legislation by narrower majorities prior to
1917. The empirical predictions of the model are borne out in an analysis of coalition sizes on
significant legislation. We also examine the effects that the cloture rule had on the ability of
the Senate to process appropriations bills in a timely manner. Our analysis, which accounts
for other important institutional changes that occurred during the period under investigation,
indicates that the cloture rule promoted efficiency in the appropriations process. Our general
conclusions refute the conventional wisdom that cloture was merely a symbolic reform with
little substantive impact.
Acknowledgments : The authors gratefully acknowledge the comments and suggestions of
Charles Cameron, Ira Katznelson, and Charles Stewart. Prof. Stewart was particularly
generous in his sharing of data for this project. We are also grateful to Mike Murakami,
Kathryn Pearson, Vanessa Perez, and John Sides for valuable research assistance.
† Professor, Department of Government, Harvard University,
‡ Associate Professor, Department of Political Science, Columbia University,

1 Introduction
This paper investigates the impact of the adoption of cloture by the U.S. Senate in 1917,
assessing the degree to which the rule affected lawmaking in the institution. There are widely
divergent opinions about the actual impact of the cloture rule, which required a two-thirds
supermajority to cut off debate and bring items to a vote. On the one hand, some—mainly
at the time of its enactment—supported it as a meaningful reform that addressed the serious
problems created by the lack of rules limiting debate in the Senate. On the other hand, some—
mostly after its enactment—claimed that it was ineffective, amounting to little more than a
symbolic response to the intense public pressure that senators felt as a result of the successful
obstruction of a popular bill. The main goal of this paper is to adjudicate among these different
perspectives on cloture reform.
In previous work, we found that prior to the adoption of cloture, the Senate was for the
most part a majoritarian body (Wawro and Schickler 2003). The main exception was that
larger coalitions appeared to have been necessary to overcome obstruction toward the end of
a congress in lame duck sessions, when time severe constraints gave minorities a particular
advantage. Given the success that slim majorities had in passing legislation prior to 1917, it
is puzzling why senators adopted a cloture rule that required coalitions to be larger than what
was generally necessary at the time. We develop a model that shows how senators might have
benefited from a supermajority procedure for shutting off debate even though it was still possible
to pass legislation with narrower majorities. The model also shows how the rule could have had
an impact even though senators rarely resorted to it. We consider how legislative entrepreneurs
might trade off a decrease in the uncertainty of passage of legislation for an increase in the size of
coalitions necessary to pass it. The model is tested by examining coalition sizes on the passage
of significant legislation (and on appropriations bills). We also consider how the adoption of
cloture affected the efficiency of the Senate in processing appropriations bills, which was a major
area of concern when it came to the lack of rules limiting debate. We find evidence that cloture
was more than just a symbolic reform and did have a real and discernible impact on lawmaking
in the Senate.
1

2 Alternative Views of Cloture Reform
Even though the 1917 cloture rule was far from the previous question rules that existed in
the House of Representatives and many other legislatures (Luce 1922), some observers at the
time thought it would be an effective solution to the problems presented by unlimited debate.
The Washington Post claimed that, as a result of the amendment to the rules, “The organized
filibuster of a few men as recognized in the Senate is dead.”1 While acknowledging that the rule
“probably cannot be successfully used to prevent the spectacular one-man filibusters by which
senators have talked bills pending in the closing hours of a session to a legislative grave” unless
they are foreseen, the Post contended that “an organized affair which must be planned two days
or more ahead of a session’s end can be disposed of easily.” The New York Times argued that
“It is difficult to overestimate the importance of the new rule, both on measures of immediate
interest and on the general course of legislation,” adding that “the real importance of the rule
lies in its almost unlimited potential effect on future legislation” (Mar. 9, 1917, p. 1). In the
floor debate on the amendment to Rule 22, a few senators even argued that the rule change
would be too effective, limiting debate to such a degree that it would diminish the Senate’s role
in the separation of powers system (New York Times, Mar. 9, 1917, p. 1).
Woodrow Wilson, who is largely credited with mobilizing mass opinion to bring about the
adoption of cloture, is reported to have “expressed warm support for the proposal” (New York
Times, Mar. 8, 1917, p. 2). Wilson’s reaction is telling. Wilson had gone to unprecedented
lengths for a president to vilify senators on the issue of the filibuster, launching an all out
public relations campaign against those who defeated the armed ship bill and the rules of the
Senate that allowed them to do so. For example, at a luncheon for the Democratic National
Committee at the White House, Wilson “threw aside all reserve in expressing his opinion of those
Senators who blocked passage of the Armed Neutrality bill.” The New York Times characterized
Wilson’s remarks as an “outburst” that “both surprised and pleased” the attendees, as the
president “castigated those Democrats who joined with Republicans in the Senate to embarrass
the Administration at a time when the highest order of patriotism was necessary to enable the
Government to cope with a delicate situation” (Mar. 7, 1917, p. 1). The fact that Wilson did
1“Senate Votes Rule to End Filibusters,” March 9, 1917, p. 1.
2

not push for a more stringent rule suggests he thought it would be effective.2
In the aftermath of the cloture reform of 1917, the rule has been almost universally denigrated
by some of the wisest and most learned students on the Senate. Byrd (1988, 124) claims that
as early as November 1918, “it was becoming clear that the cloture rule was not going to
be effective.” White (1968, 60–61) argued that “the rule bore within itself the seeds of its
own nullification” because it applied only to halt debate on a “measure” but not a “motion.”
Although the Senate reformed its rules in 1949 to apply the cloture rule to motions as well as
measures, because this was part of a compromise that raised the threshold to change the rules
to two-thirds of the entire Senate, it meant that “cloture was in practical fact at least as far off
as ever, and the Senate in plain fact retained what amounts to unlimited debate” (White 1968,
64). Rogers (1926, 177) argued that the cloture procedure was “so cumbersome as to be possible
only in emergencies.” Luce (1922, 295) also expressed doubts about the rules effectiveness, since
“very rarely does either party control two thirds of the votes of the Senate.” Haynes’ (1938,
v. 1, 420) views on the impact of cloture in the decade after it was adopted are mixed, but he
nevertheless claims that the rules still lent themselves to “practices which have been injurious
to legislation and have greatly discredited the Senate in the opinion of the public,” and noted
that there were “hopeful signs of co-operation to remedy these evils.” In an interesting point
which he does not develop but which we will come back to, Haynes’ (1938, v. 1, 405) argues
that “the efficacy of this rule for the most part inheres in the consciousness that it is available
rather than in its actual use.” The gist of these views is that legislation that could be killed
with a filibuster before the reform could still be killed by a filibuster after the reform.3
Other critics of the cloture rule note the infrequency with which it was applied at all, let
alone applied successfully. From the 66th to the 86th Congresses (1919-1960), only 23 cloture
votes took place, and of those, only 4 were successful (Oppenheimer 1985, 398). Between 1927
and 1962, the Senate had an unbroken string of unsuccessful cloture votes—14 in all. By these
measures, the 1917 rule did not appear to arm senators with a practicable weapon against
obstruction.
If these views are correct, why did senators even bother to amend Rule 22? To be sure,
2Or at least his expected utility for this proposal appears to have been greater than what he would have
obtained from pushing a majority cloture proposal, since the chances of such a proposal passing were much less.3See also Dion 1997 and Koger 2002.
3
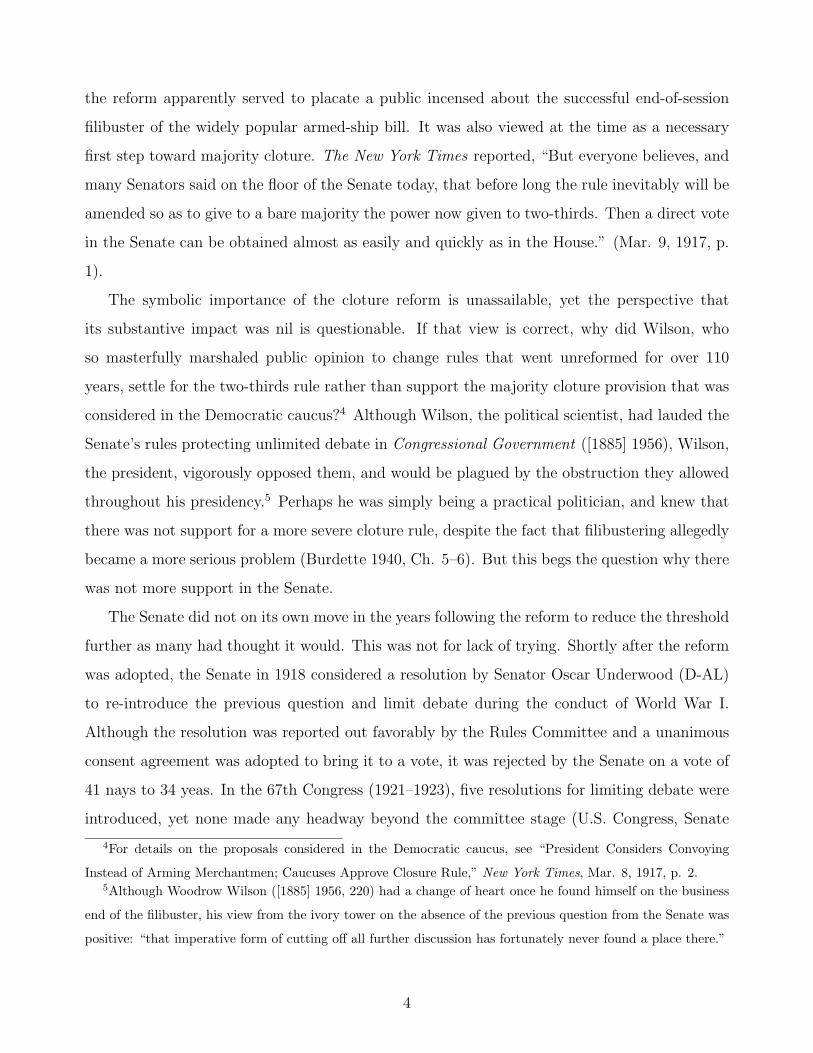
the reform apparently served to placate a public incensed about the successful end-of-session
filibuster of the widely popular armed-ship bill. It was also viewed at the time as a necessary
first step toward majority cloture. The New York Times reported, “But everyone believes, and
many Senators said on the floor of the Senate today, that before long the rule inevitably will be
amended so as to give to a bare majority the power now given to two-thirds. Then a direct vote
in the Senate can be obtained almost as easily and quickly as in the House.” (Mar. 9, 1917, p.
1).
The symbolic importance of the cloture reform is unassailable, yet the perspective that
its substantive impact was nil is questionable. If that view is correct, why did Wilson, who
so masterfully marshaled public opinion to change rules that went unreformed for over 110
years, settle for the two-thirds rule rather than support the majority cloture provision that was
considered in the Democratic caucus?4 Although Wilson, the political scientist, had lauded the
Senate’s rules protecting unlimited debate in Congressional Government ([1885] 1956), Wilson,
the president, vigorously opposed them, and would be plagued by the obstruction they allowed
throughout his presidency.5 Perhaps he was simply being a practical politician, and knew that
there was not support for a more severe cloture rule, despite the fact that filibustering allegedly
became a more serious problem (Burdette 1940, Ch. 5–6). But this begs the question why there
was not more support in the Senate.
The Senate did not on its own move in the years following the reform to reduce the threshold
further as many had thought it would. This was not for lack of trying. Shortly after the reform
was adopted, the Senate in 1918 considered a resolution by Senator Oscar Underwood (D-AL)
to re-introduce the previous question and limit debate during the conduct of World War I.
Although the resolution was reported out favorably by the Rules Committee and a unanimous
consent agreement was adopted to bring it to a vote, it was rejected by the Senate on a vote of
41 nays to 34 yeas. In the 67th Congress (1921–1923), five resolutions for limiting debate were
introduced, yet none made any headway beyond the committee stage (U.S. Congress, Senate
4For details on the proposals considered in the Democratic caucus, see “President Considers Convoying
Instead of Arming Merchantmen; Caucuses Approve Closure Rule,” New York Times, Mar. 8, 1917, p. 2.5Although Woodrow Wilson ([1885] 1956, 220) had a change of heart once he found himself on the business
end of the filibuster, his view from the ivory tower on the absence of the previous question from the Senate was
positive: “that imperative form of cutting off all further discussion has fortunately never found a place there.”
4

1975, 15).
3 A simple model of cloture
Our reconsideration of the impact of the cloture rule asks whether senators were disinclined to
change the rule because they received enough substantive benefits from it. We develop a model
which shows how senators might have benefited even though they rarely resorted to invoking
the procedure for shutting off debate. The model considers how senators might trade off a
decrease in the uncertainty of passage for an increase in the size of coalitions necessary to pass
legislation. In this sense, cloture may have constituted a kind of insurance policy for risk averse
legislators, which protected them from the risk they faced by considering legislation late in the
session when obstructionists had a particular advantage.
This trade-off can be modeled by considering a legislative entrepreneur’s expected utility
from passing legislation with and without cloture. The legislative entrepreneur (LE) can add
individuals to the coalition, which increases the probability that her proposal will pass, but this
comes at the cost of receiving fewer benefits from the legislation if enacted. The decrease in
benefits can be viewed in terms of having to share with each additional legislator some piece
of a fixed pie. The LE may have to provide a project to a senator’s state which means fewer
funds for projects in the LE’s own state. Or the decrease in benefits may be thought of as an
adjustment of the proposal spatially in a way that moves the policy outcome in a direction closer
to the ideal point of a senator who is hesitant to join the coalition, but away from the LE’s
ideal point. The question becomes how much is the LE willing to compromise on the substance
of the proposal in order to enhance its prospects for passage.
Let η denote coalition size (as a proportion), such that η ∈ [.5, 1]. We restrict η to this
range because values of η below .5 are not relevant for our purposes, since we are interested
only in coalitions that meet the necessary, but possibly not sufficient, threshold of a majority
for passage.6 Define π as the probability of passage of a piece of legislation, and B as the benefit
6We also put to the side cases where ties occur. In these situations, the ties would be broken by the vice
president, but this has little relevance for our main concerns.
5
obtained from passing legislation. Both π and B are functions of η. Specifically, let
π(α) =
(η − .5
.5
)α
(1)
This gives nonlinearly increasing π, with the α parameter indicating how much an additional
coalition member beyond 51% of the chamber contributes to the probability of passage. We
assume α ∈ [0, 1], such that as α approaches 1, the marginal increase in probability from
adding a legislator to the coalition increases. This form for π has properties that are intuitively
appealing for representing the functional relationship between coalition sizes and probabilities
of passage. When η = .50, π = 0 (i.e., you need at least a minimum majority to have any chance
of passing legislation) and when η = 1, π = 1 (i.e., you are assured of passing legislation when
all members of the chamber are part of the supporting coalition). Having a minimum majority
does not guarantee passage because various (unmodeled) factors may affect a bill’s chances for
passage, such as obstruction by opponents or being crowded out by other items on the agenda.
In this initial model, we let
B =1 − η
.5(2)
This gives linearly decreasing B, such that B is maximized at a coalition of .51 and B = 0 when
the coalition is unanimous. We also assume B = 0 if the legislation fails to pass.
The expected utility for the LE can then be written as
EU = πB + (1 − π)0 = πB (3)
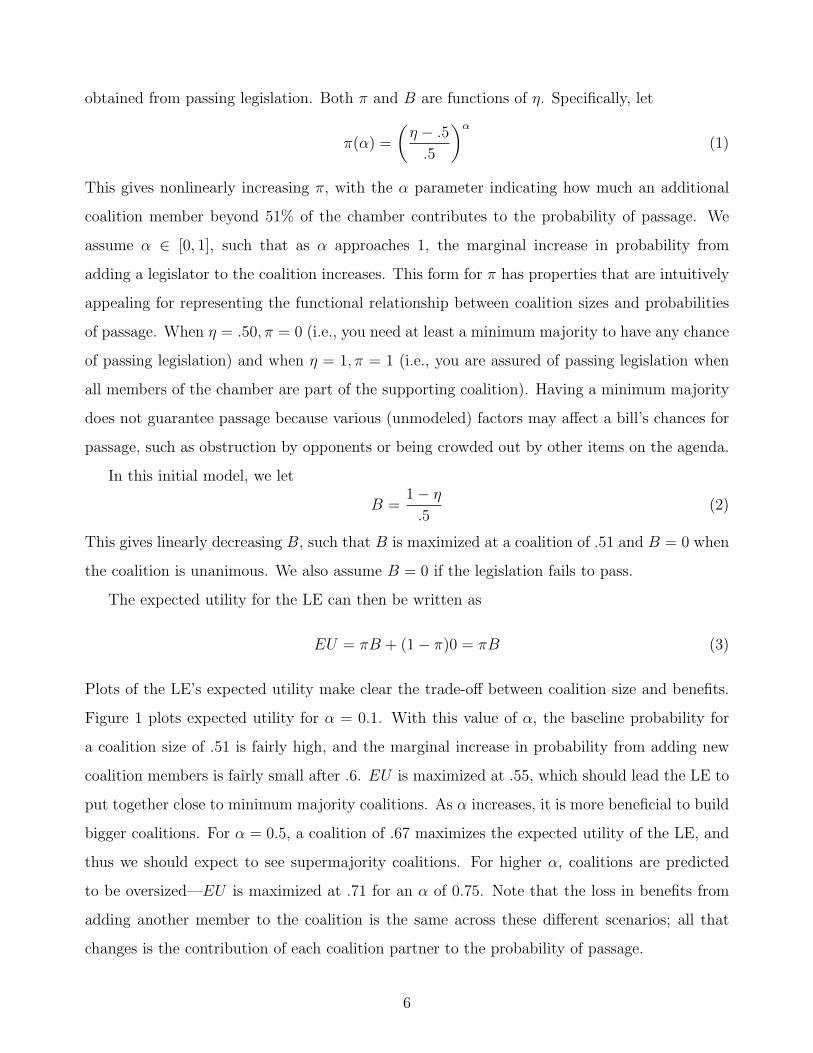
Plots of the LE’s expected utility make clear the trade-off between coalition size and benefits.
Figure 1 plots expected utility for α = 0.1. With this value of α, the baseline probability for
a coalition size of .51 is fairly high, and the marginal increase in probability from adding new
coalition members is fairly small after .6. EU is maximized at .55, which should lead the LE to
put together close to minimum majority coalitions. As α increases, it is more beneficial to build
bigger coalitions. For α = 0.5, a coalition of .67 maximizes the expected utility of the LE, and
thus we should expect to see supermajority coalitions. For higher α, coalitions are predicted
to be oversized—EU is maximized at .71 for an α of 0.75. Note that the loss in benefits from
adding another member to the coalition is the same across these different scenarios; all that
changes is the contribution of each coalition partner to the probability of passage.
6

Figure 1: Expected utility of passage (— π; · · ·B; - - - πB)
0.5 0.6 0.7 0.8 0.9 1.0
0.0
0.2
0.4
0.6
0.8
1.0
α = 0.1
Coalition size
Prob
abilit
y of
pas
sage
/exp
ecte
d ut
ility
0.5 0.6 0.7 0.8 0.9 1.0
0.0
0.2
0.4
0.6
0.8
1.0
α = 0.25
Coalition size
Prob
abilit
y of
pas
sage
/exp
ecte
d ut
ility
0.5 0.6 0.7 0.8 0.9 1.0
0.0
0.2
0.4
0.6
0.8
1.0
α = 0.5
Coalition size
Prob
abilit
y of
pas
sage
/exp
ecte
d ut
ility
0.5 0.6 0.7 0.8 0.9 1.0
0.0
0.2
0.4
0.6
0.8
1.0
α = 0.75
Coalition size
Prob
abilit
y of
pas
sage
/exp
ecte
d ut
ility
7

One way to think about the 1917 cloture rule is that it makes the probability function
π jump upward at η = .67. That is, building a coalition that exceeds the supermajority
threshold specified by the rule makes it sharply more probable (although not certain) that the
legislation will pass. By building a supermajority coalition, LEs insure themselves against some
of the malevolent vicissitudes of the legislative process. Should a filibuster develop against the
legislation, the LE has the votes to invoke cloture. However, being able to invoke cloture does
not guarantee that the legislation will pass, since obstructionists may be able to run out the
clock depending on how much time is left in the legislative session and how many other pieces
of legislation that are more salient to legislators remain to be addressed.
In the presence of the cloture rule, the expected utility would be
EUC = π(α)B · 1[η < .67] + π(α∗)B · (1 − 1[η < .67]) (4)
where 1[·] is the indicator function and α∗ < α, which serves to scale up the probability, making
it more likely for the bill to pass if the coalition supporting it exceeds the two-thirds threshold.
Plots are again useful to illustrate the logic. Figure 2 shows the effects of cloture for different
values for α and α∗. When α = .1, there is very little gain from having a 2/3rds cloture rule.
The jump that occurs in π does not produce a big enough increase in πB to exceed the maximum
that existed without cloture.
However, for the other values of α∗, the maximum of πB is greater than the maximum
without cloture. When α = .25 and α∗ = .1, an LE realizes a gain in expected utility when she
increases the size of her coalition to 2/3rds. The prediction for this situation then is a larger
coalition than what the LE would have put together without a cloture rule. When α = .5 and
α∗ = .25, we do not expect to see any difference in the LE’s behavior. Her utility is maximized
with a two-thirds coalition now as it was before. The model predicts a decrease in coalition
sizes when α = .75 and α∗ = .5, since the maximum of the expected utility function drops to
.67 with cloture, down from .71.
While it is difficult to tell which situations best characterize lawmaking in the late 19th and
early 20th century, the analysis of significant legislation and tariff bills in Wawro and Schickler
(2003) indicates that the one represented by α in the vicinity of .25 was fairly common. There
are numerous cases where legislation passed with coalitions below the threshold established by
the 1917 cloture rule. The increase in the average of coalition sizes after the adoption of cloture
8

Figure 2: Expected utility of passage with a 2/3rds cloture rule (— π; · · ·B; - - - πB)
0.5 0.6 0.7 0.8 0.9 1.0
0.0
0.2
0.4
0.6
0.8
1.0
alpha* = 0.05
Coalition size
Prob
abilit
y of
pas
sage
/exp
ecte
d ut
ility
0.5 0.6 0.7 0.8 0.9 1.0
0.0
0.2
0.4
0.6
0.8
1.0
alpha* = 0.1
Coalition size
Prob
abilit
y of
pas
sage
/exp
ecte
d ut
ility
0.5 0.6 0.7 0.8 0.9 1.0
0.0
0.2
0.4
0.6
0.8
1.0
alpha* = 0.25
Coalition size
Prob
abilit
y of
pas
sage
/exp
ecte
d ut
ility
0.5 0.6 0.7 0.8 0.9 1.0
0.0
0.2
0.4
0.6
0.8
1.0
alpha* = 0.5
Coalition size
Prob
abilit
y of
pas
sage
/exp
ecte
d ut
ility
9

that we found in previous work is consistent with this view. While we acknowledge that other
factors may have contributed to this increase, no one has yet offered a theoretical framework
that explicitly demonstrates how these factors operate.
Another important point which emerges from the model is that the number of times cloture
was sought and invoked successfully are not necessarily good indicators of the impact of cloture
reform (cf. Beth 1995). Once the cloture rule establishes a threshold for passage, expected-
utility maximizing LEs have a clearer target to aim for and should adjust their coalition-building
behavior accordingly. In many cases, this will mean building bigger coalitions in an attempt
to preempt obstructive efforts. Would-be obstructionists have less incentive to filibuster if they
know that cloture can be invoked on them. While there may be symbolic benefits to filibustering,
the price that legislators have to pay to engage in this activity in terms of effort and opportunity
costs may be too dear if there is a good chance the filibuster will be defeated without changing
policy substantively. Thus, the cloture rule alters the strategic calculations of legislators so
that LEs should build bigger coalitions in order to head off potential filibusters, and those who
might have engaged in obstruction before instead channel their resources into other activities
that have more promise of a substantive return. In this sense, we agree with Haynes’ assessment
that the cloture rule was efficacious because legislators knew they could credibly resort to it if
they built large enough coalitions, not because they actually had to apply it.
An additional prediction that arises from the model is that the variance of coalition sizes
should decrease after the adoption of cloture. This would hold if values of α > .25 generally
represent the lawmaking situations that LEs face, and if members in a specific situation know
the distribution—but not actual value—of α. We believe that such uncertainty is particularly
likely near the end of a congress. The time constraints imposed by the March 3 deadline and
the rush to address pending items should have made it more difficult for LEs to ascertain how
much support was necessary to gain passage. The availability of the cloture procedure reduced
this uncertainty.
Coalition sizes on significant legislation offer a way to test this prediction. While the change
in the first moment in the distribution of coalition sizes noted above supports our theoretical
conjectures, if the point about uncertainty is correct, then we should also see a change in the
second moment. That is, the variance of coalition sizes on significant legislation should be
10

smaller after 1917 than it was prior to enactment of the cloture rule.
The data do support this prediction, although we need to be careful about our inferences due
to small sample sizes. As reported in Table 1, the variance of coalition sizes in lame duck sessions
prior to cloture reform was 0.017 (for 6 bills), but then dropped slightly to 0.013 (for 4 bills)
after cloture reform. Although this difference is small, a nonparametric test of equal variances
based on squared ranks, which is particularly well-suited for samples of this size (Conover 1999,
300–303), indicates the difference in variances is significant at the .1 level.7 By contrast, the
variances for important legislation considered early in a congress are identical for the pre- and
post-cloture periods. If we include voice votes taken at the end of a congress and treat them
as unanimous, this increases the sample size to 21 in the pre-cloture period (with coalition size
variance equal to .025) and 8 in the post-cloture period (with coalition size variance equal to
.01). The nonparametric test with the larger sample size also leads us to reject the null of
equal variances (at the .01 level).8 These results are consistent with the argument that a goal
of cloture reform was to reduce the uncertainty created by obstruction toward the end of a
congress.
A similar pattern occurs with votes on appropriations bills. The variance of coalition sizes
on appropriations bills considered in lame duck sessions was 0.023 (for 6 bills) in the pre-cloture
era and 0.015 (also for 6 bills) in the post-cloture period. The Conover test indicates that we
can reject the null of equal variances at the .05 level. We consider the analysis of appropriations
bills to be confirmatory, but we note that the small number of bills on which roll call votes
occurred raises concerns about the selection process by which recorded votes instead of voice
votes were held. We undertake a much more detailed analysis of the effects of cloture on the
appropriations process in the next section.
This analysis helps to illustrate the logic behind the cloture rule. Exploring a wider range of
parameter values for the theoretical model will shed further light on the behavioral implications
of the reform. Introducing other elements more explicitly, such as factors related to agenda size
and workload, would make the model more realistic, and may produce more nuanced predictions
about the impact of cloture reform. Still, the evidence we offer indicates the predictive power
7The nonparametric test is more appropriate for this sample than is the standard F test, which relies on
asymptotic properties.8If we treat voice votes as being near-unanimous (i.e., .9), the same results obtain.
11

Table 1: Test of equal variances for coalition sizes on major legislation con-sidered near the end of a congress, 1881–1946
Roll call votes only Roll call and voice votes
Pre-cloture Post-cloture Pre-cloture Post-cloture
N 6 4 21 8
Variance 0.017 0.013 0.025 0.01
Test Statistic∗ 138 –2.26
Significance Level .1 .01
Notes: ∗ The test statistic for roll call votes only is T defined by Conover(1999) on p. 301. The statistic for roll call and voice votes is T1 (de-fined on the same page), which is used because of ties in the rankings ofcoalitions sizes.
of this simple model.
It is important to note that other theories exist which offer explanations for supermajority
coalitions. These theories show how governing by supermajorities, while undoubtedly more bur-
densome, has potential advantages. Groseclose and Snyder (2000) demonstrate formally that a
vote buying strategy that involves putting together supermajorities can be less costly than a
strategy of building minimal winning coalitions. Caplin and Nalebuff (1988) show that majori-
ties of 64% (or greater) can solve problems of cycling and unraveling of legislative bargains. Yet
these theories do not offer explanations as to why we would observe the variation in coalition
sizes that exists historically.
4 The Impact of Cloture on the Appropriations Process
We pursue this issue further by examining the effects of cloture on the appropriations process in
the Senate. The failure to pass appropriations bills, especially due to obstruction, was a major
concern of senators in the period under examination. They perennially confronted the problem
of passing appropriations before the fiscal year expired, which was necessary to keep the federal
government operating.
In debates about obstruction, concerns about appropriations were constantly expressed. In
his campaign in 1925 against the rules that allowed filibusters, Vice President Charles Dawes
asked whether “the power to kill legislation providing the revenues to pay the expenses of
12

government should, during the last few days of a session, ever be in the hands of a minority, or
perhaps one senator? Why should they ever compel the President of the United States to call
an extra session of Congress to keep in functioning activity the machinery of the Government
itself.” (Cong. Rec, 69th Cong., special session, pp.3–4). According to Haynes (1938, v. 1,
395), “appropriations bills engrossed so much of the Senate’s time that the necessity of some
limitations on debate first became convincing in regard to them.” The death of appropriations
bills at the hands of obstructionists often prompted calls for cloture reform. For example, a
cloture proposal introduced by Senator Platt (R–CT) in 1901 was alleged to be in response to
the successful filibuster of a Rivers and Harbors appropriations bill in the previous congress
(New York Times, March 6, 1901, p. 5). Rogers (1926, 183–184) argued that the power of the
filibuster came through its effects on the appropriations process: “It is through their ability to
hold up the appropriation bills that a filibustering minority can win a victory.” It is important
to note that these concerns were not just about filibusters of appropriations bills, but also about
how filibusters of any legislation would affect the Senate’s ability to pass spending measures.9
The filibuster that defeated the armed-ship bill took with it several regular appropriations bills
and a general deficiency bill, which amounted to about $511,000,000 worth of lost funds (New
York Times, March 5, 1917).
The uncertainty that filibusters presented to the appropriations process was a major concern
of efforts to reform Senate procedure. If our arguments about the cloture rule serving as an
uncertainty-reducing mechanism are correct, then this should be reflected in the Senate’s ability
to process appropriations bills. We investigate whether the cloture rule led to increased efficiency
in the appropriations process by more clearly prescribing a threshold for bringing debate to an
end and legislation to a vote.
An examination of Senate action on appropriations is important beyond our interest in
filibuster politics because, while several studies have undertaken historical analyses of the ap-
propriations process in the House (e.g., Stewart 1989 and Kiewiet and McCubbins 1991), the
process in the Senate has received little scholarly attention. In part due to its constitutionally-
privileged role in the process, the House has been seen as the dominant congressional partner in
9Indeed, one of the reasons that the opposition to Jefferson Smith’s filibuster in Mr. Smith Goes to Wash-
ington was so fierce was that it was preventing the passage of an urgently needed deficiency appropriations
bill.
13

spending decisions. The Senate is seen as reactive, serving as a “court of appeals,” for claimants
on the federal treasury who seek more funds than what are provided in the legislation initially
passed by the House (Fenno 1966). Yet the role of the Senate in the appropriations process is
far from secondary. This paper helps to illuminate the part that the Senate’s unique rules and
procedures have played in spending decisions and the ability of the federal government to meet
its fiscal obligations.
Studies of obstruction have paid little attention to its effects on congress’s power over the
purse strings of government. Yet one of the factors that is most important for understanding
obstruction—time constraints—are particularly relevant for spending bills. Appropriations pre-
sented deadline problems beyond those associated with lame duck sessions. The beginning of
the fiscal year, which occurred on July 1st during the period we examine, required that appro-
priations bills be passed by then for the government to meet its fiscal obligations and maintain
operations. Congress would typically not be in session when the deadline for the new fiscal
year passed for fiscal years that began in odd-numbered years. After adjourning on March 3 in
odd-numbered years, Congress would usually not meet again until December of that year. That
meant that Congress had to pass appropriations bills by the March 3 adjournment date if it was
to provide funds before the new fiscal year started.10 Since Congress did not start considering
appropriations bills for even-numbered fiscal years until the lame duck sessions, this made time
constraints especially relevant.11
For fiscal years that began in odd-numbered years, Congress would typically be in session as
the previous fiscal year came to a close but often still struggled to complete work on spending
bills. In fact, Congress was less likely to meet the fiscal year deadline for these years. Perhaps
they were less concerned with meeting the deadline because they knew that they would still
be in session after the deadline passed. But failure to meet the deadline would still mean that
the relevant government entities would run out of money to fund their operations and Congress
would have to go through the effort of passing continuing appropriations in addition to regular
10Special sessions could have been called to pass bills that failed of enactment before the deadline. While the
Senate would often meet in special sessions shortly after the previous congress has adjourned in order to process
presidential nominations, members of Congress were particularly averse to holding these kind of sessions to do
general legislating.11Even-numbered fiscal years started on July 1st of odd-numbered calendar years.
14

appropriations to keep them functional.
We posit that the cloture rule should have made the Senate better able to meet the relevant
deadlines that it faced for passing spending bills. Although cloture was rarely invoked, we have
presented evidence that senators built bigger coalitions after the rule was adopted, possibly
with the intention of preempting filibusters. If such preemption was occurring, then it should
have been easier for the Senate to pass appropriations in a timely manner. We can investigate
systematically whether or not this is the case.
However, such an analysis needs to be sensitive to other institutional changes that might
have affected the appropriations process during this period. These include some of the most
important institutional changes involving the appropriations process in Congress’s history. The
two main changes include the passage of the Budget Act of 1921 and the decentralization and
recentralization of committee jurisdictions over appropriations.
While studies that focus on the appropriations process in the House and how these institu-
tional changes affected it are plentiful, almost no systematic research has been conducted on
the appropriations process in the Senate during this period—or for subsequent periods for that
matter. Fenno’s (1966) landmark work, The Power of the Purse, is one of the only studies
that has examined the process in the Senate in any depth. Although Fenno’s analysis is fairly
time-bound, covering the Senate only in the mid-20th century (1947–1965), a few major themes
emerge from his work that have theoretical relevance for the study of obstruction in earlier
periods and point to important factors that any empirical model of the appropriations process
should account for. It is important then to assess whether the features that Fenno saw as central
to the process in the Senate in the mid-20th century mattered in earlier periods.
One of Fenno’s major conclusions was that the most important part of the appropriations
process was the committee stage. This is not to say that later stages were unimportant, but
the overall parameters of debate and deliberation were set in committee, and primarily in the
House Appropriations Committee (HAC). The Senate Appropriations Committee (SAC) is also
important in the process, but less so than HAC. A key differences between HAC and SAC,
however, concerns the relationship between the committees and their parent chambers. The
relationship between HAC and its parent chamber was characterized by tension, predominantly
because of the committees’ exclusivity, isolation, and tight-fisted control over the government’s
15

purse strings. Many members expressed complaints about HAC’s declining to fund projects or
programs that they felt were meritorious, or at the very least electorally beneficial.
The relationship between SAC and its parent chamber was much more cordial. One of the
main factors Fenno thought explained this difference had to do with the greater openness of
the committee and the fact that SAC was more representative of the parent chamber because a
higher percentage of the chamber had seats on the committee. This made the committee much
more accessible and rendered committee and chamber preferences over appropriations much
more consonant than in the House. To paraphrase Fenno (1966, 614), “SAC is the Senate.”
This observation has theoretical relevance for our investigation of the Senate’s ability to
process appropriations. The greater representativeness of SAC should lead to less conflict on
the Senate floor, since the bill that the committee reports is more likely to be in line with
the preferences of non-committee members. Although the standard rules of floor debate grant
substantial leeway to non-committee members to amend or obstruct SAC’s proposals, it may
be that senators see little need to do so because of their agreement with the committee. The
greater representativeness of SAC could mean that it better anticipates what latent obstructors
would object to once the bill reaches the floor and preempt them by making adjustments to the
bill in committee.
This raises two important questions about SAC during the period we are interested in:
First, how representative was SAC? Second, to what extent were the committees’ proposals
amended on the floor? The answers to these questions are complicated due to shifts in committee
jurisdictions over spending bills that occurred in 1899 and 1922. In 1899, the Senate carved up
most of SAC’s jurisdiction and redistributed it to other committees. A similar devolution had
taken place in the House in 1885 (Brady and Morgan 1987; Stewart 1989). This decentralization
of appropriations stood in contrast to the centralizing efforts of party leaders that took place
about the same time (Rothman 1966). The institutional change was largely driven by younger,
less senior senators who sought more power over the Senate’s proceedings (Schickler 2001;
Schickler and Sides 2000). The effects of the decentralization in terms of which committees
were given the authority to report appropriations bills are displayed in Table 2.
In early March 1922, the Senate reversed course and reinstated SAC’s jurisdiction over
all spending bills. However, committees that had appropriations jurisdiction after the 1899
16

Table 2: Senate Appropriations Decentralization of 1899
Appropriation bill title Committee of jurisdiction
Agriculture Agriculture and Forestry
Army Military Affairs
Diplomatic and consular Appropriations
District of Columbia Appropriations
Fortification Appropriations
Indian Indian Affairs
Legislative, etc. Appropriations
Military Academy Military Affairs
Navy Naval Affairs
Pension Committee on Pensions
Post office Post Offices and Post Roads
River and harbor Commerce
Sundry civil Appropriations
Source: Congressional Record, January 29, 1899, p.1212
divestiture were allowed to have three members serve ex officio on SAC when bills that had
been on their legislative committee’s turf were under consideration at SAC. They also could
send one conferee to take part in conference committee deliberations.12 The ex officio provision
contributed considerably to the representativeness of SAC that Fenno reported.
One of the questions for our analysis then becomes to what degree were the committees
that received parts of SAC’s jurisdiction representative of the larger chamber? The question
of the representativeness of committees, especially those that craft spending bills, has garnered
considerable attention in the congressional literature. Proponents of the distributive perspective
of legislative organization contend that committees are generally unrepresentative of their parent
chambers. According to this work, committees consist of homogeneous preference outliers, which
is the result of a system of self-selection to committees that enables those with the greatest
electoral stake in the committees’ jurisdictions to obtain their preferred assignments (Shepsle
12The District of Columbia committee was also granted this right. The ex officio provision was in effect until
1974, during which time Congress again dramatically changed the appropriations process with the passage of
the Budget and Impoundment Control Act.
17

1978, 1979; Shepsle and Weingast 1987; Weingast and Marshall 1988). This view has been
challenged by both the informational and partisan perspectives of legislative organization. The
former argues that committees should be microcosms of the parent chamber in order to facilitate
the communication of policy-relevant information (Krehbiel 1991), while the latter argues that
committees should be representative of the (majority) party caucus, so that committees will be
more effective and loyal agents of the party (Cox and McCubbins 1993; Kiewiet and McCubbins
1991). This dispute launched many empirical efforts using different measurement approaches to
try to determine just how representative committees are (Krehbiel 1990; Groseclose 1994; Hall
and Grofman 1990; Maltzman 1997).
The studies of representativeness have focused mainly on the post-World War II period.
Unfortunately, we are limited by existing data with regard to how we can address the issue
of SAC’s representativeness in earlier periods. Most importantly, existing data on committee
rosters for the period under investigation does not include the names of the ex officio members
of SAC. This precludes us from determining without substantial error the ideological makeup of
the panels making spending decisions. However, since we know the number of ex officio mem-
bers from each of the legislative committees, we can compute the percentage of the chamber
that participate in SAC deliberations. While this measure is undoubtedly a crude one, it seems
to fit well with the notion of representativeness that Fenno discussed, long before more sophisti-
cated measures of committee ideology were developed. The key idea of inter-locking committee
memberships is still tapped by this measure, and addresses our concern about committee-floor
conflict on appropriations bills.
Figure 3 displays time series for the percentage of the Senate’s membership that was involved
in spending decisions for various appropriations bills. While there was a general upward trend in
the representativeness of the funding committees by this measure, the greatest increase occurred
with the recentralization of appropriations. Of the bills that spanned the Budget Reform Act of
1921, the increase in senators involved at the committee stage increased by about 20 percentage
points. Thus, the inter-locking memberships that Fenno discussed appear to have extended
back to the recentralization, and given the close proximity of this institutional change to the
the enactment of cloture, it is imperative to account for these changes to the committee system
in our analysis.13
13Committee overlap did exist to an extent before the creation of ex officio seats on SAC. Several legislative
18

Figure 3: Percentage of Senate and House involved in appropriations decisions (— Senate
percentage; −−− House percentage)
50 55 60 65 70 75 80
1030
Agriculture
Congress
% o
f cha
mbe
r on
com
mitt
ee
55 60 65
510
20
Army and Military Academy
Congress%
of c
ham
ber o
n co
mm
ittee
55 60 65
48
12
Indian
Congress
% o
f cha
mbe
r on
com
mitt
ee
50 55 60 65 70 75 80
1030
Navy
Congress
% o
f cha
mbe
r on
com
mitt
ee
55 60 65
48
12
Pensions
Congress
% o
f cha
mbe
r on
com
mitt
ee
55 60 65
515
30
Post Office
Congress
% o
f cha
mbe
r on
com
mitt
ee
50 55 60 65 70 75 80
1030
Non−devolved bills
Congress
% o
f cha
mbe
r on
com
mitt
ee
19

By comparison, the percentage of House members involved in appropriations decisions at the
committee stage was much smaller both before and after the recentralization in that chamber.
The legislative committees that lost jurisdiction to HAC when appropriations were recentralized
in 1920 were not compensated as in the Senate, resulting in much grumbling and resentment of
the committee (Stewart 1989, 205). As a consequence, the relationship between HAC and its
parent chamber continued to be problematic after the committee retained its lost authority.
The degree of harmony between the appropriating committees and the Senate should appear
in the degree to which committee proposals were amended on the floor, and the degree to
which conflict spills out onto the floor should affect the Senate’s ability to process legislation.
Much has been made of the extent to which HAC recommendations have remained intact once
the committee reports out bills. Fenno (1966) examined appropriations for 36 bureaus from
1947 to 1962, finding that HAC’s recommendations were accepted without alteration in the
overwhelming majority of cases. The same seemed to be true of SAC. Kiewiet and McCubbins
(1991, 149–152) extended Fenno’s analysis to cover fiscal years 1947 to 1985, and found that
the appropriations committees “appear to get most of what they want on the floor,” since
“amendments tend to be small in percentage terms” or “lacking in substance.” A key difference
between the appropriations process during the post-war period and the period we cover is that
unanimous consent agreements had become a much more common way of doing business in the
Senate and should have limited the range of amendments that could have been offered on the
floor (see Fenno 1966, 591).
But one major issue was that the Senate almost invariably raised the dollar amount included
in House bills. Anecdotal evidence indicates this tradition extended far back into congressional
history. MacNeil (1963, 394) notes that House members complained of the Senate’s additions
to appropriations bills as far back as the 1860s, and that by the end of the 19th century, this
tradition appears to have been well-established.14
For our analysis, it is important to know whether this was the case systematically, and if
so, whether the increases occurred during committee deliberations or during the amendment
process on the floor. If they occurred during the latter stage, then this may have made it difficult
for the Senate to process bills by the relevant deadlines. The wide open floor procedure in the
committees typically had between 2 and 4 members who also sat on SAC during the period we examine.14See also Reinsch (1907, 112) and Rogers (1926, 111).
20
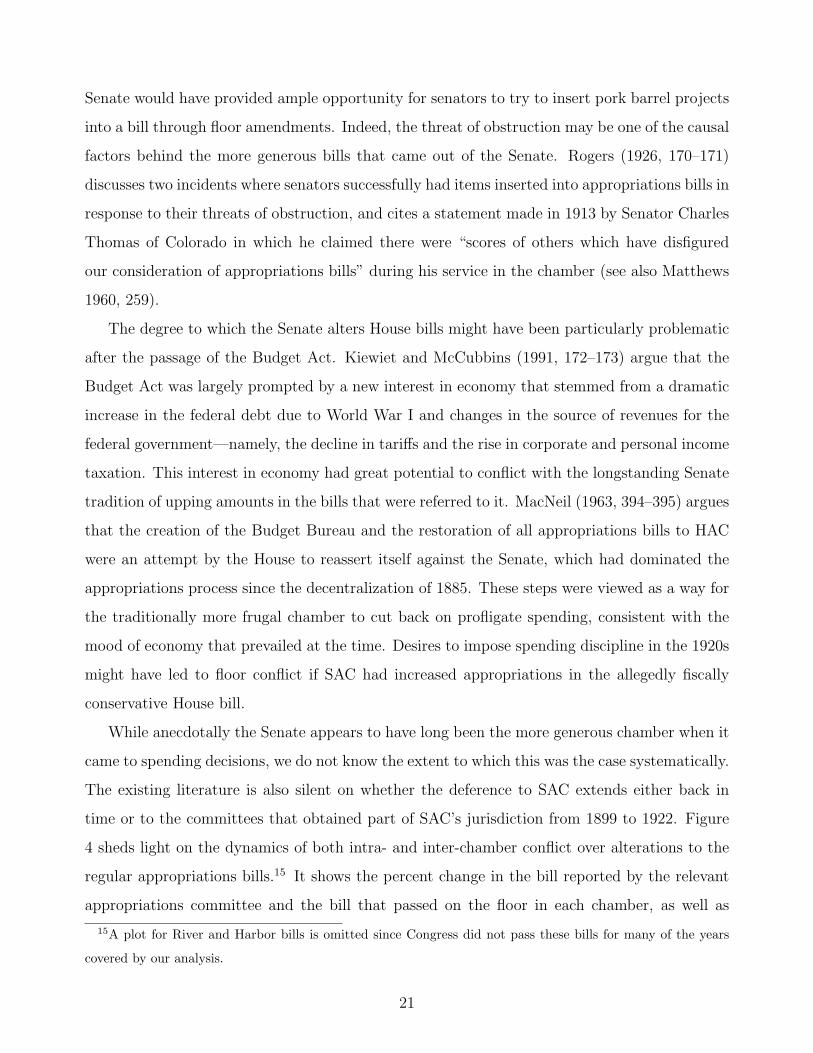
Senate would have provided ample opportunity for senators to try to insert pork barrel projects
into a bill through floor amendments. Indeed, the threat of obstruction may be one of the causal
factors behind the more generous bills that came out of the Senate. Rogers (1926, 170–171)
discusses two incidents where senators successfully had items inserted into appropriations bills in
response to their threats of obstruction, and cites a statement made in 1913 by Senator Charles
Thomas of Colorado in which he claimed there were “scores of others which have disfigured
our consideration of appropriations bills” during his service in the chamber (see also Matthews
1960, 259).
The degree to which the Senate alters House bills might have been particularly problematic
after the passage of the Budget Act. Kiewiet and McCubbins (1991, 172–173) argue that the
Budget Act was largely prompted by a new interest in economy that stemmed from a dramatic
increase in the federal debt due to World War I and changes in the source of revenues for the
federal government—namely, the decline in tariffs and the rise in corporate and personal income
taxation. This interest in economy had great potential to conflict with the longstanding Senate
tradition of upping amounts in the bills that were referred to it. MacNeil (1963, 394–395) argues
that the creation of the Budget Bureau and the restoration of all appropriations bills to HAC
were an attempt by the House to reassert itself against the Senate, which had dominated the
appropriations process since the decentralization of 1885. These steps were viewed as a way for
the traditionally more frugal chamber to cut back on profligate spending, consistent with the
mood of economy that prevailed at the time. Desires to impose spending discipline in the 1920s
might have led to floor conflict if SAC had increased appropriations in the allegedly fiscally
conservative House bill.
While anecdotally the Senate appears to have long been the more generous chamber when it
came to spending decisions, we do not know the extent to which this was the case systematically.
The existing literature is also silent on whether the deference to SAC extends either back in
time or to the committees that obtained part of SAC’s jurisdiction from 1899 to 1922. Figure
4 sheds light on the dynamics of both intra- and inter-chamber conflict over alterations to the
regular appropriations bills.15 It shows the percent change in the bill reported by the relevant
appropriations committee and the bill that passed on the floor in each chamber, as well as
15A plot for River and Harbor bills is omitted since Congress did not pass these bills for many of the years
covered by our analysis.
21
the difference between the initial bills passed by the House and the Senate (i.e., before their
differences were worked out in conference).
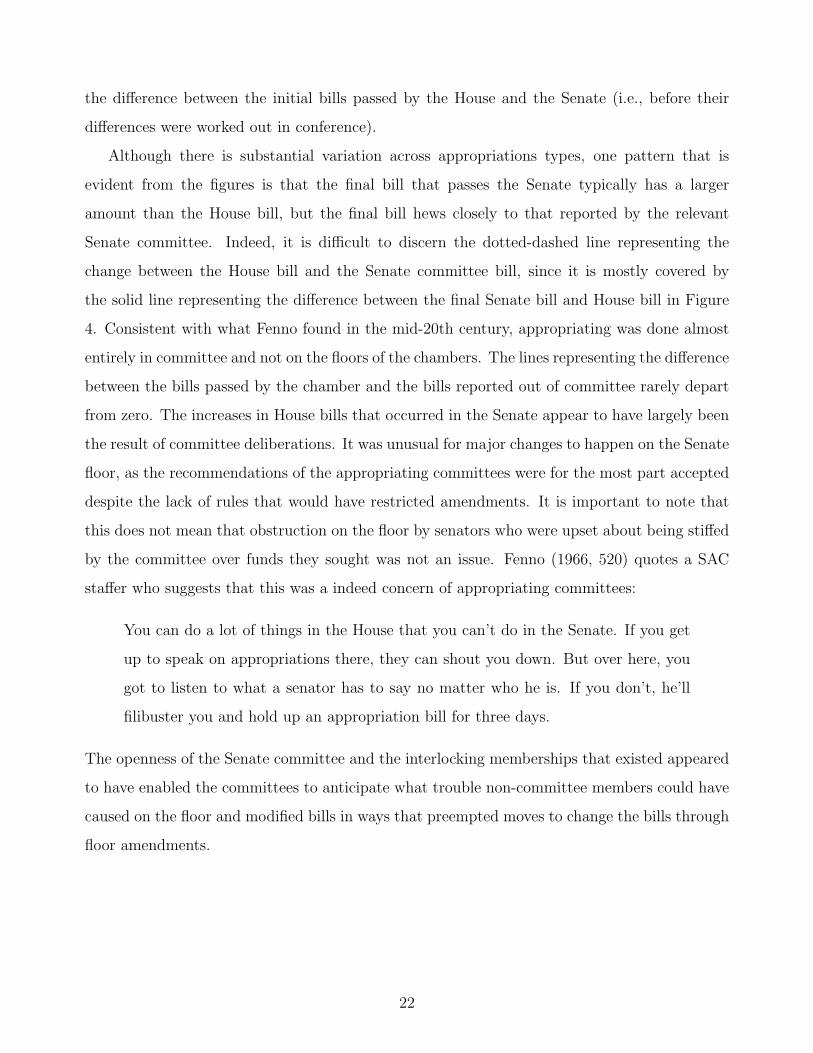
Although there is substantial variation across appropriations types, one pattern that is
evident from the figures is that the final bill that passes the Senate typically has a larger
amount than the House bill, but the final bill hews closely to that reported by the relevant
Senate committee. Indeed, it is difficult to discern the dotted-dashed line representing the
change between the House bill and the Senate committee bill, since it is mostly covered by
the solid line representing the difference between the final Senate bill and House bill in Figure
4. Consistent with what Fenno found in the mid-20th century, appropriating was done almost
entirely in committee and not on the floors of the chambers. The lines representing the difference
between the bills passed by the chamber and the bills reported out of committee rarely depart
from zero. The increases in House bills that occurred in the Senate appear to have largely been
the result of committee deliberations. It was unusual for major changes to happen on the Senate
floor, as the recommendations of the appropriating committees were for the most part accepted
despite the lack of rules that would have restricted amendments. It is important to note that
this does not mean that obstruction on the floor by senators who were upset about being stiffed
by the committee over funds they sought was not an issue. Fenno (1966, 520) quotes a SAC
staffer who suggests that this was a indeed concern of appropriating committees:
You can do a lot of things in the House that you can’t do in the Senate. If you get
up to speak on appropriations there, they can shout you down. But over here, you
got to listen to what a senator has to say no matter who he is. If you don’t, he’ll
filibuster you and hold up an appropriation bill for three days.
The openness of the Senate committee and the interlocking memberships that existed appeared
to have enabled the committees to anticipate what trouble non-committee members could have
caused on the floor and modified bills in ways that preempted moves to change the bills through
floor amendments.
22

Figure 4: Changes to appropriations bills
1890 1900 1910 1920 1930 1940
−0
.20
.00
.20
.40
.6
Agriculture
Fiscal Year
Pe
rce
nt ch
an
ge
1890 1895 1900 1905 1910 1915 1920
0.0
0.2
0.4
0.6
0.8
Army
Fiscal YearP
erc
en
t ch
an
ge
% change in Sen. bill from Hse. bill% change Hse bill from Hse rept.% change in Sen. bill from Sen. rept% change in Sen. rept from Hse. bill
1890 1895 1900 1905 1910 1915 1920
−0
.20
.00
.2
Diplomatic and Consular
Fiscal Year
Pe
rce
nt ch
an
ge
1890 1900 1910 1920 1930 1940
−0
.10
.10
.30
.5
District of Columbia
Fiscal Year
Pe
rce
nt ch
an
ge
1890 1895 1900 1905 1910 1915 1920
0.0
0.5
1.0
Fortification
Fiscal Year
Pe
rce
nt ch
an
ge
1890 1895 1900 1905 1910 1915 1920
0.0
0.5
1.0
Indian
Fiscal Year
Pe
rce
nt ch
an
ge
23

Figure 4: Changes to appropriations bills (continued)
1890 1900 1910 1920 1930 1940
−0
.10
.10
.3
Legislative, etc.
Fiscal Year
Pe
rce
nt ch
an
ge
% change in Sen. bill from Hse. bill% change Hse bill from Hse rept.% change in Sen. bill from Sen. rept% change in Sen. rept from Hse. bill
1890 1895 1900 1905 1910 1915 1920
−0
.50
.51
.5
Military Academy
Fiscal YearP
erc
en
t ch
an
ge
1890 1900 1910 1920 1930 1940
−0
.10
.10
.3
Navy
Fiscal Year
Pe
rce
nt ch
an
ge
1890 1895 1900 1905 1910 1915 1920
−0
.20
.00
.2
Pensions
Fiscal Year
Pe
rce
nt ch
an
ge
1890 1895 1900 1905 1910 1915 1920
0.0
0.2
0.4
0.6
Post Office
Fiscal Year
Pe
rce
nt ch
an
ge
1890 1895 1900 1905 1910 1915 1920
−0
.20
.00
.20
.4
Sundry Civil
Fiscal Year
Pe
rce
nt ch
an
ge
24

5 Cloture and Appropriations Deadlines
The discussion in the previous section sets the stage for a quantitative analysis of the impact
of cloture on the ability of the Senate to process appropriations bills by deadlines established
by the end of congresses and the beginning of the fiscal year. The analysis includes all regular
appropriations bills that were considered from 1890 to 1946, which is essentially the same period
covered by the data on significant legislation.16 The dependent variable in our analysis takes
on a value of one if the Senate failed to pass a given bill by the relevant deadline, and is zero
otherwise. The key explanatory variable we are interested in is a dummy variable which equals
one for bills considered prior to the adoption of cloture and equals zero for post-cloture bills.
If our hypotheses regarding the effectiveness of the cloture rule are correct we should observe
a positive coefficient on this variable. This is an admittedly crude measure and could account
for numerous changes that occurred around the time that cloture was adopted. As discussed
in the previous section, the most important changes that happened in close proximity to the
cloture rule concerned the recentralization of the jurisdiction over appropriations in HAC and
SAC and the Budget Act of 1921. While we could model the effects of these changes with their
own dummy variables, such variables would obviously be highly correlated with each other and
the dummy variable indicating the existence of a cloture rule. Including all of these dummies in
our model would make it difficult to sort out the effects of the change in budget rules versus the
change in floor procedure. Fortunately, we can do better by including more precise measures
that capture theoretically relevant features of the institutional changes.
A key change under the Budget Act was to centralize in the Bureau of the Budget the
processing of agency requests for funds before they were submitted to Congress. This was
intended to bring about efficiency in the process as well as to promote fiscal discipline by
reining in agencies who submitted overly large spending requests. The centralization should
have reduced the amount of time that it took to process the spending bills, which would have
16The data are from tables that appear in the Senate document Appropriations, New Offices, Etc. After 1890,
this document regularly included tables compiled by the clerks of HAC and SAC, which contain information
about the amounts in and the progress of appropriations bills. We are in the process of extending the data set
back to 1881, which requires more extensive digging in the Congressional Record to locate relevant information.
We do not include deficiency appropriations bills in our analysis since these did not have the same kind of
deadline requirements as regular appropriation bills.
25

made it easier for the Senate to have met appropriations deadlines. Table 3 shows one measure
which indicates increased efficiency that followed passage of the Budget Act in terms of the
average number of days between important junctures in the process and the deadline. Post-
Budget Act, there were on average more days between the deadline and the reporting of bills
from HAC, their passage on the House floor, and the reporting of bills by SAC. The process prior
to the point of reaching the Senate floor moved more quickly after 1921, which gave senators
more time to consider bills on the floor.17 Since we are mainly interested in the processing of bills
on the Senate floor, we include in our specification the variable measuring the number of days
between the reporting of the bill by SAC and the relevant deadline.18 We expect this variable to
have a negative coefficient, since the longer it takes to get through the committee stage in the
Senate, the more difficult it should be to process the bill on the floor before either the congress
or the fiscal year expires. Note that by including this variable we are also accounting for the
amount of time it took the bill to make its way through the House, since the Senate did not
begin to consider appropriations bills until the House had passed them.19
As Figure 4 showed, most alterations to House bills happened in SAC and not on the Senate
floor. To the extent that these alterations might have provoked discord on the floor, it should
show up in the differences between the bill that passed the House and the bill reported by SAC.
That is, economy-minded senators in the post-Budget Act world may have taken issue with
increases in spending that occurred in committee, and might have tried to use their prerogatives
on the floor to strip out spending that they viewed as wasteful. The exercise of their prerogatives
would have inhibited moving the bill forward toward final passage.
Therefore, we include in our model a variable measuring the difference between the amount
in the bill reported by SAC and the amount that passed the House. The greater this difference
the more potential conflict there might be on the floor as the competing interests of economy
17The increased efficiency is not due to the elimination of lame duck sessions nor is it due to longer sessions in
the 1930s. If we exclude congresses after the 20th Amendment took effect, the average number of days between
the important junctures and the deadline is greater across the board. Thus, it appears that the values for these
measures increased after the Budget Act but then decreased after 20th Amendment took effect.18In a few cases, the bill was reported from SAC after the deadline. Including this variable makes sure that
the floor is not penalized for the late action of SAC.19Including variables that measure the number of days between reporting or passage of the bill in the House
produces essentially the same results as we report below.
26

Table 3: Efficiency in the Appropriations Process, 1890–1946
Pre-Budget Act Post-Budget Act
(N = 403) (N = 271)
Avg. number of days between 82 103
report from HAC and deadline
Avg. number of days between 68 90
House passage and deadline
Avg. number of days between 46 67
report from SAC and deadline
Note: Data are based on all regular appropriations bills.
allegedly embodied in the House bill clashed with the increases that SAC had historically made
to bills.20 We expect a positive coefficient on this variable, which would indicate that greater
differences led to more conflict and more difficulty in passing bills in the Senate.
The other major institutional changes that are crucial to account for concern the changing
nature of committee jurisdictions over appropriations. The larger the percentage of the Senate
that sat on the relevant appropriating committees the smoother the floor stage of the process
should have gone. In particular, the recentralization in 1922 and the concomitant increases in
SAC’s size should have made it much more likely that the Senate would have met the deadlines
as floor and committee agreement would have increased. The variable in our model that captures
this effect is the percentage of members of the Senate who sat either on SAC or the relevant
legislative committee between 1899 and 1922. This variable should have a negative effect (i.e.,
increases in the percent of the chamber serving on the committee should decrease the probability
of a failure to meet the deadline).
Alternatively, one could argue that the recentralization might have had negative effects
on the meeting of deadlines. Stewart (1989, 120) cites one of the reasons for the devolution
20One could argue that it was the Budget Bureau more than HAC or the House that sought fiscal discipline.
Data on appropriations estimates from the executive are harder to come by for the period we examine. If we
use data on estimates instead of what HAC reported, we obtain similar results, but our sample size is reduced
by about half.
27

of appropriations bills from HAC was that MCs charged that the committee was “severely
overworked, as indicated by the tardiness with which appropriations bills were reported in the
48th Congress.” Reconstituting SAC’s jurisdiction might have led to similar difficulties after
1922. We doubt that this is the case because first, the Budget Bureau should have made
life much easier for both HAC and SAC and second, the enlargement of SAC meant that
workload would have been distributed more widely. Nevertheless, the sign of the coefficient on
the committee-to-chamber ratio variable will settle this question.
The point about workload suggests another variable that should be included in our model.
If the decentralization of appropriations was in part motivated by concerns about committee
workload, then it may be the case that devolved bills were dealt with more expeditiously since
this spread out the work at the committee stage. This, of course, assumes that the newly
acquired jurisdiction could be handled along with the committees’ other legislative duties. To
account for possible effects of the decentralization (as opposed to recentralization), the model
specification includes a variable that indicates whether a bill was considered by a committee
other than SAC in a given fiscal year.
We include several other variables to account for additional factors that might have affected
the Senate’s ability to process appropriations in a timely fashion. The amount of general
legislative demands that were placed on the Senate is one such factor. Since senators themselves
determine to an extent what demands are placed on their institution, it is difficult to come
up with a measure that can be distinguished as a cause and not merely a symptom of the
Senate’s ability to process bills. We argue that one such measure is the number of requests for
legislative action submitted to the Congress by the president. While it may be the case that
this measure is somewhat tainted by the president’s expectations of what a given Congress can
or will address, the ambitiousness of the presidents’ legislative program can be considered to
be exogenous enough that it will provide an effective control for our analysis. In our view, it
is certainly superior to the standard measures of workload that appear in the literature, such
as the number of roll calls or the number of pages in the Congressional Record. The measure
we use is the number of presidential requests that the Senate dealt with in a given congress,
which we expect to have a positive effect on the likelihood of failure.21 The more distracted the
21The source for this variable is the Database of Historical Congressional Statistics compiled by Swift et al.
(2000). Appropriation requests are excluded from the the count unless they represent new policy initiatives.
28

Senate is with processing items on the president’s agenda, the more difficult it will be for it to
meet appropriations deadlines.
The partisan and ideological makeup of the Senate may also have effects on its efficiency.
A partisan view of appropriations might hold that the more unified the majority party is, the
better able they can enforce discipline and meet appropriations deadlines. Given the importance
of spending decisions to the construction of a favorable party label, unity should be promoted
and exploited to keep the appropriations process functioning as smoothly as possible and to the
benefit of the majority party (cf. Cox and McCubbins 1993; Kiewiet and McCubbins 1991).
There was substantial variation in the unity of parties in the Senate during the period we cover.
The conventional wisdom is that parties became uncharacteristically strong at the end of 19th
and beginning of the 20th centuries (Rothman 1966), but then unity declined substantially as
we moved into the 1910s and 1920s. Considering the timing of this decline, it seems fairly
essential then to attempt to account for this variation to make sure it is not spuriously causing
results for the pre- and post-cloture indicator. With the usual caveats about the difficulties
of measuring party influence, we include in our model the standard measure of majority party
unity, the Rice cohesion score.
Finally, we account for potential ideological conflict that would cause delays in processing
appropriations bills. Binder (2003) argues that intrachamber dissension is an essential com-
ponent to understanding whether or not congress passes legislation on its agenda. The more
ideologically polarized the chamber is, the harder it will be to forge agreements within the cham-
ber, and by extension the harder it will be to pass legislation in a timely fashion. To account
for these possible effects, the model includes Binder’s measure of moderation/polarization. Us-
ing first-dimension NOMINATE scores, this measure is a count of the number of senators who
are closer to the chamber median than to the median in their party, weighted by the distance
between the party medians. The more senators in this interval, holding distance constant, the
greater the number of “moderates” in the chamber, which should promote bipartisanship and
less conflict on the floor.
Descriptive statistics for the variables in the model are reported in Table 4. Overall, about
5% of the bills in our sample failed to pass the Senate by the relevant deadline. By this measure,
the Senate was fairly efficient at processing spending bills.22 If anything, though, this probably
22In order to allay concerns that the small percentage of failures in the data might lead to bias in our estimates,
29
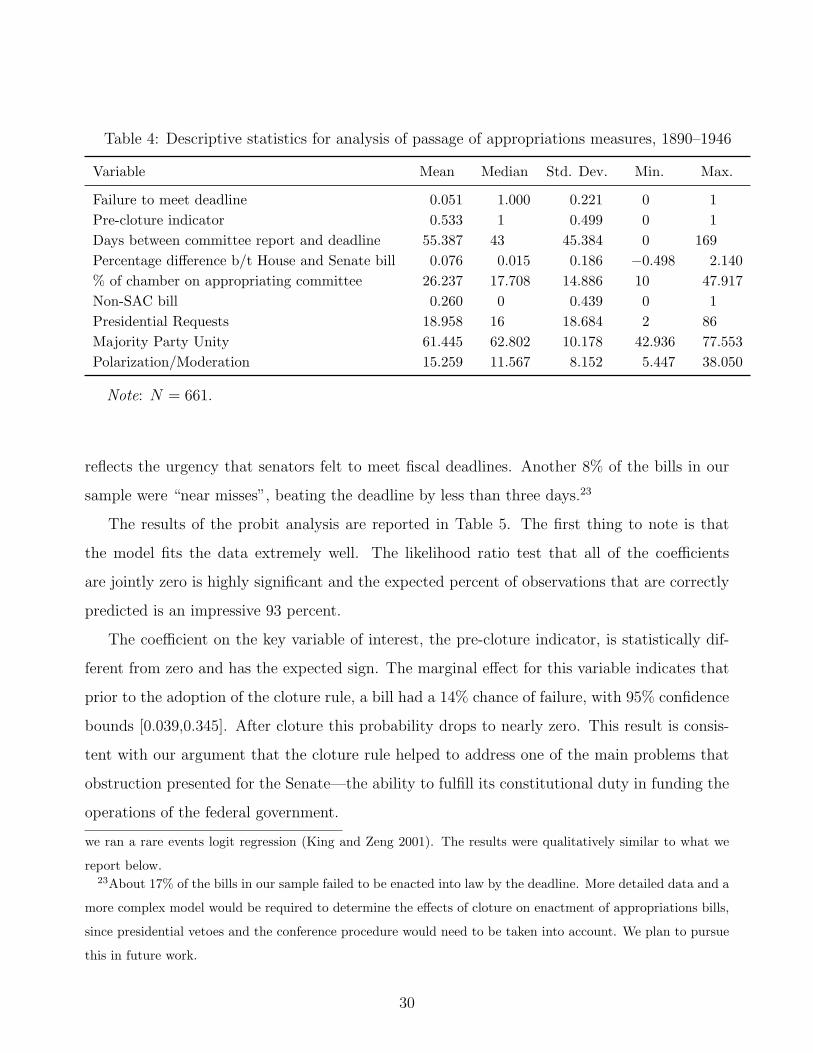
Table 4: Descriptive statistics for analysis of passage of appropriations measures, 1890–1946
Variable Mean Median Std. Dev. Min. Max.
Failure to meet deadline 0.051 1.000 0.221 0 1Pre-cloture indicator 0.533 1 0.499 0 1Days between committee report and deadline 55.387 43 45.384 0 169Percentage difference b/t House and Senate bill 0.076 0.015 0.186 −0.498 2.140% of chamber on appropriating committee 26.237 17.708 14.886 10 47.917Non-SAC bill 0.260 0 0.439 0 1Presidential Requests 18.958 16 18.684 2 86Majority Party Unity 61.445 62.802 10.178 42.936 77.553Polarization/Moderation 15.259 11.567 8.152 5.447 38.050
Note: N = 661.
reflects the urgency that senators felt to meet fiscal deadlines. Another 8% of the bills in our
sample were “near misses”, beating the deadline by less than three days.23
The results of the probit analysis are reported in Table 5. The first thing to note is that
the model fits the data extremely well. The likelihood ratio test that all of the coefficients
are jointly zero is highly significant and the expected percent of observations that are correctly
predicted is an impressive 93 percent.
The coefficient on the key variable of interest, the pre-cloture indicator, is statistically dif-
ferent from zero and has the expected sign. The marginal effect for this variable indicates that
prior to the adoption of the cloture rule, a bill had a 14% chance of failure, with 95% confidence
bounds [0.039,0.345]. After cloture this probability drops to nearly zero. This result is consis-
tent with our argument that the cloture rule helped to address one of the main problems that
obstruction presented for the Senate—the ability to fulfill its constitutional duty in funding the
operations of the federal government.
we ran a rare events logit regression (King and Zeng 2001). The results were qualitatively similar to what we
report below.23About 17% of the bills in our sample failed to be enacted into law by the deadline. More detailed data and a
more complex model would be required to determine the effects of cloture on enactment of appropriations bills,
since presidential vetoes and the conference procedure would need to be taken into account. We plan to pursue
this in future work.
30

Table 5: Probit analysis of passage of appropriations measures, 1890–1946
Variable Coefficient Std. Err. p value
Constant −2.286 1.893 0.227
Pre-cloture indicator 1.666 0.588 0.005
Days between committee report and deadline −0.021 0.006 0.000
Percentage difference b/t House and Senate bill 1.156 0.404 0.004
% of chamber on appropriating committee −0.276 0.067 0.000
Non-SAC bill −0.490 0.302 0.105
Presidential Requests 0.028 0.014 0.053
Majority Party Unity 0.007 0.023 0.760
Polarization/Moderation 0.224 0.046 0.000
Likelihood ratio test 117.12 (p <.001)
Expected percent correctly predicted 93
Note: N = 661.
Our confidence in the result on this variable is bolstered by the results on the other variables
in the model, most of which have effects that are bounded away from zero and in the expected
direction. Not surprisingly, the earlier a bill makes it out of committee (and by extension the
faster it moves through the earlier stages of the process), the more likely it is to meet the
deadline. The same is true the larger the percentage of the chamber that sits on the relevant
appropriating committee. The greater the difference between the amount that passed the House
and the amount reported by the relevant Senate committee the more likely the bill was to fail
to meet the deadline. An increase in this variable of one standard deviation from its median
value increases the probability of failure by about 5 percentage points. This suggests that
differences between the bills led to conflict in the Senate. The coefficient on the presidential
requests variable is statistically significant at the .1 level, and indicates that the more requests
from the president the Senate is called upon to address, the more likely it is to fail meet the
deadline. The marginal effect for this variable indicates its substantive significance, with a one
standard deviation increase producing a 15% increase in the probability of failure. The variable
indicating whether or not a bill remained under SAC’s jurisdiction from 1899 to 1922 barely
misses the conventional level accepted for statistical significance. Of the ideological measures,
31

party cohesion does not appear to affect whether or not a bill meets the deadline, and the
moderation measure has effects that are in the opposite direction of what was expected.24
Nevertheless, overall the model does very well in explaining the passage of appropriations bills,
and whether or not senators possessed a mechanism for ending debate appears to have had an
effect on their ability to meet fiscal deadlines. Although we are limited to the crude measure
of a dummy variable for measuring the effects of cloture, the results on the numerous other
variables that we include in the model should allay concerns that the effects we find for cloture
are spuriously generated by other institutional or contextual factors.
6 Conclusion
The prevailing conventional wisdom in the congressional literature is that the cloture reform
of 1917 was merely symbolic and had little substantive import for the way the Senate did
business in the few decades that followed the reform. However, we have shown theoretically
how cloture reform could have been meaningful in the sense that it reduced the uncertainty that
legislative entrepreneurs faced when trying to push legislation and how it might have increased
the efficiency of passing legislation in the Senate by providing a clear threshold for cutting off
debate and bringing legislation to a final vote. We have reported empirical evidence that is
consistent with these theoretical conjectures. The reduction in variance of coalition sizes on
significant legislation and the increased efficiency in the appropriations process both indicate
that the adoption of the cloture rule had a substantive impact on the operation of the Senate,
contrary to what the conventional wisdom would have us believe.
The analysis in this paper represents a movement toward a theory of institutions. Diermeier
and Krehbiel (N.d.) define an institutional theory as one in which “institutional features are
taken as exogenous and behavioral postulates are fixed,” whereas in a theory of institutions,
institutional features become objects of collective choice. In previous work, we have considered
24Binder (2003, 80), who examines lawmaking in the post-World War II era, suggests that her measure may
have different effects for earlier time periods. Political parties in congresses of yesteryear may have had greater
stakes in legislative accomplishments than do parties of today. Polarization might have lead to (or been a
symptom of) more disciplined parties that sought to establish substantive legislative records for an advantage
in electoral competition.
32

how senators behaved under different institutional settings and what the consequences were for
policy making at a macro level (Wawro and Schickler 2003). In this paper, we have considered
why senators chose to change one of the most important features of their institution—the rules
regarding debate—and adopt supermajority procedures for forcing a vote on legislation. While
our primary concern is to understand Senate history, our model of cloture reform can easily
be applied to other legislatures. Although we have placed an emphasis on the uniqueness of
Senate rules and procedures, it is obviously not the only legislature that relies on supermajority
thresholds to get its work done. Indeed, one only needs to walk to the other end of the Capitol
Building to to find a legislative body that has adopted supermajority procedures as part of its
rules. Even the strictly majoritarian House often conducts business under suspension of the
rules which requires a two-thirds coalition. The House resorts to this procedure, which bars
amendments not included in the motion and limits debate to forty minutes, in order to expedite
the passage of legislation (Smith 1989, 37–40). In adopting this procedure, members of the
House seemed to be making exactly the same trade-off that we argued senators made when
they adopted the 1917 cloture rule. There are still numerous ways for parliamentary savvy
individuals to inhibit progress on legislation in the tightly structured House. Members of that
chamber appear to have afforded themselves protection from some of the uncertainty of the floor
stage by compromising on the substance of legislation in order to attract broader coalitions that
can invoke procedures that make the legislation less susceptible to parliamentary mischief. The
analysis in this paper can be easily ported to investigate whether other legislative bodies in the
United States and abroad have adopted supermajority procedures for these reasons.
References
Beth, Richard S. 1995. “What We Don’t Know About Filibusters.” Paper presented at the
Annual Meeting of the Western Political Science Association.
Binder, Sarah A. 2003. Stalemate: Causes and Consequences of Legislative Gridlock . Washing-
ton, DC: The Brookings Institution.
Brady, David W. and Mark Morgan. 1987. “Reforming the Structure of the House Appropri-
ations Process: The Effects of the 1885 and 1919–1920 Reforms on Money Decisions.” In
33

Mathew McCubbins and Terry Sullivan, editors, Congress: Structure and Policy , New York:
Cambridge University Press. Pages 207–34.
Burdette, Franklin L. 1940. Filibustering in the Senate. Princeton: Princeton University Press.
Byrd, Robert C. 1988. The Senate, 1789–1989: Addresses on the History of the United States
Senate. Washington, DC: U.S. G.P.O.
Caplin, Andrew and Barry Nalebuff. 1988. “On 64%-Majority Rule.” Econometrica 56: 787–
814.
Conover, W. J. 1999. Practical Nonparametric Statistics . New York: John Wiley & Sons 3rd
edition.
Cox, Gary and Mathew D. McCubbins. 1993. Legislative Leviathan. Berkeley: University of
California Press.
Diermeier, Daniel and Keith Krehbiel. N.d. “Institutionalism as a Methodology.” Forthcoming
in The Journal of Theoretical Politics.
Dion, Douglas. 1997. Turning the Legislative Thumbscrew . Ann Arbor: University of Michigan
Press.
Fenno, Richard F. 1966. The Power of the Purse: Appropriations Politics in Congress . Boston:
Little, Brown.
Groseclose, Timothy. 1994. “Testing Committee Composition Hypotheses for the U.S.
Congress.” Journal of Politics 56: 440–58.
Groseclose, Timothy and James Snyder. 2000. “Buying Supermajorities.” American Political
Science Review 94: 303–15.
Hall, Richard L. and Bernard Grofman. 1990. “The Committee Assignment Process and the
Conditional Nature of Committee Bias.” American Political Science Review 84: 1149–66.
Haynes, George H. 1938. The Senate of the United States: Its History and Practice. Boston:
Houghton Mifflin Company.
34

Kiewiet, D. Roderick and Mathew D. McCubbins. 1991. The Logic of Delegation: Congressional
Parties and the Appropriations Process . Chicago: University of Chicago Press.
King, Gary and Langche Zeng. 2001. “Logistic Regression in Rare Events Data.” Political
Analysis 9 (2): 137–163.
Koger, Gregory. 2002. Obstruction in the House and Senate. Ph.D. thesis UCLA.
Krehbiel, Keith. 1990. “Are Congressional Committees Composed of Preference Outliers?”
American Political Science Review 84: 149–63.
Krehbiel, Keith. 1991. Information and Legislative Organization. Ann Arbor: University of
Michigan Press.
Luce, Robert. 1922. Legislative Procedure. Boston: Houghton Mifflin Company.
MacNeil, Neil. 1963. Forge of Democracy: The House of Representatives . New York: David
McKay.
Maltzman, Forrest. 1997. Competing Principles: Committees, Parties, and the Organization of
Congress . Ann Arbor: University of Michigan Press.
Matthews, Donald R. 1960. U. S. Senators and Their World . Chapel Hill: University of North
Carolina Press.
Oppenheimer, Bruce I. 1985. “Changing Time Constraints on Congress: Historical Perspectives
on the Use of Cloture.” In Lawrence C. Dodd and Bruce I. Oppenheimer, editors, Congress
Reconsidered , Washington, DC: Congressional Quarterly. 3rd edition.
Reinsch, Paul S. 1907. American Legislatures and Legislative Methods . New York: The Century
Co.
Rogers, Lindsay. 1926. The American Senate. New York: Alfred A. Knopf.
Rothman, David J. 1966. Politics and Power: The United States Senate, 1869–1901 . Cam-
bridge, MA: Harvard University Press.
35

Schickler, Eric. 2001. Disjointed Pluralism: Institutional Innovation and the Development of
the U.S. Congress . Princeton: Princeton University Press.
Schickler, Eric and John Sides. 2000. “Intergenerational Warfare: The Senate Decentralizes
Appropriations.” Legislative Studies Quarterly 25: 551–75.
Shepsle, Kenneth A. 1978. The Giant Jigsaw Puzzle. Chicago: University of Chicago Press.
Shepsle, Kenneth A. 1979. “Institutional Arrangements and Equilibrium in Multidimensional
Voting Models.” American Journal of Political Science 23: 27–59.
Shepsle, Kenneth A. and Barry R. Weingast. 1987. “The Institutional Foundations of Committee
Power.” American Political Science Review 81: 85–104.
Smith, Steven S. 1989. Call to Order: Floor Politics in the House and Senate. Washington,
DC: Brookings Institution.
Stewart, Charles H. 1989. Budget Reform Politics: The Design of the Appropriations Process
in the House of Representatives, 1865-1921 . Cambridge: Cambridge University Press.
Swift, Elaine K., Robert G. Brookshire, David T. Canon, Evelyn C. Fink, John R. Hibbing,
Brian D. Humes, Michael J. Malbin, and Kenneth C. Martis. 2000. “Database of Congres-
sional Historical Statistics [Computer file].” Ann Arbor, MI: Inter-university Consortium for
Political and Social Research [producer and distributor].
U.S. Congress. Senate. Committee on Rules and Administration. 1975. “Senate Cloture Rule.”.
Committe Print. 94th Cong., 1st sess.
Wawro, Gregory and Eric Schickler. 2003. “Majority Rule or Liberum Veto?: Obstruction
and Lawmaking in the Pre-cloture Senate.” Paper presented at the Annual Meeting of the
Midwest Political Science Association.
Weingast, Barry R. and William Marshall. 1988. “The Industrial Organization of Congress.”
Journal of Political Economy 96: 132–63.
White, William S. 1968. Citadel: The Story of the U.S. Senate. Boston: Houghton Mifflin.
36

Wilson, Woodrow. [1885] 1956. Congressional Government: A Study in American Politics . New
York: Meridian Books.
37


![[FR]ICF ECC Soiree cloture _19 juin2010](https://img.dokumen.tips/doc/110x75/5494332eb47959514d8b4a49/fricf-ecc-soiree-cloture-19-juin2010.jpg)