Embed Size (px)
Citation preview
©20
12 N
atu
re A
mer
ica,
Inc.
All
rig
hts
res
erve
d.
nature neurOSCIenCe advance online publication
a r t I C l e S
Despite the high prevalence of stroke and epilepsy, both major sources of disability1–4, the underlying cellular and circuit mechanisms leading from stroke to epilepsy remain unknown, and injury-induced epilepsies often do not respond to existing treatments3,5. Identification of the neural circuits involved in injury-induced epilepsy is necessary to pinpoint the exact nature of the causally important alterations in these circuits and to control seizures with specific interventions.
Although altered short-range cortical circuit function is thought to be the primary cause of injury-induced epilepsies6,7, the role of long-range connections to and from injured cortex to other brain regions in seizure maintenance has not been adequately studied. The cortex is intimately connected with thalamus, and the cortico- thalamo-cortical excitatory loop mediates network oscillations under-lying epilepsies in man and in animal models8. However, despite pioneering studies that have shown the recruitment of thalamus in cortical seizures8–13, its role in seizure expression, particularly in acquired epilepsies, remains unknown. The thalamus is composed of both excitatory and inhibitory neurons, and adjacent corticothalamic and thalamocortical glutamatergic axons. Thus, it is challenging to selectively activate thalamocortical or corticothalamic axons and it is impossible to control their activity in real time using traditional pharmacological or electrical manipulations. We overcame this chal-lenge using optogenetic methods14 that allow for control of a specific cell type with high temporal precision. Although recent studies have used optogenetic tools to study seizure-like activities in vitro15,16, whether there is a causal relationship between the activity of one cell type and the seizure and its disruption in real time has not yet been tested in behaving animals.
The peri-infarct cortex is generally considered to be the zone in which seizures initiate6,7, yet the extent of cortical damage pre-cludes effective antiepileptic targeting of the entire peri-infarct hyperexcitable cortex. In addition, targeting of such extensive areas might disrupt function of eloquent cortex. We sought to deter-mine, independent of where seizures initiate, whether the second-arily damaged thalamus is required to sustain post-stroke seizures and, if so, whether this focal region could be readily targeted to stop seizures.
We induced focal cortical strokes and located and delineated potentially epileptic cellular and circuit changes in thalamus in vitro. We then engineered an approach to specifically inhibit output from that thalamic region to test whether it is causally involved in seizure maintenance in vivo. For this purpose, we used an established model of cortical photothrombosis that results in late epilepsy (>1 month) after stroke17,18. This injury is associated with reduced excitability and excitation in the inhibitory reticular thalamic neurons and retrograde cell death and gliosis specifically in ipsilateral ventro-posterolateral thalamic nucleus (VPL); these changes are known to be complete by the end of the first week and are sustained over months19 (Supplementary Fig. 1a,b).
RESULTSCortical stroke enhances excitability of thalamocortical cellsIpsilateral thalamocortical neurons showed increased membrane intrinsic excitability and enhanced rhythmogenic properties 7–14 d after focal cortical stroke. Specifically, input resistance in thalamo-cortical cells was increased as a result of a reduction in membrane
1Department of Neurology and Neurological Sciences, Stanford University School of Medicine, Stanford, California, USA. 2Department of Bioengineering, Stanford University School of Medicine, Stanford, California, USA. 3Institut des Systèmes Intelligents et de Robotique, Centre National de Recherche Scientifique, Unité Mixte de Recherche 7222, Université Pierre et Marie Curie, Paris, France. Correspondence should be addressed to J.R.H. ([email protected]) or J.T.P. ([email protected]).
Received 10 October; accepted 23 October; published online 7 November 2012; doi:10.1038/nn.3269
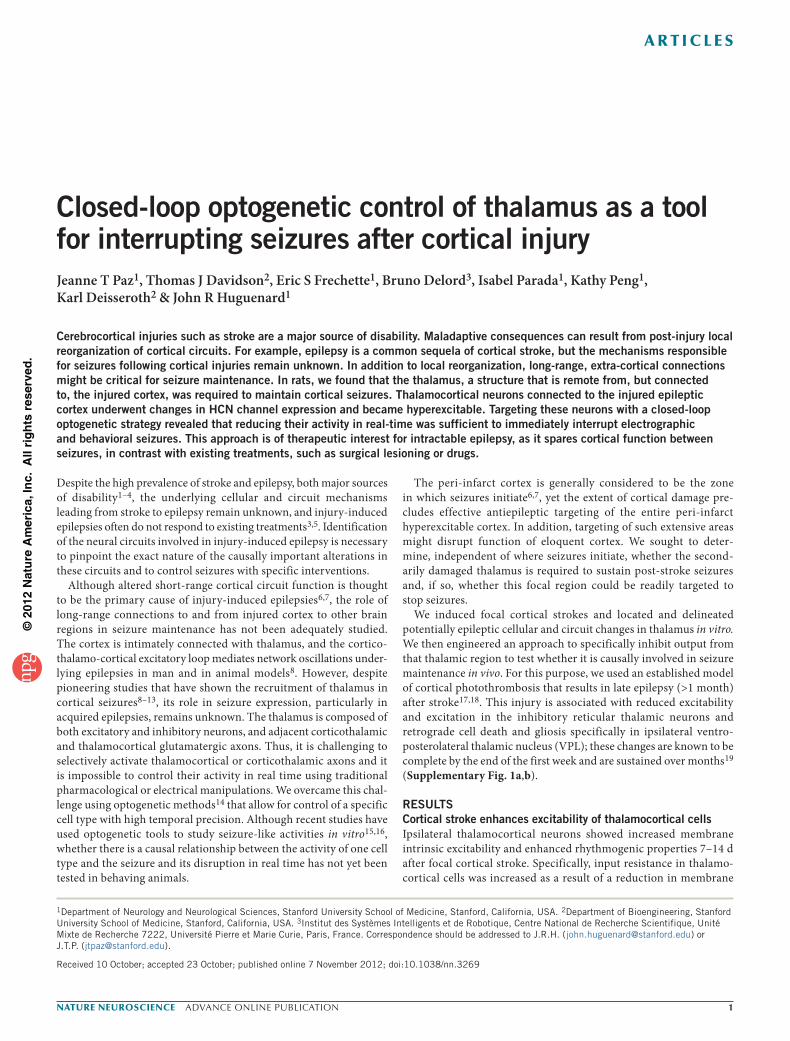
Closed-loop optogenetic control of thalamus as a tool for interrupting seizures after cortical injuryJeanne T Paz1, Thomas J Davidson2, Eric S Frechette1, Bruno Delord3, Isabel Parada1, Kathy Peng1, Karl Deisseroth2 & John R Huguenard1
Cerebrocortical injuries such as stroke are a major source of disability. Maladaptive consequences can result from post-injury local reorganization of cortical circuits. For example, epilepsy is a common sequela of cortical stroke, but the mechanisms responsible for seizures following cortical injuries remain unknown. In addition to local reorganization, long-range, extra-cortical connections might be critical for seizure maintenance. In rats, we found that the thalamus, a structure that is remote from, but connected to, the injured cortex, was required to maintain cortical seizures. Thalamocortical neurons connected to the injured epileptic cortex underwent changes in HCN channel expression and became hyperexcitable. Targeting these neurons with a closed-loop optogenetic strategy revealed that reducing their activity in real-time was sufficient to immediately interrupt electrographic and behavioral seizures. This approach is of therapeutic interest for intractable epilepsy, as it spares cortical function between seizures, in contrast with existing treatments, such as surgical lesioning or drugs.

©20
12 N
atu
re A
mer
ica,
Inc.
All
rig
hts
res
erve
d.
advance online publication nature neurOSCIenCe
a r t I C l e S
area (Fig. 1), and the resting membrane potential was slightly depolarized (data not shown). Consistent with the increased input resistance after injury, rheobase was reduced, whereas the proper-ties of individual action potentials were not altered (Supplementary Table 1). We observed several alterations in the biophysical proper-ties of hyperpolarization-activated cyclic nucleotide–gated (HCN) channel–mediated current (Ih) in affected thalamocortical cells (Fig. 2): faster activation, depolarized half-activation voltage (V50%),
no change in Ih density and a reduced responsiveness of Ih to cAMP (data not shown). Changes in Ih resulted, in part, from enhanced constitutive cAMP signaling (data not shown) and a switch in pre-dominant HCN subunits (Supplementary Fig. 2). Notably, similar changes in Ih have also been linked to genetic epilepsies (for a review, see ref. 20).
The increased intrinsic excitability was robust in cells close to the injured gliotic area (medial VPL, lateral ventroposteromedial thalamic nucleus (VPM)), but was not significant (P > 0.1) in thalamic areas that were not affected by cell death or gliosis, such as medial VPM or ventrolateral thalamic nucleus (Fig. 1a–c,e). Notably, the changes in intrinsic excitability started in the first week after stroke, before seizures, and persisted into the chronic post-stroke epileptic state (>1 month), suggesting that these changes do not represent a transient, pre-apoptotic phenomenon.
Figure 1 Cortical stroke results in enhanced intrinsic excitability in thalamocortical neurons. (a) Confocal image of a horizontal thalamic slice ipsilateral to the stroke (7 d post-stroke) with GFAP immunolabeling and thalamic neurons labeled by intracellular injection of biocytin (green, white arrows) during recordings. Pink traces show responses to intracellular injection of current pulses (from −200 pA to +80 pA) in thalamocortical cells from different thalamic nuclei ipsilateral to the infarct. White traces show responses from thalamocortical cells in control rats using the same protocols from corresponding nuclei. (b,c) Representative voltage responses to current injections in thalamocortical cells from an injured and a control rat. Note the enhanced intrinsic rebound properties in injured cells (arrowheads, larger post-inhibitory after-depolarization, enhanced hyperpolarization-activated sag and post-hyperpolarization burst). (d) Confocal images of representative control and injured thalamocortical neurons (7 d post-stroke). (e) Passive membrane properties: capacitance (Cm), input resistance (Rin) and membrane time constant (τm) in thalamocortical cells close to or far from (>200 µm) gliosis at 2 d, 7–14 d and >1 month post-stroke (data are presented as mean ± s.e.m.; ns, P > 0.1; *P < 0.05, one-way ANOVA). The number of cells is indicated for each group. Data are from 9 control and 12 injured rats. AP, action potential; IC, internal capsule; nRT, Po, VL, VPL, VPM: reticular, posterior, ventrolateral, ventroposterolateral and ventroposteromedial thalamic nuclei.
Biocytin Biocytin
Control
20 µm 20 µm
Injured
Injured VPM(far from gliosis)
25 mV0.5 s–75 mV
InjuredVPL (gliosis)
–75 mV
+160 pA
30 AP
–200 pA
–75 mV
–75 mV
25 mV0.5 s
ControlVPL +80 pA
–75 mV
–75 mV
–75 mV
–200 pA
34 AP
+280 pA
–200 pA
ControlVPM +80 pA
–75 mV
–200 pA
IC
a
d
+80 pA
–200 pA
BiocytinGFAP
nRT
Po
VPM
25 mV0.5 s
500 µm
VPL
VL
b
c
e240
* **
ns
7 7 201811 86
18012060C
m (
pF)
02 d 7–14 d >1
month
400300200100
0
**ns
ns
77 201811 8
6
Rin
(M
Ω)
2 d 7–14 d >1month
ns604530150
nsns
ns
7 7 201811 8 6 m (
MS
)
2 d 7–14 d >1month
Far from inj.InjuredControl
Ih activation Ih density
V50%
*** *
V = –95 mV
V = –130 mV
Ih de-activation
De-activationActivation
Injured
Injured
Control
Control
Control
Control
n = 10 cells n = 6 cells
Injured
Injured
1 nA
2 s
1 nA
2 s
–60 mV
–60 mV
–135 mV
–125 mV–105 mV
Vm (mV)
Control
Control
–135
–115 –9
5–7
5–5
5
1.00.80.60.40.2I ta
il / I
tail
max
I tail
/ Ita
il m
ax
(mV
)(p
A p
F–1
)
6.0
4.5
3.0
1.5
0
0
Vm (mV)–1
35–1
15 –95
–75
–55
Vm (mV)–1
35–1
15 –95
–75
–55
Vm (mV)–1
35
10 cells7 cells
–115 –9
5–7
5–5
5
1.0–90
9
6
3
07–14 d
Control Injured
>1month
7–14 d >1month
10 7
ns ns
44
–95
–100
–105
0.80.60.40.2
0
Vh –65 mV
Vh –65 mV
a b
c d
e f
hg
(s
) A = 1.8 s
A = 1 s
D = 3.4 s
2 s
2 s
Injured
D = 2.3 sInjured
6.0
4.5
3.0
1.5
0
(s
)
Control Injured
InjuredControl
10
6
4
3
Figure 2 Cortical stroke alters biophysical properties of Ih in thalamo-cortical neurons. (a) Current responses (top traces) to voltage steps (bottom traces) in representative thalamocortical cells from an injured and a control rat. Ih was measured at the tail current (arrowheads; see Online Methods). (b) The density of Ih at maximal activation was similar in thalamocortical cells from injured and control rats at both 7–14 d and at >1 month post-stroke. (c) Ih voltage-dependent activation curves 7–14 d post-stroke: average plot of normalized Ih amplitude as a function of membrane potential, best fitted with a Boltzmann function (R2 = 0.99, both fits). (d) V50% of Ih was shifted toward depolarized values after injury. (e) Ih de-activation protocol. Voltage-dependence of Ih de-activation was examined by fully activating Ih at −125 mV and then stepping to membrane potentials between −105 and −60 mV. De-activation time constant (τD) was calculated from exponential fits performed on the traces indicated by double-ended arrows. (f) Expanded de-activation currents traces obtained at −95 mV voltage step from the cells depicted in e. (g) Time constants of Ih activation and de-activation from the two representative cells (left) and averaged across all the cells (right). (h) Ih activation currents during −130 mV voltage step (from cells in a) were best fitted with a single-exponential function (gray lines). Data in b, c, d and g are from five control and three injured rats. Data in a, e, f and g are from the same representative control and injured cells. The number of cells is indicated in the panels. Quantitative data are represented as mean ± s.e.m. *P < 0.05, ***P = 0.001, ns, P > 0.1, one-way ANOVA.

©20
12 N
atu
re A
mer
ica,
Inc.
All
rig
hts
res
erve
d.
nature neurOSCIenCe advance online publication
a r t I C l e S
Cortical stroke leads to epileptiform thalamic oscillationsWe next asked whether the increased intrinsic excitability of thalamo-cortical neurons translated into altered circuit function in the thalamus. For this purpose, we assessed thalamic network activity in horizontal thalamic slices using multiunit extracellular recordings 7–14 d post-stroke. These slices conserve intra-thalamic connectivity between the reticular thalamic nucleus (nRT) and thalamocortical nuclei, but not with cortex21. In slices from control rats, electrical stimulation of the internal capsule evoked rhythmic activity in thalamus, consistent with previous findings (Fig. 3a)15,22,23. The duration of the evoked activity was increased in slices from injured rats (Fig. 3a).
In addition to enhanced evoked oscillations, post-stroke (injured) thalamic slices (8 of 8 slices from 3 rats) also generated 1–5-s-long robust spontaneous epileptiform network oscillations that were never observed in control slices (0 of 5 slices from 3 rats) (Fig. 3a). This epileptiform activity was observed in the gliotic thalamus and within ~200 µm of its border, corresponding to the border between VPL and VPM, including the lateral VPM. These results indicate that cortical stroke leads, over time, to a hyperexcitable intra-thalamic network of surviving cells that is then able to generate epileptiform activities. Similar multiunit bursting activity in thalamus was observed during spontaneously occurring seizures in awake, behaving rats post-stroke (Supplementary Movie 1).
Computational modeling of intrathalamic network activityWe assessed whether thalamocortical cellular modifications could be responsible for enhanced oscillations in the thalamic network in a computational model that included thalamocortical and nRT neurons and a constant cortical input (Fig. 3b). Using a single-cell model, we found that the combined modifications in membrane area and in Ih (V50%) and faster activation time constant (τa) could account for the post-stroke hyperexcitability in thalamocortical cells
(Supplementary Fig. 3). We found that these intrinsic changes in cell size and in Ih activation properties enhanced thalamic network oscillations (Fig. 3b,c and Supplementary Fig. 4). Specifically, a change in both intrinsic properties reduced the threshold for initiation of oscillations, as it increased the magnitude of the hyperpolarizing current required to prevent the oscillation (Fig. 3c). Notably, this effect on threshold resulted from a supra-linear interaction of intrinsic changes (Fig. 3d).
Moreover, the oscillation duration was enhanced by the changes in intrinsic excitability in thalamocortical neurons (Fig. 3e and Supplementary Fig. 5). Thus, the alterations that we observed in Ih and in membrane area in injured thalamocortical cells (Figs. 1 and 2) are epileptic in that they make the thalamus oscillate for longer durations or in conditions in which it would normally be silent. The enhanced oscillations in the injured conditions were very robust in that they were unaffected by reducing nRT spike output (data not shown), which would result from reduced excitability of nRT following focal cortical stroke19. Finally, we found that we were able to restore both the duration and the threshold of oscillation initia-tion by modifying Ih and leak conductances, gh and gL, respectively (Fig. 3d,e and Supplementary Figs. 4 and 5).
Cortical stroke induces thalamocortical epilepsyChronic monitoring of control (n = 7) and injured (n = 5) rats up to 10 months revealed that stroke resulted in spontaneous ictal activity only in injured rats (3 of 5 rats). Seizures were 10–120-s-long and occurred >1 month post-stroke, consistent with previous findings17,18,24, and were associated with motor arrest (Supplementary Movies 2 and 3). The oscillatory power of the ictal electroencephalogram (EEG) peaked in the 3–5-Hz and 8–10-Hz frequency bands (Fig. 4a–c and Supplementary Fig. 6c) and had a different spectral signature than typical absence seizures in rats, consistent with a previous study17.
Figure 3 Intra-thalamic network is hyperexcitable and generates epileptiform oscillations in injured animals and in a model. (a) Top, multiunit recordings in thalamic slices ipsilateral to cortical stroke depicting network oscillations evoked by single electrical shocks (arrowheads) to internal capsule. Inset, box charts of oscillation duration from three control rats (n = 5 slices) and three injured rats (n = 8 slices); one-way ANOVA. Bottom, representative spontaneous activities. Red box indicates the recording enlarged on the bottom trace. Note the crescendo, decrescendo pattern of the oscillation (dots and arrows). Statistical box charts show the mean (central dot), median (large horizontal line), 99% and 1% range (crosses), 25–75% percentile range (box), and 5–95% percentile range (whiskers). (b) Top, minimal thalamus model including a thalamocortical (TC) neuron, negative feedback through reticular thalamic neurons (gGABA) and a constant steady-state cortical input current (Iinj). Bottom, changes in intrinsic excitability (Ih + area: altered activation of both Ih and membrane area) promoted epileptiform thalamocortical response in the network. * represents the time of stimulation. (c) Map of oscillation duration as a function of the reticular thalamic–thalamocortical feedback (gGABA) and the injected input current (Iinj) indicates that, in injured conditions, a larger hyperpolarizing current (Iinj) was required to prevent the initiation of oscillations. Threshold for oscillation initiation refers to the threshold value of Iinj above which an oscillation is initiated. (d) Difference in threshold for oscillation initiation between control and different injured conditions: ∆θ(Ih + area) (solid red) when combining altered area and altered Ih activation, ∆θ(Ih)+∆θ(area) (dashed line) when adding separate effects of altered area and altered Ih activation, or following combined therapeutic conditions with modified h and leak conductances (∆θ(T/gh + gL), bluish green). (e) Difference in oscillation duration between control and injured conditions as a function of gGABA in the physiological range of resting membrane potential (dashed lines). Duration was increased in injured conditions (top) and restored to control level under therapeutic conditions (bottom). Ih, only Ih activation was altered (Fig. 2); area: only membrane area was altered (lower Cm; Fig. 1 and Online Methods); Ih + area: both properties were altered (Supplementary Figs. 4 and 5 for details).
a b
d e
cEvoked oscillations Oscillation duration
Infinite
Infinite
Control
Injured(lh + area)
Transient
Transient
Silence
Silence
0.5
Control slice Control–72.4 mV
Injured slice
50
3
nRT
Output
I inj (
µA•c
m–2
)
–65.7 mV
Injured(lh + area)
*
*
25 mV
500 ms
(ms)
gGABA
IInjTC
2P < 0.05
1
0Control InjuredO
scill
atio
n du
ratio
n (s
)
1 s
1 s
µV
50µV
Spontaneous oscillationsControl slice
Injured slice 5 s
5 s
1 s
50µV
50
50
µV
µV
0–0.5–1.0–1.50.5
0–0.5–1.0–1.5
200 40 60 80 100
gGABA (mS•cm–2)
Control
∆θ (
µA•c
m–2
) ∆θ(lh + area)
∆θ(lh)+
∆θ(area)
∆θ(T/gh + gL)
Threshold shift1.0
20 400 60
gGABA (mS•cm–2)
80 100
0.5
–0.5
0
2,000
1,600
1,200
800
400
0
Injured(lh + area) – control
T/gh+gL – control
Change in oscillation duration–55
(ms)200 40 60 80 100
gGABA (mS•cm–2)
<–2,000
>2,000
–1,000
1,000
0
–65
–75
–85
–65
–75
VR
est (
mV
)V
Res
t (m
V)
–85

©20
12 N
atu
re A
mer
ica,
Inc.
All
rig
hts
res
erve
d.
advance online publication nature neurOSCIenCe
a r t I C l e S
Post-stroke seizures had clear thalamic involvement even though their spectral properties were distinct from typical thalamocortical absence seizures. In addition, seizure-like oscillations usually spread to the contralateral hemisphere, consistent with previous findings24, and were synchronized in cortical EEG and thalamic local field potentials (LFPs) (Figs. 4a,b and 5 and Supplementary Figs. 6a,b and 7d).
Reducing thalamic output aborts seizures in behaving ratsNext, we asked whether thalamocortical cell activity is important for seizure expression in vivo. To test whether seizures could be termi-nated by selectively inhibiting thalamocortical neurons, we expressed either eNpHR3.0, which enables membrane hyperpolarization and reduction of action potential firing when illuminated with yellow light25, or eYFP under the Camk2a promoter, in the ventrobasal
thalamus ipsilateral to cortical stroke. We then designed a device containing multiple EEG electrodes and a CMO26 (Supplementary Fig. 7b and Online Methods) and implanted the CMO in ipsilateral ventrobasal thalamus (Fig. 5a) to allow the selective illumination of thalamocortical neurons while monitoring their firing. We also implanted four chronic EEG electrodes, two above peri-stroke cortex (within ~0.5 mm of the edge of the lesion; see Fig. 5b) and two in the corresponding contralateral cortex (Supplementary Fig. 8c and Online Methods). This allowed us to monitor the effect of optical inhibition of thalamocortical neurons on simultaneously recorded thalamocortical multiunit firing, LFP, cortical EEG and behavior in four rats. Selective illumination of eNpHR3.0-expressing thalamocor-tical neurons with 594-nm light interrupted ongoing electrographic epileptic activities in thalamus and cortex (Fig. 5c,d), as well as the behavioral seizure, and the rats immediately resumed normal behavior
Figure 5 Selective optical inhibition of thalamocortical neurons interrupts ongoing epileptic seizures in awake, freely behaving animals. (a) Diagram of chronic multisite optrode (CMO) implanted into somatosensory thalamus for behaving recordings and optical stimulations. Arrowheads indicate thalamic recording sites (T1–4). (b) Confocal image of coronal brain section taken through the cortical lesion (red dashed line) showing eNPHR-expressing thalamocortical fibers terminating mainly in layer 4 (yellow arrow) from a rat killed after recordings. (c) Representative example of simultaneously recorded cortical EEGs and thalamic LFPs before and during 594-nm light delivery in the thalamus ipsilateral to stroke. Arrows indicate seizure onset and its interruption by light delivery in thalamus. (d) Mean spectrograms of thalamic LFPs and cortical EEGs from the same rat. We delivered 594-nm light pulses in VPM at time 0. Shown are examples from all stimulations (ictal, n = 19; interictal, n = 4) from a single recording session ~4.2 months post-stroke, 4 months post-viral delivery in thalamus. (e,f) Power quantification of cortical EEGs (e) and thalamic LFPs (f) before and during light delivery in thalamus (e left: ictal, n = 56 events from 3 different trials; interictal, n = 8 events from 2 different trials; e right: ictal, n = 6 events from 2 different trials; interictal, n = 11 events from 2 different trials). Results in the left and right panels of e are from two different rats. The results shown in f and the left panel of e are from the same rat. r.m.s. power was averaged 2 s before and 2 s during light delivery (see Online Methods). Error bars represent s.e.m. ns, P ≥ 0.1; *P < 0.05, **P < 0.01, ***P < 0.0001, paired t test or signed rank test, as appropriate. Results in c–f were obtained using light at 10 mW.
Optical fibera b d
c
e
f
T4T3T2T1 VPM
VPL
Ipsi. cx.
Contra. cx.T4
T3
T2
T1
Rat 1 Rat 2
0.12
0.06
r.m
.s. p
ower
(m
V)
r.m
.s. p
ower
(m
V)
r.m
.s. p
ower
(m
V)
r.m
.s. p
ower
(m
V)
0
0.12
0.06
0
Ipsi.
Contra
.Ip
si.
Contra
.Ip
si.
Contra
.Ip
si.
Contra
.
Cortex
Thalamus ictal Thalamus interictal
Pre-light Light
T10.18
0.12
0.06
0
0.18
0.12
0.06
0
T2 T3 T4
T1 T2 T3 T4
Ictal Interictal
Cortex
Ictal Interictal
ns ns
ns ns ns ns
ns ns
***
***********
** ****
Onset Interruption
Ictal
Ipsi. cx.
Contra. cx.
Fre
quen
cy (
Hz)
Fre
quen
cy (
Hz)
4.5
0
4.5
0
7
0
7
0
7
0
5.5
0–5 0 5
Time (s)
102
101
100
102
101
100
102
101
100
102
101
100
102
101
100
102
101
100
Interictal
0.8mV
1 s
RT
Midline
1 mm
1 mm
Thalamus T4
Thalamus T3
Thalamus T2
Light
Thalamus T1
Ipsi. cx.102 12
0
101
100
Contra. cx.102 20
0
101
100
102 8
0
101
100
Thalamus T4
102 8
0
101
100
Thalamus T3
102 18
0
101
100
Thalamus T2
Pre-light Light
102 20
0
101
100
–5 0 5Time (s)
Thalamus T1
Light
Figure 4 Cortical stroke leads to late spontaneous epileptic activities in cortex and thalamus. (a) EEG wavelet spectrogram from a representative cortical channel (top trace). Vertical dashed lines indicate the onset and the end of the electrographic seizure activity. White traces represent simultaneous cortical EEG and thalamic LFP recordings, temporally aligned with the wavelet spectrogram. (b) Representative 1-s-long ictal and interictal EEG recordings from the recordings depicted in a. (c) Corresponding power spectra of ictal (orange) and interictal (black) EEG activities from the ipsilateral cortex channel. Dots indicate the dominant peak frequencies during ictal periods (4–5 and 8–10 Hz). The depicted recordings were obtained 6.5 months after stroke induction from a 7.5-month-old rat. Contra. cx., contralateral cortex; Ipsi. cx., ipsilateral cortex; Thal., thalamic.
0.7 mV
Interictal
b
lpsi. cx.
Contra. cx.
Thal. 1
Thal. 4
Thal. 3
Thal. 2
Ictal
c4
3
mV2•Hz–1 (×10–3)
2
Pow
er
1
00 50Frequency (Hz)
a (Hz)
102
101
100
Cortex
Thal.
Time (s)0 5 10 15 20 25 30 35
10
0
©20
12 N
atu
re A
mer
ica,
Inc.
All
rig
hts
res
erve
d.
nature neurOSCIenCe advance online publication
a r t I C l e S
(Supplementary Movie 4). The finding that inhibition of thalamocor-tical neurons ipsilateral to stroke interrupted not only ipsilateral, but also contralateral seizures, indicates that seizures were generated in the hemisphere ipsilateral to stroke. Following interruption of the seizure by light, there was a resumption of normal thalamic and cortical acti-vities (Fig. 5c–f) coinciding with a switch to non-epileptic behavior.
Thus, selectively inhibiting thalamocortical output was sufficient to switch off the ongoing electrographic and behavioral seizure.
Lower intensity light (≤5 mW) did not significantly affect tha-lamic activity (P > 0.5) and was not effective in disrupting seizures (Supplementary Fig. 7a,c,d). Notably, the laser light at the inten-sity used to silence the seizures did not affect normal physiological rhythms in control non-injured animals (data not shown) or the normal EEG activities between seizures (referred to as interic-tal) in epileptic animals (Fig. 5e,d and Supplementary Fig. 8a), and did not seem to affect normal interictal behavior such as sleep (Supplementary Movie 5).
In contrast with eNpHR3.0-transduced rats, light had no effect on eYFP-transduced rats, indicating that disruption of thalamocortical oscillations and seizures was a result of eNpHR3.0 activation and not of nonspecific effects of light, such as heating or visual cueing. We also confirmed that 594-nm light illumination silenced the firing of eNpHR3.0-expressing thalamocortical neurons in vitro (n = 9 cells
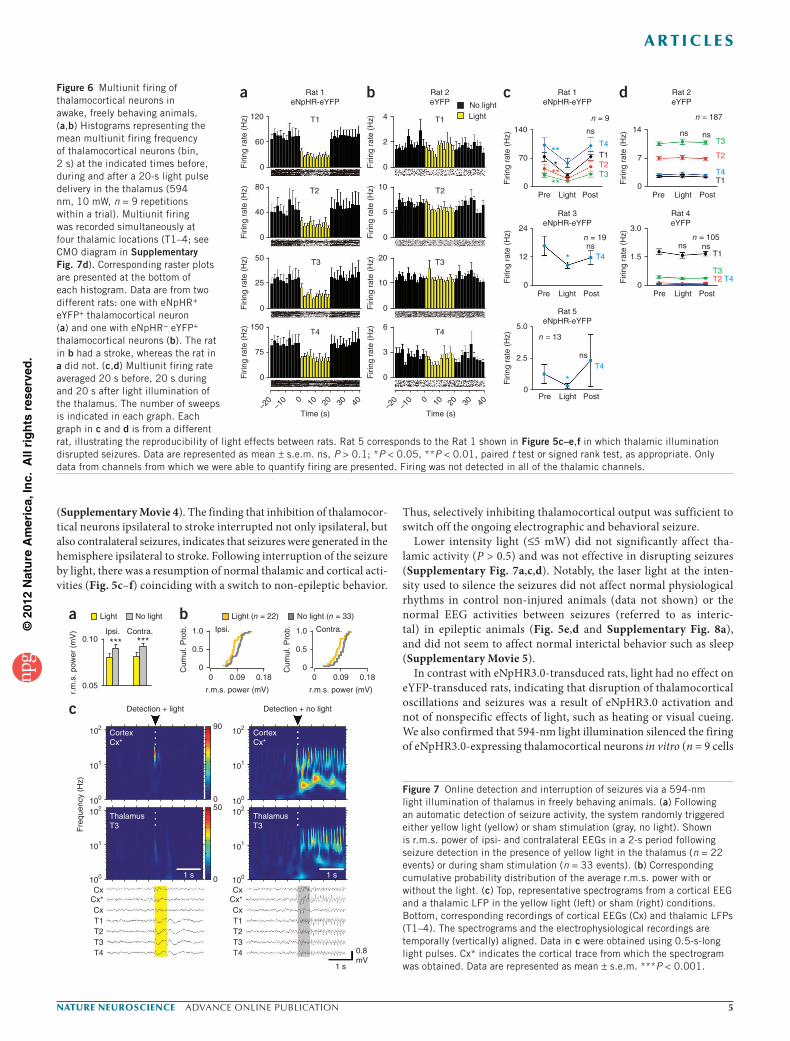
Figure 6 Multiunit firing of thalamocortical neurons in awake, freely behaving animals. (a,b) Histograms representing the mean multiunit firing frequency of thalamocortical neurons (bin, 2 s) at the indicated times before, during and after a 20-s light pulse delivery in the thalamus (594 nm, 10 mW, n = 9 repetitions within a trial). Multiunit firing was recorded simultaneously at four thalamic locations (T1–4; see CMO diagram in Supplementary Fig. 7d). Corresponding raster plots are presented at the bottom of each histogram. Data are from two different rats: one with eNpHR+ eYFP+ thalamocortical neuron (a) and one with eNpHR− eYFP+ thalamocortical neurons (b). The rat in b had a stroke, whereas the rat in a did not. (c,d) Multiunit firing rate averaged 20 s before, 20 s during and 20 s after light illumination of the thalamus. The number of sweeps is indicated in each graph. Each graph in c and d is from a different rat, illustrating the reproducibility of light effects between rats. Rat 5 corresponds to the Rat 1 shown in Figure 5c–e,f in which thalamic illumination disrupted seizures. Data are represented as mean ± s.e.m. ns, P > 0.1; *P < 0.05, **P < 0.01, paired t test or signed rank test, as appropriate. Only data from channels from which we were able to quantify firing are presented. Firing was not detected in all of the thalamic channels.
a Rat 1eNpHR-eYFP
120
80
50
25
40
0
0
150 6
3
0
4
140
24 3.0
5.0
1.512
n = 9
n = 19
n = 13
n = 105
n = 187
ns
ns
ns
ns ns
ns nsT4
T4
T4
*
*
**
****
*T4
T4
T1
T1
T1
T2
T2
T2
T3
T3
T3
Pre Light Post
Pre Light Post
Pre Light Post
Pre Light Post
Pre Light Post
70
0
0
14
7
0
0
No lightLight
2
0
10
20
10
0
Firi
ng r
ate
(Hz)
Firi
ng r
ate
(Hz)
Firi
ng r
ate
(Hz)
Firi
ng r
ate
(Hz)
Firi
ng r
ate
(Hz)
Firi
ng r
ate
(Hz)
Firi
ng r
ate
(Hz)
Firi
ng r
ate
(Hz)
Firi
ng r
ate
(Hz)
Firi
ng r
ate
(Hz)
Firi
ng r
ate
(Hz)
Firi
ng r
ate
(Hz)
Firi
ng r
ate
(Hz)
60
0
Rat 1eNpHR-eYFP
Rat 3eNpHR-eYFP
Rat 5eNpHR-eYFP
Rat 4eYFP
Rat 2eYFP
Rat 2eYFP
T1
T2
T3
T4 T4
T3
T2
T1
b c d
5
0
75
0
–20
–10 0 10 20 30 40
Time (s)–2
0–1
0 0 10 20 30 40
Time (s)
2.5
0
c
a b
r.m
.s. p
ower
(m
V)
0.10Ipsi.
*** ***Contra.
0.05
No lightLight
Cum
ul. P
rob.
Cum
ul. P
rob.1.0
0.5
0
1.0
0.5
0
Ipsi.
0 0.09 0.18
r.m.s. power (mV)
0 0.09 0.18
r.m.s. power (mV)
Contra.
No light (n = 33)Light (n = 22)
Detection + light
90
050
0
CortexCx*
101
100
102
101
102
100
CxCx*CxT1T2T3T4
ThalamusT3
1 s
Fre
quen
cy (
Hz)
102
101
100
102
101
100
CxCx*CxT1T2T3T4 0.8
mV1 s
CortexCx*
1 s
ThalamusT3
Detection + no light
Figure 7 Online detection and interruption of seizures via a 594-nm light illumination of thalamus in freely behaving animals. (a) Following an automatic detection of seizure activity, the system randomly triggered either yellow light (yellow) or sham stimulation (gray, no light). Shown is r.m.s. power of ipsi- and contralateral EEGs in a 2-s period following seizure detection in the presence of yellow light in the thalamus (n = 22 events) or during sham stimulation (n = 33 events). (b) Corresponding cumulative probability distribution of the average r.m.s. power with or without the light. (c) Top, representative spectrograms from a cortical EEG and a thalamic LFP in the yellow light (left) or sham (right) conditions. Bottom, corresponding recordings of cortical EEGs (Cx) and thalamic LFPs (T1–4). The spectrograms and the electrophysiological recordings are temporally (vertically) aligned. Data in c were obtained using 0.5-s-long light pulses. Cx* indicates the cortical trace from which the spectrogram was obtained. Data are represented as mean ± s.e.m. ***P < 0.001.

©20
12 N
atu
re A
mer
ica,
Inc.
All
rig
hts
res
erve
d.
advance online publication nature neurOSCIenCe
a r t I C l e S
from 4 rats; Supplementary Fig. 9) and reduced the multiunit firing in the thalamus in eNpHR3.0-transduced (n = 4 rats: 2 injured and 2 non-injured), but not in eYFP-transduced, behaving animals (n = 2 injured rats; Fig. 6).
Finally, we engineered a method for detecting and silencing sei-zures online in chronically implanted rats (Supplementary Fig. 1c). An EEG channel was routed to a real-time processor that calculated the EEG line length27 and triggered laser stimulation on crossing of a threshold. This system was capable of detecting and silenc-ing seizures within 1 s of initiation (Figs. 7 and 8, Supplementary Fig. 1 and Supplementary Movies 6 and 7). We were able to validate this method up to nearly a year post-stroke in two injured rats with chronic implants (Figs. 7 and 8 and Supplementary Figs. 1c and 8).
DISCUSSIONWe used temporally precise, cell type–specific optogenetic manip-ulations to identify a neural substrate that can be readily targeted
for post-injury seizure control. In sum, we found that focal photo-thrombotic stroke in the rat somatosensory cortex led to secondary changes and hyperexcitability in the functionally related thalamus. Changes in input resistance and Ih in thalamocortical neurons enhanced their rhythmogenesis. A minimal computational model suggested that such changes increase thalamic network excitability and support epileptiform oscillations. To test this model, we designed a method for specifically silencing thalamocortical neurons from this hyperexcitable thalamic region in real time. Reducing the thala-mocortical output rapidly (<1s) interrupted the electrographic and behavioral seizure. Thus, we provide, to the best of our knowledge, the first evidence that thalamocortical neuronal activity is required for post-stroke epilepsy given that reducing activity of thalamocortical cells is sufficient to disrupt seizures either at their onset or after their generalization. Our observation of efficient thalamic inhibition was not expected in light of the current working model, according to which epilepsy results mainly from maladaptive reorganization in cortex adjacent to the damaged area. Disruption of seizures at their onset with closed-loop control, via a brief targeted inhibition of thalamocortical cells, as we found here, is a promising potential therapeutic approach for otherwise untreatable epilepsies, as it would not affect normal brain activity between seizures, as might other therapeutic approaches, such as surgical lesions or chronic treatment with pharmacological agents.
It is important to note that the goal of our study was not to deter-mine the exact site of seizure initiation. Irrespective of the question of whether the seizure initiates in cortex or thalamus, we found that the thalamic output was required to maintain the cortical electrographic and behavioral seizure. A major advantage of targeting thalamocorti-cal maintenance of seizures is that this mechanism of a rapid disrup-tion of seizures via a brief inhibition of thalamus would be synergistic with other treatments targeting, for example, seizure initiation, seizure spread or secondary epileptogenesis. Another key benefit of targeting thalamus is that it would not disrupt higher cognitive functions that are dependent on intracortical processing.
The Ih alterations that we observed in thalamocortical cells are similar to what have been described in other epilepsy models20, sug-gesting that these alterations could be a mechanism that is common to various epilepsies. The finding of altered intrinsic properties (Ih and Rin) in thalamocortical neurons that enhanced rhythmogenesis led us to hypothesize that inhibiting these hyperexcitable thalamocortical neurons could rapidly abort cortical seizures.
Even though Ih alterations do not entirely account for thalamic hyperexcitability, it is possible that manipulating Ih, either chroni-cally or transiently, could also lead to seizure disruption. Indeed, as suggested by our computational model, combining a reduction in gh and an increase in gL in thalamocortical cells is expected to be anti-epileptic. However, for real-time anti-seizure control, we chose a cell type–specific optogenetic approach rather than a pharmacological manipulation of Ih. The latter would not be cell specific or provide real-time control. Future technologies might allow targeted real-time manipulation of ion channel–mediated currents, such as Ih, that could act as similarly effective and more specific treatments of the epileptic injury. Alternatively, the broad, but temporally specific, reduction of thalamocortical excitability that we found may prove to be the most effective approach.
In conclusion, our findings at cellular, network and behavioral levels provide causal support for the hypothesis that the thalamus is critically involved in cortical injury–induced epilepsy and lead to the general concept that a structure remote from, but connected to, primary damaged tissue via long-range projections can be critically
5 s
a
b
c
d
e
5 s
5 s
5 s
5 s 1 s
2 s
2 s
2 s
2 s
0.5mV
0.5mV
0.5mV
0.5mV
0.25mV
Figure 8 Line-length calculation for real-time detection of seizures. (a–e) EEG recordings (black traces) and their corresponding line length (red traces) calculated in real time using a 2-s sliding window (see Online Methods). Line-length threshold for seizure detection was set manually at the beginning of the experiment. After upward crossing of the threshold (dashed line), the system randomly triggered either laser stimulation (yellow boxes) or no stimulation (gray boxes). Seizure activity was interrupted by 0.5-s-long and 10-s-long 594-nm light pulses (10 mW) in real time. Data are from two different rats (one shown in a–d and the other in e). Traces depicted at the left are enlarged on the right for visibility.

©20
12 N
atu
re A
mer
ica,
Inc.
All
rig
hts
res
erve
d.
nature neurOSCIenCe advance online publication
a r t I C l e S
involved in abnormal brain activity such as seizures. Our results suggest previously unknown roles for long-range connections in maintaining normal and pathologic oscillations, and potential future therapeutic strategies for silencing specific remote structures in cases in which removal of the damaged cortical area is not an option or does not result in seizure control. The finding that thalamus is criti-cal for maintaining seizure activity suggests that targeting a spatially restricted region of the thalamus might be a more tractable therapeutic target for neural modulation than targeting the corresponding, yet more spatially extended, cortical abnormality.
METHODSMethods and any associated references are available in the online version of the paper.
Note: Supplementary information is available in the online version of the paper.
AcknowledgMenTSWe thank C. Pisaturo for designing and fabricating custom electronics, A. Herbert and S. Jin for their help with animal husbandry, and K. Graber and D. Prince for discussions related to clinical aspects of post-stroke epilepsy. J.T.P. is supported by the US National Institute of Neurological Disorders and Stroke (grant K99NS078118-01) and the Epilepsy Foundation. J.R.H. is supported by grants from the US National Institute of Neurological Disorders and Stroke (5R01NS006477 and 5R01NS034774). T.J.D. is supported by a Berry Foundation Postdoctoral fellowship. K.D. is supported by the Howard Hughes Medical Institute, the California Institute for Regenerative Medicine, the US National Institutes of Health and the Defence Advanced Research Projects Agency (DARPA) Reorganization and Plasticity to Accelerate Injury Recovery (REPAIR) Program. E.S.F. is supported by a Epilepsy Foundation Postdoctoral Fellowship.
AUTHoR conTRIBUTIonSJ.T.P. and J.R.H. designed the experiments and wrote the manuscript. J.T.P. performed all of the in vitro experiments. J.T.P. and T.J.D. designed and performed the in vivo experiments. B.D. performed computational modeling. K.P. performed pilot EEG recordings. I.P. performed histology. J.T.P., J.R.H. and E.S.F. analyzed data. K.D. provided reagents and tools.
coMPeTIng FInAncIAl InTeReSTSThe authors declare no competing financial interests.
Published online at http://www.nature.com/doifinder/10.1038/nn.3269. Reprints and permissions information is available online at http://www.nature.com/reprints/index.html.
1. Clarkson, A.N., Huang, B.S., Macisaac, S.E., Mody, I. & Carmichael, S.T. Reducing excessive GABA-mediated tonic inhibition promotes functional recovery after stroke. Nature 468, 305–309 (2010).
2. Kotila, M. & Waltimo, O. Epilepsy after stroke. Epilepsia 33, 495–498 (1992).3. Kelly, K.M. Animal modeling of poststroke seizures and epilepsy: 5-year update.
Epilepsy Curr. 7, 159–162 (2007).4. Lee, J.-C. et al. Seizures in childhood ischemic stroke in Taiwan. Brain Dev. 31,
294–299 (2009).
5. Kwan, P. & Brodie, M.J. Early identification of refractory epilepsy. N. Engl. J. Med. 342, 314–319 (2000).
6. Loiseau, P. Pathologic processes in the elderly and their association with seizures. in Seizures and Epilepsy in the Elderly (eds. Rowan, A.J. & Ramsay, E.) 63–85 (Butterworth-Heinemann, 1997).
7. Hoffman, S.N., Salin, P.A. & Prince, D.A. Chronic neocortical epileptogenesis in vitro. J. Neurophysiol. 71, 1762–1773 (1994).
8. Huguenard, J.R. & Prince, D.A. Basic mechanisms of epileptic discharges in the thalamus. in The Thalamus: Experimental and Clinical Aspects (eds. Steriade, M., Jones, E.G. & McCormick, D.) 295–330 (Elsevier, 1997).
9. Bruehl, C., Kloiber, O., Hossman, K.A., Dorn, T. & Witte, O.W. Regional hypometabolism in an acute model of focal epileptic activity in the rat. Eur. J. Neurosci. 7, 192–197 (1995).
10. Detre, J.A., Alsop, D.C., Aguirre, G.K. & Sperling, M.R. Coupling of cortical and thalamic ictal activity in human partial epilepsy: demonstration by functional magnetic resonance imaging. Epilepsia 37, 657–661 (1996).
11. Redecker, C., Bruehl, C., Hagemann, G., Binus, O. & Witte, O.W. Coupling of cortical and thalamic metabolism in experimentally induced visual and somatosensory focal epilepsy. Epilepsy Res. 27, 127–137 (1997).
12. Gasteiger, E.L., Albowitz, B. & Barken, F.M. Interictal afterdischarge in focal penicillin epilepsy: block by thalamic cooling. Exp. Neurol. 88, 349–359 (1985).
13. Mondragon, S. & Lamarche, M. Suppression of motor seizures after specific thalamotomy in chronic epileptic monkeys. Epilepsy Res. 5, 137–145 (1990).
14. Tye, K.M. & Deisseroth, K. Optogenetic investigation of neural circuits underlying brain disease in animal models. Nat. Rev. Neurosci. 13, 251–266 (2012).
15. Paz, J.T. et al. A new mode of corticothalamic transmission revealed in the Gria4−/− model of absence epilepsy. Nat. Neurosci. 14, 1167–1173 (2011).
16. Tønnesen, J., Sørensen, A.T., Deisseroth, K., Lundberg, C. & Kokaia, M. Optogenetic control of epileptiform activity. Proc. Natl. Acad. Sci. USA 106, 12162–12167 (2009).
17. Kelly, K.M. et al. Photothrombotic brain infarction results in seizure activity in aging Fischer 344 and Sprague Dawley rats. Epilepsy Res. 47, 189–203 (2001).
18. Kharlamov, E.A., Jukkola, P.I., Schmitt, K.L. & Kelly, K.M. Electrobehavioral characteristics of epileptic rats following photothrombotic brain infarction. Epilepsy Res. 56, 185–203 (2003).
19. Paz, J.T., Christian, C.A., Parada, I., Prince, D.A. & Huguenard, J.R. Focal cortical infarcts alter intrinsic excitability and synaptic excitation in the reticular thalamic nucleus. J. Neurosci. 30, 5465–5479 (2010).
20. Reid, C.A., Phillips, A.M. & Petrou, S. HCN channelopathies: pathophysiology in genetic epilepsy and therapeutic implications. Br. J. Pharmacol. 165, 49–56 (2012).
21. Huguenard, J.R. & Prince, D.A. Intrathalamic rhythmicity studied in vitro: nominal T-current modulation causes robust antioscillatory effects. J. Neurosci. 14, 5485–5502 (1994).
22. Schofield, C.M., Kleiman-Weiner, M., Rudolph, U. & Huguenard, J.R. A gain in GABAA receptor synaptic strength in thalamus reduces oscillatory activity and absence seizures. Proc. Natl. Acad. Sci. USA 106, 7630–7635 (2009).
23. Bryant, A.S., Li, B., Beenhakker, M.P. & Huguenard, J.R. Maintenance of thalamic epileptiform activity depends on the astrocytic glutamate-glutamine cycle. J. Neurophysiol. 102, 2880–2888 (2009).
24. Karhunen, H. et al. Epileptogenesis after cortical photothrombotic brain lesion in rats. Neuroscience 148, 314–324 (2007).
25. Gradinaru, V. et al. Molecular and cellular approaches for diversifying and extending optogenetics. Cell 141, 154–165 (2010).
26. Yizhar, O. et al. Neocortical excitation/inhibition balance in information processing and social dysfunction. Nature 477, 171–178 (2011).
27. Esteller, R., Echauz, J., Tcheng, T., Litt, B. & Pless, B. Line length: an efficient feature for seizure onset detection. Eng. Med. Biol. Soc. Proc. 23rd Ann. Int. Conf. IEEE 2, 1707–1710 (2001).

©20
12 N
atu
re A
mer
ica,
Inc.
All
rig
hts
res
erve
d.
nature neurOSCIenCe doi:10.1038/nn.3269
ONLINE METHODSWe performed all of the experiments according to protocols approved by the Stanford Institutional Animal Care and Use Committee, and every precaution was taken to minimize stress and the number of animals used in each series of experiments.
cortical photothrombotic stroke. We performed photothrombosis as described previously19 on Sprague Dawley rats on postnatal days 25–30 (P25–30). Briefly, we anesthetized the rats, injected the light-sensitive Rose Bengal dye (40 mg per kg of body weight, Sigma-Aldrich) into the tail vein and focused a light from a 3-mm-diameter fiber optic cable on the skull. The optical system was designed to have an emission spectrum that encompassed the in vivo absorption range of Rose Bengal (maximum absorbance at 562 nm). To induce a focal photothrombotic lesion in the right somatosensory cortex, we centered the light beam 4.5–5 mm lateral and 2.5 mm caudal to bregma. Control littermate rats received the same injection of Rose Bengal, but were not photostimulated.
Slice preparation. We anesthetized injured and control littermate rats (P30–180) with pentobarbital (100 mg per kg, intraperitoneal) and decapitated them. We prepared thalamic slices as previously described15.
Thalamic oscillations. We recorded extracellular multiunit activity in horizontal slices (400 µm) containing somatosensory thalamus as described15. Briefly, we placed thalamic slices in an interface chamber at 34 °C and superfused them at a rate of 2 ml min−1 with oxygenated artificial cerebrospinal fluid containing 126 mM NaCl, 2.5 mM KCl, 1.25 mM NaH2PO4, 2 mM MgCl2, 2 mM CaCl2, 26 mM NaHCO3 and 10 mM glucose, equilibrated with 95% O2 and 5% CO2, pH 7.4, supplemented with 0.3 mM glutamine23. We performed extracellular multiunit recordings with monopolar tungsten microelectrodes (50–100 k, FHC) placed in ventrobasal thalamus. Signals were amplified 10,000 times and band-pass filtered between 100 Hz and 3 kHz. We delivered electrical stimuli to the internal capsule with a pair of tungsten microelectrodes (50–100 kΩ, FHC). The stimuli were 100 µs in duration, 50 V in amplitude and delivered once every 30 s.
whole-cell patch-clamp electrophysiology from thalamic slices. We per-formed the recordings as previously described15. We visually identified nRT and thalamocortical neurons using differential contrast optics with a Zeiss (Oberkochen) Axioskop microscope and an infrared video camera. Recording electrodes made of borosilicate glass had a resistance of 2.5–4 MΩ when filled with intracellular solu-tion. During recordings, we filled the cells with 0.2–0.5% (w/v) biocytin (Sigma-Aldrich) included in the internal solution. We corrected the potentials for −15-mV liquid junction potential. We performed the recordings in the presence of GABAA receptor antagonist picrotoxin (50 µM, Tocris). We blocked GABAA receptors to determine whether the increased input resistance of thalamocortical neurons in injured versus control rats resulted from changes in GABAA receptor–mediated conductance, which we suspected, given that the inhibitory reticular thalamic– thalamocortical pathway is markedly reduced after stroke19. We monitored the access resistance in all the recordings, and included cells for analysis only if the access resistance was <18 MΩ and the change of resistance was <20% over the course of the experiment. We fixed whole slices and processed them using the standard avidin–biotin peroxidase method28,29. We processed the slices for immuno-fluorescence for glial fibrillary acidic protein (GFAP, Millipore)19. We assessed immunofluorescence with a laser confocal microscope (Zeiss LSM 510).
Ih activation and de-activation curves30. The Ih activation curve was con-structed by measuring tail currents elicited by repolarizing the membrane to −65-mV holding level following voltage steps between −60 to −135 mV (Fig. 2a,c). We measured Ih at the tail current 0.7 s after the test voltage pulse (Fig. 2a) to minimize the contribution of capacitative or non-Ih active currents by allowing sufficient time for these events to dissipate before measuring Ih (ref. 30). We normalized the tail current amplitudes (Itail) to the maximal ampli-tude (Itail max) and plotted them against the membrane potential to which the neuron was stepped during activation of Ih (Fig. 2a). The resulting data were then fitted with a Boltzmann function
II
A Ae
AV kmax
( )/%= −
++−
1 21 50 2V
where V50% and k represent the half-maximal voltage and Boltzmann slope factor, respectively. A1 and A2 represent initial and final I/Imax values, respectively.
Over the entire voltage range tested, Ih was well fitted (r = 0.99) by a single-exponential function, I t A A e t( ) /= + −
0 1t , where I(t) is the amplitude
current at time t, A0 and A1 are amplitude components, and τ is the time con-stant (Fig. 2f,g).
Patch clamp electrophysiology data acquisition and analysis. We used Digidata 1320 digitizer and pClamp9 (Molecular Devices) for data acquisition and ana-lysis. We amplified the signals with Multiclamp 700a (Molecular Devices), and sampled and filtered them at 10 kHz. We calculated the amplitude of action potentials as the potential difference between their voltage threshold and the peak of the waveform.
experimental design and statistical analysis. Numerical values are given as means ± s.e.m. unless stated otherwise. The sample sizes used are standard for the field. For statistical analyses, we assessed normality (Sigmastat) before choosing the relevant comparative test. We used nonparametric tests in cases in which the normality test failed. We assessed statistical significance, as appropriate, by per-forming one-way ANOVA, the Mann-Whitney rank sum test or the Kolmogoroff-Smirnoff test. We performed statistical analysis with Sigma Stat 3.5 and Origin 7.0 (Microcal Software). The experiments reported here were not performed by blinded observers, as relevant analyses, such as seizure detection were performed by standardized and/or automated routines.
optogenetics. Stereotactic viral injections were carried out as previously described15. Briefly, we kept the rats under isoflurane anesthesia in a stereotactic frame. We performed craniotomies so as to cause minimal damage to cortical tissue. We injected virus carrying genes for fluorescent proteins and eNpHR (rAAV5/Camk2a-eNpHR-eYFP), or for fluorescent proteins alone (rAAV5/Camk2a-eYFP), stereotaxically in vivo into the right somatosensory ventrobasal thalamus 1–2 weeks after stroke induction or Rose Bengal treatment in injured and control rats, respectively. Injection of viral DNA under Camk2a promoter results in expression only in excitatory thalamic neurons15. We infused 500 nl of the concentrated virus suspension (2 × 10¹² genome copies per milliliter) into ventrobasal thalamus using a 10-µl syringe and 34-gauge needle. We controlled the injection rate (100 nl min−1) by pump (World Precision Instruments). The stereotaxic coordinates of the injections were 2.6–2.7 mm posterior to Bregma, 2.8 mm lateral to the midline and 5.8–6.0 mm below the cortical surface.
For in vitro optogenetics and slice electrophysiology, we killed the subjects 2–3 months after viral injections corresponding to P100–140 and we made acute horizontal brain thalamic slices for optical stimulations and in vitro recordings. We prepared thalamic slices and performed in vitro whole-cell recordings as described above. We visualized eNpHR-expressing ventrobasal neurons with fluorescence microscopy. We stimulated eNpHR-expressing neurons with yellow laser stimuli (594-nm, 0.7–20-mW, 200-ms to 5-s flashes; OEM Laser Systems) delivered with optic fiber (BFL 37–300, Thor Labs; Supplementary Fig. 1b). At the end of the recordings, we fixed the slices with 4% paraformaldehyde (wt/vol) solution, then resectioned at 80 µm and low- and high-magnification images were obtained with fluorescence (Nikon) and confocal (Zeiss LSM 510) microscopes, respectively. We obtained both coronal cortical and horizontal thalamic slices from the same rats to confirm the presence and location of eNpHR-expressing ventrobasal thalamocortical axons and terminals in the somatosensory cortex (Fig. 5b). Thalamocortical neurons were recorded from ventrobasal thalamus. eNpHR3.0 expression was restricted to glutamatergic thalamocortical neurons in ventrobasal and was not observed in reticular thalamic GABAergic neurons (Supplementary Fig. 9). Virus spread was repro-ducible across subjects. eNpHR current was similar in ventrobasal cells from con-trol and injured rats and the stimulation intensity and duration required to silence eNpHR-expressing thalamocortical cell firing was reproducible and similar in control and injured subjects, suggesting that virus expression in thalamocortical cells was comparable in control and injured subjects.
chronic optrode recordings in freely behaving subjects. We anesthetized the subjects15 2–3 weeks after viral injections in ventrobasal thalamus and implanted a chronic device containing five EEG screws, one EMG wire to record electro-myographic activity and an optrode targeting the ventrobasal thalamus in control

©20
12 N
atu
re A
mer
ica,
Inc.
All
rig
hts
res
erve
d.
nature neurOSCIenCedoi:10.1038/nn.3269
and injured rats. Optrodes26 containing four tungsten depth electrodes and a 200-µm core (NA = 0.37) optical fiber (Supplementary Fig. 7d) were stereotac-tically inserted to a depth of 5.3 mm (Fig. 5a). We delivered yellow laser light (594 nm) into the thalamus via an optical fiber to inhibit eNpHR3.0-expressing thalamocortical neurons. Arrays were designed to sample from a large thalamic volume. EEG screws (2.38-mm-long #303SS, J.J. Morris) were attached to stainless steel wires (Medwire 316 SS 7/44T). We stabilized the devices on the skull with dental cement (C&B MetaBond). We conducted experiments in freely behaving animals between 2 weeks and 10 months after device implantation. For record-ings, we placed the subjects in a dedicated glass-walled chamber that allowed for video monitoring. We attached a custom-made buffering headstage amplifier to the animal to allow for recording from high-impedance depth LFP electrodes, and attached to a XLTek 32 Channel EEG headbox via a 50-cm, 12-channel cable with inline electrical commutator (Plastics One). We sampled EEG recordings at 500 Hz. We refer to electrocorticographic signals recorded with skull screws as EEG recordings.
To define whether the rat was epileptic or not, we used the classification pro-posed by the International League Against Epilepsy and the International Bureau for Epilepsy, that is, epilepsy can be considered if there is an enduring alteration in the brain (here, the cortical lesion) and at least two seizures.
optical stimulation in freely behaving subjects. For optical stimulation experi-ments, a 594-nm DPSS laser (OEM Laser Systems) was operated continuously at high output power for optimal stability. Output light power was reduced by neutral density filters, and stimulation was gated by a silent, low-latency beam shutter (SRS-475, Stanford Research Systems). The output beam was coupled to a 200-µm core (NA = 0.37) fiber optic cable, with an inline fiber optic rotating joint (Doric Lenses). This fiber was passed through a concentric channel in the electrical commutator before attaching to the animal to allow for free rotation of the animal during extended experiments. Light power levels are reported for the end of the cable before attachment to the implant.
Real-time seizure detection and disruption in freely behaving animals. For real-time seizure disruption experiments, we routed a single cortical EEG chan-nel showing clear seizure activity from the recording system to a programma-ble real-time digital signal processor (RP2.1, Tucker-Davis Technologies). The processor digitized the signal at 6 kHz, applied a band-pass filter (1–40 Hz), calculated the line length27 in a sliding window of 2 s, and updated at 6 kHz. Line-length threshold for seizure detection was set manually for each animal at the beginning of the experiment. Following upward crossing of the threshold, the system randomly triggered either laser stimulation for either 0.5 or 10 s (by open-ing the beam shutter) or sham stimulation. An 11-s timeout was imposed after each detection event to prevent retriggering and allow for analysis of response to the stimulation.
We analyzed data in Matlab, using custom software. We performed spectral analysis using the wavelet method with Matlab (MathWorks)22.
eeg power quantification in freely behaving subjects. A basis of Morlet wave-lets from 1–128 Hz was used, with ten wavelets per octave. Power at a given frequency was obtained using the inner product of a Morlet wavelet with the raw signal, and then squared. To account for logarithmic frequency sampling, power was divided by the period for bias correction31. To remove the 1/f bias inherent in biological signals, the power was normalized by the mean power at each frequency, resulting in spectrograms with unitless power (Figs. 5d and 7c,d, and Supplementary Figs. 7a and 8a). In some cases, the power spectrum was smoothed using a 0.25-s boxcar filter. Spectrograms were aligned on the basis of a signal corresponding to the opening of the laser shutter, and different trials were averaged together and plotted over time. For computation of signal power across the spectrum, the raw signal was bandpass filtered from 1–50 Hz, and the r.m.s. amplitude was obtained. The effect of the laser trigger on the EEG and LFP signals was quantified by comparing the r.m.s. averaged two seconds before and after the trigger (Fig. 5e,f and Supplementary Figs. 7c and 9a,b).
Multiunit firing quantification in freely behaving subjects. We recorded multiunit thalamic depth recordings using a multiplexing headstage amplifier (M32, Triangle Biosystems) connected to a multichannel neural recording system (Digital Cheetah, Neuralynx). Signals were bandpass filtered from 600–6,000 Hz
to detect spiking activity. Deflections below negative 40 µV were marked as putative spike events. We computed the duration and amplitude by which the signal exceeded threshold, and we excluded events with parameters more than 2 s.d. from the mean. For calculation of rates, events were counted in 1–2-s bins, divided by the bin size. We discarded trials in which there was a transient of greater than 500 µV or the count was 3 s.d. away from the median. Bins with the same temporal offset were used to calculate average spike rates across trials.
Immunohistochemistry. We performed histology as described previously19. Briefly, animals that had undergone behavioral analysis were anesthetized with pentobarbital (200 mg per kg, intraperitoneal) and perfused transcardially with saline followed by 4% paraformaldehyde (Sigma-Aldrich) in 0.1 M phosphate buffer (Sigma-Aldrich), pH 7.4. We removed the brains and postfixed them in 4% phosphate-buffered paraformaldehyde at 4 °C overnight. We took digital images for documentation of the position and extent of lesions (Supplementary Fig. 6) and we cryoprotected the brains with 30% (w/v) sucrose. We obtained horizontal or coronal 50-µm sections with a sliding freezing microtome (Microm, HM 400). We processed sections for immunofluorescence for GFAP (1:1,000, Millipore AB5804), and in some cases for HCN2 and HCN4 (1:500, kindly provided by R. Shigemoto, National Institutes for Physiological Sciences, Japan.). We incu-bated the sections for 1 h in normal donkey serum and then in primary antibodies diluted in phosphate-buffered saline with Triton X-100 for 48 h, rinsed them in phosphate-buffered saline and incubated them with a secondary fluorescent anti-body (Jackson ImmunoResearch 706-586-148) at a concentration of 1 µg ml−1. We mounted the sections on slides using Vectashield Mounting Media (Vector Labs) and assessed the immunofluorescence with a laser confocal microscope (Zeiss LSM 510).
Morphological identification and Hcn2 and Hcn4 protein quantification. We filled the cells with 0.2–0.5% biocytin (Sigma-Aldrich) included in the inter-nal solution of the recording electrode. We fixed whole slices and processed them using the standard avidin–biotin peroxidase method28,29. We processed slices for immunofluorescence for GFAP (Millipore), HCN2 and HCN4 (kindly provided R. Shigemoto). We assessed immunofluorescence with a laser confocal micro-scope (Zeiss LSM 510). We assessed HCN2 and HCN4 protein expression for each biocytin-filled cell by measuring the volume of HCN2 and HCN4 particles. We obtained confocal z stack images with an optical distance of 0.5 µm from the soma and dendritic processes of biocytin labeled cells. Each z stack image was rendered into a three-dimensional image (Volocity 2.6.1, Improvision) where signals from each fluorophore were analyzed separately. Voxels occupied by biocytin-labeled cells, and HCN 2 and HCN4 immunoreactivity were detected with consistent fluorescence signal threshold intensities throughout the analysis.
computational modeling. We built a minimal computational model of the nega-tive feedback loop between thalamocortical cells and reticular thalamic neurons to assess the oscillatory response of thalamic slices. We used a Hodgkin-Huxley style biophysical model to describe thalamocortical cell excitability, with para-meters fitted from whole-cell recordings in control and injured conditions.
In the thalamocortical cell model, we consider, the potential follows C V I I I I I I Im L Na K T h inj GABA = − + + + +( ) + + , where the leak current is I g V VL L L= −( ), INa and IK were taken from ref. 32, IT from ref. 33, and I g m V Vh h h h= −( ), with activation following th h h hV m m V m( ) = ( ) −∞ with
t t t th e eh1/2 h h hV V V k V V k( ) = + −( ) +( )− −( ) −( ) −min max min
/ //1 21
and
m V V V kh h h∞ −
( ) = + − −( )( )( )1 1 21
exp // ,
with parameters fitted from whole-cell patch clamp recordings. Parameters were Cm = 1 µF cm−2, gL = 0.025 mS cm−2, VL = −75 mV, gNa = 35 mS cm−2, VNa = 55 mV, sNa = 5 mV, gK = 25 mS cm−2, VK = −80 mV, sK = 18 mV, gT = 0.25 mS cm−2, VT = 120 mV, gh = 0.5 mS cm−2, Vh = −40 mV, Vh1/2 = −105 mV, kh = 10, τmin = 1,000 ms and τmax = 6,000 ms. In injured thalamo-cortical neurons, we set Vh1/2 = −95 mV, τmin = 500 ms and τmax = 3,500 ms to fit the +10 mV shift of the steady-state activation curve and the decreased

©20
12 N
atu
re A
mer
ica,
Inc.
All
rig
hts
res
erve
d.
nature neurOSCIenCe doi:10.1038/nn.3269
voltage-dependent time constant. Injured neurons have a membrane surface area S = αS0, where S0 is the area of control neurons (α = 0.5). This modification accounted for the increased input resistance (R g S g S Rin L L in0≈ = =− − − − − −1 1 1 1
01 1a a )
and unchanged time constant (t t= = =− − −C Sg S C gm L m L1 1 1
0). To model the absence of any additional noticeable modification of intrinsic conductance, the maximal conductance of voltage-dependent conductance was considered constant (g S g SX X= 0 0), that is, the number of channels is regulated by some homeostatic mechanism opposing the effects of the neocortical infarction (for example, intrinsic plasticity; see ref. 34). To model the negative feedback loop characterizing the thalamic network, we considered that every thalamocortical spike excited a small population of nRT neurons, resulting in a GABAA-mediated population inhibitory postsynaptic potential (IPSP) of 25 spikes (five individual IPSPs from five nRT neurons) with uniformly distributed random delays in the range [0; δt] ms due to synaptic transmission and integration in nRT neurons. The GABA current was I g x V VGABA GABA GABA GABA= −( ) with
x x x t tkk
GABA GABA GABA GABA= − + −( ) −( )∑/t d1 ,
where δ() is the Dirac function and tk represents nRT spike arrival times. A popu-lation IPSP was applied at t0 to trigger an initial rebound burst and initiate the network oscillatory response (duration, d = tlast TC spike − t0), which was classified as silent (no thalamocortical (TC) spike), transient (d t≤ simulation) or infinite (d t> simulation). Response maps were built as a function of the injected current mimicking constant cortical input (Iinj) and the strength of the intra-thalamic
feedback (gGABA). Oscillation duration differences were computed in the domain of transient oscillations, the behavior observed in thalamocortical neurons and expressed as a function of the resting membrane potential (VR(Iinj), instead of Iinj) of control neurons, to examine whether they indeed occurred in the physiological range encountered in whole-cell patch clamp recordings, that is, [−75; −65] mV. gGABA was as described in respective figures and we used δt = 50 ms, τGABA = 20 ms, VGABA = −85 mV and tsimulation = 2 s. Therapeutic conditions were set gL = 0.075 mS cm−2 (T/gL condition), gh = 0.1 mS cm−2 (T/gh condition), gL = 0.075 mS cm−2 and gh = 0.2 mS cm−2 (T/gL + gh condition).
28. Horikawa, K. & Armstrong, W.E. A versatile means of intracellular labeling: injection of biocytin and its detection with avidin conjugates. J. Neurosci. Methods 25, 1–11 (1988).
29. Tseng, GF., Parada, I. & Prince, D.A. Double-labelling with rhodamine beads and biocytin: a technique for studying corticospinal and other projection neurons in vitro. J. Neurosci. Methods 37, 121–131 (1991).
30. McCormick, D.A. & Pape, H.C. Properties of a hyperpolarization-activated cation current and its role in rhythmic oscillation in thalamic relay neurones. J. Physiol. (Lond.) 431, 291–318 (1990).
31. Torrence, C. & Compo, G. A practical guide to wavelet analysis. Bull. Am. Meteorol. Soc. 79, 61–78 (1997).
32. Wang, X.J. Multiple dynamical modes of thalamic relay neurons: rhythmic bursting and intermittent phase-locking. Neuroscience 59, 21–31 (1994).
33. Huguenard, J.R. & McCormick, D.A. Simulation of the currents involved in rhythmic oscillations in thalamic relay neurons. J. Neurophysiol. 68, 1373–1383 (1992).
34. Marder, E. & Goaillard, J.-M. Variability, compensation and homeostasis in neuron and network function. Nat. Rev. Neurosci. 7, 563–574 (2006).