Embed Size (px)
Citation preview
ORIGINAL RESEARCHSPINE
Clinically Feasible Microstructural MRI to Quantify CervicalSpinal Cord Tissue Injury Using DTI, MT, and T2*-Weighted
Imaging: Assessment of Normative Data and ReliabilityX A.R. Martin, X B. De Leener, X J. Cohen-Adad, X D.W. Cadotte, X S. Kalsi-Ryan, X S.F. Lange, X L. Tetreault, X A. Nouri,
X A. Crawley, X D.J. Mikulis, X H. Ginsberg, and X M.G. Fehlings
ABSTRACT
BACKGROUND AND PURPOSE: DTI, magnetization transfer, T2*-weighted imaging, and cross-sectional area can quantify aspects ofspinal cord microstructure. However, clinical adoption remains elusive due to complex acquisitions, cumbersome analysis, limited reliabil-ity, and wide ranges of normal values. We propose a simple multiparametric protocol with automated analysis and report normative data,analysis of confounding variables, and reliability.
MATERIALS AND METHODS: Forty healthy subjects underwent T2WI, DTI, magnetization transfer, and T2*WI at 3T in �35 minutes usingstandard hardware and pulse sequences. Cross-sectional area, fractional anisotropy, magnetization transfer ratio, and T2*WI WM/GMsignal intensity ratio were calculated. Relationships between MR imaging metrics and age, sex, height, weight, cervical cord length, androstrocaudal level were analyzed. Test-retest coefficient of variation measured reliability in 24 DTI, 17 magnetization transfer, and 16 T2*WIdatasets. DTI with and without cardiac triggering was compared in 10 subjects.
RESULTS: T2*WI WM/GM showed lower intersubject coefficient of variation (3.5%) compared with magnetization transferratio (5.8%), fractional anisotropy (6.0%), and cross-sectional area (12.2%). Linear correction of cross-sectional area with cervical cordlength, fractional anisotropy with age, and magnetization transfer ratio with age and height led to decreased coefficients of variation(4.8%, 5.4%, and 10.2%, respectively). Acceptable reliability was achieved for all metrics/levels (test-retest coefficient of variation �
5%), with T2*WI WM/GM comparing favorably with fractional anisotropy and magnetization transfer ratio. DTI with and withoutcardiac triggering showed no significant differences for fractional anisotropy and test-retest coefficient of variation.
CONCLUSIONS: Reliable multiparametric assessment of spinal cord microstructure is possible by using clinically suitable methods. Theseresults establish normalization procedures and pave the way for clinical studies, with the potential for improving diagnostics, objectivelymonitoring disease progression, and predicting outcomes in spinal pathologies.
ABBREVIATIONS: CSA � cross-sectional area; DCM � degenerative cervical myelopathy; FA � fractional anisotropy; MCL � maximally compressed level; MT �magnetization transfer; MTR � magnetization transfer ratio; SC � spinal cord; TRCOV � test-retest coefficient of variation
The era of quantitative MR imaging has arrived, allowing in
vivo measurement of specific physical properties reflecting
spinal cord (SC) microstructure and tissue damage.1,2 Such mea-
sures have potential clinical applications, including improved di-
agnostic tools, objective monitoring for disease progression, and
prediction of clinical outcomes.3 However, technical chal-
lenges such as artifacts, image distortion, and achieving accept-
able SNR have led to limited reliability. Specialized pulse se-
quences and custom hardware have advanced the field but
incur costs of increased complexity and acquisition time while
creating barriers to portability and clinical adoption. Further-
more, quantitative MR imaging metrics often show wide
ranges of normal values and confounding relationships with
subject characteristics such as age,4-8 for which most previous
studies have not accounted.3
Among the most promising SC quantitative MR imaging tech-
niques are DTI and magnetization transfer (MT).1-3 These
provide measures of axonal integrity and myelin quantity that
correlate with functional impairment in conditions such as de-
generative cervical myelopathy (DCM)5-7,9 and MS,3,9 albeit with
Received October 20, 2016; accepted after revision January 28, 2017.
From the Division of Neurosurgery, Department of Surgery (A.R.M., D.W.C.,S.K.-R., L.T., A.N., H.G., M.G.F.), and Department of Medical Imaging (A.C.,D.J.M.), University of Toronto and the University Health Network, TorontoWestern Hospital, Toronto, Ontario, Canada; Polytechnique Montreal (B.D.L.,J.C.-A.), Montreal, Quebec, Canada; Functional Neuroimaging Unit (J.C.-A.), Cen-tre de recherche de l’Institut universitaire de geriatrie de Montreal, Universitede Montreal, Montreal, Quebec, Canada; and University of Groningen (S.F.L.),Groningen, the Netherlands.
Please address correspondence to Michael G. Fehlings, MD, SCI-CRU, 11th Floor,Toronto Western Hospital, 399 Bathurst St, Toronto, M5T 2S8, ON, Canada; e-mail:[email protected], [email protected]; @DrFehlings
Indicates open access to non-subscribers at www.ajnr.org
http://dx.doi.org/10.3174/ajnr.A5163
AJNR Am J Neuroradiol 38:1257– 65 Jun 2017 www.ajnr.org 1257

limited physiologic specificity (eg, fractional anisotropy [FA] re-
flects both demyelination and axonal injury).10,11 SC cross-
sectional area (CSA) computed from high-resolution anatomic
images can measure atrophy (eg, in MS)12 or the degree of SC
compression in DCM.13 T2*-weighted imaging at 3T or higher
field strengths offers high resolution and sharp contrast between
SC WM and GM, allowing segmentation between these structures
similar to that in phase-sensitive inversion recovery.14,15 T2*WI
also demonstrates hyperintensity in injured WM,16-18 reflecting
demyelination, gliosis, and increased calcium and nonheme iron
concentrations.19 T2*WI signal intensity is not an absolute quan-
tity, so we normalize its value in WM by the average GM signal
intensity in each axial section, creating a novel measure of WM
injury: T2*WI WM/GM ratio.20
We propose a multiparametric approach to cervical SC
quantitative MR imaging with clinically feasible methods, in-
cluding acceptable acquisition times, standard hardware/pulse
sequences, and automated image analysis. Our protocol yields
4 measures of SC tissue injury (CSA, FA, MT ratio [MTR], and
T2*WI WM/GM), for which this study establishes normative
values in numerous ROIs. We characterize the variation of these met-
rics with age, sex, height, weight, cervical cord length, and rostrocau-
dal level and propose normalization methods. Finally, we assess test-
retest reliability of FA, MTR, and T2*WI WM/GM and compare our
DTI results against those with cardiac triggering.
MATERIALS AND METHODSStudy Design and SubjectsThis study received approval from the University Health Network
(Toronto, Ontario, Canada), and written informed consent was
obtained from all participants. Forty-two subjects were recruited
between October 2014 and December 2016 with a broad range of
ages and balance between sexes. A physician (A.R.M.) assessed all
subjects to rule out symptoms and signs of neurologic dysfunc-
tion, and T2WI was screened for abnormalities suggestive of mul-
tiple sclerosis, tumor, or severe cord compression. Two subjects
were excluded from the study with clinical and imaging findings
of DCM, leaving 40 healthy subjects for analysis. Data from 18
patients with DCM were included for analysis of test-retest reli-
ability, and 6 patients with DCM were included in a cardiac-trig-
gering comparison, but subjects with DCM were excluded from
other analyses.20
MR Imaging AcquisitionsMR images were acquired on a 3T clinical scanner (Signa Excite
HDxt; GE Healthcare, Milwaukee, Wisconsin). Peak gradients
were 50 mT/m; slew rate, 150 T/m/s with a body coil for transmis-
sion and the top 2 elements of a standard 8-element spine coil (Pre-
mier III Phased Array CTL; USA Instruments, Aurora, Ohio) for
reception. Subjects were positioned head-first and supine with the
head tightly padded to prevent movement and the neck flexed to
straighten the cervical SC.
The MR imaging protocol was developed on the basis of meth-
ods previously used by one of the authors (J.C.-A.).16,17,21 T2WIs
used sagittal FIESTA-cycled phases with 0.8-mm3 isotropic reso-
lution covering the brain stem to T4. DTI, MT, and T2*WI had 13
axial sections positioned perpendicular to the spinal cord (at C3),
covering C1–C7 by using a variable gap, alternating between the
mid-vertebral body and the intervertebral disc. Parameters for
each sequence are listed in Table 1. DTI used a spin-echo single-
shot EPI sequence with an 80 � 80 mm2 FOV to minimize sus-
ceptibility distortions, anterior/posterior saturation bands to
achieve outer volume suppression, and no cardiac triggering. Sec-
ond-order localized shimming was performed before DTI by po-
sitioning a VOI encompassing the SC from C1–C7. T2*WIs used
the multiecho recombined gradient-echo sequence, with 3 echoes
that are magnitude-reconstructed and combined by using a sum-
of-squares algorithm.18 Each session required 30 –35 minutes, in-
cluding subject positioning, section prescription, prescanning,
and shimming.
Table 1: Acquisition protocola
Imaging TypePulse Sequence;
Orientation Technical Details Acquisition Time MetricT2WI 3D FIESTA-C; sagittal TR/TE � 5.4/2.6 s, FOV � 200 � 200 mm2,
matrix � 256 � 256, resolution � 0.8 � 0.8 �0.8 mm3, NEX � 2, flip angle � 35°
6 min 56 s CSA
DTI Spin-echo ssEPI withOVS; axial
TR/TE � 4050/91.2 ms, FOV � 80 � 80 mm2,matrix � 64 � 64, resolution � 1.25 �1.25 � 5 mm3, 25 directions (b�800 s/mm2),5 b�0 s/mm2 images, AP saturation bands,phase encoding � AP, 2nd-order shimming
3 � 2 min 6 s, 1 min 30 sfor shimming
FA
MT 2D SPGR with/withoutprepulse; axial
TR/TE � 32/5.9 ms, FOV � 190 � 190 mm2,matrix � 192 � 192, resolution � 1 � 1 �5 mm3, NEX � 3, flip angle � 6°, flowcompensation, phase encoding � AP,prepulse: Gaussian, duration � 9984 �s,offset � 1200 Hz
3 min 45 s each, with andwithout prepulse
MTR
T2*WI 2D MERGE; axial TR/TE � 650/5, 10, 15 ms, FOV � 200 �200 mm2, matrix � 320 � 320, resolution �0.6 � 0.6 � 4 mm3, NEX � 1, flip angle �20°, BW � 62 kHz per line
3 min 33 s WM/GM ratio
Note:—AP indicates anteroposterior; BW, bandwidth; FIESTA-C, FIESTA-cycled phases; MERGE, multiecho recombined gradient echo; OVS, outer volume suppression; SPGR,echo-spoiled gradient echo; ssEPI, single-shot echo-planar imaging.a Technical specifications of our multiparametric cervical SC MRI protocol, with an acquisition time of 25 minutes (30 –35 minutes, including positioning, section prescription,shimming, and prescans).
1258 Martin Jun 2017 www.ajnr.org
Test-retest reliability was assessed by removing the subject
from the scanner and repositioning before rescanning. This was
performed in a subset of subjects (DTI: 17 healthy, 9 with DCM;
MT: 13 healthy, 4 with DCM; T2*WI: 5 healthy, 11 with DCM)
extemporaneously, depending on scanner availability and subject
willingness. Reliability was not assessed for SC CSA measurement
due to time constraints.
A comparison of DTI with and without cardiac triggering
was also performed in 10 subjects (4 healthy, 6 with DCM).
Cardiac-triggered DTI was performed with pulse oximetry
triggering, trigger delay of 310 ms, window of 250 ms, and
TR � 7 R-R interval. Two acquisitions were performed that
were analyzed individually for test-retest coefficient of varia-
tion (TRCOV) and then concatenated and averaged for com-
parison with nontriggered DTI.
Image Analysis TechniquesImaging data were analyzed by using the Spinal Cord Toolbox,
Version2.3 (SCT; https://www.nitrc.org/projects/sct/).22 Each ax-
ial image was visually inspected by 1 rater (A.R.M.) and excluded
if low signal or artifacts (motion, aliasing) were present. SC
segmentation was automatically performed by using native
T2WIs and T2*WIs, the mean diffusivity map for DTI, and the
MT image with a prepulse. Segmentation errors were resolved by
providing seed points for automatic segmentation or manual ed-
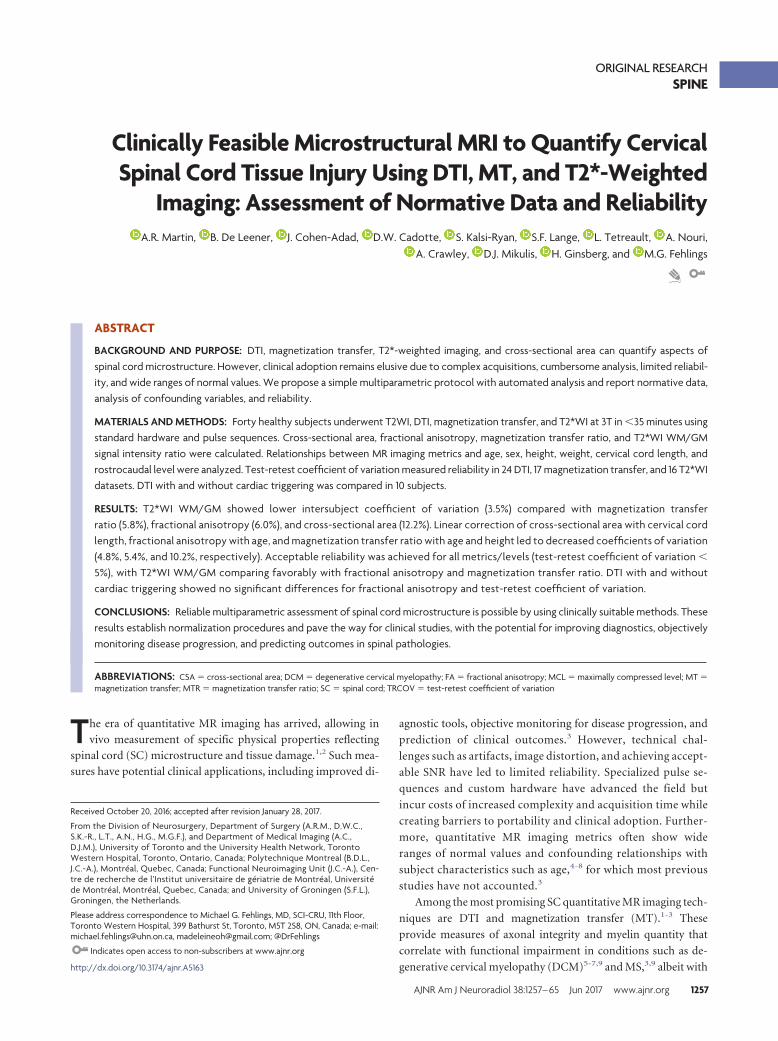
iting. Images were nonlinearly regis-tered to the MNI-Poly-AMU template/atlas in SCT.23 T2WIs were used toautomatically calculate cervical cordlength (from the top of C1 to the bottomof the C7 vertebral levels) and SC CSA.DTI was motion-corrected with regular-ized registration, and diffusion tensorswere calculated with outlier rejection byusing the RESTORE (robust estimation oftensors by outlier rejection) method.24
MT images with and without prepulseswere coregistered, and MTR was com-puted. T2*WI data were further analyzedwith automatic segmentation of GMand WM,25 which was used to refine theregistration of T2*WI to the template.FA, MTR, and T2*WI WM/GM ratioswere extracted from various ROIs byusing the SCT probabilistic atlas withautomatic correction for partial volumeeffects by using the maximum a posteri-ori method.26 ROIs included the SC,WM, and GM and the left/right lateralcorticospinal tract, fasciculus cuneatus,fasciculus gracilis, and spinal lemniscusin each axial section (Fig 1). Metricswere averaged at rostral (C1–C3), mid-dle (C4 –5) or maximally compressed(MCL, subjects with DCM), and caudal(C6 –C7) levels.
Statistical AnalysisStatistical analysis was performed with R statistical and
computing software, Version 3.3 (http://www.r-project.org/).
Normative data were summarized with mean, SD, and inter-
subject coefficient of variation. Relationships between MR im-
aging metrics (averaged from C1–C7) and patient characteris-
tics (age, sex, height, weight, cervical cord length) were
assessed with Pearson correlation coefficients and backward
stepwise linear regression to determine significant indepen-
dent relationships and their coefficients. Differences by rostro-
caudal level were assessed with ANOVA. If differences were
found, we calculated Spearman coefficients (between mean
values and numbered levels) to identify monotonic relation-
ships. To determine whether nonlinear relationships were
present, we performed a likelihood ratio test on linear regres-
sion models with and without a 5-knot restricted cubic spline.
Paired t tests compared WM and GM differences, and ANOVA
was used to identify differences among individual WM tracts
(averaged bilaterally). Reliability was assessed by using test-
retest coefficient of variation, and differences between healthy
subjects and those with DCM were assessed with Welch t tests,
as were pair-wise comparisons between techniques at each ros-
trocaudal level. Statistical significance was set to P � .05 and
was not corrected for multiple comparisons due to the explor-
atory nature of this study.
FIG 1. Representative images showing FA maps (A), MTR maps (B), and T2*WI (C) with probabilisticmaps of the lateral corticospinal tracts (blue) and dorsal columns (red-yellow) overlaid (D–F)following registration to the SCT atlas.
AJNR Am J Neuroradiol 38:1257– 65 Jun 2017 www.ajnr.org 1259

RESULTSSubject CharacteristicsCharacteristics of 40 healthy subjects and 18 with DCM included
in this study are listed in Table 2.
Image AcquisitionAcceptable image quality was achieved in all subjects and tech-
niques. For DTI, 27 of 520 axial images (5.2%) were excluded due
to artifacts or poor signal. For MT and T2*WI, 6 (1.2%) and 4
(0.8%) sections were excluded due to artifacts, respectively.
Automated AnalysisAutomated segmentation was frequently successful, with manual
editing required in 8 T2WI datasets (20%), 14 MT datasets (35%),
4 DTI datasets (10%), and 20 T2*WI datasets (50%). Manual
segmentation editing was usually restricted to a small number of
sections and required �5 minutes per dataset. Automatic regis-
tration to the template and data extraction were successful in all
cases.
Normative Values for MR Imaging MetricsNormative data extracted from C1–C3 showed that T2*WI
WM/GM had the smallest intersubject coefficient of variation at
3.5% (0.848 � 0.028), compared with 5.8% for MTR (52.8 �
3.1%), 6.0% for FA (0.706 � 0.042), and 12.2% for CSA (78.5 �
9.6 mm2) (Fig 2). The strongest contrast
between WM and GM was found for
T2*WI signal intensity (mean GM-WM
difference � standard error � 83.9 �
4.72, P � 3 � 10�20), which exceeded
that of FA (�0.110 � 0.0083, P � 2 �
10�15) and MTR (�2.1 � 0.28, P � 4 �
10�9). Individual WM tracts showed
significant variations for T2*WI
WM/GM (ANOVA, P � 2 � 10�9), FA
(P � 3 � 10�7), and MTR (P � .01).
Variations with SubjectCharacteristicsUnivariate relationships between MR
imaging metrics and subject characteris-
tics included the following: CSA in-
creased with cervical cord length (P �
8 � 10�4), weight (P � .03), and male
sex (P � .03); FA decreased with age
(P � .009); and MTR decreased with
height (P � .008), weight (P � .01), and
male sex (P � .006) (Table 3). Trends
were also present for CSA, increasing
with height (P � .06), and for T2*WI
WM/GM, increasing with age (P � .06)
and weight (P � .06). In multivariate
analysis, CSA varied only with cervical
cord length (� � �5.3690); FA, with age
(� � �0.0012053); and MTR, with
height (� � �0.17410, P � .001) and
age (� � �0.074131, P � .01), while
T2*WI WM/GM did not require nor-
malization. Following linear corrections, intersubject coefficient
of variation decreased to 4.8% for MTR, 5.4% for FA, and 10.2%
for CSA.
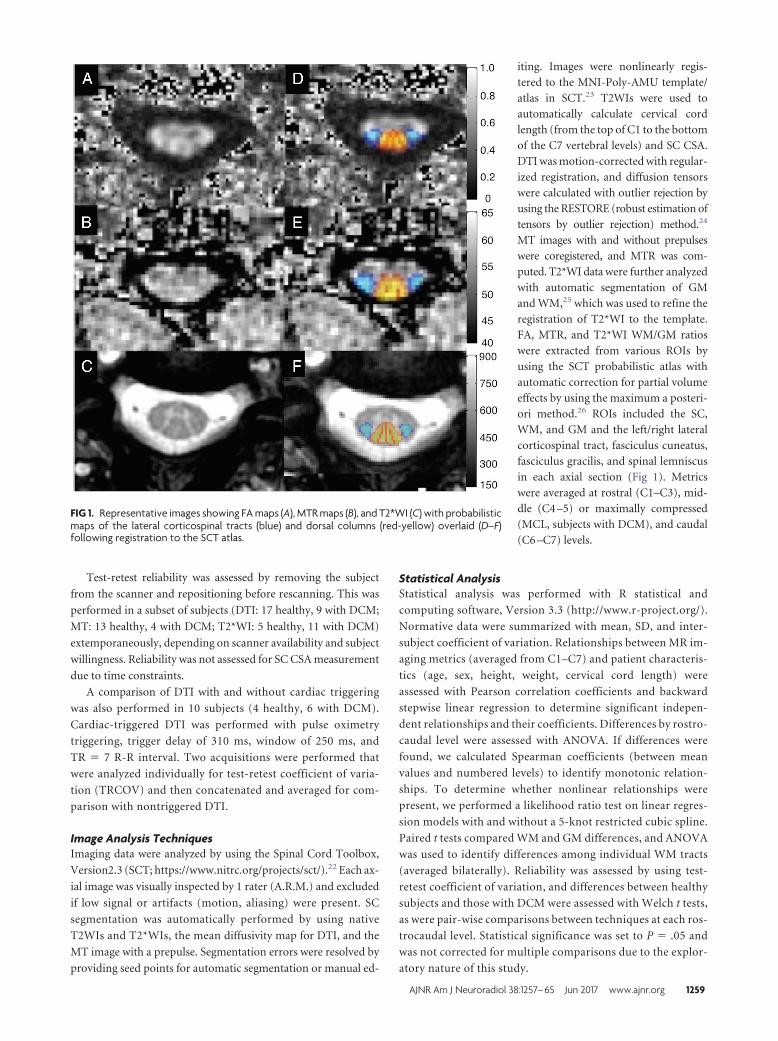
Metrics by Rostrocaudal LevelANOVA detected significant differences (P � .05) across rostro-
caudal levels for all metrics. Monotonic variations were present
(P � .05) for MTR (� � �0.98), FA (� � �0.90), and CSA (� �
�0.55), which all decreased from rostral to caudal levels, whereas
T2*WI WM/GM showed a trend toward increasing (� � 0.53, P �
.06) (Fig 3). CSA, FA, and T2*WI WM/GM showed nonlinear
rostrocaudal variation (P � .05), whereas MTR did not (P � .58).
ReliabilityThe T2*WI WM/GM ratio was the most reliable metric (pooled
TRCOV: rostral, 0.9%; MCL, 2.9%; caudal, 2.6%), comparing
favorably with FA (rostral, 2.6%; MCL, 3.6%; caudal, 3.2%) and
MTR (rostral, 2.4%; MCL, 3.7%; caudal: 4.2%), though these dif-
ferences were only significant for rostral metrics (P � .05) (Table
4). Reliability measures were comparable between healthy sub-
jects and those with DCM rostrally (C1–C3), but subjects with
DCM trended toward increased TRCOV for MCL MTR (6.1%
versus 3.2%, P � .08) and caudal FA (4.6% versus 2.2%, P � .07).
The reliability of data from individual WM tracts was acceptable
FIG 2. Normative data in the rostral cervical cord for FA, MTR, and T2*WI WM/GM ratios. Metricsare extracted from SC, WM, GM, and key WM tracts averaged over rostral sections (C1–C3).Values are displayed as mean � intersubject SD (error bars). The asterisk denotes P � .05 withpaired t tests between WM and GM and ANOVA among WM tracts. L indicates left; R, right; FC,fasciculus cuneatus; FG, fasciculus gracilis; SL, spinal lemniscus; LCST, lateral corticospinal tract.
Table 2: Subject characteristicsa
Characteristic Healthy Subjects (n = 40) Subjects with DCM (n = 18)Age (yr) 47.1 � 15.3 (range, 19–79) 56.4 � 11.0 (range, 36–76)Sex 21 men, 19 women 11 men, 7 womenHeight (cm) 171.4 � 8.6 172.8 � 8.9Weight (kg) 74.6 � 11.5 79.0 � 15.1Cervical cord length (cm) 10.6 � 1.0 11.1 � 0.9
a Demographics and characteristics of 40 healthy subjects and 18 with DCM are shown. Data (other than sex) arereported as mean � SD.
1260 Martin Jun 2017 www.ajnr.org
(TRCOV � 5%) except for FA of the right and left spinal lemnis-
cus (5.3%, 5.6%, respectively; Fig 4).
Cardiac Triggering in DTIFA did not differ significantly among DTI acquisitions with
and without cardiac triggering, though triggering showed a
trend toward higher FA at MCL (0.558 versus 0.514, P � .06)
and caudal (0.562 versus 0.534, P � .07) levels (Table 5). No
significant differences in TRCOV were observed, though
cardiac-triggered DTI provided approximately 1% lower
TRCOV at all levels.
DISCUSSIONSummary of FindingsThis study establishes a multiparametric MR imaging protocol
and analysis framework to assess the microstructure of the
entire cervical SC by using simple methods that are feasible for
clinical adoption, requiring only 20 minutes of acquisition
FIG 3. Variations by rostrocaudal level. MR imaging metrics displayed for each vertebral and intervertebral level from C1 to C7. FA, MTR, and T2*WIWM/GM ratios are extracted from WM. ANOVA shows significant differences by level for all metrics. Monotonic variations are present for CSA, FA,and MTR.
Table 3: Univariate relationships of MRI metrics with healthy subject characteristicsa
Metric Age Sex (M vs F) Height Weight Cervical Cord LengthCSA (mm2) r � �0.25 (P � .12) 80.0 � 11.2 vs 73.5 � 8.5 (P � .03b) r � 0.31 (P � .06c) r � 0.34 (P � .03b) r � 0.51 (P � .001b)FA r � �0.43 (P � .009b) 0.658 � 0.037 vs 0.663 � 0.034 (P � .75) r � �0.02 (P � .89) r � �0.26 (P � .12) r � 0.11 (P � .53)MTR r � �0.25 (P � .11) 48.8 � 2.5 vs 51.4 � 2.7 (P � .006b) r � �0.41 (P � .008b) r � �0.40 (P � .01) r � �0.18 (P � .26)T2*WI WM/GM r � 0.31 (P � .06) 0.863 � 0.034 vs 0.858 � 0.031 (P � .64) r � �0.12 (P � .48) r � 0.31 (P � .06c) r � �0.09 (P � .55)
a Values for sex are reported as mean � SD, and other values are Pearson correlation coefficient. FA, MTR, and T2*WI WM/GM ratios are extracted from WM, while CSA of thespinal cord is measured, averaged across C1–C7.b Significance (P � .05).c Trends (P � .10).
AJNR Am J Neuroradiol 38:1257– 65 Jun 2017 www.ajnr.org 1261

time in addition to anatomic imaging. Image acquisition was
successful in all subjects, and automated analysis provided ro-
bust readouts from multiple ROIs, with the results validated by
acceptable reliability data. Our results establish normative data
for CSA, FA, and MTR that are consistent with previous re-
ports at 3T,12,21,27-29 in addition to our novel T2*WI WM/GM
metric. T2*WI WM/GM, FA, and MTR all showed strong gray-
white contrast and differences between individual WM tracts.
FA and MTR showed moderate intersubject and test-retest
variability, with similar or better reliability than in previous
reports despite differences in acquisition and analysis tech-
niques.8,27-31 T2*WI WM/GM demonstrated low intersubject
and test-retest variability, which are favorable statistical prop-
erties because they make it more likely
that a subject with pathology will show
abnormal results (confirmed by en-
couraging results reported in a com-
panion article20). CSA showed greater
intersubject variation than other met-
rics, though this improved slightly fol-
lowing normalization with cervical
cord length. Reliability of the CSA
measurement was not assessed due to
time constraints, but it likely surpasses
that of our other measures because it
has been previously reported to have
TRCOV under 0.5% by using similar
techniques.12 Reliability was greatest
in the rostral region for all techniques,
where healthy subjects and patients
with DCM showed similar results. In
contrast, patients with DCM showed
trends toward diminished reliability at
MCLs and caudal levels, likely related
to distorted anatomy, increased partial
volume effects, increased susceptibil-
ity artifacts, and less accurate registra-
tion to the SCT template. However,
these differences were not significant,
and pooled reliability results were
all considered acceptable (TRCOV �
5%). Our clinically feasible multipara-
metric approach provides 4 unique
quantitative measures in multiple
ROIs that reflect aspects of macro-
structure and microstructure, with the
benefit that these measures cross-vali-
date each other to overcome the limi-
tations (reliability, intersubject vari-
ability, sensitivity to pathology) of
each individual technique. We antici-
pate that this multivariate approach
can accurately characterize tissue in-
jury in various SC pathologies, which
could enable quantitative MR imaging
of the SC to achieve clinical translation
in the near future.
Normalization for Confounding FactorsIt is essential that quantitative readouts reflect pathologic changes
and eliminate confounding effects as much as possible to move
toward clinical use of SC quantitative MR imaging. In keeping
with prior reports, significant relationships were found between
age and FA5,7,8 and MTR,8 but not CSA.8,23 However, we also
identified univariate relationships between MR imaging metrics
and sex, height, weight, and cervical cord length, for which we are
not aware of previous reports. The relationship between CSA and
cervical cord length likely indicates that CSA is related to overall
body size because height and weight also showed positive (non-
significant) correlations. It is unclear why MTR decreases with
height, but weak negative trends were also seen with weight and
FIG 4. Test-retest coefficients of variation of FA, MTR, and T2*WI WM/GM extracted from SC,WM, GM, and key WM tracts in rostral sections (C1–C3) are displayed. T2*WI WM/GM ratio showsbetter reliability than FA and MTR. Metrics derived from the SC and WM show TRCOV � 3%,while GM and key WM tracts show TRCOV � 5% except for FA of the spinal lemniscus. FCindicates fasciculus cuneatus; FG, fasciculus gracilis; SL, spinal lemniscus; LCST, lateral corticospi-nal tract; R, right; L, left.
Table 4: Test-retest reliability across rostrocaudal levelsa
Level Metric Healthy DCM P Value PooledRostral (C1–C3) FA 2.5 � 2.0% 2.8 � 1.8% .71 2.6 � 1.9%
MTR 2.7 � 1.9% 1.3 � 0.5% .17 2.4 � 1.9%T2*WI WM/GM 0.9 � 0.6% 1.0 � 0.7% .77 0.9 � 0.7%b
Midcervical (C4–C5)or MCL
FA 3.0 � 2.2% 5.0 � 5.7% .21 3.6 � 3.6%MTR 3.2 � 3.0% 6.1 � 0.9% .08c 3.7 � 3.2%T2*WI WM/GM 1.4 � 1.1% 3.5 � 2.2% .11 2.9 � 2.2%
Caudal (C6–C7) FA 2.2 � 1.6% 4.6 � 4.7% .07c 3.2 � 3.5%MTR 4.4 � 3.8% 3.1 � 3.9% .56 4.2 � 3.7%T2*WI WM/GM 3.4 � 3.0% 2.2 � 2.1% .37 2.6 � 2.4%
a TRCOV � SD is displayed for healthy subjects and those with DCM at rostral (C1–C3), midcervical (C4 –5), ormaximally compressed levels in subjects with DCM, and caudal (C6 –C7) levels. Sample size was 26 subjects (17healthy, 9 with DCM) for DTI, 17 subjects (13 healthy, 4 with DCM) for MT, and 16 subjects (5 healthy, 11 with DCM)for T2*WI.b Significant differences (P � .05) between pooled TRCOV of metrics at each level.c Trends (P � .10) in reliability between healthy subjects and those with DCM for each level/metric, and pooledreliability was calculated if no significant differences were found.
1262 Martin Jun 2017 www.ajnr.org

cervical cord length, suggesting that MTR (reflecting myelin den-
sity) is negatively related to overall body size. However, no rela-
tionship was present between MTR and CSA in a post hoc test
(r � 0.01, P � .94). Strong relationships were also found among
all 4 metrics and the rostrocaudal level, with the CSA, FA, and
MTR showing nonlinearity (Fig 3). CSA increased between the C3
and C6 vertebral levels, reflecting the cervical enlargement that
contains increased GM for C5–T1 neurologic levels, and our CSA
measurements were highly similar to those in previous re-
ports.32,33 WM FA peaked at C2 and locally at C7, where the
orientations of axons are almost purely rostrocaudal. In contrast,
decreases were seen at C1 (likely due to decussation of corticospi-
nal fibers) and in the cervical enlargement (where a fraction of
axons turn and form synapses within the GM). The T2*WI WM/GM
ratio was nearly invariant from C1 to C6 but increased at C7, likely
due to increased susceptibility artifacts from the lungs, decreased
SNR, and respiratory motion. We suggest a normalization scheme in
which CSA, FA, and MTR are linearly corrected for relationships
(cervical cord length, age, and age/height, respectively) and all met-
rics are converted to z scores per rostrocaudal level, as proposed by
Uda et al4 for DTI metrics. Although normalization procedures add
complexity to data postprocessing, these methods facilitate fair com-
parisons, decrease nuisance variability, and produce more accurate
biomarkers of SC tissue injury.
Quantitative MR Imaging Techniques: Specificity,Accuracy, FeasibilityThe rapidly evolving field of quantitative MR imaging includes a
rich array of acquisition techniques, including strict quantitative
methods that attempt to measure a specific physical property,
such as quantitative MT, longitudinal relaxation rate, and appar-
ent transverse relaxation rate mapping.27,34,35 However, such
techniques are inherently complex and require specialized pulse
sequences, while typically requiring lengthy scan times. Further-
more, these methods face challenges in achieving acceptable SNR
and reliability, particularly in the SC, which is considerably more
difficult to image than the brain due to magnetic field inhomoge-
neity and physiologic motion. Similarly, reduced FOV DTI has
become available, offering increased SNR and reduced distortions
but often requiring increased acquisition times and involving
proprietary pulse sequences.31 Our protocol purposefully used
standard sequences available from all major MR imaging vendors,
making it an attractive approach for multicenter studies and clin-
ical use. A recent study comparing reduced FOV with outer
volume suppression for cervical SC DTI found only minimal dif-
ferences in reliability (intersubject coef-
ficient of variation: reduced FOV �
3.98% versus outer volume suppres-
sion � 4.59).31 Unfortunately, this study
did not report P values for these compari-
sons, and it did not assess intrasubject re-
liability, but the findings suggest that outer
volume suppression provides acceptable
reliability.
Cardiac-Triggered DTIPrevious research suggests that cardiac
triggering reduces variance in diffusion
time-series by acquiring data during the quiescent phase of cardi-
ac-related SC motion.36 However, to our knowledge, no studies
have directly compared the test-retest reliability of SC DTI acqui-
sitions with and without cardiac triggering, particularly in the
context of multiple acquisitions and outlier rejection during post-
processing. Our pilot data in 10 subjects suggest roughly equiva-
lent results with and without triggering, though trends toward
higher FA and lower TRCOV (approximately 1%) were observed
with triggering. Further investigation is needed, but the ungated
acquisition used in this study is validated by its acceptable reliabil-
ity. This simpler approach avoids difficulties with triggering such
as variable TR and cardiac irregularities (arrhythmias, tachycar-
dia) that are more common in older or critically ill patients.
LimitationsFurther studies with larger sample sizes would allow greater accu-
racy for normative data, influences of confounding variables, and
differences in DTI with and without cardiac triggering. The nor-
mative data are specific to our methodology, and cross-site and
cross-vendor validation is required. Our use of automated analy-
sis aimed to reduce bias, but manual editing of segmentations was
frequently required. Other DTI metrics were not analyzed due to
an a priori decision to focus on FA, due to its consistent results in
previous studies.3 Our test-retest reliability experiment does not
account for scanner drift, but this is unlikely a large source of error
because the 2 metrics are ratios rather than absolute signal-inten-
sity values. Neurologically intact subjects with mild SC compres-
sion were considered healthy subjects; these changes are evident
in 8%–26% of asymptomatic individuals.32,37 Moreover, we think
that the spectrum of “normal” includes this subgroup, but previ-
ous studies have excluded such subjects.
CONCLUSIONSReliable multiparametric assessment of the SC microstructure is
possible with standard hardware, acceptable acquisition times,
and automated analysis that provide high-fidelity readouts of tis-
sue injury from numerous ROIs. Normalization procedures can
be implemented to mitigate confounding effects such as age,
height, cervical cord length, and rostrocaudal level, producing
more meaningful quantitative metrics. Our clinically suited ap-
proach paves the way for translational studies to evaluate poten-
tial uses such as improved diagnostics, monitoring of disease pro-
gression, and prediction of outcomes.
Table 5: DTI with and without cardiac triggeringa
Measure Level No Triggering Triggering P ValueFA Rostral 0.651 � 0.054 0.664 � 0.064 .41
Mid/MCL 0.514 � 0.068 0.558 � 0.081 .06b
Caudal 0.534 � 0.057 0.562 � 0.044 .07b
TRCOV Rostral 2.6 � 1.9% 1.5 � 1.2% .11Mid/MCL 3.6 � 3.6% 2.2 � 2.3% .27Caudal 3.2 � 3.5% 2.4 � 2.3% .52
a Paired t tests were used to compare FA values extracted from WM at rostral (C1–C3), midcervical (C4 –5, healthysubjects), or MCL (subjects with DCM), and caudal (C6 –C7) levels between no triggering vs triggering in 10 subjects (4healthy, 6 with DCM). Welch t tests were used to compare test-retest coefficient of variation between no triggering(n � 26) and triggering (n � 10).b Trends (P � .10).
AJNR Am J Neuroradiol 38:1257– 65 Jun 2017 www.ajnr.org 1263
ACKNOWLEDGMENTSThis research received funding support from Rick Hansen Insti-
tute, as part of the Riluzole in Spinal Cord Injury Study (RISCIS),
which is also supported by AOSpine North America, AOSpine
International SCI Knowledge Forum, and the North American
Clinical Trials Network (NACTN) of the Christopher and Dana
Reeve Foundation. This research also received support from the
Dezwirek Foundation, the Sherman Clinical Research Unit, and
the Gerald and Tootsie Halbert Chair in Spinal Cord Research.
Dr. Martin received post-doctoral fellowship support from Cana-
dian Institutes of Health Research.
Disclosures: Allan R. Martin—RELATED: Grant: Rick Hansen Institute, AOSpineNorth America, North American Clinical Trials Network of the Christopher andDana Reeve Foundation, the DeZwirek Foundation, the Sherman Clinical Re-search Unit, and the Gerald and Tootsie Halbert Chair in Spinal Cord Research*;Dr. Martin received post-doctoral Fellowship funding from Canadian Institutesof Health Research (CIHR) that included $50,000 (CDN) annual salary support and$5,000 annual research allowance that enabled this research. Sukhvinder Kalsi-Ryan—UNRELATED: Consultancy: Neural Outcomes Consulting; Royalties: GRASSP.*Money paid to the institution.
REFERENCES1. Wheeler-Kingshott CA, Stroman PW, Schwab JM, et al. The current
state-of-the-art of spinal cord: applications. Neuroimage 2014;84:1082–93 CrossRef Medline
2. Stroman PW, Wheeler-Kingshott C, Bacon M, et al. The currentstate-of-the-art of spinal cord imaging: methods. Neuroimage 2014;84:1070 – 81 CrossRef Medline
3. Martin AR, Aleksanderek I, Cohen-Adad J, et al. Translating state-of-the-art spinal cord MRI techniques to clinical use: a systematicreview of clinical studies utilizing DTI, MT, MWF, MRS, and fMRI.Neuroimage Clin 2016;10:192–238 CrossRef Medline
4. Uda T, Takami T, Tsuyuguchi N, et al. Assessment of cervical spondy-lotic myelopathy using diffusion tensor magnetic resonance imagingparameter at 3.0 Tesla. Spine 2013;38:407–14 CrossRef Medline
5. Mamata H, Jolesz FA, Maier SE. Apparent diffusion coefficient andfractional anisotropy in spinal cord: age and cervical spondylosis-re-lated changes. J Magn Reson Imaging 2005;22:38–43 CrossRef Medline
6. Budzik JF, Balbi V, Le Thuc V, et al. Diffusion tensor imaging andfibre tracking in cervical spondylotic myelopathy. Eur Radiol 2011;21:426 –33 CrossRef Medline
7. von Meyenburg J, Wilm BJ, Weck A, et al. Spinal cord diffusion-tensor imaging and motor-evoked potentials in multiple sclerosispatients: microstructural and functional asymmetry. Radiology2013;267:869 –79 CrossRef Medline
8. Taso M, Girard OM, Duhamel G, et al. Tract-specific and age-relatedvariations of the spinal cord microstructure: a multi-parametricMRI study using diffusion tensor imaging (DTI) and inhomoge-neous magnetization transfer (ihMT). NMR Biomed 2016;29:817–32 CrossRef Medline
9. Oh J, Zackowski K, Chen M, et al. Multiparametric MRI correlates ofsensorimotor function in the spinal cord in multiple sclerosis. MultScler 2013;19:427–35 CrossRef Medline
10. Harrison NA, Cooper E, Dowell NG, et al. Quantitative magnetizationtransfer imaging as a biomarker for effects of systemic inflammationon the brain. Biol Psychiatry 2015;78:49–57 CrossRef Medline
11. Vavasour IM, Laule C, Li DK, et al. Is the magnetization transferratio a marker for myelin in multiple sclerosis? J Magn Reson Imag-ing 2011;33:713–18 CrossRef Medline
12. Kearney H, Yiannakas MC, Abdel-Aziz K, et al. Improved MRI quan-tification of spinal cord atrophy in multiple sclerosis. J Magn ResonImaging 2014;39:617–23 CrossRef Medline
13. Nouri A, Tetreault L, Zamorano JJ, et al. Role of magnetic resonanceimaging in predicting surgical outcome in patients with cervicalspondylotic myelopathy. Spine 2015;40:171–78 CrossRef Medline
14. Grabher P, Mohammadi S, Trachsler A, et al. Voxel-based analysis ofgrey and white matter degeneration in cervical spondylotic myelop-athy. Sci Rep 2016;6:24636 CrossRef Medline
15. Datta E, Papinutto N, Schlaeger R, et al. Gray matter segmentation ofthe spinal cord with active contours in MR images. Neuroimage2017;147:788 –99 CrossRef Medline
16. Cohen-Adad J, Buchbinder B, Oaklander AL. Cervical spinal cordinjection of epidural corticosteroids: comprehensive longitudinalstudy including multiparametric magnetic resonance imaging.Pain 2012;153:2292–99 CrossRef Medline
17. Cohen-Adad J, Zhao W, Keil B, et al. 7-T MRI of the spinal cord candetect lateral corticospinal tract abnormality in amyotrophic lat-eral sclerosis. Muscle Nerve 2013;47:760 – 62 CrossRef Medline
18. White ML, Zhang Y, Healey K. Cervical spinal cord multiplesclerosis: evaluation with 2D multi-echo recombined gradient echoMR imaging. J Spinal Cord Med 2011;34:93–98 CrossRef Medline
19. Cohen-Adad J. What can we learn from T2* maps of the cortex?Neuroimage 2014;93(pt 2):189 –200 CrossRef Medline
20. Martin AR, De Leener B, Cohen-Adad J, et al. A novel MRI bio-marker of spinal cord white matter injury: T2*-weighted whitematter to gray matter signal intensity ratio. AJNR Am J Neuroradiol2017 Apr 20. [Epub ahead of print] CrossRef Medline
21. Cohen-Adad J, El Mendili MM, Lehericy S, et al. Demyelination anddegeneration in the injured human spinal cord detected with diffu-sion and magnetization transfer MRI. Neuroimage 2011;55:1024 –33CrossRef Medline
22. De Leener B, Levy S, Dupont SM, et al. SCT: Spinal Cord Toolbox, anopen-source software for processing spinal cord MRI data. Neuro-image 2017;145(pt A):24 – 43 CrossRef Medline
23. Fonov VS, Le Troter A, Taso M, et al. Framework for integrated MRIaverage of the spinal cord white and gray matter: the MNI-Poly-AMU template. Neuroimage 2014;102:817–27 CrossRef Medline
24. Chang LC, Jones DK, Pierpaoli C. RESTORE: robust estimation oftensors by outlier rejection. Magn Reson Med 2005;53:1088 –95CrossRef Medline
25. Asman AJ, Bryan FW, Smith SA, et al. Groupwise multi-atlas seg-mentation of the spinal cord’s internal structure. Med Image Anal2014;18:460 –71 CrossRef Medline
26. Levy S, Benhamou M, Naaman C, et al. White matter atlas of thehuman spinal cord with estimation of partial volume effect. Neuro-image 2015;119:262–71 CrossRef Medline
27. Samson RS, Ciccarelli O, Kachramanoglou C, et al. Tissue- and col-umn-specific measurements from multi-parameter mapping of thehuman cervical spinal cord at 3 T. NMR Biomed 2013;26:1823–30CrossRef Medline
28. Smith SA, Jones CK, Gifford A, et al. Reproducibility of tract-specificmagnetization transfer and diffusion tensor imaging in the cervicalspinal cord at 3 Tesla. NMR Biomed 2010;23:207–17 CrossRefMedline
29. Ellingson BM, Salamon N, Grinstead JW, et al. Diffusion tensor im-aging predicts functional impairment in mild-to-moderate cervicalspondylotic myelopathy. Spine J 2014;14:2589 –97 CrossRef Medline
30. Kerkovsky M, Bednarik J, Dusek L, et al. Magnetic resonance diffu-sion tensor imaging in patients with cervical spondylotic spinalcord compression: correlations between clinical and electrophysi-ological findings. Spine (Phila Pa 1976) 2012;37:48 –56 CrossRefMedline
31. Samson RS, Levy S, Schneider T, et al. ZOOM or non-ZOOM? As-sessing spinal cord diffusion tensor imaging protocols for multi-centre studies. PLoS One 2016;11:e0155557 CrossRef Medline
32. Cadotte DW, Cadotte A, Cohen-Adad J, et al. Characterizing thelocation of spinal and vertebral levels in the human cervical spinalcord. AJNR Am J Neuroradiol 2015;36:803–10 CrossRef Medline
33. Kato F, Yukawa Y, Suda K, et al. Normal morphology, age-relatedchanges and abnormal findings of the cervical spine, part II: mag-netic resonance imaging of over 1,200 asymptomatic subjects. EurSpine J 2012;21:1499 –507 CrossRef Medline
1264 Martin Jun 2017 www.ajnr.org
34. Levesque IR, Giacomini PS, Narayanan S, et al. Quantitative magne-tization transfer and myelin water imaging of the evolution ofacute multiple sclerosis lesions. Magn Reson Med 2010;63:633– 40CrossRef Medline
35. Freund P, Weiskopf N, Ashburner J, et al. MRI investigation of thesensorimotor cortex and the corticospinal tract after acute spinalcord injury: a prospective longitudinal study. Lancet Neurol 2013;12:873– 81 CrossRef Medline
36. Summers P, Staempfli P, Jaermann T, et al. A preliminary study ofthe effects of trigger timing on diffusion tensor imaging of the hu-man spinal cord. AJNR Am J Neuroradiol 2006;27:1952– 61 Medline
37. Wilson JR, Barry S, Fischer DJ, et al. Frequency, timing, and predic-tors of neurological dysfunction in the nonmyelopathic patientwith cervical spinal cord compression, canal stenosis, and/or ossi-fication of the posterior longitudinal ligament. Spine 2013;38:S37–54 CrossRef Medline
AJNR Am J Neuroradiol 38:1257– 65 Jun 2017 www.ajnr.org 1265