Embed Size (px)
Citation preview

I
^ CLINICAL MANIFESTATION OF EXPERIMENTAL TRYPANOSOMA EVANSI
INFECTION IN THE DROMEDARY CAMEL AND THE EFFECT OF TREATMENT//
ON HAEMATOLOGICAL, BIOCHEMICAL AND SEROLOGICAL VALUES.
By
NYANG’AO JOSEPH MARTIN.
B.V.M. (U.O.N).
KENYA TRYPANOSOMIASIS RESEARCH INSTITUTE, MUGUGA,
P.O. BOX 362, KIKUYU, KENYA.
A THESIS
SUBMITTED IN THE PARTIAL FULFILLMENT FOR THE DEGREE OF
MASTERS OF SCIENCE (CLINICAL STUDIES)
IN THE DEPARTMENT OF CLINICAL STUDIES,
FACULTY OF VETERINARY MEDICINE,
UNIVERSITY OF NAIROBI.
unis •vnF*'" -niF* r>r r ,\
1993

II
DECLARATION.
(a) This Thesis is my original work and has not been
presented for a degree in any other University
NYANG’AO JOSEPH MARTIN. (B.V.M)
(b) This Thesis has been submitted for examination with my
approval as University Supervisor
Dr. JAMES M. MARIBEI. (B.V.M., M.Sc., PhD)
(c) This Thesis has been submitted for examination with my
approval as a Supervisor
Dr. W. OLAHO-MUKANI. (B.V.M., M.Sc., PhD)

Ill
DEDICATED TO:
This Thesis is dedicated to my late
Father, Peter M. Nyang’ao.
He was a father indeed.
IV
ACKNOWLEDGEMENTS.
I would like to express my appreciation to Dr. J.M. Maribei
(Principal Supervisor) and Dr. W. Olaho-Mukani (Supervisor) for the
advice, guidance and encouragement during this study and the
subsequent preparation o f the manuscript. My sincere thanks also go to
Professor M. Mbiuki, Chairman Clinical Studies Department, for accepting
me into his Department as a postgraduate student. I am very grateful
to Dr. J.K. Omuse, Director Kenya Trypanosomiasis Research Institute,
(KETRI), for introducing and initiating me to the subject of the camel
("the ship of the desert"), providing laboratory facilities, the financial
support and for his continued interest. I also wish to acknowledge the
KETRI Board of Management for accepting and allowing the study to be
undertaken in the Institute. I would like to show gratitude to Rhone
Merieux for their assistance.
I also wish to express my sincere thanks to the following who
contributed in various ways to ensure the completion of this work and
to whom I am most grateful: Dr. J.M. Ndung’u, for advice in the
histopathological studies, Dr. E. Opiyo for comments while reading this
manuscript, C.W. Muyodi and R. Mdachi for advice and help in the
statistical analysis and presentation of the data, and Maina, Karanja and
Njoroge for helping to conduct the biochemical and haematological
assays. My thanks also go to all the technical staff of Biochemistry
Division, KETRI, more especially J. Kimani, C. Ondu, F. Apwoyo, A.
Shamwama and J. Aming’a for the technical assistance and handling of
the camels. The same indebtedness go to Messrs R. Kaiyare and D.
Onyango for taking and preparing the photographs in this thesis.

V
My deepest gratitude is given to my family: my wife Nancy, my
mother Benina and my brother Boniface for their patience and
understanding.
Thanks also go to Ms. V. Muiru and Ms C. Ndung’u who helped in
typing of the manuscript.

VI
TABLE OF CONTENTS.
PAGE
T I T L E ........................................................ .......I
D E C L A R A T I O N ................................................
DEDICATION................................................. .......Ill
A C K NOWLEDGEMENTS.......................................... .......IV
TABLE OF C O N T E N T S ........................................ .......VI
LIST OF F I G U R E S ........................................... .......XI
LIST OF P L A T E S ............................................ .......XIII
LIST OF T A B L E S ............................................ .......XV
LIST OF A P P E N D I C E S ....................................... .......XVI
LIST OF A B B R E V I A T I O N S ...................................
A B S T R A C T ....................................................
CHAPTER ONE
1: Introduction and Object i v e s ............. ........1
1 .1 . Introduction............................
1.2 Object i v e s ...............................
CHAPTER TWO
2. Literature R e v i e w ..........................
2.1 A e t i ology................................1
2 .1 .1 Historical B a c k g r o u n d ...........................4
2 .1 .2 Classification and M o r p h o l o g y ...... ........4
2 .2 E p i zootiology...............................
2 .2 .1 Distribution and H o s t s ...............
2 .2 .2 T r a n s m i s s i o n .......................
2.2.3 Occurrence 10
VII
2.3 Pathogenesis and Pathology.........................11
2.3.1 Pathogenesis and clinical s i g n s ............... 11
2.3.1.1 Clinical s i g n s .................................... 11
2.3.1.2 Patho g e n e s i s ....................................... 14
2.3.2 Pathology.......................................... 15
2.3.2.1 Clinical P a t h o l o g y ............................. 15
2.3.2.2 Gross Pathology ................................17
2.3.2.3 Hist o p a t h o l o gy .................................. 17
2.4 D i a g n o s i s ..............................................17
a) Parasitological D i a g n o s i s ......................18
b) Serological D i a g n o s i s ........................... 20
2.5 T r e a tment.............................................. 22
2.6 C o n t r o l .................................................25
CHAPTER THREE
3. Materials and M e t h o d s ............................... 28
3.1 Experimental C a m e l s ................................. 28
3.2 Trypanosomes.......................................... 29
3.2.1 Stabilate H i s t o r y ................................29
3.2.2 Clone Preparation................................30
3.3 Sampling F r e q uency.................................. 31
3.4 S a m p l e s .................................................32
3.4.1 Unclotted Blood s a m p l e ......................... 32
3.4.2 Serum s a m p l e s .....................................32
3.5 Laboratory Procedures.............................. 32
3.5.1 Packed Cell Volume (PCV) d e t e r m i n a t i o n .... 32
3.5.2 Buffy coat examin a t i o n ......................... 33
3.5.3 R B C , WBC and Hb d e t ermination................ 33

VIII
3.5.4 Differential Leucocyte C o u n t s ................ 34
3.5.5 Biochemical A n a l y s i s ............................ 34
3.5.6 Serological Techniques......................... 34
3.5.6.1 Reagents for enzyme-linked immunosorbent
a s s a y ............................................. 34
a) Preparation of trypanosomal antigen for
antibody ELISA t e s t ................................. 34
b) Preparation of trypanosomal antigens for
raising polyclonal rabbit a n t i - T .eva n s i
immune s e r u m .......................................... 36
c) Preparation, purification and conjugation
of rabbit anti- T. evansi IgG ( R A T E / I g G ) ........ 37
d) Preparation of camel IgG and rabbit
anti-camel I g G ......................................... 38
3.5.6.2 Antigen ELISA Technique........................ 38
3.5.6.3 Antibody ELISA Technique.......................39
3.5.7 Mouse Inoculation ( M I ) ......................... 40
3.6 Clinical Examin a t i o n ............................ 40
3.7 Pathology.......................................... 41
3.8 Data A n a l y s i s ..................................... 41
CHAPTER FOUR
4 . R e s u l t s .................................................. 42
4.1 Clinical A s s e s s m e n t ................................. 42
4.1.1 Clinical S i g n s ................................... 42
4.1.2 Parasitaemia...................................... 51
4.1.3 Rectal Temper a t u r e .............................. 56
4.2 Haematological Findings 59

IX
4.2.1 Packed Cell Volume (PCV).......................59
4.2.2 Red Blood Cell Count ( R B C ) .................... 64
4.2.3 Haemoglobin (Hb) C o n c e n t r a t i o n ............... 68
4.2.4 White Blood Cell Count ( W B C ) .................. 72
4.2.5 Differential Leucocyte C o u n t ..................76
(a) L y m p h o c y t e s ...................................... 76
(b) N e u t r o p h i l s ...................................... 76
(c) M o n o c y t e s ......................................... 76
(d) Eosin o p h i l s ...................................... 76
(e) B a s o p h i l s ......................................... 77
4.3 Biochemical P r o f i l e .................................85
4.3.1 Alkaline phosp h a t a s e ............................. 85
4.3.2 Alanine aminotransferase........................ 85
4.3.3 Aspartate amin o t r a n s f e ra s e ..................... 86
4.3.4 Creatine k i n a s e ....................................86
4.3.5 Lactic dehydrogenase............................. 86
4.3.6 Blood urea n i t rogen.............................. 87
4.3.7 Total protein, albumin and g l o b u l i n ..........87
4.4 Serological a s s a y s .................................. 91
4.4.1 Antigen d e t e c t i o n ................................91
4.4.2 Antibody d e t e c t i o n .............................. 92
4.5 Pathological f i n d i n g s .............................. 99
4.5.1 Gross p a t h o l o g y .................................. 99
4.5.2 Hist o p a t h o l o gy ................................... 100
CHAPTER FIVE
5. Discussion and Conclusions......................... 114
5.1 Discus s i o n ........................................ 114

X
5.2 C o n c l u s i o n s ............................................... 133
Refere n c e s .............................................................135
Append i c e s .............................................................147

XI
LIST OF FIGURES.
Figure Page
1. Means daily parasitaemia level of infected
non-treated camels (Group A ) .............................. 54
2. Mean daily parasitaemia level of infected and
treated camels (Group 8 ) .................................. 55
3. Mean daily rectal temperatures of infected
non-treated camels (Group A ) ...............................57
4. Mean daily rectal temperatures of infected and
treated camels (Group 8 ) ....................................58
5. Mean weekly packed cell volume of infected
non-treated camels (Group A ) ...............................61
6. Mean weekly packed cell volume of infected and
treated camels (Group 8 ) ....................................62
7. Mean weekly red blood cell count of infected
non-treated camels (Group A ) ...............................65
8. Mean weekly red blood cell count of infected and
treated camels (Group 8 ) ................................... 66
9. Mean weekly haemoglobin concentration of infected
non-treated camels (Group A ) .............................. 69
10. Mean weekly haemoglobin concentration of infected
and treated camels (Group 8 ) .............................. 70
11. Mean weekly white blood cell count of infected
non-treated camels (Group A ) .............................. 73
12. Mean weekly white blood cell count of infected and
treated camels (Group 8 ) ................................... 74

XII
13. Mean weekly lymphocyte count of infected
non-treated camels (Group A ) ...............................78
14. Mean weekly lymphocyte count of infected and
treated camels (Group 8 ) ....................................79
15. Mean weekly neutrophil count of infected
non-treated camels (Group A ) ...............................80
16. Mean weekly neutrophil count of infected and
treated camels (Group B ) ..................................... 81
17. Mean weekly monocyte count of infected
non-treated, treated and control c a m e l s ................ 82
18. Mean weekly eosinophil count of infected
non-treated, treated and control c a m e l s ................ 83
19. Mean weekly antigen ELISA profile of infected
non-treated camels (Group A ) ...............................93
20. Mean weekly antigen ELISA profile of infected and
treated camels (Group B ) ....................................94
21. Mean weekly antibody ELISA profile of infected
non-treated camels (Group A ) .............................. 95
22. Mean weekly antibody ELISA profile of infected and
treated camels (Group B ) ....................................96
XIII
1. Infected animals showing enlarged inferior
cervical lymph n o d e .......................................... 44
2. Excessive lacrimal discharge in an infected c a m e l . . . 45
3. Ventral oedema extending anteriorly to the
sternal p a d .....................................................46
4. Ventral oedema extending posteriorly to
preputial area in a male c a m e l ............................. 47
5. Emaciated camel in the infected non-treated
camel (Group A) at the end of the s t u d y ................... 48
6(a). Infected and treated camel (Group B) at the
end of the s t u d y ........................................... 49
6(b). Non-infected control camel at the end of the
e x p e r i m e n t ...................................................49
7. Recumbent camel in group A a few days before d e a t h . . 50
8. Abomasum of an infected non-treated camel that
died during the acute disease showing diffuse and
ecchymotic haemorrhages.................................... 101
9. Small intestines of an infected non-treated camel
that died during the acute disease showing diffuse
haemo r r h a g e s .................................................. 102
10. Trachea of an infected non-treated camel that died
during the acute disease showing froth and
congestion (arrows)......................................... 103
11. Lung lobes of an infected non-treated camel that
died during the acute disease showing rounded
LIST OF PLATES
PLATE Page

XIV
e d g e s .............................................................104
12. Heart of an infected non-treated camel that died
during the acute disease showing petecchial
h a e m o r r h a g e s ................................................... 105
13. Heart of an infected non-treated camel that died
at the end of the study showing depleted coronary
f a t ............................................................... 106
14. Spleen of an infected non-treated camel that died
at the end of the study showing p a l l o r .................107
15. Brain of an infected non-treated camel that died
during the acute disease showing congested
m e n i n g e s ........................................................ 108
16. Intestinal loops of an infected non-treated camel
that died at the end of the study showing
haemorrhages on submucosa and a d h e s i o n s ............... 109
17. Cross section of the heart muscle showing
venous congestion (arrows 1 & 2) and myocardial
haemorrhage (arrow 3) (H & E, x 1 0 0 ) .....................110
18. Cross section of the lungs showing venous
congestion and mild generalized lymphocytic
infiltration (H & E, x 100)................................Ill
19. Cross section of the kidney showing
marked venous congestion (arrows) (H & E, x 100)....112
20. Cross section of the kidney showing oedema
in the brain stem characterized by vacoulation
(arrows) (H & E, x 1 0 0 ) .....................................113

XV
1. Parasitaemia score using buffy coat examination
(HCT) for the first 40 days of i n f e c t i o n.............. 53
2. Mean weekly PCV (%) (+SD) values of infected and
control camels throughout the study p e r i o d ............63
3. Mean weekly RBC (xl06 /ml) (+SD) values of infected
and control camels throughout the e x p e r i m e n t ..........67
4. Mean weekly Hb (g/dl) (+SD) values of infected and
control camels throughout the e x p e r i m e n t ............... 71
5. Mean weekly WBC (xl03 /ml) (+SD) values of infected
and control camels throughout the e x p e r i m e n t ..........75
6. Mean weekly differential leucocyte count (+SD)
values of infected and control camels throughout
the experimental p e r i o d ..................................... 84
7a. Mean enzyme activity (IU/1) (+SD) of infected and
control camels throughout the study p e r i o d ............ 89
7b. Mean non-enzymatic biochemical values (+SD) of
infected and control camels throughout the study
p e r i o d ...........................................................90
8a. Mean Ag-ELISA 0D values (±SD) of infected and
control camels throughout the e x p e r i m e n t ...............97
8b. Mean Ab-ELISA 0D values (+SD) of infected and
control camels throughout the e x p e r i m e n t ..............98
LISTS OF TABLES
Table page
XVI
LIST OF APPENDICES
Page
I. Mean daily temperatures (°C) (+SD) of infected and
control camels throughout the study p e r i o d ........... 147
II. Ranges of the normal haematological values for
the dromedary c a m e l ......................................... 150
III. Ranges of the normal serum/plasma chemistry
values for the dromedary c a m e l s ..........................151
IV. B u f f e r s .........................................................152
XVII
KETRI.............................. Kenya Trypanosomiasis
Research Institute.
PCV................................ Packed Cell Volume
8CE................................ Buffy coat examination
RBC................................ Red blood cells
WBC................................ White blood cells
H b ..................................Haemoglobin concentration
D L C ................................ Differential leucocyte count
A P ..................................Alkaline phosphatase
AST................................ Aspartate aminotransferase
ALT................................ Alanine aminotransferase
C K ................................. Creatine kinase
LDH................................ Lactic dehydrogenase
T P ................................. Total proteins
A L B ................................ Albumin
G L B ................................ Globulin
B U N ................................ Blood urea nitrogen
P B S ................................ Phosphate buffer saline
P S G ................................ Phosphate saline glucose buffer
E S G ................................ EDTA saline glucose buffer
E D T A ............................... Ethylene diamine tetraacetic
acid (disodium salt)
D E A E ............................... Die thy lami noethyl
E L I S A ............................. Enzyme-1 inked immunosorbent
assay
LIST OF ABBREVIATIONS.
RATE Rabbit a n t i -T .e v a n s i

XVIII
ABSTRACT:
Clinical manifestation o f experimental T.evansi infection in the dromedary camel and the effect o f treatment on haematological, biochemical and
serological values.
With the growing awareness of the unique role the camel plays in
agriculture and environmental preservation, increasing attention is being
focused on improving its productivity and health status, so as to
improve and diversify the production capacity o f the marginal lands.
Information on individual parameters of the camel’s haematological and
biochemical values is largely inadequate. Because the haematological and
biochemical profiles can be useful aids in diagnosis of certain diseases,
the norm for these parameters need to be established. Trypanosoma
evansi (T. evansi) is one of the most economically important diseases of
the camel and there is need to study this disease in detail. This study
was carried out with the aim o f elucidating some of the haematological
and biochemical parameters in normal and T.evansi infected camels.
Haematological and biochemical values in healthy dromedary camels
were determined in eleven camels for a period o f 4 weeks. These values
correlated well with those established in other countries.
Nine camels were artificially infected with T. evansi isolated from a
naturally infected camel and passaged through mice. Two camels were
used as non-infected controls. Four camels (Group A) were allowed to
run with disease throughout the study period, while 5 camels (Group B)
were treated with Cymelarsan at the recommended therapeutic dose of
0.25mg/kg body weight by deep intramuscular injection at the onset of
the clinical disease. Three out of 4 camels in group A died o f the
disease, while all camels in group B survived to the end of the

XIX
experiment. The clinical signs manifested by the infected camels
included inappetance, dullness, enlarged superficial lymph nodes,
excessive bilateral lacrimation, ventral oedema, poor hair coat and
emaciation. Pyrexia coincided or closely followed parasitaemia crises.
Post mortem examination revealed excessive peritoneal and pericardial
fluids, haemorrhages in the gastrointestinal tract (especially in the
abomasum and small intestines), froth in trachea and lungs, congested
meninges and kidneys and oedematous brain.
Following infection PCV, RBC and HB levels dropped rapidly in the
first 3 weeks in all the infected animals. In group A camels, PCV, RBC
and Hb levels continued to decline until they died or the study was
terminated, while in the treated camels these parameters levelled o ff 4
weeks after treatment and started recovering. There was an increase in
some enzyme activity notably AP, AST, CK and LDH after infection even
though there was no statistical significant difference in some of the
enzyme changes when compared to the non-infected controls.
Parasites disappeared from peripheral circulation within 24 hours
after treatment and were no longer detectable to the end of the study.
Circulating antigens which were detected 2 weeks after infection were
cleared within 10 weeks following treatment. In the 4 non-treated
camels, antigens remained detectable throughout the study period.
Thus, in this study baseline data o f some haematological and
biochemical values of the Kenya dromedary has been established. A
comprehensive clinical picture of T. evansi infection in the dromedary
camel has been recorded. The study has further demonstrated that
T.evansi infection in camels is fatal, especially when no therapeutic
intervention occurs and that the disease can manifest itself as an acute

XX
syndrome with camels dying within the first few weeks o f infection.
The disease causes changes in haematological and biochemical values.
Cymelarsan, as used in this study, elicits complete cure in camels
infected with T. evansL Antigen-detection ELISA (Ag-ELISA) has been
shown to be a more efficient assay in assessing the patent state of
infection in infected camels and in evaluating the success of therapeutic
intervention than the antibody-detection (Ab-ELISA) test.
1
CHAPTER ONE
INTRODUCTION AND OBJECTIVES
1.1. Introduction
There are two species o f camels: the one-humped camel, Camelus
dromedarius, and the two-humped camel, Camelus bactrianus. The one
humped camel is found in the desert and semi-desert areas o f Northern
and Eastern Africa, the Middle East and West-Central Asia. The two
humped camel is found in the colder areas o f Southern Russia, Mongolia,
East-central Asia and China (Wilson, 1981). Camelus dromedarius, the
only camel species found in Kenya, is kept by the nomadic pastoralists
of the arid and semi-arid parts of northern Kenya. The latest
estimation of the population o f camels in Kenya is 800,000 (FAO Animal
Health Yearbook, 1982) making Kenya to rank 6th in Africa and 8th in
the world in camel keeping.
The camel is essential for the livelihood o f the nomadic
pastoralists in Kenya. It is a hardy animal that is very well adapted
physiologically and anatomically to arid and semi-arid conditions where
it demonstrates more efficient utilization of the pasture than most of
other livestock species. The camel is used mainly to provide milk and
as a draft animal. Camel milk, which contains a higher proportion of
vitamin C than either cow or human milk, is the staple diet of many
nomadic people. Camels also provide meat, blood and skin. Another
aspect where the camel is of economic importance in Kenya is the use of
this animal in tourism industry. The recent introduction of the Maralal
International Camel Derby is drawing increasing participation from other
countries of Africa and the Middle East. With the growing awareness of
the unique role the camel plays in agriculture, culture and heritage of

2
the arid and semi-arid environment, increasing attention is being
focused on improving its productivity and health status, so as to
improve and diversify the production capacity of these marginal lands.
Moreover, more and more of the areas traditionally used for cattle are
gradually suffering from desert encroachment, particularly in the dry
savannahs o f Africa South of Sahara.
Trypanosomiasis due to T. evansi (surra) is endemic in Kenya and
is the most important disease affecting the camels (Fazil, 1977; Olaho-
Mukani, 1981; Rutagwenda, 1982). Diagnosis of T.evansi infections in the
field is largely based on clinical signs, the cardinal ones being anaemia
and emaciation, even though they are not pathognomonic. Studies
carried out in Kenya on camels naturally infected with surra failed to
clearly indicate if the anaemic status, emaciation and deaths observed
were due to helminths, trypanosomiasis or malnutrition (Rutagwenda,
1982; Wilson et a l 1983). Thus, there is a need to establish a
comprehensive clinical picture of camel trypanosomiasis.
T.evansi is not restricted to the bloodstream and causes vascular
damage, disruption of connective tissue and hence the disruption of the
integrity of body cells, causing large quantities o f cellular enzymes to
be released into the blood (Goodwin, 1970). Thus, assaying the serum
levels of a number of organ-specific enzymes should allow detection of
the host’ s tissue damage by the parasite because the enzymes
reasonably reflect pathological changes in the specific organ(s) or
tissue. It is important to note that the haematological and biochemical
profiles of normal Kenyan camels are far from complete and the
veterinarians and researchers working with these animals rely on data
established in countries such as Sudan (Salaheldin et al., 1979), India

3
(Lakhotia et al., 1964) and Iran (Ghodsian et al., 1978).
The principal practical control method of T.evansi is mainly
through surveillance and chemotherapy. However, resistant stocks of
T.evansi strains to the recommended drugs used for camel surra
(suramin and quinapyramine) have been reported (Gill, 1971; Luckins et
al., 1979; Schillinger et al., 1982). The production o f some o f these
trypanocides has been stopped due to the prohibitive costs of
manufacturing, marketing and the low budgets in the target countries
(Jeffries, personal communication, 1992). Recently, a novel trypanocide,
Cymelarsan® (Rhone Merieux), has been introduced for trials for
treatment of camel surra. Intensive studies need to be done pertaining
to this drug before it is registered for use in camel trypanosomiasis in
this country.
It is hoped that this study will go a long way in improving the
diagnostic accuracy of the camel surra and generate baseline data on
the Kenyan dromedary camel.
a) To establish the normal haematological and biochemical
profiles of the Kenyan camel.
b) To establish the clinical symptoms exhibited by camels
experimentally infected with T.evansi.
c) To determine clinical, haematological and biochemical
parameters in camels during the course o f infection with T.evansi
and after successful treatment with Cymelarsan® (Rhone Merieux).
d) To use antigen ELISA as a tool for evaluating the
efficacy of CymelarsanR (Rhone Merieux).

4
CHAPTER TWO
LITERATURE REVIEW
2.1. Aetiology
2.1.1. Historical, background
Trypanosoma ( Trypanozoon) brucei evansi (hereafter referred to
as Trypanosoma evansi) was the first pathogenic trypanosome to be
identified and described as the causative agent of mammalian
trypanosomiasis (Evans, 1880). It was associated with an epidemic in
equines and camels known as ’ surra’ in India. More discoveries have
been made over years since then, o f similar diseases caused by
trypanosomes indistinguishable from T. evansi in various parts o f the
world and in diverse mammalian hosts. Thirty three different names
have been used for these non-tsetse transmitted parasites. Currently,
T.evansi is the only accepted valid name that is given to the parasite of
surra and replaces all the other names previously used for this species
(Hoare, 1956). It is presumed that T.evansi evolved from T.brucei due
to continuous mechanical transmission of the latter by blood sucking
flies, in the absence of Glossina. During the adaptation to the biting
flies, T.brucei lost cyclical transmission ability and became adapted to
mechanical transmission giving rise to a predominantly slender parasite
that infects animals outside the tsetse infested areas (Hoare, 1972).
2.1.2. Classification and Morphology.
T. evansi belongs to the phylum Protozoa, order Kinetoplastida,
family Trypanosomatidae, genus Trypanosoma and subgenus Trypanozoon
5
(Hoare, 1972). The genus Trypanozoon is the most homogeneous group
of all trypanosomes in that it contains a number of species which are
morphologically indistinguishable but differ only in biological and
nosological features.
In the blood of its mammalian host, T.evansi is represented almost
exclusively by slender trypanosomes that are distinguishable from the
intermediate and stumpy forms o f T.bruceL The overall length of
T.evansi ranges from 15p to 34g, with a mean o f 24p. The kinetoplast is
sub-terminal, the undulating membrane is well developed and there is a
substantially long flagellum (Soulsby, 1986). Although T.evansi is
typically monomorphic, some strains sporadically exhibit some type and
degree o f polymorphism. Forms which lack a kinetoplast may arise
spontaneously, especially after drug treatment (Hoare, 1954; Killick-
Kendrick, 1964).
T.evansi is the main causative agent o f camel trypanosomiasis.
Other parasites in the subgenus Trypanozoon include T.brucei brucei,
T.b.rhodcsicnse, T.b.gambiense, all of which are tsetse borne and
T.equiperdum which is sexually transmitted. Tsetse transmitted
trypanosomes ( T.brucei and T.congolense) affect camels in regions where
these flies exist and have been reported in camels in Somalia, Kenya and
Sudan (Bennett, 1933; Wilson et al., 1983; Olaho-Mukani, 1981; Dirie et
al., 1989). However, most camels are not found in the tsetse-infested
areas, hence the tsetse-borne trypanosomes are less prevalent in these
animals. Pellegrini (1948) artificially infected two camels with T.simiae,
but recent reports show that this species of the subgenus Nanomonnas
is not pathogenic to camels (Zweygarth et al., 1987).

6
2.2. Epizootiology
2.2.1. Distribution and Hosts
Surra has an extremely wide geographical range in countries with
hot and warm temperatures, but previous distribution coincided with
that o f the camels. Transmission by blood-sucking insects other than
Glossina has enabled T.evansi to extend its range into Africa, Asia and
America (Soulsby, 1986). In Africa, the disease occurs in regions around
the Sahara desert: West, North and East Africa. South o f the Sahara it
almost merges with the northern limits of the tsetse fly areas (Hoare,
1972). In the Arabian peninsula surra occurs in Saudi Arabia, Yemen,
Sultanate of Oman and the United Arab Emirates. In Near and Far East
it is reported in Turkey, Lebanon, Israel, Syria, Jordan, Iraq, Iran,
Afghanistan, Pakistan, Central Asian republics o f USSR, India, Burma,
Malay Peninsula, Indo-China, Southern China, the Islands o f Indonesia
and Philippines. The disease also occurs in South and Central America
(Hoare, 1972). Thus, the disease occurs throughout all the areas where
camels are commonly found. The disease has, however, been eradicated
in Australia, North America and South West Africa as a result of major
veterinary control measures (Rottcher et al., 1987).
T.evansi epidemics involve different animal hosts in different parts
of the world and the effects o f the infection in different localities vary
according to the strain of parasite present (Hoare, 1956). In Africa,
camels are most affected and in Central and South America the horses
are the main hosts. In the Soviet Union and Mid-Asia, the camels are
the most affected animals and in India buffaloes are most affected.
Natural infections have been reported in camels, horses, mules and
donkeys (Bennett, 1933). All camels are susceptible regardless o f the
7
breed or age, so are horses and most carnivores. Young camels
however have shown some degree of resistance (Wilson et al., 1983).
Among the domesticated animals, T.evansi causes disease in camels,
horses, donkeys, mules, cattle, water-buffaloes, sheep, goats, dogs and
cats. In the wild animals the disease has been reported in elephants,
African-buffalo, deer, antelopes, tapir and capybara (Hydroechoerus
hydrochaeris) (Mahmoud and Gray, 1980). Horses, dogs and camels
usually experience an acute fatal infection with T.evansi and die after a
brief period o f illness (Currason, 1943). Since the disease is fatal in
horses and dogs, these animals are unimportant in the maintenance of
T.evansi infection in nature (Ilemobade, 1971; Horchner et al., 1983).
Evidence from several workers confirms that cattle, sheep and
goats undergo a protracted course of a mild clinical disease that results
in carrier state and may act as reservoir hosts for the camel (Ilemobade,
1971; Khasanov and Ivanitskaya, 1974; Chand and Singh, 1971; Malik and
Mahmoud, 1978). Water-buffaloes, antelopes, deers, and other wild
animals are also considered to be asymptomatic reservoirs of the
infection for equines and camels. Cattle reservoir hosts in South
America provide a source o f T.evansi for vampire bats (Desmodus
rotundus) which transmit the organisms to horses. Healthy capybara
has been found to harbour T.evansi and constitutes a reservoir of
infection for horses and dogs in South America (Reveron et al., 1992).
Ocelot ( Felis pardalis) is a reservoir found in lower Amazon Region
(Shaw, 1977). Srivastava and Ahluwalia (1972) observed that pigs could
be experimentally infected with T.evansi showing intermittent fever and
rarely parasitaemia. However, recent studies show that pigs are not
affected by T.evansi parasites (Zweygarth et al., 1987). From an

8
economic point, the camel is probably the most important victim of surra.
2.2.2: Transmission
Surra is transmitted mechanically from an infected to a healthy
animal by a number o f haematophagous flies (Gatt-Rutter, 1967; Scott,
1973). The most efficient flies that transmit this disease are the
tabanids (horse-flies) (Rogers, 1901; Nieschulz, 1930). The other flies
that may transmit the disease but are o f minor importance are Stomoxys,
Lyperosm and Haematobia. Transmission efficiency of different flies may
vary under different geographical conditions (Losos, 1980), but it has
been shown that tabanids are the principal vectors o f surra in camels
under field conditions (Dixie et al., 1989). T.evansi undergoes no
cyclical development in all these flies. In the case of mechanical
transmission by the biting flies, the trypanosome is passed from the
infected to a clean host by infected blood in or on the mouth parts as
the fly moves from one animal to another between interrupted blood
meals (Soulsby, 1986). An interrupted feed on an infected host leaves
the fly hungry and when it moves to another host it can transmit the
infection through its trypanosome-contaminated mouthparts (Hoare, 1972).
Infectivity o f T.evansi is determined by a time factor, since transmission
is effective only during a very short period of survival of the
haematozoic forms of the parasite in the proboscis of the vector. Hence,
the shorter the time between the two feeds the greater the chances of
mechanical transmission (Hoare, 1972). Infectivity is highest minutes
after feeding, decreases rapidly and is lost within 8 hours (Losos, 1980).
The existence of carrier animals especially goats, sheep and donkeys, in
the vicinity o f susceptible camels makes transmission by biting flies
possible.
9
Vampire bats have been found to play an important part in the
spread of T.evansi among horses in Central and South America and have
been shown to transmit this disease mechanically (Hoare, 1965). The
bats can get the infection, remain carriers and transmit the disease
when they bite other animals. The parasites in the bat do not undergo
any development, but multiply in their blood as they do in the natural
vertebrate hosts (Losos, 1980). Occasionally, the bats die of the
infection about a month after an infected blood meal. Horse flies also
transmit T.evansi in this part of the world (Boehringer and Prosen,
1961). However, bats are more effective in transmission than the biting
flies because the trypanosomes multiply in their tissues and infections
are maintained for long periods of time.
In dogs and cats, infection occurs by ingestion of tissues from
infected carcasses (Soulsby, 1986). Nasal and conjuctival transmission of
trypanosomes have also been reported (de Jesus, 1951) but these routes
are unimportant in the field. Mosquitoes have been incriminated but
evidently their role is very small (Currason, 1947). The transmission of
T.evansi by ticks from camel to camel has been proved impossible or
inefficient (Kirmse and Taylor-Lewis, 1978). Cross and Patel (1922)
successfully used ticks to transmit T.evansi from camel to rabbit and
not from camel to camel. Direct transmission to the foetus in pregnant
camels has been reported during the acute stages of infection (Sergent
et al., 1920).
Farm practices such as ear notching, tattooing and castrations
have been proved to cause transmission of T.evansi from infected camels
to clean ones. These unsanitary managemental practices when done
using the same devices in goats seemingly normal but otherwise sub

10
clinically sick, make transmission of the disease from the goat to a
healthy camel possible. Pastoral practices e.g. blood letting have also
been shown to cause transmission. According to Leese (1927)
transmission can also occur when infected camels rub against healthy
ones.
2.2.3. Occurrence
Surra is a seasonal and regional disease prevalent during fly
season and in areas near water where the flies breed (Higgins, 1983).
There is a definite correlation between seasonal outbreaks o f T.evansi
infections and the tropical rainy season. The intensity o f the disease is
closely associated with seasonal increases in fly numbers at the end of
the rains (Yagi and Razig, 1972). Most outbreaks have been shown to
occur immediately after the rainy season when the number o f tabanids
increases (Dixie et al., 1989). In Arabia the disease is prevalent from
March to September (Higgins, 1983). Olaho-Mukani (1981) showed that in
Kenya, there were elevated point prevalence rates o f surra in two
peaks, one following the long rains (March to June) and the other after
the short rains (September to November). Each peak was followed by a
rapid fall as the dry season advanced. Prevailing ecological conditions
during and immediately after the rains favour the breeding and
prevalence o f the tabanids and other haematophagous flies that transmit
the disease. The sporadic infections in the dry season are due to other
species of tabanids confined to river banks and are prevalent
throughout the year. These ensure that transmission of the disease
occurs wherever the reservoir hosts, the vectors and the susceptible
hosts coexist (Yagi and Razig, 1972).
11
2.3. Pathogenesis and Pathology
2.3.1. Pathogenesis and clinical signs
2.3.1.1. Clinical signs
a) The disease in camels
Trypanosomiasis in camels usually takes a chronic course, however
several phases are recognized: acute, subacute and chronic (Gatt-Rutter,
1967; Richard, 1979; Dirie et al., 1989). The course of infection depends
upon the susceptibility of the host, strain of the infecting parasite and
the density o f the biting flies and therefore the parasite load.
i) Acute form.
The acute form of the disease begins with first appearance o f
trypanosomes in peripheral blood after the incubation period o f 3 to 7
days. The animal stops eating, becomes dull and listless, there is a
drop in milk production and pregnant females abort (Higgins, 1983).
The parasitaemia is high and although fluctuating, during the course o f
the disease trypanosomes are always demonstrated in blood. There is
persistent fever and some animals may die during this phase of the
disease which lasts two to three weeks (Higgins, 1983). Petechial
haemorrhages in serous membranes may be observed.
ii) Subacute form.
The subacute disease lasts 3 to 4 months and the animal starts
losing body condition, there is progressive development of anaemia and
some animals may die. The subacute form o f disease was reproduced
by subcutaneous inoculation of infective blood (Alongi and Balboni,
12
1935). Animals that survive the acute and subacute disease develop a
chronic disease which is the most common.
iii) Chronic form.
Chronic surra is the most prevalent form of the disease under
natural conditions. It is a slow wasting disease that is protracted over
2 to 3 years and is characterized by intermittent fever, low frequency
and intensity of parasitaemia, anaemia, progressive emaciation,
disappearance of the hump, atrophy of the thigh muscles, oedema of
dependent parts and deaths in some animals (Gatt-Rutter, 1967; Mahmoud
and Gray, 1980; Singh et al., 1980). Huge production losses occur due
to lower milk and meat yields, abortions, premature births and inability
to feed the young; all o f which reduce reproductive potential in affected
herds (Yagil, 1982). The chronic disease appears in a period when the
infected animal has exhausted its defence mechanisms. This is the
period when the parasites, being tissue invasive, also become established
extravascularly and are less numerous in the peripheral blood. Debility,
alopecia, keratinization, depletion of subcutaneous fat and facial oedema
have also been demonstrated in experimentally infected camels
(Raisinghani, et al., 1980). Singh et al. (1980) observed diarrhoea and
sexual excitement as additional signs. The chronic phase is followed by
a period characterized by aparasitaemia when relapses become more rare
and animals remain in apparently good health, sometimes for several
years. This is the inapparent disease (Wilson et al., 1981). Occasionally,
camels may recover spontaneously (Sergent et al., 1920).
13
b) The disease in other animals
In the horse the average prepatent period is 3 to 4 days after
inoculation (Horchner et al., 1983). Relapsing or undulating peaks of
parasitaemia with corresponding fever follow. Fever increases up to
41°C. With longer periods o f high level parasitaemia, fever is nearly
continuous and o f moderate degree. There is reduced appetite, watery
nasal discharge, slight lacrimation, sweating, hyperesthesia, muscular
tremors and unsteady gait (Ilemobade, 1971). A decrease of
trypanosomes in the peripheral blood usually coincides with a rapid
decline in body temperature to an almost normal. Emaciation and oedema
in the horse are the most common clinical signs. The oedema varies
from urticarial plaques on the neck and flanks, to oedema o f the legs
and lower parts of the body. The plaques may undergo necrosis in the
center and haemorrhages occur at the junction o f the skin and mucous
membranes, especially at the nostrils, eyes and anus (Soulsby, 1986).
The pathogenicity of T.evansi infection was demonstrated by Ilemobade
(1971) in donkeys, cattle and horses. All infected horses died, six out
of seven donkeys and all cattle infected survived. Thus, he showed
that T.evansi was very pathogenic to horses, less pathogenic to donkeys
and had virtually no effect on oxen. The same pathogenicity in the
horse was demonstrated by Horchner et al. (1983). Ocular lesions that
include serous lacrimation, periorbital oedema, a milky-gray cloudiness
and progressive vascularisation that starts at the limbus to cover the
whole cornea, have been recorded in horses experimentally infected with
surra (Ilemobade, 1971; Horchner et al., 1983)
Canine surra is acute and fatal; pups die within 10 to 25 days,
but in adult dogs the disease may last from 36 to 150 days ending
14
fatally. Oedema is marked, corneal opacity is common and, due to the
oedema of the larynx, voice changes similar to those which occur in
rabies may be noticed (Soulsby, 1986). In elephants, surra follows a
course similar to that seen in camels; animals become emaciated and show
marked muscular weakness. In the other domestic animals (cattle, goats
and sheep) the disease is usually inapparent. The capybara, although
normally a reservoir host for the horse, may suffer an acute infection
similar to that in the horse.
2 .3 .1 .2. Pathogenesis
T.evansi, like other members of subgenus Trypanozoon spreads to
different body compartments. The parasites have been found in joints
and the cerebrospinal fluid (CSF) of camels (Leese, 1927) and ponies
(Horchner et al., 1983). The occurrence o f the trypanosomes in CSF
could be the likely cause o f motor disturbance (Singh et al., 1980;
Horchner et al., 1983). The nervous disturbances include intermittent
tremors and clonic cramps o f muscles in the shoulders and forelimbs.
Animals stand with outstretched splayed forelegs and show progressive
ataxia. Paraplegia or paralysis finally occurs (Horchner et al., 1983).
T.evansi can enter the CNS at a very early stage without necessarily
causing any immediate nervous symptoms (Kraneveld and Djaenoedin,
1949). Goel and Singh (1970) observed that the aqueous humor of
rabbits infected with T.evansi and which were developing conjuctivitis
and keratitis, and the aqueous humor of a dog which developed
glaucoma, contained T.evansi parasites. Aqueous humor from eyes with
haemorrhagic alterations have been shown to contain large numbers
(6x10s) of viable trypanosomes per milliliter. Trypanosomes in smaller
15
quantities have also been detected in the aqueous humor o f those
animals with keratitis or uveitis and even from eyes that showed neither
haemorrhages nor macroscopic alterations (Horchner et al., 1983).
2.3.2. Pathology.
2.3.2.1. Clinical Pathology
The main clinico-pathological feature o f T.evansi infection in
camels is anaemia similar in nature to that caused by other species of
trypanosomes in other animals. The anaemia in camels has been
described cytologically as macrocytic (Jatkar and Purohit, 1971) and
aetiologically as haemolytic (Raisinghani et al., 1981b). Haematological
studies showed reductions in red blood cells, haemoglobin, packed cell
volume and serum levels o f calcium, chloride, potassium and sodium.
Increase in reticulocytes, eosinophils and organic phosphate were
observed (Raisinghani et al., 1981b). The level of blood glucose has
been shown to fall with increasing parasite levels (Jatkar and Singh,
1971; Raisinghani et al., 1981b). Jatkar et al. (1973) observed that in
acute infection albumin remained unchanged but fell below normal during
chronic disease; alpha globulin fell during acute infection and increased
during chronic disease; beta globulin increased during acute infection
but remained unchanged in chronic disease and gamma globulin
increased during both acute and chronic diseases. Generally, these
authors found that serum proteins were inversely proportional to the
trypanosome counts. It was also demonstrated that total protein
concentration increased above normal values in camels naturally and
experimentally infected with T.evansi (Boid et al., 1980a). Albumin in

16
both cases decreased to below normal, alpha globulins remained
unchanged and beta globulin levels were unchanged in experimental
camels but decreased in natural infections. Immunoglobulin M (IgM)
showed significant increase o f about 5 times the pre-infection levels,
while IgG did not show any significant changes. In buffaloes, the total
serum proteins did not increase as in camel infections, but beta and
gamma globulins increased and albumin and alpha globulins decreased
(Verma and Gautam, 1978).
Blood glucose level has been shown to decrease to below normal
level in camels infected with T.evansi (Raisinghani et al., 1981b). The
fall in blood glucose level was inversely proportional to the parasitaemia.
However, Jatkar and Singh (1974) found increasing blood glucose levels
in camels infected with T.evansi.
Biochemical profiles have also been studied by various authors.
Dwivedi et al. (1977) found that dogs infected with T.evansi showed no
changes in serum glutamic oxaloacetic transaminase (SGOT) and there
was a slight rise in serum glutamic pyruvic transaminase (SGPT)
between the 6th and the 13th day of infection. Boid et al. (1980b)
showed increase in the levels o f sorbitol dehydrogenase (SDH), SGOT and
SGPT above the pre-infection levels in camels infected with T.evansi,
whereas alkaline phosphatase (AP) decreased during the period of patent
parasitaemia. The levels o f all enzymes returned to normal after
treatment with quinapyramine sulphate.
Urine of camels affected with chronic trypanosomiasis is dark-
brown with a very strong typical pungent odour and has small amounts
of urinary ketones and urine proteins (Hunter, 1986). The smell of
urine of infected animals has a diagnostic bearing and is easily
17
recognized by most camel owners.
2.3.2.2. Gross Pathology.
There are no absolute typical pathological changes in camels dying
of T.evansi infection at postmortem. Anaemia is often visible with
skeletal and heart muscles becoming pale. There are signs o f
dehydration, pericardial effusion, enlarged lymph nodes and
splenomegally (Rottcher et al., 1987).
2.3.2.3. Histopathology.
The recorded histological changes were o f the brain o f a horse
that died of T.evansi infection. Sections o f the cerebrum had
encephalomalacia. Many gitter cells engulfing both fat and hemosiderin,
grey matter had neuronal degeneration and neuronophagia and glial cells
were abundant. The other organs were characteristic o f a chronic
debilitating disease (Ilemobade, 1971).
2.4. Diagnosis
The necessity o f a rapid and accurate diagnosis is o f supreme
importance in any clinical condition. In the field the rapidity and
accuracy o f any one technique or a combination of techniques is vital if
suitable treatment of any individual infected animal is to be effective or
if chemotherapeutic control o f a selected group of animals is to be
attempted (Molyneux, 1975). Provisional diagnosis of camel surra can be
made from the characteristic clinical symptoms manifested by this
disease Le emaciation and anaemia. However, these signs are not
pathognomonic for this disease.

18
a) Parasitological Diagnosis.
The best way for diagnosis of a parasitic infection is by finding
the parasite itself by the standard parasitological methods available.
The parasitological diagnosis o f acute camel trypanosomiasis is usually
relatively easy since the organisms are readily demonstrable in freshly
stained blood smears. Diagnosis in chronic infections may present
difficulties because parasitaemia is low (Gatt-Rutter, 1967; Killick-
Kendrick, 1968) and intermittent (Mahmoud and Gray, 1980). The
standard parasitological techniques available for diagnosis o f camel
trypanosomiasis include:
i) Microscopic examination of a wet preparation o f fresh blood is
used to detect motile trypanosomes. Alternatively, Giemsa stained thin
blood smears can be used to identify parasites on the basis o f their
morphology. Examination o f wet films is quick and the method is
suitable for screening large numbers of animals. This method, however,
has limitations in that very low-grade infections are impossible to detect
and is insensitive in that more than half of the infections may be missed
(Barnett, 1947). Searching thin films is an inefficient means of
diagnosing surra infections and its use is best restricted to
identification of trypanosomes. Examination o f thick blood smears has
been shown to be a more efficient way of detecting infection than both
thin and wet preparations (Killick-Kendrick and Godfrey, 1963).
ii) Concentration techniques have been used to improve on the
sensitivity o f direct microscopy. The most recent is the haematocrit
centrifugation technique, HCT, (Woo, 1969). This is the most rapid and
reliable method for detection of low parasitaemia and the determination
of the number of trypanosomes in a given volume o f blood.

19
Microhaematocrit centrifuge technique (MHCT) is particularly useful in
that trypanosomes in the blood of camels can be detected 6 to 10 days
earlier than by wet or thick blood films, the status o f anaemia in the
test animals can be assessed at the same time and the technique can be
carried out in the field using a battery powered minicentrifuge (Kelly
and Schillinger 1983). Miniature anion exchange chromatography
technique (MAECT) (Lumsden et al., 1979) is a concentration technique
used widely to diagnose T. gambiense infections in man but is yet to be
established as a routine test for diagnosis of animal trypanosomiasis due
to its more cumbersome procedure (Nantulya, 1990).
iii) Sub-inoculation o f susceptible animals with blood from
suspected animals can also be used for parasitological diagnosis. Animal
inoculation reveals many subpatent infections o f T. evansi in camels
(Godfrey and Killick-Kendrick, 1962). Rats or mice are commonly used
because they are cheaper and more easily transported in the field. This
technique is more sensitive than direct microscopic examination o f the
blood sample or the MHCT (Pegram and Scott, 1976). However, situations
have been reported where MHCT gave better results than mouse
inoculation (Otsyula et al., 1992). The advantage of this method is that
the trypanosome isolates in the rodents can be used later for studies in
the laboratory. However, the method is not a useful one for diagnosis
due to long prepatent periods in the commonly used laboratory rodents
(i.e. diagnosis is not immediate) and also the cost of maintaining the
rodents in the laboratory makes the method prohibitively expensive for
routine diagnosis. This method is best used for epidemiological studies
(Nantulya, 1990).
20
Thus, in the standard parasitological diagnostic methods a high
proportion o f infections still go undetected as the majority o f infections
are chronic or often aparasitaemic.
b) Serological Diagnosis.
Earlier serological tests, such as mercuric chloride test, formol gel
test and thymol turbidity test (Knowles, 1924; Bennett and Kenny, 1928)
previously used to detect trypanosomes in camels, relied on increases in
the levels o f euglobulins in the infected animals. These methods were
not specific for trypanosomiasis and were unreliable for accurate
diagnosis of this disease (Horgan and Bennett, 1929; Pegram and Scott,
1976). Serological tests were later developed to detect trypanosome-
specific antibodies in camel serum. Enzyme-linked immunosorbent assay,
(ELISA), indirect fluorescent antibody test, (IFAT), capillary
agglutination test, (CAT) and passive haemaglutination test (PHT) have
all been used as diagnostic tests for camel surra (Jatkar and Singh
1971; Jatkar et al., 1977; Luckins et al., 1979; Olaho-Mukani, 1981).
None of these tests however, differentiate between past and present
infections owing to the persistence of antibodies for up to 100 days or
more after chemotherapy has cleared trypanosomes from the bloodstream
or following self cure (Luckins et al., 1978, 1979; Nantulya et al., 1989a).
A positive antibody result may indicate current infection or infection
within previous several months. Chemotherapeutic intervention relying
on positive antibody results may end up being wasteful especially when
treating animals with cleared infections. Detection of anti-trypanosomal
antibody levels is more useful as an epidemiological tool rather than a
diagnostic test (Nantulya, 1990).
21
The most recent method for serological diagnosis of camel
trypanosomiasis is the detection of the presence of trypanosomal
antigens in circulation (Rae and Luckins, 1984; Nantulya et al., 1989a;
Olaho-Mukani et al., 1992a). This test detects actively infected animals
because the antigens detected are products o f parasite degradation.
Thus, the demonstration of trypanosomal antigens in the blood o f the
infected animal would be synonymous with parasitological diagnosis
(Voller and De Savigny, 1981) and hence an indicator o f current
infection. Applied to the diagnosis of T. evansi infections in camels in
an endemic area, the test was able to detect circulating antigens in 92%
of the animals with parasitologically confirmed diagnosis (Nantulya et al.,
1989b). The test also detected antigens in 55% of the animals in the
same herd which had been missed by parasite detection techniques.
Camels from trypanosomiasis free areas tested negative on this test,
demonstrating that the test has a high specificity. Even though this
test could not detect 6-15% cases with proven trypanosome infection
parasitologically, it is the only potentially suitable serological diagnostic
test for individual animal diagnosis in the field (Nantulya et al., 1989b).
This test has potential for adoption in the field for immunodiagnosis of
camel trypanosomiasis (Nantulya et al., 1989b). Antigen-trapping assays
are easy to perform; the results can be read visually; large numbers of
serum specimens can be analyzed at a time; they can be applied to the
diagnosis o f individual animals and they are more sensitive than the
techniques for parasitological diagnosis (Nantulya, 1990). Antigen assays
are also suitable for assessing therapeutic success (Olaho-Mukani et al.,
1992b).
22
2.5. Treatment
a) Naphthylamine drugs
Two drugs recommended for treatment o f T. evansi infections in
the dromedaries are suramin and quinapyramine sulphate (Balis and
Richard, 1977; Rottcher et al., 1987). In the naphthylamine group there
is only one compound, Suramin, which is used as a curative agent for
T.evansL Suramin (Naganol, Antrypol, Bayer 205) introduced in the
1920’s, was a major advance in chemotherapy o f trypanosomiases. In
camels, single doses o f lOg in aqueous solutions injected intravenously,
cured nearly every infected case (Alongi and Balboni 1935). It was
reported that 100% cure was obtained with 5g suramin in a single
intravenous injection in camels, but reduced doses caused drug
resistance in which renewed treatment with the same drug at even
higher dosages had no effect. Suramin resistant trypanosome population
has been reported by several authors after administration of sub-
curative doses. Resistant stocks of T. evansi to suramin have been
reported in Sudan, Kenya and Russia (Gill, 1971; Mahmoud and Osman,
1979; Luckins et al., 1979; Schillinger et al., 1984). T. evansi stocks
resistant to suramin were found susceptible to quinapyramine (Leach,
1961). Accidental paravenous injection of this drug has been shown to
cause thrombophlebitis at the site of injection (Schillinger et al., 1984).
Manufacture of this drug has been discontinued recently.
b) Quinaldine group
Among the quinaldine group, quinapyramine sulphate was shown to
have a wide range of action against most trypanosomes o f subgenus
Trypanozoon in all animal species (Davey, 1950). It gave protection to
23
camels for up to 3 months when administered at a dose rate o f 5mg/kg
subcutaneously. A mixture o f quinapyramine sulphate (3 parts) and
quinapyramine chloride (2 parts) (Prosalt) when administered at a dose
of 7.4mg/kg subcutaneously gives a prophylactic cover lasting 3-4
months. Severe quinapyramine overdose causes salivation, muscle
tremors, stiffness and collapse while moderate overdose causes
nephrotoxicity (Davey, 1957). There is an indication of discontinuation
of both quinapyramine sulphate and Prosalt in the near future (Jeffries,
Rhone Merieux, personal communication). T. evansi strains with dual
resistance to suramin and quinapyramine exist nowadays (Mahmoud and
Osman, 1979; Schillinger et al., 1984).
c) Phenanthridine group
In the phenanthridine group of drugs, isometamidium (SamorinR,
May and Baker) is a drug that is effective against trypanosomes in
various animal species (Arowolo and Ikede, 1977; Toro et al., 1983).
According to Balis and Richard (1977), samorin given at 0.5mg/kg body
weight (b.w.) was well tolerated and effective in camels naturally
infected with T. evansi and no evidence of trypanosomiasis was found 8
weeks after treatment. However, recent work has shown that
therapeutic effectiveness o f this drug is transient with relapses
occurring within three weeks after treatment (Ali et al., 1985). Thus,
Samorin has only a moderate effect against T. evansi. Intravenous or
intramuscular administration o f Samorin produces adverse toxic signs
such as trembling, lacrimation, salivation, restlessness and defaecation
followed by profuse diarrhoea and urination (Schillinger et al., 1985; Ali
et al., 1985). This drug is recommended for use in camels only as an
24
emergency measure where dual resistance against suramin and
quinapyramine exist (Rottcher et al., 1987). According to Schillinger et
al. (1982) isometamidium has minimal effect against T. evansi in East
African camels.
The other trypanocides in this group o f drugs that are used for
treatment o f tsetse-transmitted trypanosomes (e.g. Homidium and
Pyrithidium bromide) are not effective against T.evansi treatment
(Srivastava and Ahluwalia, 1973).
d) Aromatic arsenicals
Arsenicals, alone or in combination or in combination with other
compounds e.g. antimonials, were the first drugs to be used against
camel trypanosomiasis but had the disadvantage of having a narrow
safety margin (Gatt-Rutter, 1967). Gill and Sen (1971) found that
melarsen oxide and diminazene were fully curative to equines infected
with T. evansi. Melarsoprol (Mel B), another arsenical, is said to be
effective against suramin and quinapyramine resistant stocks of
T.evansi. Clinical trials with melarsoprol in camels, given at doses of
3.5mg/kg b.w., showed encouraging results (Rottcher et al., 1987).
Cymelarsan* (Rhone Merieux), a new arsenical compound patented in
1985, has not been used commercially for treatment o f animal
trypanosomiasis but trials with camels naturally and artificially infected
with T.evansi have shown that this drug is active against camel surra.
The drug acts rapidly as parasites disappear from the bloodstream
within 24 hours after injection (Zellecke et al., 1989; Otsyula et al., 1992;
Nyang’ao et al., 1992). Cymelarsan has been shown to be fully effective
against T.evansi strains resistant to suramin and quinapyramine

25
(Raynaud et a l 1989). Studies on naturally infected camels have shown
that the drug is effective at the recommended therapeutic dose of
0.25mg/kg (Nyang’ao et al., 1992). This drug has an added advantage in
that it crosses from the peripheral circulation into the central nervous
system, especially in the cerebro-spinal fluid (CSF) to clear T.evansi
parasites which have been shown to invade this compartment (Leese
1927; Horchner et al., 1983).
e) Other drugs
Berenil, an aromatic diamidine, has been found to be too toxic for
camels (Fazil, 1977; Homeida et al., 1981) for camels.
2.6 Control
Trypanosoma evansi is harboured by animal reservoirs and spread
mechanically by insect vectors. Its eradication is nearly impossible
because of the difficultly in eliminating these two important factors
(Gatt-Rutter, 1967). For vector control to be effective, a thorough
understanding of the vector’s biology is essential in order to identify
possible areas for intervention. The tsetse fly ’s biology is well
understood and strides in its control have been made (Jordan, 1986),
unlike for the other biting flies. Control measures of surra that have
been tried are early diagnosis and treatment. To reach the diagnosis,
accurate diagnostic tests are needed (Mahmoud and Gray, 1980). Once
confirmed, the infected animals should be segregated immediately and
treated. Other methods that have been tried are slaughter, especially
animals found infected that are old, emaciated or unsound, and thus not
26
worth treating. Then proper and effective disposal o f infected
carcasses should be ensured. Regular veterinary examination o f all
camels and correct treatment of those which are trypanosome-positive
are the most important measures to reduce new infections. Sheep and
goats which are very often kept close to camels act as asymptomatic
carriers of T. evansi from which transmission to camels occurs. A
knowledge o f fly seasons and the distribution o f biting flies especially
tabanids is essential to protect the camels from these biting flies
(Higgins, 1983). During the fly season, fly zones should be avoided,
although this is practically difficult. This however, is often impossible
and steps have to be taken in some instances to prevent flies from
biting camels e.g by the use o f repellents (Gatt-Rutter, 1967). Tabanid
challenge in sedentary camel herds can be reduced by trapping large
numbers o f flies using traps (Molyneux and Ashford, 1983).
Chemoprophylaxis, using a quinapyramine-suramin combination gives
ponies full protection for 6.5 to 23 months against T. evansi depending
on the dose and the intensity of the infection. Recently, isometamidium
chloride has been shown to provide prophylaxis at a dose o f 0.5 to
l.Omg/kg body weight for 2 to 4 months in several species o f livestock
including camels when given by deep intramuscular injection. Treatment
of animals at the end of tropical rain season seems to give good
protection to camels living in or crossing endemic areas (Higgins, 1983).
Quinapyramine sulphate and chloride at the ratios 3:2 (Prosalt) has been
used for protecting camels. Production of a vaccine is still remote due
to the problem of antigenic variation. The only suitable methods of
control of camel trypanosomiasis, currently, is surveillance and
chemotherapy, and chemoprophylaxis. Since control of T.evansi is mainly
27
by chemotherapy, there is need for a drug that is fully effective
against all strains o f the parasite. Cymelarsan has shown promising
results in field trials (Zellecke et al., 1989; Otsyula et ah, 1992).
Further studies should be carried out on this drug under laboratory
conditions to evaluate its efficacy for large scale use.
28
CHAPTER THREE
MATERIALS AND METHQUS
3.1 Experimental camels
Twelve young Somali-type camels aged between 2V 2 and 4 years,
were used in this study. They were obtained from the Kenya
Trypanosomiasis Institute (KETRI) herd at Athi River. Each camel was
numbered and assigned an information sheet on which all relevant
information was recorded. These included an ear-tag number, sex, date
of birth, sampling dates, samples taken and results. Body weights were
estimated using the method described by Schwartz et al. (1983) i.e. body
weight of a camel (in kilograms) is the product of 50, the shoulder
height (SH, in meters), the thoracic girth (TG in meters) and the
abdominal girth (AG in meters). Fecal examination was done using the
modified McMaster technique (Anon, 1979) to determine their worm load.
All the animals were thereafter dewormed using Valbazen® (Kenya-Swiss)
at a dose of 7.5mg/kg body weight. Fecal examination of these camels
was also done at the start, in the middle and at the end of the
experiment and found negative. The camels were then sprayed with an
acaricide (Triatix®, COOPER) to clear all the ectoparasites. The animals
were screened for any trypanosome infection using mouse inoculation
(MI) and buffy coat examination (BCE), and antibody and antigen-
detection enzyme-linked immunosorbent assay (ELISA). Screening was
done three times. All the camels were negative for T.evansi and other
tsetse-borne trypanosomes. Thus the camels were all healthy at the
start o f the experiment. The animals were housed in fly-proof stables
at KETRI-Muguga and fed with hay; water was provided ad libitum.

29
Supplementation with mineral salt and ranch cubes was done three times
a week. The animals were randomly divided into three groups. Group A
had five camels numbered 149, 155, 156, 159 and 161; group B had five
camels (numbers 147, 151, 160, 162 and 261) and groups C had two
camels numbered 150 and 163. Pre-infection parameters were established
for a period o f four weeks. Thereafter, group A animals were infected
by intravenous inoculation with 2 x 10⁷ trypanosomes of a clone of
T.evansi isolate KETRI 2468 suspended in 6ml phosphate saline glucose
buffer (PSG). This inoculum was within the range of trypanosome
concentration used by previous workers (Boid et al., 1980a; Raisinghani
et aL, 1980a; Ali et al., 1985). The infection was allowed to run
throughout the study period. Group B camels were infected with the
same isolate and inoculum dose as for group A, but were treated with
CymelarsanR at the recommended therapeutic dose of 0.25mg/kg body
weight intramuscularly after the onset o f the clinical disease i.e. during
the first peak of parasitaemia. Group C camels were used as non-
inf ected controls.
3.2. T ry panosomes
3.2.1. Stabilate History
Whole blood from a camel naturally infected with trypanosomes at
Kulal, Marsabit was inoculated into two Swiss-white mice. At peak
parasitaemia the mice were bled by cardiac puncture and blood mixed
with EDTA saline glucose (ESG) pH 8.0. Thereafter, the trypanosome
preparation was mixed in equal volume of 20% glycerol. This primary
isolate was dispensed into capillary tubes, sealed with plastoceal and
cryopreserved in liquid nitrogen at -196°C, in KETRI’s trypanosome

30
bank. This isolate was later characterized by starch gel isoenzyme
electrophoresis (Gibson et al., 1983) and kinetoplast DNA analysis and
identified as T.evansi and stabilated as KETRI 2468. This bank stabilate
was used for cloning as described below (3.2.2).
3.2.2. Clone Preparation
Clones were obtained by the microscopic isolation o f a single
trypanosome which was allowed to multiply in mice as described by
Otieno and Darji (1985). Briefly, stabilate KETRI 2468 was used to infect
Swiss-white mice. Blood from a heavily parasitaemic mouse was diluted
in phosphate saline glucose buffer (PSG), pH 8.0, and serially diluted to
give a concentration o f approximately 103 trypanosomes per milliliter.
Several microdroplets o f this diluent were then placed on a cover slip
and quickly put into a moistened siliconised grooved microscope slide.
The droplets were viewed under a microscope at xl60 magnification.
Only a microdroplet that had a diameter smaller than the microscope
field were examined. A microdroplet containing a single organism
(confirmed by a second person) was flooded with PSG buffer, sucked
into a 1ml syringe and injected intraperitoneally into a let hall y
irradiated Swiss-white mouse using a 25G needle. The mouse was
monitored daily for parasitaemia and at peak parasitaemia it was
anaesthetised with diethyl ether and bled by cardiac puncture. Blood
was collected using a 1ml syringe containing EDTA. The trypanosomes
were separated from blood using DEAE-52 column as described by
Lanham and Godfrey (1970). Briefly, a standard column (9cm diameter
by 6cm) was packed with DEAE-52 equilibrated with PSG buffer pH 8.0.
Blood from mice at peak parasitaemia was diluted 6:4 with PSG and

31
applied onto the DEAE-52 column. Trypanosomes were eluted with the
same buffer. Using the same buffer, the trypanosomes were washed
twice by centrifugation at 1,500 x g. From this trypanosome suspension,
several Wistar rats were inoculated intraperitoneally, each rat getting 1
x 10®. The rats were sacrificed at peak parasitaemia and blood collected
into a 10ml syringe containing EDTA and PSG. Trypanosomes were
separated on a DEAE-52 column equilibrated with PSG buffer as
described above. Thereafter, the trypanosome elute was centrifuged in
a 10ml plastic tube (Sterilin, U.K.) for 5 minutes at 1,500 x g, 4°C in an
MSE Chilspin bench centrifuge (Fisons, England). The supernatant was
discarded and the resulting trypanosome pellet washed three times in
PSG, pH 8.0, by centrifugation as above. The final pellet was suspended
in 10ml PSG and trypanosomes counted using a haemocytometer. Each
camel in groups A and B was inoculated with 2 x 10⁷ trypanosomes by
intravenous injection.
3.3. sampling frequency
Pre-infection baseline data was established for four weeks in all
the three groups of camels at weekly intervals. Blood was collected
aseptically by venipuncture o f the jugular vein using an 18 x IV 2"
gauge needle. From each camel 5ml of blood was collected into a bijou
bottle containing 5% EDTA for haematology, 15 ml was collected into a
universal bottle for serology, and 5 ml into a heparinized VacutainerR
(Becton Dickinson) for biochemistry. Blood for haematology and serology
was collected once per week throughout the study period and that for
biochemistry once every two weeks. In addition, 1ml of blood was
collected daily from all camels for monitoring parasitaemia by BCE and
32
MI. After treatment blood from group B camels was also collected daily
and examined using the same techniques, to determine the time to
disappearance o f trypanosomes.
3.4. Samples
3.4.1. Up clotted Blood Samples
A blood sample for haematological analysis was preserved in EDTA
at a concentration of 0.05ml o f 10% solution per 5ml o f blood. Bijou
bottles containing EDTA blood were shaken gently to allow thorough
mixing of the blood with the anticoagulant. Haematological analysis was
carried out on the same day.
Blood for biochemical assays was collected into heparinized
vacutainers and separated immediately by centrifugation at 3000 x g.
Plasma was collected and used for analysis either immediately or was
stored at -20°C until analyzed.
3.4.2. serum Samples
Blood collected for serology was allowed to stand in universal
bottles for three to four hours at room temperature and at +4°C
overnight before serum was separated by centrifugation at 3,000 x g for
15 minutes. The serum samples for serology were stored in a pair of
bijou bottles at -20°C in a large serum bank until analyzed.
3.5. Laboratory Procedures
3.5.1. Packed cell volume (PCV) determination
Packed cell volume was determined using EDTA-blood soon after
bleeding. After thorough gentle mixing, non-heparinized capillaries

33
(Hawksley, England) were filled with this blood and sealed with
plastoceal (Hawksley, England). These tubes were then spun in a
microhaematocrit centrifuge (Hawksley, England) for 5 minutes at 1,500 x
g. The tubes were then placed in a haematocrit reader (Hawksley,
England) and the PCV readings taken. All PVC readings were expressed
in percentages.
3.5.2. Buffy coat examination
Buffy coat examination (BCE) was carried out as described by Woo
(1969). Briefly, after the PCV’s were determined, the capillary tubes
were cut between the buffy coat and red blood cell-junction using a
diamond pen cutter. The buffy coat was applied onto a glass microscope
slide and covered with a 22 x 22mm glass cover slip. Thereafter, the
buffy coat smears were examined using a Zeiss microscope at a
magnification of x 250 and an 11/7 condenser. At least five fields were
examined and the average concentration of trypanosomes per ml scored
as reported by Murray et al. (1977). Daily parasitaemia levels (i.e.
number of trypanosomes per field) were determined throughout the
study period.
3.5.3. RBC. WBC and Hb determination
The red blood cell (RBC) and white blood cell (WBC) counts were
determined using an electronic coulter counter model ZBI, (Coulter
Electronics Inc., Hialeah, Florida). The haemoglobin (Hb) concentration
was determined using a haemoglobinometer (Coulter Electronics Tnc.,
Hialeah, Florida).

34
3.5.4. Differential Leucocyte Count
Thin blood smears were made from the EDTA-blood soon after
bleeding on a pair o f pre-cleaned blood slides for each camel. The
slides were then air dried, fixed with double-distilled methanol, stained
using 10% Giemsa and kept until they were examined by microscopy.
3.5.5. Biochemical Analysis
Biochemical analysis was carried out using VETTEST® 8008-Auto
Analyzer (Sanofi Animal Health Ltd, England). The following assays were
carried out, alkaline phosphatase (AP), alanine aminotransferase (ALT),
aspartate aminotransferase (AST), lactic dehydrogenase (LDH), creatine
kinase (CK), blood urea nitrogen (BUN), albumin (ALB), globulins (GLB)
and total proteins (TP). Samples analyzed included those from camels
bled before infection, during the course of infection and after treatment.
3.5.6. Serological Techniques
Enzyme-linked immunosorbent assays for detecting circulating
antigens (Ag-ELISA) and circulating antibodies (Ab-ELISA) were
employed.
3.5.6.1 Reagents for enzyme-linked immunosorbent assay
a). Preparation of trvpanosomal antigen for Ab-ELISA.
Ten donor mice were infected with T. evansi isolate KETRI 2531
(isolated from a camel on Galana Ranch) each mouse getting 1 x 10⁶
trypanosomes. When parasitaemia was in log phase (about 1 x 10⁷
trypanosomes per ml o f blood) the mice were killed and blood collected
by cardiac puncture. Trypanosomes were separated from the blood

35
using a diethylaminoethyl cellulose anion exchange chromatography
column (DEAE-52, Whatman) as described by Lanham and Godfrey (1970).
The trypanosome suspension was centrifuged at 3,200 g for 15 minutes,
the supernate discarded and the resulting pellet washed three times in
phosphate buffered saline glucose (PSG), pH 8, by centrifugation at
3,200 x g for 15 minutes. The trypanosomes were re-suspended to 1.0ml
in PSG. This was used to infect 50 rats, each getting a 1ml suspension
of 1 x 10s trypanosomes by intraperitoneal injection. The trypanosomes
were harvested from the rat blood at fulminating parasitaemia, separated
and washed as above. Thereafter, they were sonicated at maximum
amplitude for about 60 seconds, three times with cooling in between on
ice using an MSE ultrasonic Disintegrator (Safam Electrical Instrument
Co. Ltd., England). The lysate was centrifuged at 10,000 x g for 30
minutes at +4°C. and the protein content of the supernatant determined
by Bio-rad protein assay. Briefly, the dye reagent concentrate was
diluted 1:4 (v/v) with deionized water and filtered. A standard protein,
bovine serum albumin (BSA) of known concentration (70mg/dl) was
prepared. Five milliliters of the diluted dye was dispensed into test
tubes and 0.1ml of the standard BSA and the unknown protein fractions
added to the diluted dye. These were mixed gently and 100pl of each
dispensed per well of a micro-titre ELISA plate (NUNC®, USA). The
concentration of the proteins was measured using a micro-ELISA Auto
Reader (MR 580) at 595nm wavelength. The protein concentration in the
supernatant was then calculated using the formula:
36
Concentration o f
unknown protein = OD of unknown sample x cone, o f known
(mg/ml) sample
OD of known sample.
The optimal concentration o f the trypanosomal antigen supernatant
was determined using a checkerboard titration. These samples were
stored in liquid nitrogen at -196°C. and later used in antibody-ELISA
(Ab-ELISA).
b). Preparation Of Trypanosomal Antigens.For Raising
Polyclonal Rabbit Anti-T. evansi Immune Serum
Ten rats were infected with the same isolate KETRI 2531 at 1 x 10⁶
trypanosomes per rat and the trypanosomes harvested as described in
3.5.6.1 (a) above. The final trypanosome pellet was mixed with a lysing
and protein stabilizing solution (containing 2mM amino carproic acid, 2mM
EDTA, 2mM diethiothreitol). Thereafter, the trypanosomal lysate was
centrifuged at 12,000 x g (using an MSE Chilspin) bench centrifuge
(Fisons, England). The supernatant was then dialysed overnight in
0.01M PBS, pH 8.0. The protein concentration was determined using Bio-
rad protein assay as in 3.5.6.1 (a). This antigen was stored in liquid
nitrogen at -196°C and later used to raise rabbit anti-T.evansi (RATE)
hyper-immune serum as described in (c) below.

37
c). Preparation, purification and conjugation o f Rabbit
anti-T, evansi IeG (RATE/IeG)
Two New Zealand white rabbits were inoculated with the lysate
antigens (from (b ) above) using the method described by Thalhamer and
Freund (1984). Briefly, 2mg of soluble trypanosome proteins were
injected subcutaneously at day 0 and intramuscularly at day 7 and day
21. At day 22, 5mg of the lysate antigens was administered by
subcutaneous injection, and at day 23 by intravenous injection. The
first dose was administered with Freud’s complete adjuvant (Sigma,
USA), subsequent injections were administered in 140 mM sodium
chloride. Antiserum was collected 10 to 14 days after the last injection.
The Ouchterlony double immuno-diffusion technique (DID) (1964) was
employed to determine the antibody response and the specificity of the
antibody in the rabbit serum. A standard template for gel double
diffusion (GDD) was used to punch wells in agarose, (Merck, WG) in
0.01 M PBS, pH 7.2 (1% w/v), containing sodium azide. The wells were
then filled with antigen (in the central well) and serum (in the
peripheral wells), the slides placed in a storage box on a dampened
filter paper and left to develop over-night. The gel reactions were read
after 24 hours and the serum with the highest antibody titre (up to
1/64 dilution) used.
Purification of RATE-IgG from the antisera was done by salt
fractionation. The antisera were precipitated with saturated ammonium
sulphate solution (SAS, 100%), reconstituted in 0.01M PBS (pH 7.5) and
then extensively dialysed against the same buffer. The IgG was then
applied on a DEAE-52 column equilibrated with 0.01 M phosphate buffer
pH 7.5. Fractions of IgG (5ml) were collected into test tubes and the
38
protein concentration o f each fraction determined using the standard
Bio-rad protein assay. The IgG rich protein tubes were pooled into a
dialysis tubing and further concentrated using polyethylene glycol (MW
2000) for 8 hours. Finally the protein concentration of the final volume
of the immunoglobulin fraction was determined using the Bio-rad protein
assay as described earlier.
The immunoglobulin (RATE/IgG) purified above was then
conjugated with horseradish peroxidase (Sigma, Type VI) following the
method of Nakane and Kawaoi (1974) as modified by Henning and Nielsen
(1987).
d) Preparation of Camel leG and rabbit-anti-camel IeG
Camel serum (50 ml) was warmed to 25°C and purification of the
IgG from the serum done by salt fractionation using saturated
ammonium sulphate solution as described in 3.5.6.1 (c) above.
The IgG obtained was used to immunize two New-Zealand white
rabbits to produce rabbit anti-camel IgG. The rabbits were immunized
with 2mg of camel IgG in Freud’s complete adjuvant by subcutaneous
injection into eight sites on the rabbits’ back. Boosting was done on
days 21 and 35 with the same dose of camel IgG in Freud’s incomplete
adjuvant intramuscularly. Serum was collected 10 days after the last
boost. Rabbit anti-camel IgG was prepared and conjugated as in 3.5.6.1
(c) above.
3.5.6.2. Antifien -ELISA Technique
The assay system used was based on the double antibody-
sandwich assay described by Bidwell and Voller (1981) as modified by
39
Olaho-Mukani et al. (1992a). Briefly, Dynatech raicrotitre plates
(IMMULON®, U.S.A) were presensitized with 1% glutaraldehyde at room
temperature for one hour and then rinsed three times with distilled
water. The plates were then coated with lOOpl/well of polyclonal anti-
T.evansi (RATE) immunoglobulin at a concentration of 10pg/ml in
carbonate/bicarbonate buffer, pH 9.6, and incubated at +4°C overnight.
Thereafter, the plates were washed three times (5 minutes per wash)
with 0.01M PBS Tween-20, pH 7.4, and blocked with 1% bovine serum
albumin (BSA) Tween-20 buffer and incubated for 30 minutes at 37°C.
Test and control sera were added to each well (lOOpl/well) in the
dilution 1/4 (previously determined using a checkerboard titration)
followed by incubation for 30 minutes at 37°C. The plates were washed
again as above and lOOyl/well of rabbit anti -T.evansi peroxidase
conjugate (from 3.5.6.1 (d )) added and the plates incubated and washed
as before. Tetramethyl-benzidine (TMB, Sigma) substrate was added and
the plates incubated for 15 minutes at 37°C. The reaction was stopped
by adding 50pl/well of 2M sulphuric acid (H2SO4) and the optical density
(OD) values determined at 450nm using a Dynatech micro-ELISA plate
reader (MR 580, DYNATECH, U.S.A.). The cut-off OD point for a positive
Ag-ELISA was calculated as: mean OD of control animals mean x 2 ± 1
SD.
3.5 .6 .3 . AnUhpdy-ELISA Technique
Dynatech micro-titre plates (USA) were coated with an optimal
concentration of soluble trypanosomal antigen in lOOpl/well of carbonate
buffer, pH 9.6. The plates were incubated at 37°C for 3 hours, then at
+4°C overnight. The plates were washed three times (5 minutes/wash)
40
with 0.01M PBS Tween-20, pH 7.4. Subsequently, 100pl/well test and
control sera diluted at 1/400 in PBS-Tween-20 buffer containing 63mg/l
of gelatin was added and the plates incubated for 1 hour at 37°C. The
washing procedure was repeated and rabbit anti-camel IgG-peroxidase
conjugate diluted optimally at 1:500 in PBS Tween-20 was added at
lOOpl/well. The plates were again incubated at 37°C for 1 hour and
washed as before. The remaining stages of the test were as described
for Ag-ELISA.
Optical density reading o f 0.150 and above were considered
positive for the test, since none of the negative control sera gave an OD
reading greater than 0.145.
3.5.7. Mouse inoculation (MI)
0.5ml o f EDTA blood from each camel in groups A and B was
inoculated into a pair of Swiss-white mice intraperitoneally post-infection
daily for three weeks and thereafter once a week to the end o f the
study. Parasitaemia in the mice was monitored daily by microscopic
examination o f wet smears of blood from their tails. Once parasitaemia
was noted the mice were disposed off. The same procedure o f MI was
followed to monitor the time to disappearance o f parasites, in camels in
group B following treatment. Mice that were aparasitaemic were
monitored for a total of 60 days after which they were disposed of.
3.6. Clinical Examination
All the camels were examined daily and all the clinical signs
manifested recorded accordingly. Rectal temperature, body condition,
appetite and demeanor were noted and recorded daily at 9.00am. The

41
body weights were estimated weekly using the method o f Schwartz et al.
(1983).
3.7. Pathology
Post mortem examination was carried out on all camels that died
during the experiment. Samples for histopathology were taken from
most organs and processed using the standard procedures.y
3.8 Data Analysis
Analysis of the sequential data from each infected group was
compared to the data of the non-infected control camels. The difference
between the control group and either of the infected groups was
analyzed by the student’ s "t" test for unequal means (Snedecor and
Cochran, 1982). This design was employed in the analysis of the packed
cell volume (PCV), red blood cells count (RBC), haemoglobin concentration
(Hb), white blood cell count (WBC) and the biochemical values. For any
animal that died during the study, the last value in any variable was
used for the analysis. All graphs presented in this study were drawn
from the means of all the camels in a particular group.
42
CHAPTER FOUR
RESULTS.
4 .1. Clinical A ssessment
4.1.1. Clinical Signs
The first clinical signs observed in all the infected camels were
inappetance and dullness. These occurred, on the average, 7 days after
infection. The camels had enlarged superficial lymph nodes, the most
prominent ones being the inferior cervical (plate 1) and supramammary
lymph nodes. Excessive bilateral ocular discharge was observed in all
the camels in group A that were not treated (plate 2). All the infected
animals developed ventral oedema that started around the umbilical area
and spread anteriorly to the sternal pad (plate 3). Posteriorly, the
oedema extended to the preputial area in males (plate 4) and the udder
in females. Oedema of the feet was observed in only one camel in group
A that survived to the end o f the experiment. The animal had poor coat
quality. One of the camels in group A developed a skin condition
characterized by dandruff. These untreated animals lost weight and
became emaciated, characterized by sunken flanks, prominent ribs and
drooping hump (plate 5) when compared to the treated camels (group B)
and the controls (plate 6a and b). Two camels in group A that were
infected and not treated died 11 and 12 days, respectively, following
infection, while a third camel in the same group died three days before
the study was terminated. One camel in this group (C161) had low PCV
throughout the pre-infection period and was not used in the experiment.
Thus, there were only four camels in group A, of which only one
survived to the end of the study and was treated before being

43
discharged from the stables. Appetite and temperature returned to
normal after parasites disappeared from circulation.
Camels in group B showed the same clinical picture as group A.
These animals were treated during the first peak o f parasitaemia.
Recovery was rapid with the animals regaining their appetite one day
after treatment. All the camels in group B that were infected and
treated survived to the end of the experiment.
Other clinical signs observed in some o f the animals included
coarse tremors, unsteady gait and tendency to fall down, especially
those that developed fulminating parasitaemia by day 12. The camels
tended to lie down. Animal number C159 was recumbent five days
before it died (plate 7).

44
Plate 1: A camel infected with T. evansi showing an enlarged
in ferior cervical lymph node 3 weeks post-infection.

45
serous ocular discharge 3 weeks post-infection.
Plate 2: A camel in fected with T. evansi showing excessive

46
Plate 3: Ventral oedema extending anteriorly to the sternal pad in
a camel infected with T. evansi 4 to 6 weeks post-infection.
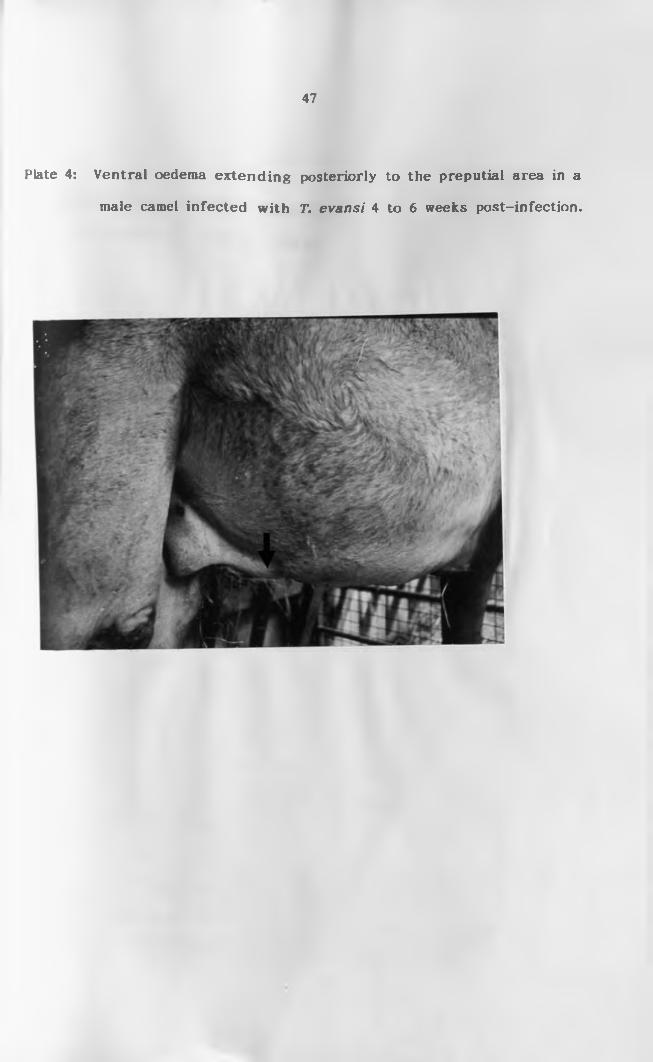
47
male camel infected with T. evansi 4 to 6 weeks post-infection.
Plate 4: Ventral oedema ex ten d in g posteriorly to the preputial area in a

48
end of the study (16 weeks).
Plate 5: Emaciated camel in th e untreated group (A ) at the

49
Plate 6(a): Infected and treated camel (Group B) at the end
of the study (16 weeks).
Plate 6(b): Control camel (non-infected) at the end of the
experiment (16 weeks).

50
A) a few days before death (16th week).
Plate 7: A recumbent camel in fected with T. evansi (group

51
4.1.2 Parasitaemia
All infected camels developed parasitaemia between days 4 and 7
after infection. The first fulminating peak of parasitaemia was observed
eleven days post infection in all camels. The highest level of
parasitaemia attained was +6 scored according to Murray et aJ. (1977).
Each camel attained this score at least once in the first 40 days post
infection (Table 1).
Two camels in group A (C149 and C156) died during the first peak
of parasitaemia. The other two camels in the same group developed
several relapsing peaks of parasitaemia (Fig. 1). The relapsing
parasitaemia in these animals was milder or scanty, thus not comparable
to the first peak. Camel C159 developed intermittent parasitaemia
throughout the study period and died shortly before the end of the
experiment. The intermittent parasitaemic peaks were accompanied by
increases in rectal temperature which were erratic but persistent. One
animal in this group survived to the end of the study and was treated
before being released from the stable. *
In group B the first fulminating parasitaemia was observed during
the same period as in group A. During this acute phase, the camels
were treated with Cymelarsan at a dose of 0.25rag/kg body weight by
deep intramuscular injection. No parasites were observed 24 hours after
treatment as monitored by BCE and MI (Fig. 2). These animals remained
negative for parasites throughout the study period when monitored
using BCE and MI.

52
Key
d = dead
6+ = Over 100 trypanosomes per microscopic field (x 250)
5+ = 10 to 100 trypanosomes per microscopic field (x 250)
4+ = 1 to 10 trypanosomes per microscopic field (x 250)
3+ = 1 trypanosome per microscopic field (x 250)
2+ = 1 to 10 trypanosomes per slide preparation
1+ = 1 trypanosome per slide preparation
0 = 0 trypanosome per slide preparation

53
__ __ Days Post infection
Table 1: Parasitaemia level using b u ffy coat examination (BCE)fo r the firs t 40 days o f infection.
ANIMALNo. 3 4 5 6 7 8 9 10 11 12 13 14 15 16 17 18 19 20
1 GRP A
149 0 0 0 0 3+ 5+ 6+ 6+ d
156 0 0 4 + 5+ 5+ 6+ 6+ d
155 0 4 + 5+ 6+ 0 0 0 0 0 0 0 4 + 6+ 5+ 0 0 0 0
159 0 0 0 1 + 2+ 4 + 5+ 0 0 3+ 3+ 5+ 5+ 3+ 0 5+ 5+ 6+
GRP B
147 0 0 1 + 4 + 0 0 0 2+ 3+ 5+ 6+ 0 0 0 0 0 0 0
151 0 0 0 0 4 + 5+ 5+ 6+ 5+ 6+ 6+ 0 0 0 0 0 0 0
160 0 0 0 0 4 + 5+ 5+ 5+ 6+ 6+ 6+ 0 0 0 0 0 0 0
162 0 0 0 2+ 4 + 5+ 5+ 6+ 5+ 6+ 6+ 0 0 0 0 0 0 0
261 0 0 0 2+ 3+ 5+ 5+ 6+ 6+ 6+ 6+ 0 0 0 0 0 0 0
: GRP A 21 22 23 24 25 26 27 28 30 31 32 33 34 35 36 37 38 39
149 d
156 d
155 0 0 4 + 5+ 4 + 0 0 0 0 0 0 0 1 + 0 0 0 0 0
159 6+ 0 0 0 0 0 0 1 + 0 0 0 1 + 0 0 0 0 0 0
GRP B
147 0 0 0 0 0 0 0 0 0 0 0 0 0 0 0 0 0 0
151 0 0 0 0 0 0 0 0 0 0 0 0 0 0 0 0 0 0
160 0 0 0 0 0 0 0 0 0 0 0 0 0 0 0 0 0 0
162 0 0 0 0 0 0 0-
0 0 0 0 0 0 0 0 0 0 0
261 0 0 0 0 0 0•
0 0 0 0 0 0 0 0 0 0 0
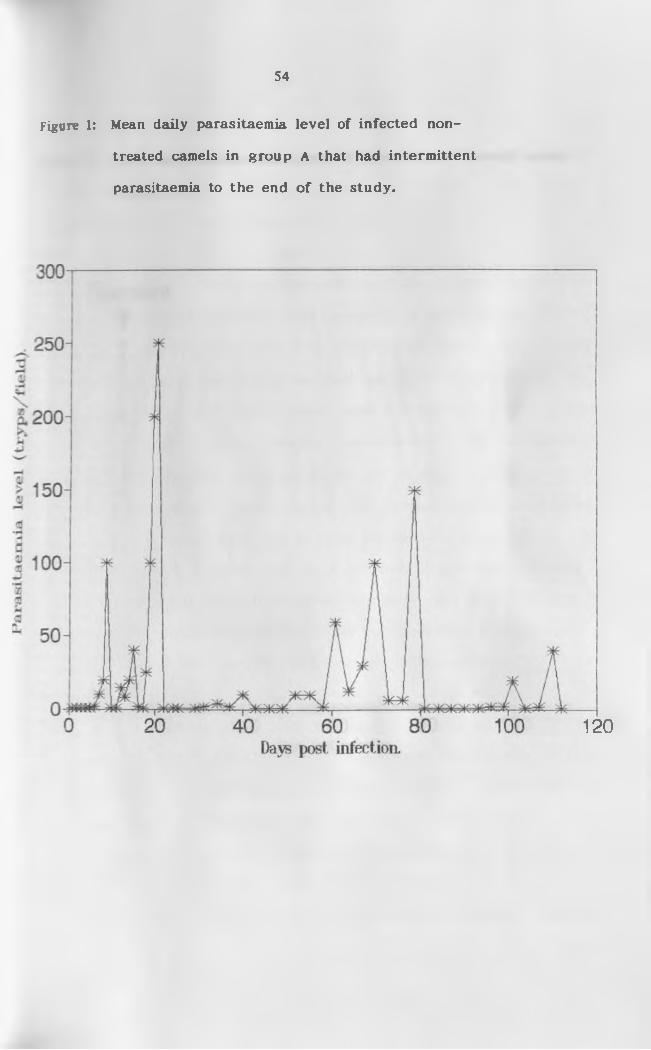
54
treated camels in group A that had intermittent
parasitaemia to the end o f the study.
Figure 1: Mean daily parasitaemia leve l o f in fected non-
120

Par
aait
aem
la
leve
l (t
ryp
a /
field
).
55
(Group B).
Figure 2: Mean daily parasitaemia leve l o f in fected and treated camels
56
The mean temperature of all the camels used in the study showed
no significant difference prior to infection (p > 0.05). The highest
temperature of the controls was 37.6°C (Appendix I), and in this study,
pyrexia was regarded to be present if a temperature o f 38.0°C and
above was recorded. The rectal temperature of the infected camels rose
from day six following infection. The temperatures were highest (39.6°C)
on day ten, coinciding with the first parasitaemic peak. Camels C149
and C156 in group A died during the first peak parasitaemia while their
temperatures were still high. Fever was recorded in other camels
coinciding with or following relapse parasitaemia. The temperature
elicited by the relapsing parasitaemia was not as high as that recorded
during the first peak. Camel number 159 (group A) that died after
several peaks of parasitaemia had a rectal temperature below 35°C a few
days before death. There was a statistically significant difference
between group A and the control (group C) camels (p < 0.05). Figures 3
and 4 show the rectal temperatures of the two groups of infected camels
as compared with the non-infected controls. Group B camels were
treated with Cymelarsan during the first peak of parasitaemia. The
rectal temperatures of these camels dropped from a mean 39.2°C to
37.3°C within two days after treatment. Thereafter, these camels showed
no temperature rise throughout the study period. There was no
statistically significant difference between group B and C camels. The
control camels had a stable temperature throughout the experimental
period ranging between 36.1°C and 37.4°C. Following infection and up
to the end of the experiment, there was significant difference between
group A camels and group B (p < 0.05).
4.1.3. Rectal temperature

57
camels (Group A)
Figure 3: Mean daily rectal temperatures in in fected non-treated
40-
39J
4*
35-
20 40 60 80Days post infection.
100 120
Infected Uninfected controls
Day 0= Mean of 28 days before infection

Te
mp
era
ture
(C
).
58
(Group B).
Figure 4: Mean daily rectal tem peratures in in fected and treated camels
12040 60 80Days pos t infection.
40"---------------------
Treatment3 9 ̂
100
■ae- Infected & treated —*— Uninfected controls
Day 0= Mean of 28 days before infection.
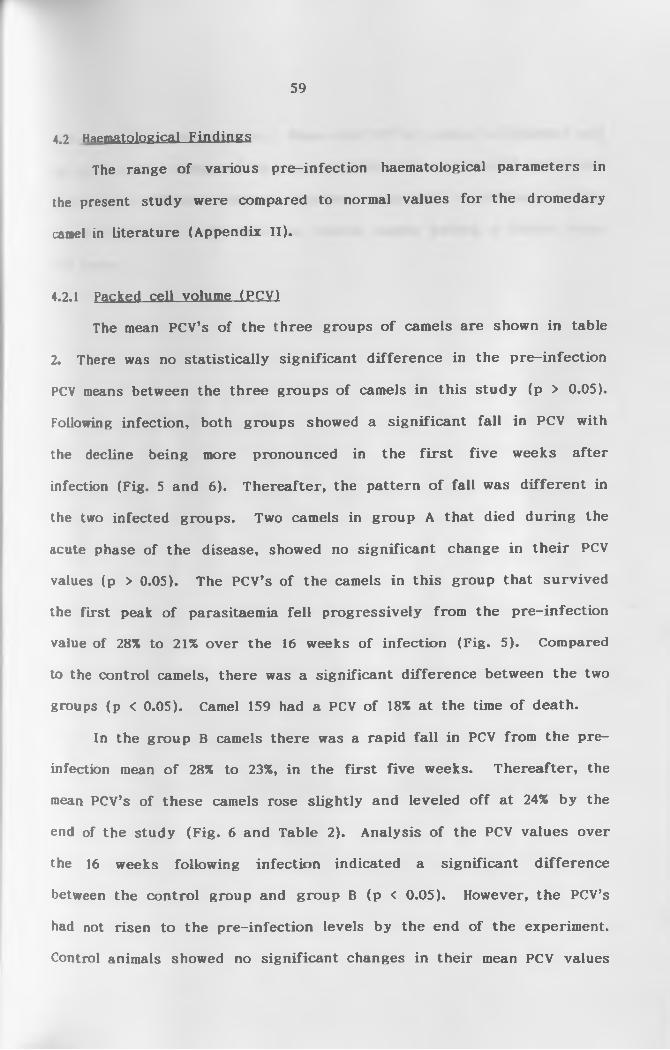
59
4.2 Haematological Findings
The range o f various pre-infection haematological parameters in
the present study were compared to normal values for the dromedary
camel in literature (Appendix II).
4.2.1 Packed cell volume (PCV)
The mean PCV’s of the three groups o f camels are shown in table
2. There was no statistically significant difference in the pre-infection
PCV means between the three groups of camels in this study (p > 0.05).
Following infection, both groups showed a significant fall in PCV with
the decline being more pronounced in the first five weeks after
infection (Fig. 5 and 6). Thereafter, the pattern o f fall was different in
the two infected groups. Two camels in group A that died during the
acute phase of the disease, showed no significant change in their PCV
values (p > 0.05). The PCV’s of the camels in this group that survived
the first peak of parasitaemia fell progressively from the pre-infection
value of 28% to 21% over the 16 weeks of infection (Fig. 5). Compared
to the control camels, there was a significant difference between the two
groups (p < 0.05). Camel 159 had a PCV of 18% at the time of death.
In the group B camels there was a rapid fall in PCV from the pre-
infection mean o f 28% to 23%, in the first five weeks. Thereafter, the
mean PCV’s of these camels rose slightly and leveled o ff at 24% by the
end of the study (Fig. 6 and Table 2). Analysis o f the PCV values over
the 16 weeks following infection indicated a significant difference
between the control group and group B (p < 0.05). However, the PCV’s
had not risen to the pre-infection levels by the end of the experiment.
Control animals showed no significant changes in their mean PCV values

60
throughout the study period. When the PCV of group A (infected and
not treated) was compared to group B (infected and treated) there was
a significant difference between the two groups only in the last 7 weeks
of the study (p < 0.05) with the treated camels having a higher mean
PCV value.

PC
V (
%).
61
camels (Group A).
Figure 5: Mean weekly packed cell volume o f in fected non-treated
Week 0= mean of 4 weeks before infection
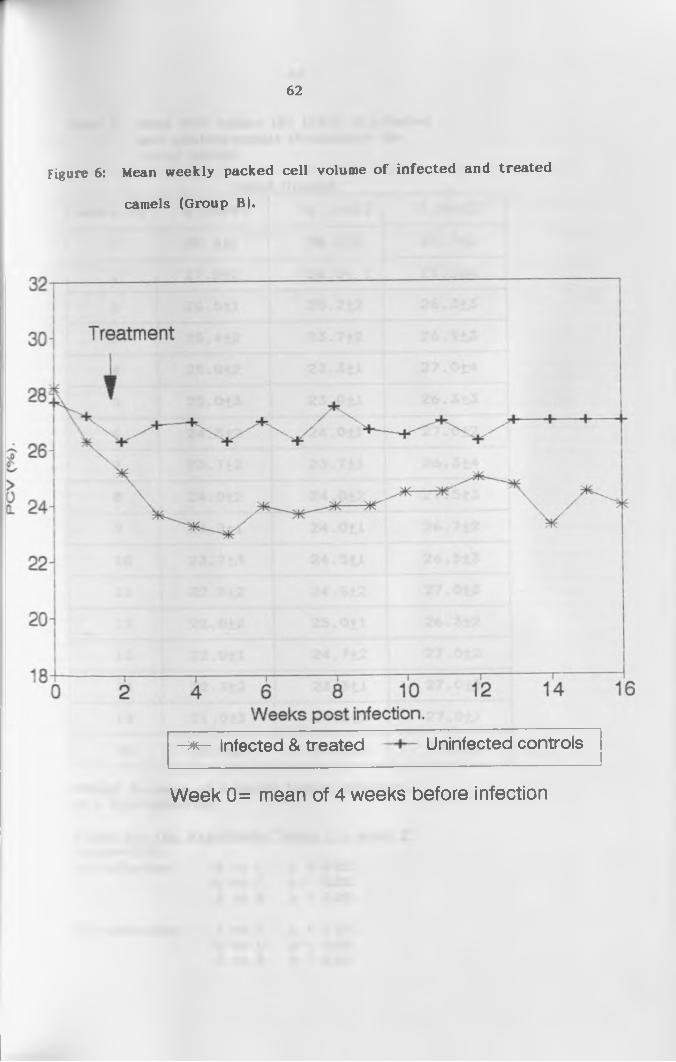
62
camels (Group B).
Figure 6: Mean weekly packed cell volume o f in fected and treated
■ # r - Infected & treated Uninfected controls
Week 0= mean of 4 weeks before infection
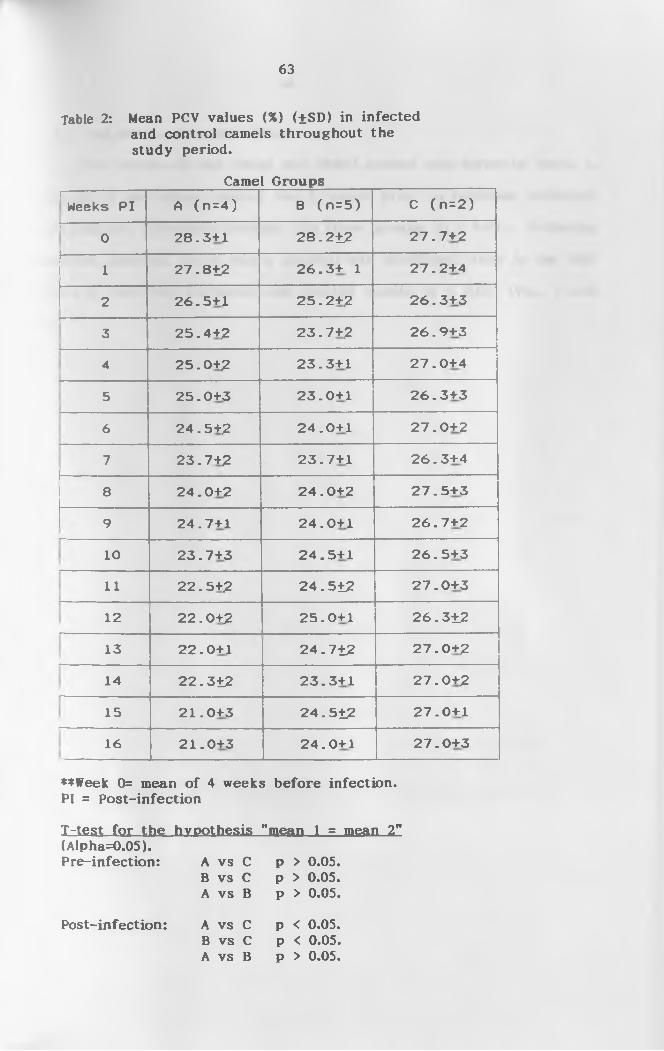
63
Table 2: Mean PCV values (%) (±SD) in infectedand control camels throughout the study period.
Camel GroupsI—
Weeks P I A ( n = 4 ) B ( n = 5 ) C ( n = 2 )
i--------------------0 2 8 . 3+1 2 8 . 2±2 2 7 . 7+2
1 2 7 . 8±2 2 6 . 3+ 1 2 7 . 2+4
2 26 . 5+1 2 5 . 2+2 2 6 . 3+3'---------------------
3 2 5 . 4+2 2 3 . 7+2 2 6 . 9+3
4 2 5 . 0+2 2 3 . 3+1 2 7 . 0+4
5 2 5 . 0+3 2 3 . 0+1 2 6 . 3+3
6 2 4 . 5+2 2 4 . 0+1 2 7 . 0+2-
7 2 3 . 7+2 2 3 . 7+1 2 6 . 3+4
8 2 4 . 0+2 2 4 . 0+2 2 7 . 5+3
9L
2 4 . 7+1 2 4 . 0+1 2 6 . 7+2
10L
2 3 . 7+3 2 4 . 5+1 2 6 . 5+3
i i 2 2 . 5+2 24.512 2 7 . 0+3
12L
2 2 . 0+2 2 5 . 0+1 26.312
13L
2 2 . 0+1 24.712 2 7 . 0+2
14L
22.312 2 3 . 3+1 2 7 . 0+2
15L
2 1 . 0+3 24.512 2 7 . 0+1
16 2 1 . 0+3 2 4 . 0+1 2 7 . 0+3
♦♦Week 0= mean of 4 weeks before infection. PI = Post-infection
T-te.st fo r-th e hypothesis "mean 1 = mean 21'(Alpha=0.05).Pre-infection: A vs C p > 0.05.
B vs C p > 0.05.A vs B p > 0.05.
A vs C p < 0.05.B vs C p < 0.05.A vs B p > 0.05.
Post-infection:

64
4.2.2. Red Blood cell count (RBC)
The results of red blood cell (RBC) counts are given in Table 3.
Analysis of the values during the 4 weeks prior to infection indicated
no significant difference between the three groups (p > 0.05). Following
infection, however, there was a gradual but significant drop in the RBC
values of both the untreated and treated camels (p < 0.05) (Fig. 7 and
8).
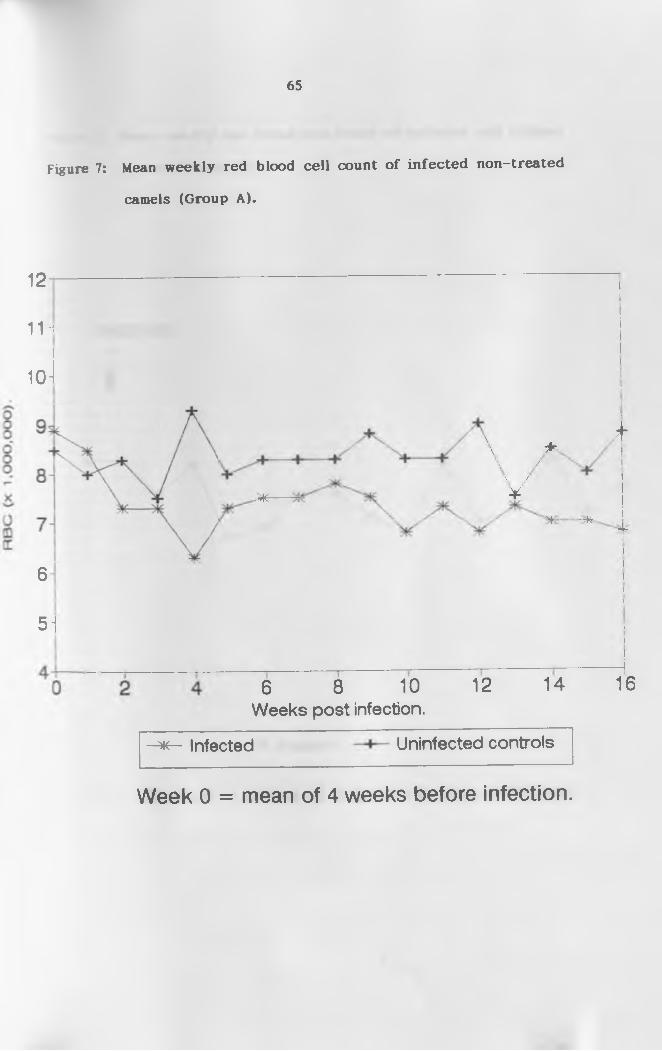
65
camels (Group A).
Figure 7: Mean weekly red blood ce ll count o f in fected non-treated
12
11H
10-
6
51
\
■Wr
\ ^\ /\ /4
k
^ ----M- 4
6 8 10Weeks post infection.
12 14 16
-*<— Infected Uninfected controls
Week 0 = mean of 4 weeks before infection.

66
camels (Group B).
Figure 8: Mean weekly red blood ce ll count o f in fected and treated
Week 0 = mean of 4 weeks before infection.

67
Table 3: Mean red blood cell count (xlOVml)(±SD) o f infected and control camels throughout the study period.
Weeks PI Camel Groups
A (n=4) 8 (n=5) C (n=2)
0 8.9+0.6 8.7+0.5 8.5+0.8t ---- ' ~
1 8.5+0.6 8.3+1.0 8.0+1.5
2 7.310.8 8.3+1.1 8.3+1.3
3 7.3+0.8 7.6+0.9 7.5+0.5
4L
6.3+1.3 8.2+0.7 9.3+1.3t
5 7.3+0.8 6.7+0.8 8.0+0.3
6 7.5+0.5 6.9+0.7 8.3+1.3
77.5+0.5 7.6+0.7 8.3+0.3
18
17.8+0.8 7.6+0.6 8.3+0.8
9 7.5+1.0 7.1+1.8 8.8+1.8
10 6.8+0.3 6.8+0.5 8.3+1.0
11 7.3+0.3 8.2+0.7 8.3+0.3
12 6.8+0.3 7.0+0.4 9.0+0.5
13L
7.3+0.3 7.2+1.0 7.5+1.0
14 7.0+0.0 8.3+0.5 8.5+0.5
15 7.0+0.5 7.2+0.5 8.0+0.5
16L
6.8+0.3 7.7+1.0 8.8+0.8
**Week 0= mean of 4 weeks before infection. PI = Post-infection
T-test for the hypothesis "mean 1 = mean 2" (Alpha=0.05). Pre-infection: A vs C p > 0.05.
B vs C p > 0.05.A vs B p > 0.05.
Post-infection: A vs C p < 0.05.B vs C p < 0.05.A vs B p > 0.05.

68
4.2.3. Haemoglobin (Hb) concentration
Pre-infection values o f haemoglobin content were similar in all
groups of animals (Table 4; Figs. 9 and 10). There was a gradual fall in
Hb concentration from the pre—infection value up to week three post
infection in both groups A and B camels, even though this drop was not
significant (p > 0.05). Towards the end of the experiment, however, the
Hb concentration of group A camels was significantly lower than that of
the control camels (p < 0.05). During the same period, group B camels
had a lower Hb concentration than the control camels, but the results
were not statistically significant (p > 0.05).

. c
on
e (
y/
dl)
.
69
treated camels (Group A).
Figure 9: Mean weekly haemoglobin concentration o f the in fected non-
14
8^
71
6-1------------1------------ 1------------ 1------------ 1------------ 1------------ 1 i0 2 4 6 8 10 12 14 16
Weeks post infection.
Infected Uninfected controls
Week 0 = mean of 4 weeks before infection.
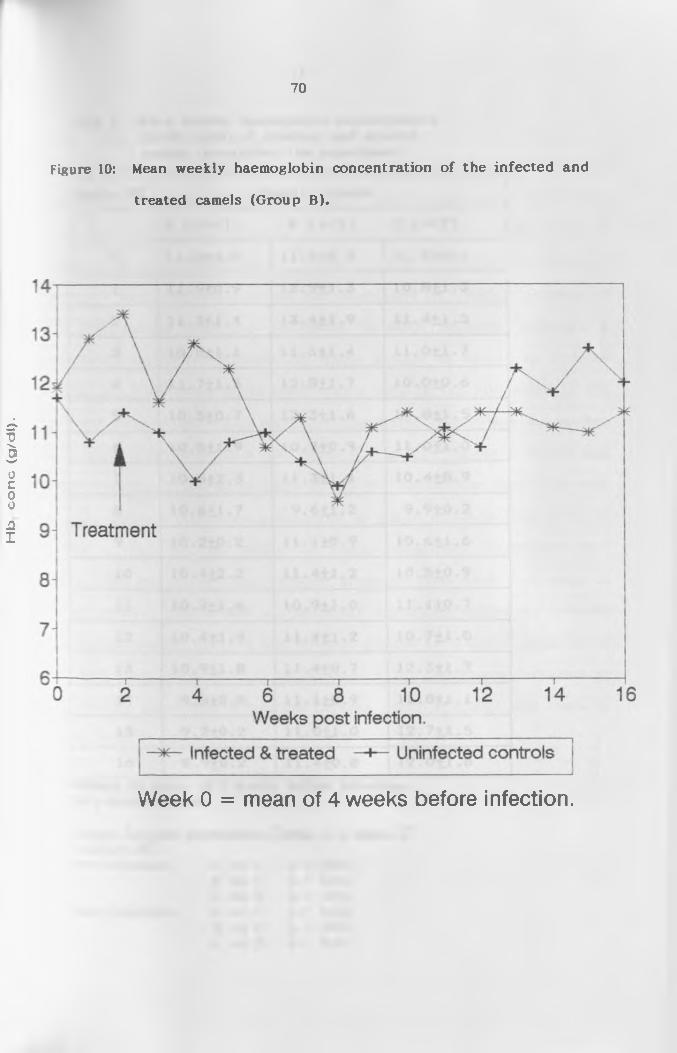
•(IP/B
) ou
oo
q(-|
70
treated camels (Group B).
Figure 10: Mean weekly haemoglobin concentration o f the in fected and
Week 0 = mean of 4 weeks before infection.

71
Table 4: Mean weekly haemoglobin concentration(g/dl) (±SD) o f infected and control camels throughout the experiment.
Weeks PI Camel Groups
A (n = 4 ) B ( n=5) C ( n=2 )
0 11 .2+0 .8 1 1 .9+0 .5 1 1 .7+0 .6
1 11 .9+0 .9 1 2 .9+1 .3 10 .8 +1 .3
2 11.3+1.4 13 .4+1 .9 11 .4 +1 .5
3 10.8+1.1 11 .6+1 .4 1 1 .0+1 .7
4 11 .7+1 .5 12 .8+1 .7 1 0 .0 + 0 .6
5 10.5+0.7 12 .3+1 .6 1 0 .8 + 1 .5
6 10 .5+1 .9 10 .7+0 .9 11 .0 +1 .0
7 10 .5+2 .3 11 .3+1 .1 10 .4 +0 .9
8 10 .6+1 .7 9 .6 + 1 .2 9 .9 + 0 .2
9 10 .2+0 .2 11 .1+0 .9 1 0 .6 + 1 .6
10 10.4+2 .2 11 .4+1 .2 10 .5 +0 .9
11L
10 .2+1 .6 10 .9+1 .0 11 .1+0 .7
12 10 .4+1 .9 11 .4+1 .2 1 0 .7+1 .0
13h
10 .9+1 .8 11 .4+0 .7 12 .3+1 .7
14L
9 .5 + 0 .8 11 .1+0 .9 11 .8+1 .1
15L
9 .2 + 0 .2 11 .0+1 .0 12 .7+1 .5
16 8 .9 + 0 .2 11 .4+0 .8 12 .0+1 .8
♦♦Week 0= mean of 4 weeks before infection. PI = Post-infection
T-test fo r-th e hypothesis., "mean 1 = mean 2"(Alpha=0.05).Pre-infection: A vs C p > 0.05.
B vs C p > 0.05.A vs B p > 0.05.A vs C p > 0.05.B vs C p > 0.05.A vs B p < 0.05.
Post-infection
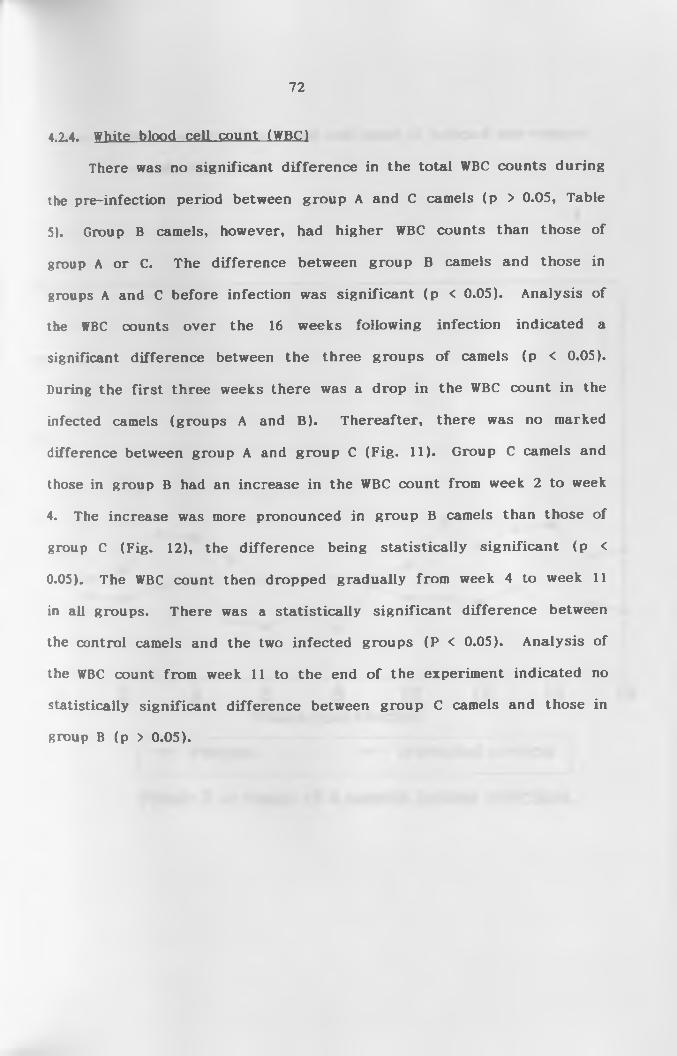
72
4.2.4. White blood ce ll count (WBC)
There was no significant difference in the total WBC counts during
the pre-infection period between group A and C camels (p > 0.05, Table
5). Group B camels, however, had higher WBC counts than those of
group A or C. The difference between group B camels and those in
groups A and C before infection was significant (p < 0.05). Analysis of
the WBC counts over the 16 weeks following infection indicated a
significant difference between the three groups o f camels (p < 0.05).
During the first three weeks there was a drop in the WBC count in the
infected camels (groups A and B). Thereafter, there was no marked
difference between group A and group C (Fig. 11). Group C camels and
those in group B had an increase in the WBC count from week 2 to week
4. The increase was more pronounced in group B camels than those of
group C (Fig. 12), the difference being statistically significant (p <
0.05). The WBC count then dropped gradually from week 4 to week 11
in all groups. There was a statistically significant difference between
the control camels and the two infected groups (P < 0.05). Analysis of
the WBC count from week 11 to the end o f the experiment indicated no
statistically significant difference between group C camels and those in
group B (p > 0.05).

WB
C c
ou
nt
(x
1 ,(J
OO
/ml).
camels (Group A).
Figure 11: Mean weekly white blood cell count o f in fected non-treated
Week 0 = mean of 4 weeks before infection.

WB
C c
ou
nt
(x 1
,00
0/
ml)
.
camels (Group B).
74
Figure 12: Mean weekly white blood cell count o f in fected and treated
Week 0 = mean of 4 weeks before infection.

75
Table 5: Mean weekly white blood cell count(xlOVml) (+SD) o f infected and control camels throughout the experiment.
Weeks PI Camel Groups
A (n=4) 8 (n=5) C (n=2)1------------
0 11.2+0.9 16.615.9 13.011.6
1 10. 111. 8 14.915.0 11.211.6
2 10.0+0.2 12.614.3 11.810.8
3 10.811.1 18.917.6 14.210.6
4 11.0+0.8 22.715.3 13.911.3
5 8.6+1.2 17.312-3 12.612-6
6 8.210.4 16.413.3 11.110.9
71
9.110.8 16.913.7 11.310.3
8 8.010.5 15.512-7 11.310.1
9 10.912.7 15.711.6 11.310.5
10 10.011.8 15.211.9 12.010.6
11 10.011.4 14.211.7 14.912.2
12(
9.711.2 14.612-7 13.210.8
13 10.611.6 14.512.5 14.311.6
14L
9.110.4 16.313.2 14.610.1
15L _
9.610.6 14.413.0 12.611.0
16 9.110.4 14.211.8 13.010.6
**Week 0= mean of 4 weeks before infection. PI = Post-infectionla te s t Lq i ih e. hypothesis, "mean 1 = mean 2"(Alpha=0.05).Pre-infection: A vs C p > 0.05.
B vs C p < 0.05.A vs B p < 0.05.
Post-infection: A vs C p < 0.05.B vs C p < 0.05.A vs B p < 0.05.
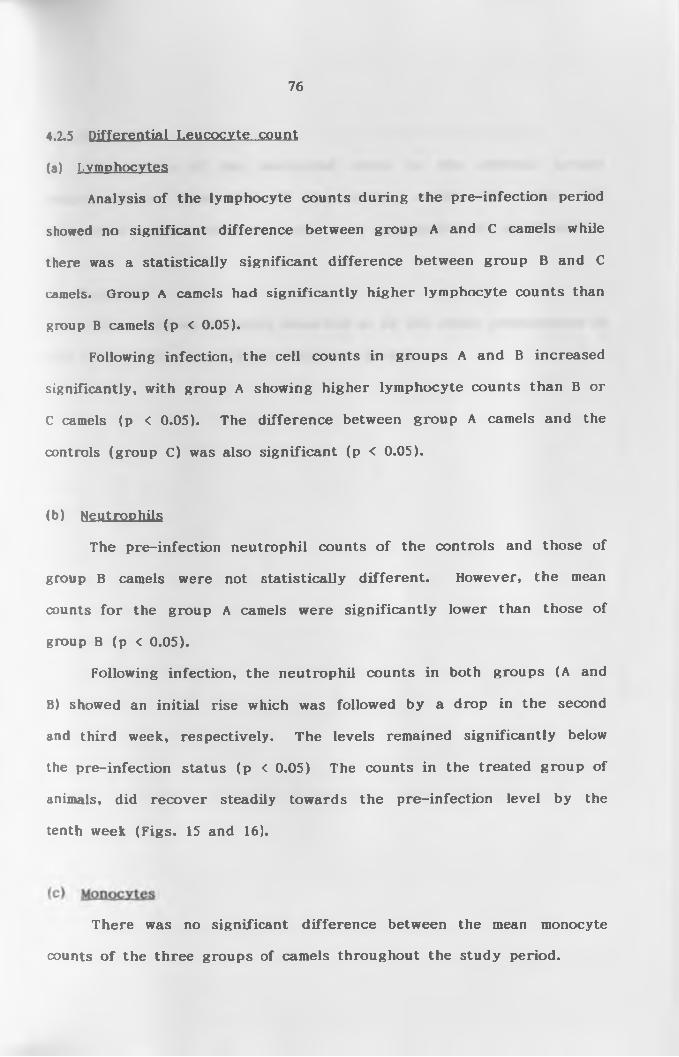
76
4.2.5 Differential Leucocyte count
(a) Lymphocytes
Analysis of the lymphocyte counts during the pre-infection period
showed no significant difference between group A and C camels while
there was a statistically significant difference between group B and C
camels. Group A camels had significantly higher lymphocyte counts than
group B camels (p < 0.05).
Following infection, the cell counts in groups A and B increased
significantly, with group A showing higher lymphocyte counts than B or
C camels (p < 0.05). The difference between group A camels and the
controls (group C) was also significant (p < 0.05).
(b) Neutrophils
The pre-infection neutrophil counts of the controls and those of
group B camels were not statistically different. However, the mean
counts for the group A camels were significantly lower than those of
group B (p < 0.05).
Following infection, the neutrophil counts in both groups (A and
B) showed an initial rise which was followed by a drop in the second
and third week, respectively. The levels remained significantly below
the pre-infection status (p < 0.05) The counts in the treated group of
animals, did recover steadily towards the pre-infection level by the
tenth week (Figs. 15 and 16).
There was no significant difference between the mean monocyte
counts o f the three groups of camels throughout the study period.
77
(d) Eosinophil
The values of the eosinophil count in the infected groups
remained lower than that of the control camels throughout the
observation period, but these results were not statistically significant.
(e) Basophils
There were no basophils observed in all the smear preparations in
both the pre-infection and post-infection periods.
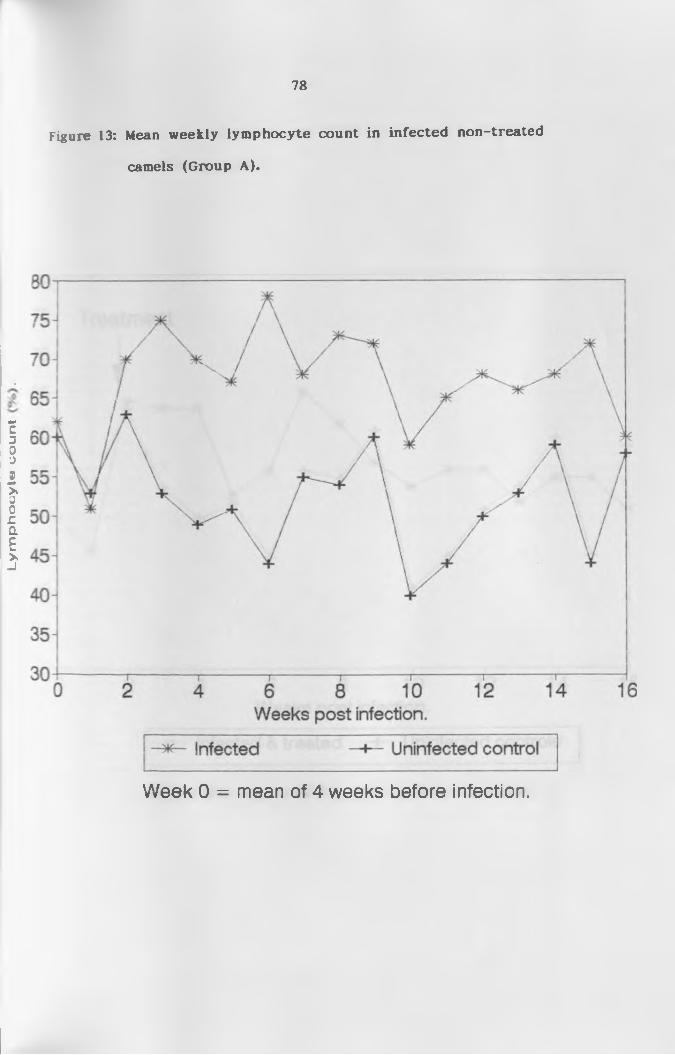
Ly
mp
ho
cy
te c
ou
nt
.
78
Figure 13: Mean weekly lymphocyte count in infected non-treated
camels (Group A).
Week 0 = mean of 4 weeks before infection.
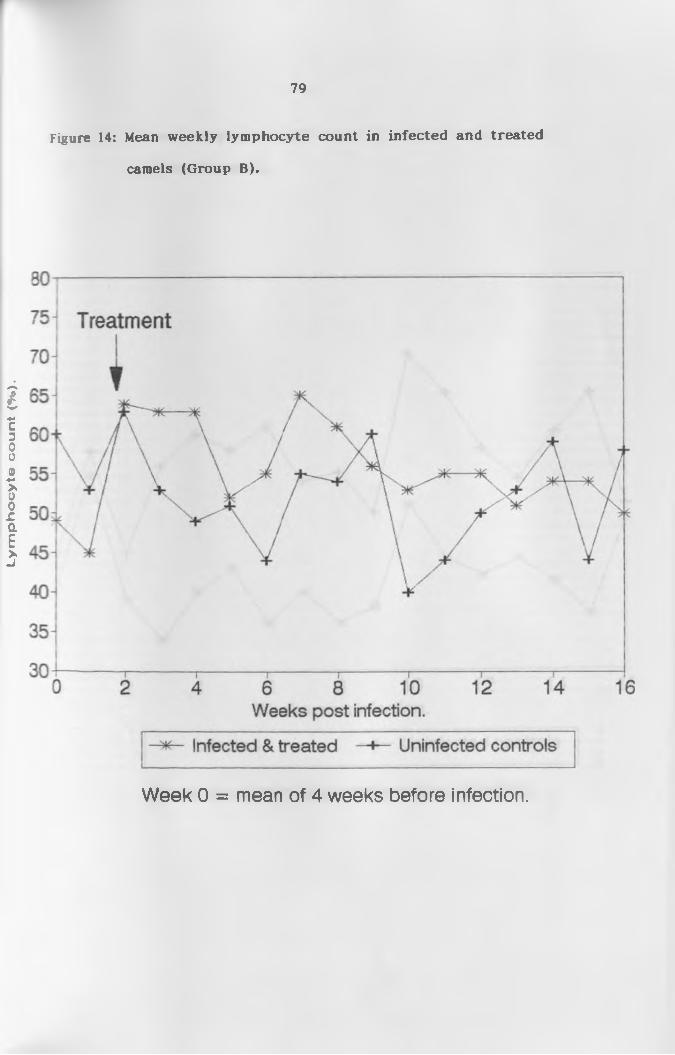
Ly
mp
ho
cy
te c
ou
nt
(%).
79
Figure 14: Mean weekly lymphocyte count in infected and treated
camels (Group B).
Week 0 = mean of 4 weeks before infection.
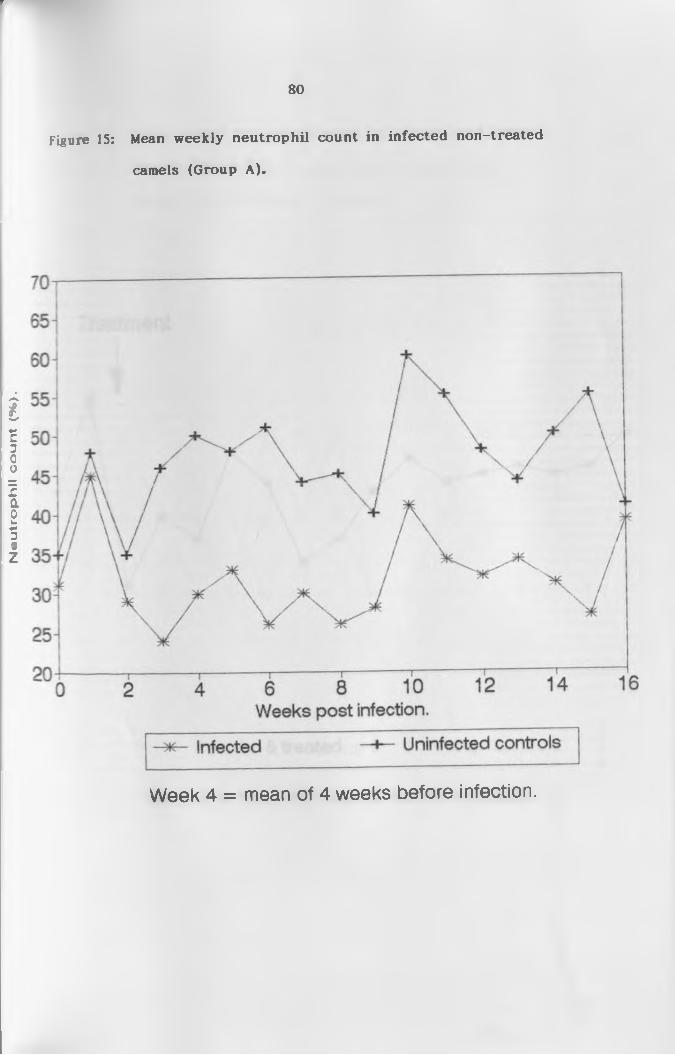
Neu
tro
ph
il c
ou
nt
(•«,
).r
80
camels (Group A).
Figure 15: Mean weekly neutrophil count in in fected non-treated
Week 4 = mean of 4 weeks before infection.
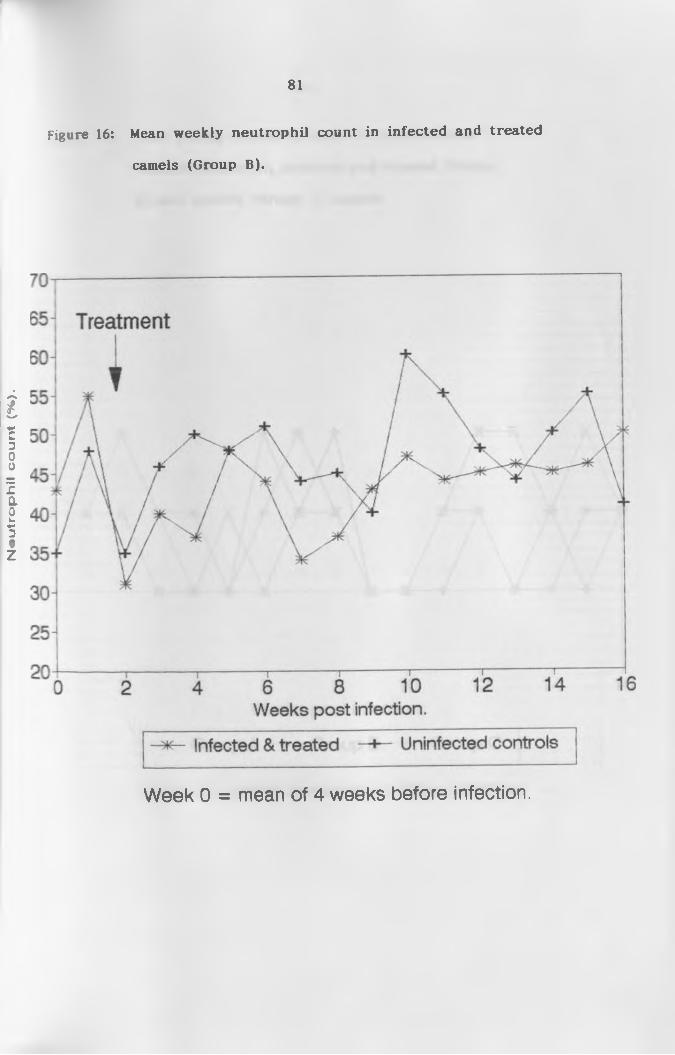
Neu
tro
ph
il c
ou
nt
(%).
r
camels (Group B).
81
Figure 16: Mean weekly neutrophil count in in fected and treated
Week 0 = mean of 4 weeks before infection.
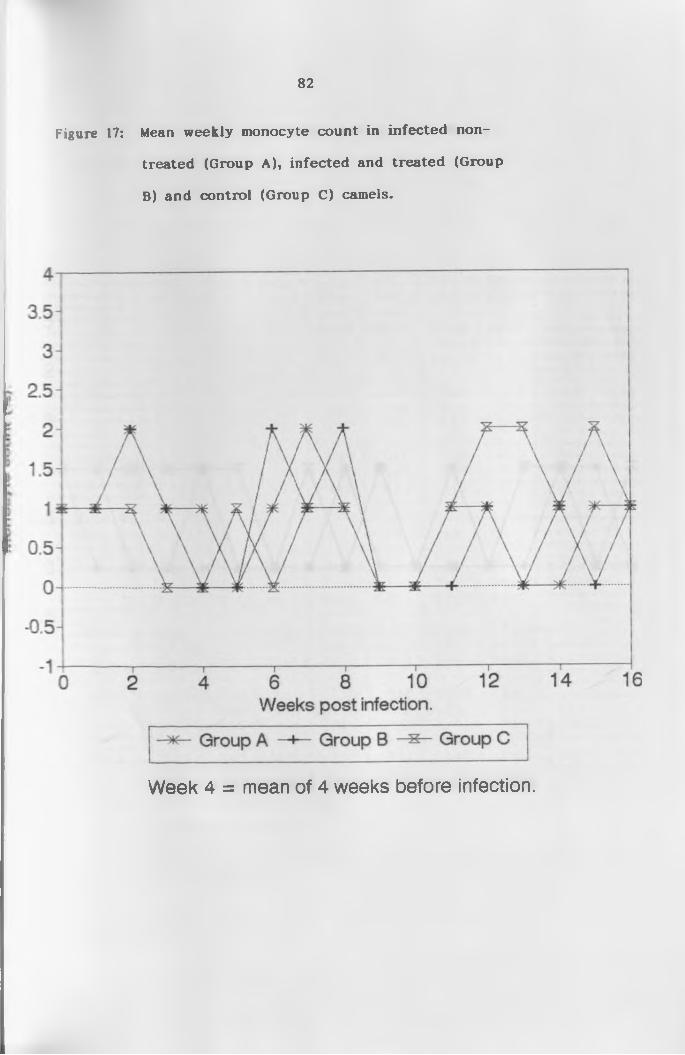
82
treated (Group A), infected and treated (Group
B) and control (Group C) camels.
Figure 17: Mean weekly monocyte count in in fected non-
Week 4 = mean of 4 weeks before infection.

83
treated (Group A), infected and treated (Group
B) and control (Group C) camels.
Figure 18: Mean weekly eosinophil count in in fected non-
Week 4 = mean of 4 weeks before infection.

84
Table 6: Mean differential leucocyte count (X) (±SD) ofinfected and control camels throughout the experimental period.
Meeks 0 1 2 3 4 5 6 7 8i--------
LYMP A 62+6 53+16 70+0 75+6 70+9 67+4 78+2 68+1 73+16B 49+4 45+18 64 + 16 63+8 63+13 52+18 55+12 65+11 61 + 15C 60+10 51+6 63+5 53+4 49+10 51 + 17 44+14 55+8 54+15
> —■ NEUT A 31+4 45+15 29+1 24+6 30+9 33+4 26+7 30+0 26+16
1 B 43+3 55+18 31 + 11 40+15 37+13 48+18 44+11 34+11 37+151 C 35+10 48+7 35+7 46+4 50+11 48+18 51+9 44+8 45+16|--------
MONO A 1 + 1 1 + 1 2+1 1+0 1+0 0+0 1+0 2+1 1+0B 1 + 1 1 + 1 2+1 1 + 1 0+0 0+0 2+2 1±2 2±2C 1+0 1 + 1 1 + 1 0+0 0+0 1 + 1 0+0 1 + 1 1 + 1
i--------EOSI A 1 + 1 1 + 1 0+0 0+0 0+0 0+0 0+0 0+0 1 + 1
B 1+0 0+0 0+0 0+0 1+0 0+0 0+0 0+0 0+0C 1 + 1 1 + 1 1 + 1 1 + 1 1 + 1 0+0 1+0 0+0
Meeks
LYMP
NEUT A BC
hMONO A
BC
EOS I A BC
72+656+1860+12
28+643+1840+11
0+00+00+0
0+0 1 + 1 1+0
10
59+1153+1640+11
41 + 11 47+15 60+11
0+0o to0+0
0+00+00+0
11
65+655+1344+14
34+644+1355+14
1 + 1 0+0 1+0
1 + 1 0+0 0+0
12
68+1055+1950+6
13
66+17 51 + 12 53+11
14
68+654+1859+24
15
72+1154+1644+9
16
60+1750+2158+4
32+1045+1948+5
31+6 I 27+10 45+181 46+16 50+15
39+1750+20
1+0 1 + 1 2+0
0+00+00+0
LYMP = Lymphocyte count (X) NEUT = Neutrophil count (X) MONO = Monocyte count (X) EOSI = Eosinophil count (X)
Group A: n=4 Group B: n=5 Group C: n=2
85
4.3 Biochemical P ro file
Appendix III shows the pre-infection levels of the biochemical
values obtained in the present study as compared to results o f various
workers, while Tables 6a and 6b show the mean (±SD) plasma chemistry
values (o f common enzymes and important non-enzymatic blood
components, respectively) o f the infected and control camels throughout
the study period.
4.3.1 Alkaline phosphatase
There was no significant difference in alkaline phosphatase (AP)
levels between the three groups o f camels prior to infection (p > 0.05).
The level o f AP in group A camels fell gradually following infection from
the pre-infection mean of 10.6 IU/1 to 6.1 IU/1 by week 2 and remained
significantly lower than that of the control camels throughout the study
period (p < 0.05). In group B camels, the AP level also fell gradually
from the pre-infection mean of 13.8 IU/1 to 8.0 IU/1 by the third week
following infection. Thereafter, there was an increase in the AP activity
from 8.0 IU/1 to 13.0 IU/1 by week 13. There was, however, no
significant difference between group B and the controls (p > 0.05).
When group A AP activity was compared to that o f group B, there was a
significant difference (p < 0.05).
4.3.2 Alanine aminotransferase
Alanine aminotransferase (ALT) levels showed no appreciable
difference in all the camel groups prior to and after infection and
ranged between 0 and 4 IU/1 throughout the study period.

86
4.3.3 Aspartate aminotransferase
Analysis o f aspartate aminotransferase (AST) profile prior to
infection showed no significant difference between the three groups of
camels (p > 0.05). AST in group A camels fell from the pre-infection
value of 6.4 IU/1 to 2.8 IU/1 by the third week, while the level in group
B camels fell to 1.9 IU/1 by the second week. The level o f AST in the
control camels also dropped from an initial value o f 5.7 IU/1 to 4.2 IU/1
by week 3 and thereafter, remained constant up to week 13 before
rising to 5.8 IU/1 at week 14. The AST value in group A rose gradually
from 2.8 IU/1 in week 3 to 4.5 IU/1 in week 9 followed by a drop to 3.7
IU/1 in week 13. Eventually there was a final rise to 4.6 IU/1 in week
15. After the initial fall in AST activity in group B camels in week 2
there was a rise to 5.7 IU/1 by the third week. This was followed by a
fall to 4.0 IU/1 in week 9 and a gradual rise to 4.9 IU/1 by week 13.
Statistically, there was no significant difference between the infected
camels and the controls throughout the study period (p > 0.05).
4.3.4 Creatine Kinase
There was no significant difference in creatine kinase levels
among the three groups of camels prior to and following the infection
despite the fluctuations observed.
4.3.5 Lactic dehydrogenase
Lactic dehydrogenase (LDH) showed no difference between the
three groups o f camels prior to infection (p > 0.05). After infection,
there was a slight decline in the LDH activity to the second and third
week in groups A and B, respectively. This was followed by a gradual
87
increase in the LDH level to the end of the experiment in group B and
to week 13 in group A. However, this increase in LDH activity in the
infected camels showed no significant difference when analyzed (p >
0.05).
4.3.6 Blood urea nitrogen
Pre-infection data o f blood urea nitrogen (BU) level showed no
significant difference in all groups o f camels (p > 0.05). After infection,
group A camels had a gradual fall in the BU level to the ninth week and
then a rise from the ninth week to the end o f the experiment. The
decline and rise were, however, not significant (p > 0.05). In group B
camels there was an increase in BU levels following infection up to the
second week. This was followed by a decline. The level o f BU in group
B camels did not drop below that o f group C camels and the results
between the two groups were not significantly different (p > 0.05). In
the control camels BU levels were almost constant throughout the
experiment with only minor fluctuations.
4.3.7 Total proteins, albumin and globulin
The pre-infection total protein (TP) level showed no significant
difference in all the three groups of camels (p > 0.05). The TP level in
groups A and B increased from the second week of infection and
levelled at the fourth week. The total proteins then remained almost
constant in these two groups up to the thirteenth week when there was
a decline. The increase from the second week to the thirteenth week
showed a significant difference between the infected group o f camels
and the controls (p < 0.05). The TP level from week 13 to the end of

88
tbe experiment, however, did not drop to below that o f the control
camels. Total protein in the control camels remained almost constant
with only minor fluctuations.
The mean albumin concentration in all the three camel groups
showed no difference in pre-infection data. Albumin levels in infected
camels and the non-infected controls remained almost constant
throughout the experimental period with slight fluctuations but within
the normal range (2 to 3 mg/dl). Statistically however, there was a
significant difference between the infected groups and the controls (p <
0.05). Comparison between group A and B showed no significant
difference.
Globulin levels increased significantly in the infected camels of
group A and B from the second week and reached a peak level in the
third week. From the third week the globulin level remained almost
constant in these two infected groups up to week thirteen, when there
was a drop, followed by another increase in week fourteen. In the
control group, the globulin level remained almost constant with minimal
fluctuations. There was a significant difference in globulin level
between the infected groups and the controls (p < 0.05).
Albumin level was compared to the globulin level in the infected
groups. At the start of the experiment (before infection), the albumin
level was higher than that of the globulin. However, by the second
week following infection, there was a switch in which the globulin level
became predominant. The globulin level remained higher from the
second week to the end o f the study and was more pronounced in group
A than in group B.
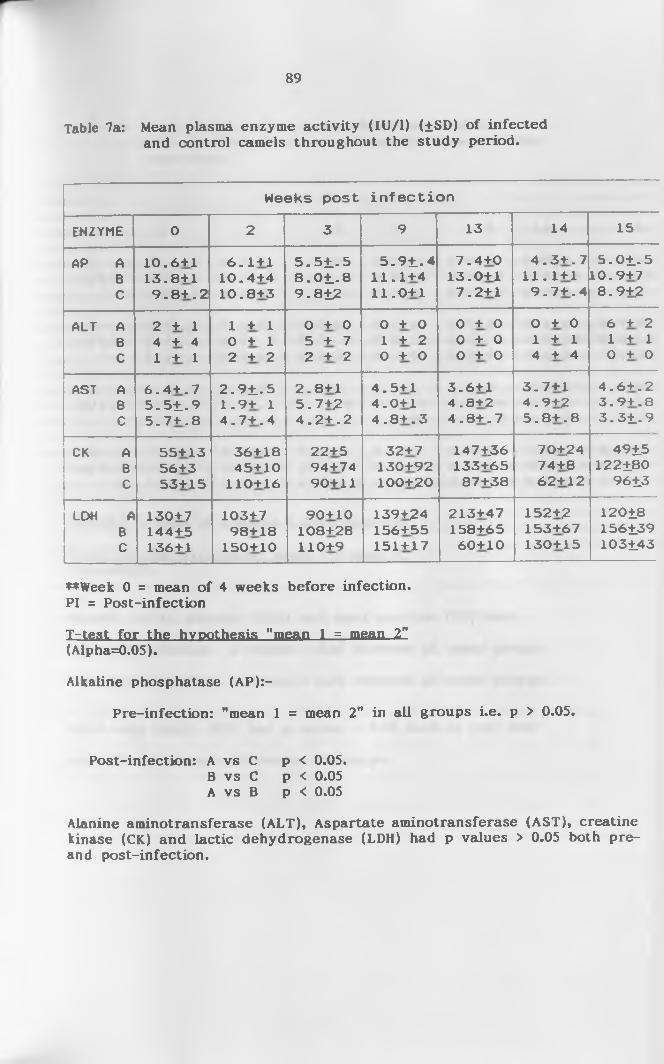
89
Table 7a: Mean plasma enzyme activity (IU/1) (±SD) of infectedand control camels throughout the study period.
Weeks post infection
ENZYME 0 2 3 9 13 14 15
AP A BC
10.6+1 13.8+1 9 .8 + .2
6 .1 + 1 10.4+4 10.8+3
5 .5 1 .5 8 .0 1 .8 9 .8±2
5 .9 1 .411.1+411.0+1
7.4+013.0+17.2+1
4 .3 + .7 11.1+1 9 .7 + .4
5 .0 1 .510.9+78.9+2
ALT A BC
2 + 1 4 + 4 1 + 1
1 + 1 0 + 1 2 + 2
0 + 0 5 + 7 2 + 2
0 + 0 1 + 2 0 + 0
0 + 0 0 + 0 0 + 0
0 + 0 1 + 1 4 + 4
6 + 2 1 + 1 0 + 0
AST A BC
6 .4 + . 7 5 .5 1 .9 5 .7+ . 8
2 .9 1 .5 1 .9 + 1 4 .7 + .4
2.8+1 5.7+2 4 .2 + .2
4.5+1 4.0+1 4 .8 + .3
3.6+1 4.8+2 4 .8 + .7
3 .7 + 1 4.9+2 5 .8 + .8
4 .6+ .23 .9 + .83 .31 .9
CK A B C
55+1356+353+15
36+1845+10
110+16
22+5 94 + 74 90+11
32+7130+92100+20
147 +.36 133+65 87+38
70+2474+862+12
4915122180
9613
LDH A BC
130+7144+5136+1
103+798+18
150+10
90+10108+28110+9
139+24156+55151+17
213+47158+6560+10
152+2153+67130+15
12018156139103143
♦♦Week 0 = mean of 4 weeks before infection.PI = Post-infection
T-test for the hypothesis "mean 1 = mean 2"(Alpha=0.05).
Alkaline phosphatase (AP):-
Pre-infection: "mean 1 = mean 2" in all groups i.e. p > 0.05.
Post-infection: A vs C p < 0.05.B vs C p < 0.05A vs B p < 0.05
Alanine aminotransferase (ALT), Aspartate aminotransferase (AST), creatine kinase (CK) and lactic dehydrogenase (LDH) had p values > 0.05 both pre- and post-infection.
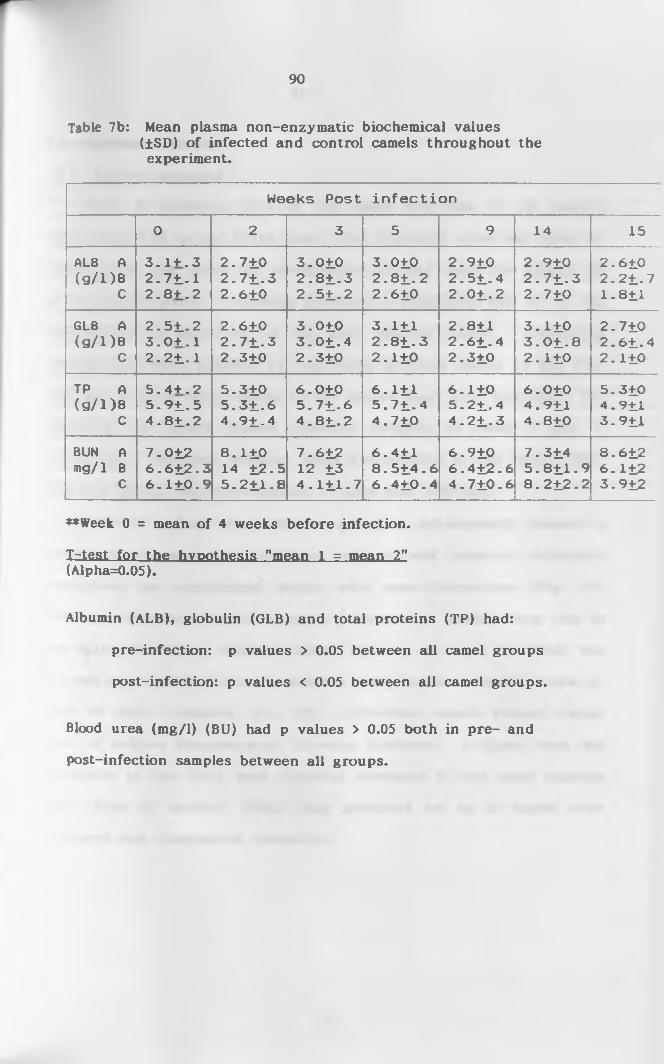
90
Table 7b: Mean plasma non-enzymatic biochemical values(±SD) o f infected and control camels throughout the experiment.
Weeks Post infection
0 2 3 5 9 14 15
ALB A ( 9 / D B
C
3 .1+.3 2 .71 .1 2 .8 + .2
2.7102 .7 1 .32.610
3.0102 .8 1 .32 .5 1 .2
3.0102 .8 1 .22.610
2.9102 .51 .42 .0 1 .2
2.9102 .7 1 .32.710
2.6102 .21 .71.811
GLB A (g/i)B
C
2 .5 1 .2 3 .0+ .1 2 .21 .1
2.6102 .7 1 .32.310
3.0103 .0 1 .42.310
3.1112 .8 1 .32.110
2.8112 .6 1 .42.310
3.110 3 .0 1 .82.110
2.7102 .61 .42. n o
TP A ( g / D B
c
S .4+ .25 .9 1 .54 .8 1 .2
5.3105 .3 1 .64 .91 .4
6.0105 .7 1 .64 .8 1 .2
6.1115 .7 1 .44.710
6.1105 .2 1 .44 .2 1 .3
6.0104.9114.810
5.3104.9113.911
BUN A mg/1 B
C
7.012 6 .612 .3 6 .110 .9
8.110 14 12-5 5 .211 .8
7.612 12 13 4 . Ill . 7
6.411 8 .5 1 4 .6 6 .410 .4
6.9106.412-64 .710 .6
7.314 5 .8 11 .9 8 .2 12 .2
8.6126.1123.912
**Week 0 = mean of 4 weeks before infection.
Irtest for the hypothesis "mean 1 = mean 2” (Alpha=0.05).
Albumin (ALB), globulin (GLB) and total proteins (TP) had:
pre-infection: p values > 0.05 between all camel groups
post-infection: p values < 0.05 between all camel groups.
Blood urea (mg/1) (BU) had p values > 0.05 both in pre- and
post-infection samples between all groups.

91
4.4. Serological Assays
4.4.1. Antigen Detection
Prior to infection none of the camel sera had an OD reading
higher than 0.05 in the ELISA test. The threshold value was thus set
at 0.10 which was twice the pre-infection OD and twice the highest OD
of the control camels. Following infection, a significant rise in OD was
demonstrated in eight out of the nine infected camels. Circulating
antigens were first detected by Ag-ELISA in three camels by the first
week and in three other camels by the second week after infection. The
remaining two camels showed elevated antigens in week 3 and 4,
respectively. However, antigens were not detected in one camel (C156)
that died during the acute disease, 11 days post infection.
The OD values of camels in group A subsequently showed a
progressive increase in circulating antigens and remained detectable
throughout the experimental period with some fluctuations (Fig. 19).
Following treatment, camels in group B showed an initial sharp rise in
the ELISA OD values which remained high up to week 4. This was
followed by a gradual decrease and the antigens became undetectable by
week 10 after treatment (Fig. 20). Individual camels showed varied
times o f antigen disappearance following treatment. Antigens were not
detectable by the third week following treatment in one camel (number
C261) while in another (C162) they persisted up to 10 weeks after
treatment and disappeared thereafter.
92
4.4.2 Antibody Detection
The antibody ELISA profile o f the three groups of camels is shown
in Figures 21 and 22. Sera from pre-infection period and of the non-
infected control camels were all negative (OD cut-off point was 0.15
since none of the pre-infection sera and the non-infected camel sera
gave OD readings more than 0.145). Antibodies in two infected camels
were first detected 7 days following infection. On average, the
antibodies were detected by week 4 in all camels (Figs. 21 and 22).
Antibody levels in group A increased gradually, thereafter, reaching a
plateau in the fifth week. There was no decline in antibody levels in
group A camels. However, in the treated camels (group B) antibody
levels increased to detectable levels 2 weeks post treatment and reached
a peak in the seventh week (five weeks post-treatment). Thereafter,
there was a gradual fall but the levels were still higher than the cut
off point by the end of the study period (14 weeks after treatment).
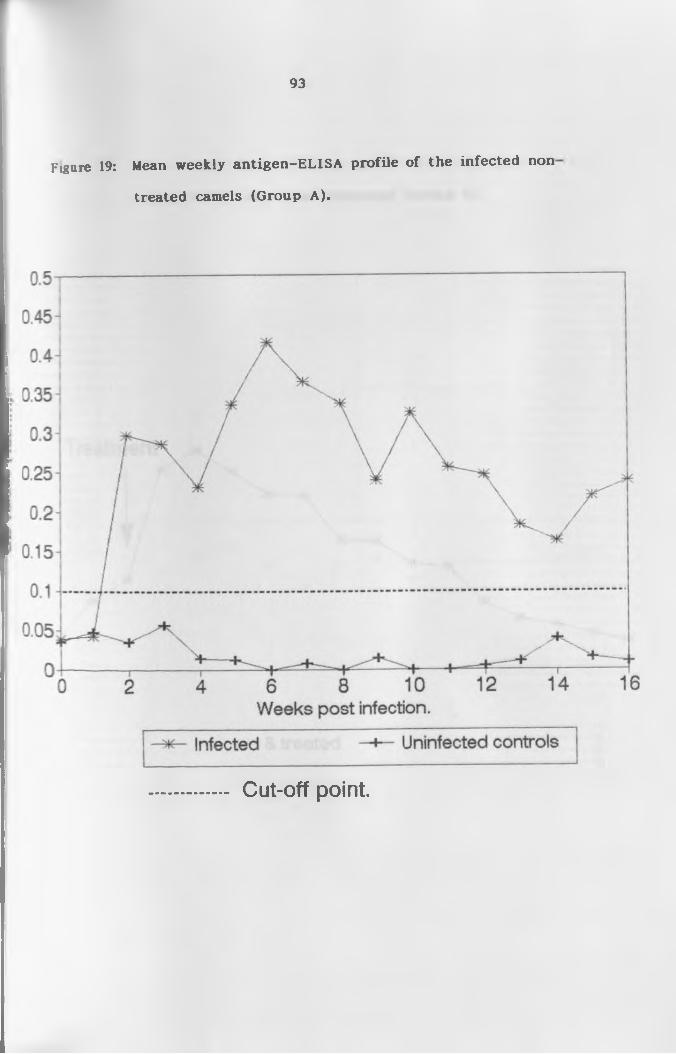
93
treated camels (Group A).
Figure 19: Mean weekly an tigen -ELISA pro file o f the in fected non
Cut-off point.

94
camels before and after treatment (Group B).
Figure 20: Mean weekly an tigen-ELISA profile o f the infected
Cut-off point.

95
camels (Group A)
Figure 21: Mean weekly an tibody-ELISA profile o f in fected non-treated
Cut-off point.

96
before and after treatment (Group B)
Figure 22: Mean weekly an tibody-ELISA pro file o f in fected camels
Cut-off point.
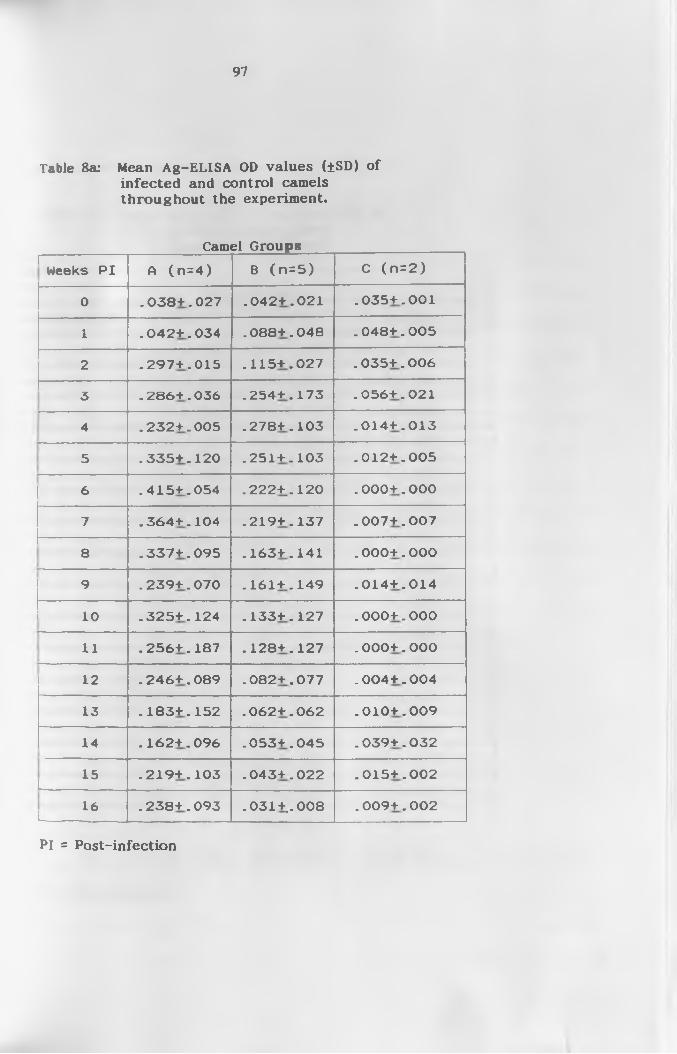
97
Table 8a: Mean Ag-ELISA OD values (±SD) ofinfected and control camels throughout the experiment.
Camel Groupsr-
Weeks PI A (n=4 ) B (n =5 ) C (n =2 )
0 .038+.027 .042+.021 .035+.001
1 .042+.034 .088+.048 .048+.005
2 .297+.015 . 115+.027 .035+.006
3 .286+.036 .254+.173 .056+.021—
4 .232+.005 .278+.103 .014+.013—
5 .335+.120 .251+.103 .012+.005
—6 .415+.054 .222+.120 .000+.000
7 .364+.104 .219+.137 .007+.007
8 .337+.095 .163+.141 .000+.000
9 .239+.070 .161+.149 .014+.014
10 .325+.124 .133+.127 .000+.000
11 .256+.187 .128+.127 .000+.000
12 .246+.089 .082+.077 .004+.004
13 .183+.152 .062+.062 .010+.009
14 .162+.096 .053+.045 .039+.032
15L
.219+.103 .043+.022 .015+.002
16L
.238+.093 . 031+.. 008 .009+.002
Pi = Post-infection

98
Table 8b: Mean Ab-ELISA OD values (±SD) ofinfected and control camels throughout the experiment.
Camel Groups
Weeks PI HCw<r 8 ( n=5) C (n =2 )
0 .114+.003 .0861.039 .1161.010|
1 . 1341.020 .0691.033 .1171.001
2 .1111.008 .01141.045 .1141.016
3 .1271.033 .0861.033 .1021.002'---------------
4 .2651.008 .1851.076 .1141.017!
5 .2801.010 .2071.082 .1261.014!
6 .2761.009 .2171.072 .1041.011
7 .2771.005 .2491.028 .0851.001
8 .2821.015 .2541.012 .1051.024
9 .2841.014 .2501.037 .1131.013
10 .2861.002 .2301.035 .0901.027
11 .2811.001 .2301.031 .1051.013
12 .2821.011 .2271.031 .1071.024
13 .2811.005 .2231.031 .1061.013
14i----
.2661.023 .2121.037 .1081.010
15 .2601.026 .2011.035 .1171.012
16 .2581.028 .2001.034 .1051.002
PI = Post-infection

4.5 pathological Findings
4.5.1 Gross Pathology
Camels C149 and C156 which died of the acute disease had good
body condition. The peritoneal cavity was filled with serosanguineous
fluid. The rumen was impacted with ingesta while the large and small
intestines were gas filled. The mucosa of the abomasum had diffuse and
ecchymotic haemorrhages running along the longitudinal folds (Plate 8).
The intestines were congested and had diffuse haemorrhages, especially
on the mucosa (Plate 9). Haemorrhagic lymphadenopathy of the
superficial and deep lymph nodes was pronounced. The trachea and
bronchi had froth and were congested (Plate 10). The lungs were
oedematous, congested and enlarged as showed by the rounded edges
(Plate 11). The pericardial fluid was blood-tinged and the pericardial
sac slightly congested. The epicardium and myocardium had petechial
haemorrhages (Plate 12) while the heart of the animal that died at the
end of the experiment had petechial haemorrhages on the epicardium and
depleted coronary fat (Plate 13). The spleens o f the animals that died
from the acute disease were enlarged, but that o f the animal that died
towards the end of the study was flabby and pale (Plate 14). The
meninges were heavily congested (Plate 15) and the brain oedematous.
The kidneys were congested and the pelvis had ecchymotic
haemorrhages. The bladder was massively congested and contained
yellowish urine.
The camel that died at the end of the study had substantial
subcutaneous oedema and yellow gelatinous exudate under the skin,
especially on the ventral side o f the body. Its muscles were pale and
the small intestinal loops had adhered to one another and had
99

100
■jraorrhages on the serosal surface (Plate 16).
Histo pathology
Histopathological changes in the two camels (C149 and C156) which
: td of the acute disease were confined to the heart, kidneys, lungs and
/cr. The heart had severe myocardial haemorrhages and oedema which
•a* characterized by separation o f muscle fibres. Venous congestion
ns pronounced in cardiac vessels (plate 17). The lungs had
.-neralized marked venous congestion with interstitial and alveolar
edema in localized regions. There were, however, some with severe
tlveolar oedema. In one camel (C156) there was mild generalized
lywphocytic infiltration in the lungs (plate 18). The kidneys showed
urked venous congestion (plate 19) with occasional haemorrhagic foci,
-we areas had severe congestion and haemorrhages. The brain of
-tael 156 showed histopathological reaction characterized by venous
ingestion, mild perivascular lymphocytic infiltration and mild gliosis.
There was also oedema in the brain stem characterized by vacuolation of
the brain tissue (plate 20).
Camel Cl 59 which died at the end o f the experiment had
histopathological lesions in several organs. The brain had marked
edema, the lung had alveolar oedema with moderate venous congestion
plus a few lymphocytic foci. The spleen had a marked expansion of the
• hite pulp and trabeculae at the expense of the red pulp. There was
fibrous tissue formation sign ifying splenic fibrosis.
severe generalized cirrhosis with venous congestion. The heart had a
few localized areas o f venous congestion. The
glomerular mononuclear lymphocytic infiltration.
kidneys had increased

101
the acute phase of the disease showing diffuse and ecchymotic
haemorrhages (arrows 1 and 2, respectively)
Plate 8: Abomasum of an in fected non-treated camel that died during
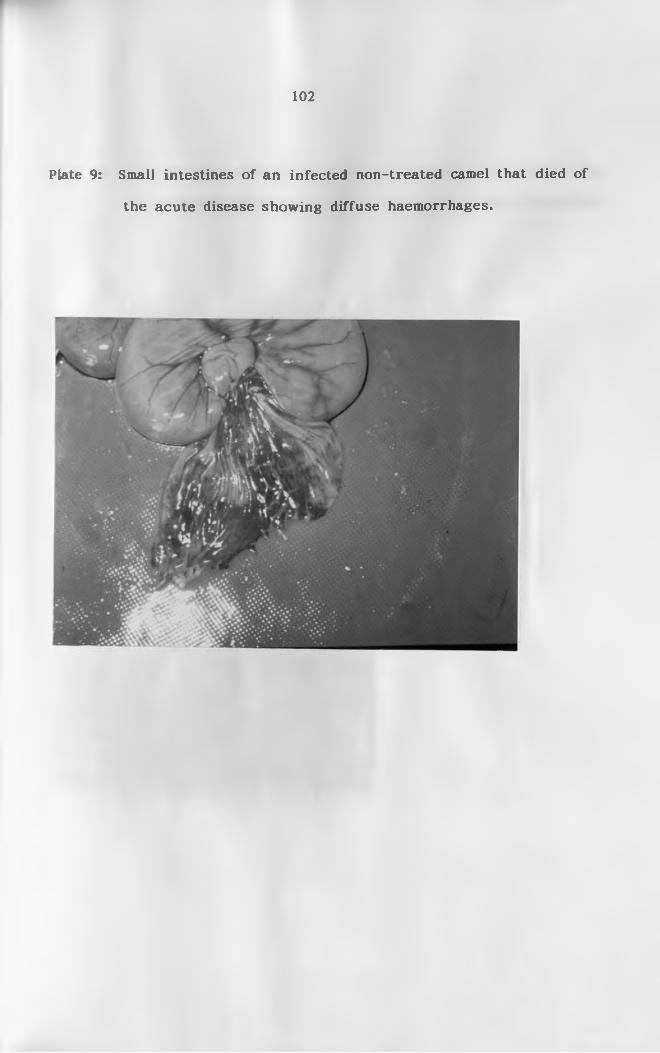
102
Plate 9: Small intestines of an infected non-treated camel that died of
the acute disease showing diffuse haemorrhages.
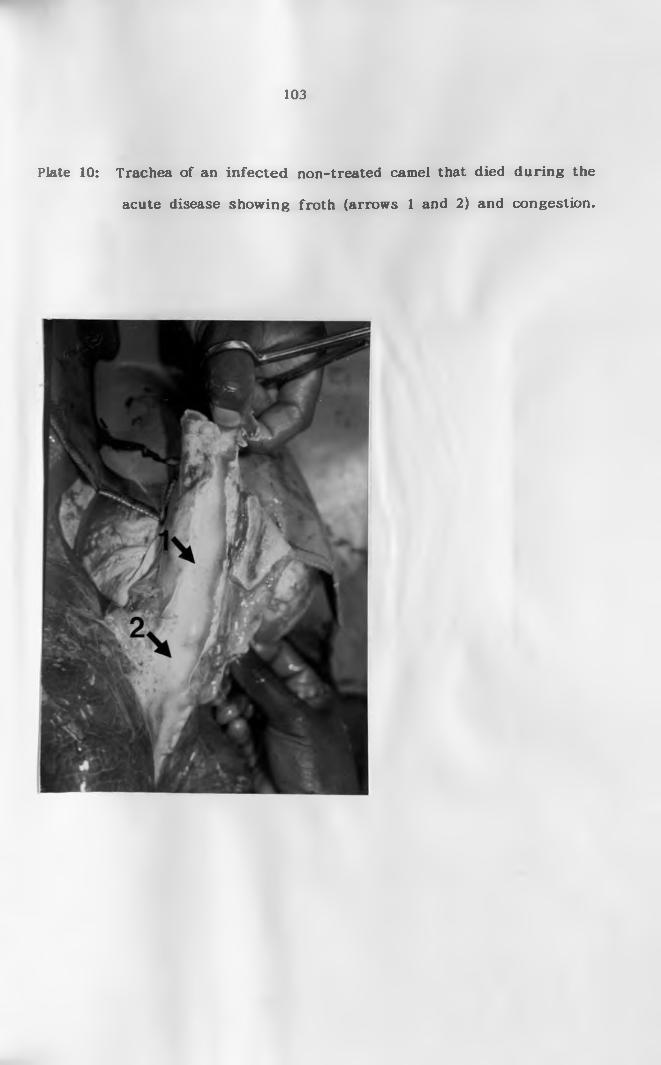
103
acute disease showing froth (arrows 1 and 2) and congestion.
Plate 10: Trachea o f an in fec ted non-treated camel that died during the

104
the acute disease showing rounded edges (arrows).
Plate 11: Lung lobes o f an in fec ted non-treated camel that died during

105
disease showing petecchiai haemorrhages (arrow).
Plate 12: Heart o f an in fected non-treated camel that died o f the acute
*
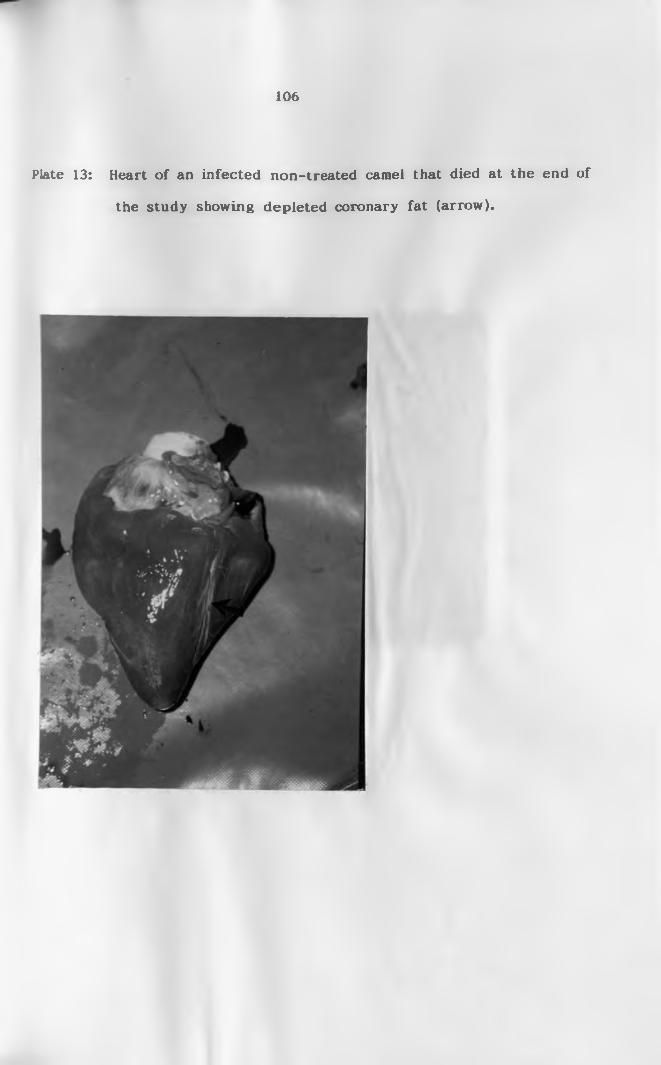
106
the study showing depleted coronary fat (arrow).
Plate 13: Heart o f an in fected non-treated camel that died at the end o f
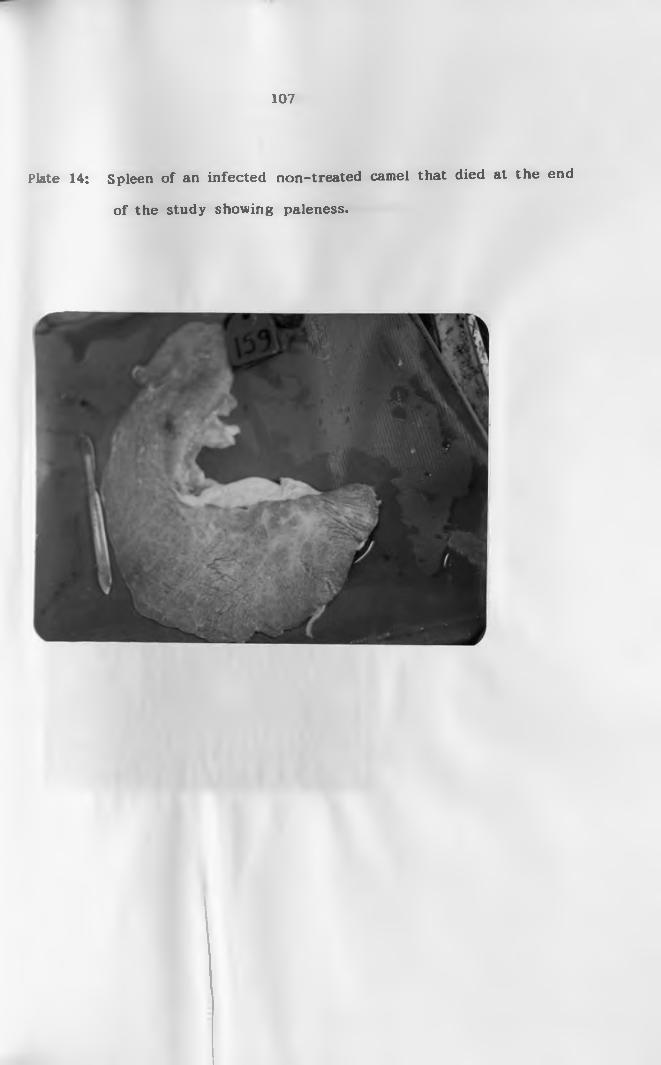
107
of the study showing paleness.
Plate 14: Spleen o f an in fected non-treated camel that died at the end

108
showing congested meninges (arrows).
Plate 15: Brain o f an in fected camel that died o f the acute disease
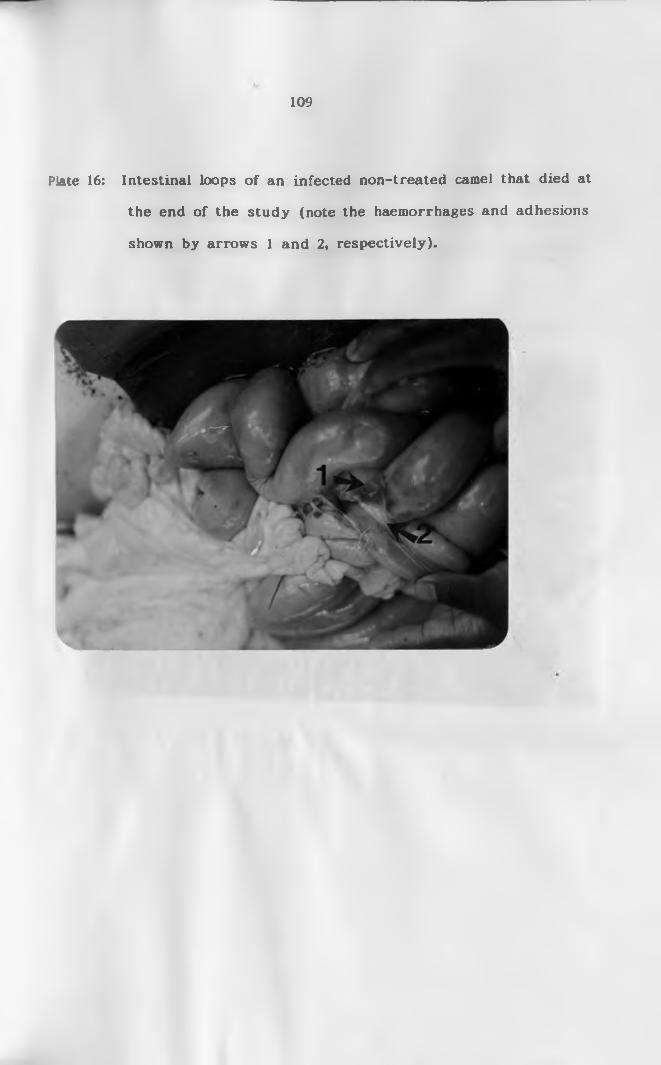
109
the end of the study (note the haemorrhages and adhesions
shown by arrows 1 and 2, respectively).
Plate 16: Intestinal loops o f an infected non-treated camel that died at
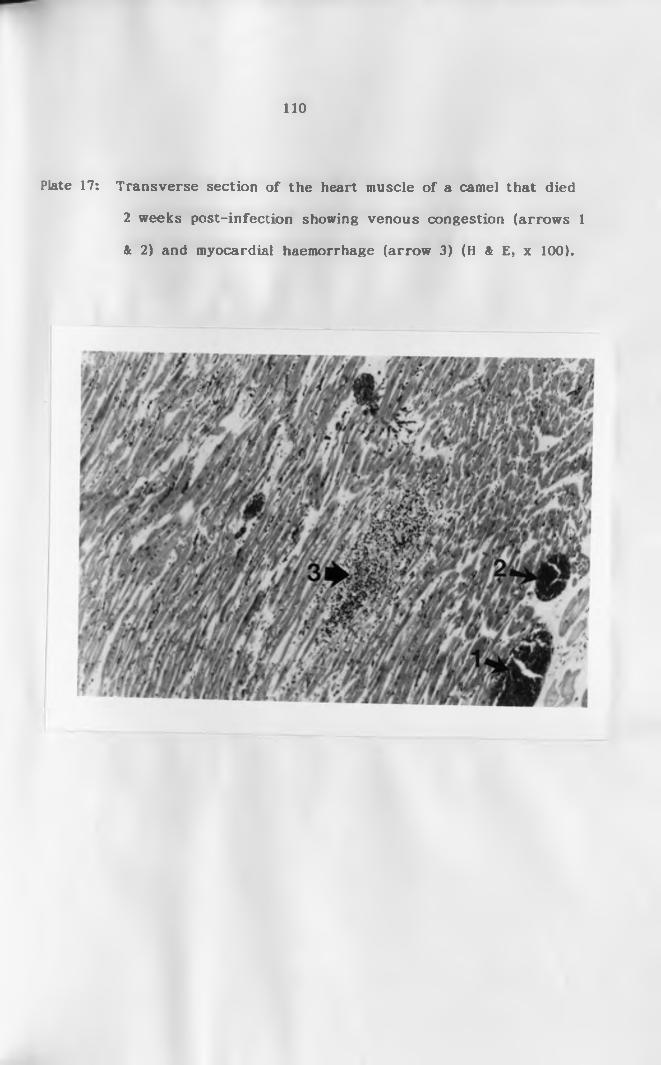
110
2 weeks post-infection showing venous congestion (arrows 1
& 2) and myocardial haemorrhage (arrow 3) (H & E, x 100).
Plate 17: Transverse section o f the heart muscle o f a camel that died
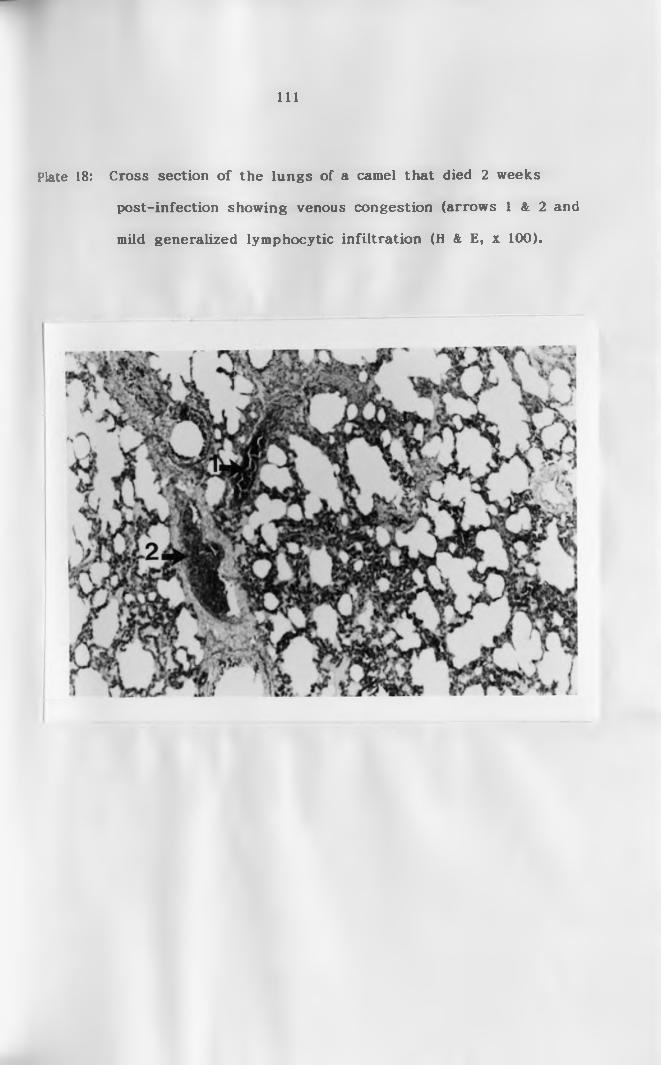
I l l
post-infection showing venous congestion (arrows 1 & 2 and
mild generalized lymphocytic infiltration (H & E, x 100).
Plate 18: Cross section o f the lungs o f a camel that died 2 weeks

112
Plate 19: Cross section of the kidney of a camel that died 2 weeks
post-infection showing marked venous congestion (arrows)
(H & E, x 100).
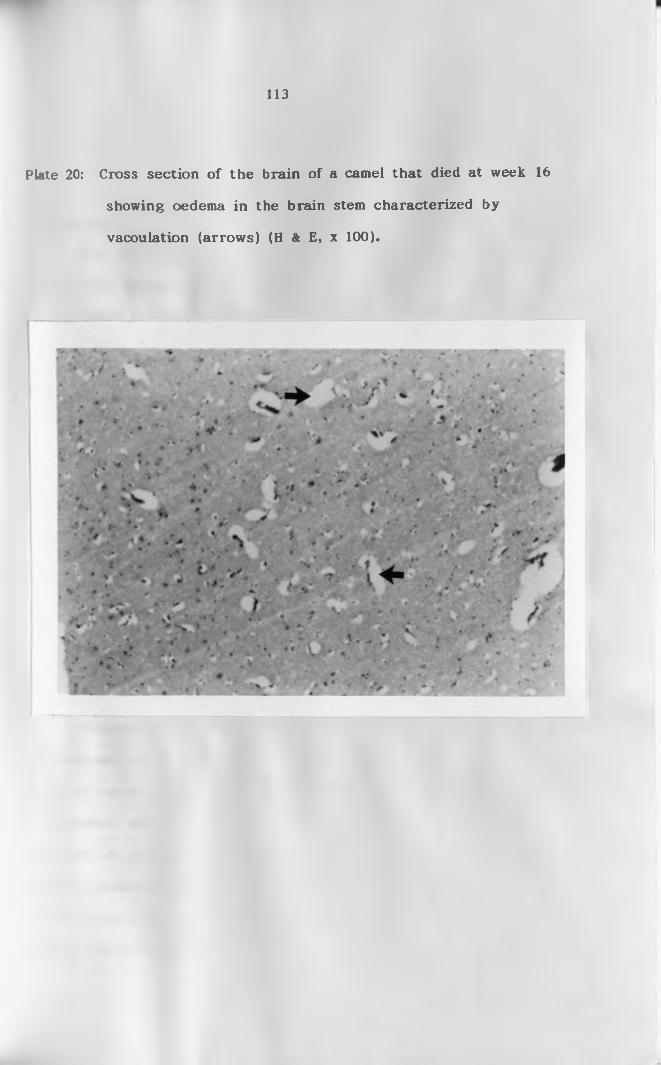
113
showing oedema in the brain stem characterized by
vacoulation (arrows) (H & E, x 100).
Plate 20: Cross section o f the brain o f a camel that died at week 16

114
CHAPTER FIVE
DISCUSSION AND CONCLUSION
S.l Discussion
Since the review of Gatt-Rutter (1967), little has changed to
diminish the importance of T.evansi infection on the well being o f the
world’s camel population (Boid et al., 1985), necessitating more impetus
to be put in the areas of camel clinical pathology, immunology and
related disciplines in order to elucidate the diagnosis and therapeutic
management in the control of this important disease. Clinical
manifestation o f T.evansi infection in camels in this study showed
significant evidence of changes in health, haematological, biochemical and
pathological status.
All infected camels in this study developed an acute or subacute
disease, 7 days post infection which was characterized clinically by
inappetance, dullness, heavy parasitosis, pyrexia, excessive lacrimation,
enlargement of superficial lymph nodes, reduction in packed cell volume
and death. Similar signs have been reported elsewhere (Stephen, 1970;
Losos, 1980; Higgins, 1983).
Trypanosomiasis is usually characterized by fluctuation of
parasitaemia as evidenced by the infected, non-treated camels that
survived up to the end of the study. Relapsing parasitaemias are either
accompanied with or without pyrexia. In this study, trypanosomes
appeared in peripheral circulation in large numbers initially, thereafter
parasite numbers were often low and sometimes difficult or impossible to
detect using BCE or Ml. The appearance of swarming parasites in blood
without marked external symptoms o f the disease occurred during the
115
first stage of T.evansi infection in a course o f 5 stages (Pease, 1906).
Persistent high rectal temperatures, in the present study, were
observed from day 7 for a period of 3 consecutive days following
intravenous inoculation of trypanosomes and thereafter, fever fluctuated
coinciding with or immediately after parasitaemia, especially in the
infected non-treated camels.
Theiler (1906) reported that the shortest incubation period in
T.evansi infection was 3 days after which the temperature rose and the
parasites appeared. A fever which persisted for some days and then
disappeared was noted. The same phenomenon was repeated several
times. Similar observations were made in this study, especially in the
infected non-treated camels. The same findings have been observed in
other camel studies by several workers (Pease, 1906; Mahmoud and
Osman, 1979). These series of exacerbations and remission o f the
temperature curve are characteristic of trypanosomiasis and are typical
picture in animals suffering from trypanosome infection (Losos, 1980).
Thus, the present study has demonstrated the principal clinical signs of
trypanosomiasis, i.e., fever and relapsing parasitaemia.
Trypanosomiasis in camels is a slow wasting disease that is
protracted over 2 to 4 years. In the natural disease, the mortality rate
is around 3% (Gatt-Rutter, 1967). In the current study the disease
caused approximately 80% mortality in the infected non-treated group.
This agrees with the observation that trypanosomiasis in the camel is
nearly always fatal. If untreated, the disease produces over 90%
mortality (Luckins, 1992). Mahmoud and Osman (1979) also reported
rapid deaths in some camels infected with T.evansi. Verma and Gautam
(1978) observed subacute and chronic form of the disease in buffalo and

116
cow calves. The high mortality rate is reduced greatly by intervention
with trypanocides. According to Gatt-Rutter (1967), acute disease may
resemble that seen in anthrax, blackquarter and pasteurellosis. The
course of the disease manifested in the present study was an acute one
with three out o f four infected non-treated camels dying within 4
months. Several other authors have managed to reproduce both acute
and subacute diseases in the camel (Leese, 1927; Alongi and Balboni,
1935). The factors that determine the course the disease takes are
many, but the host-parasite relationship, nutritional status, age,
concomitant infection, immunosuppression and prevailing level of stress
are considered important (Losos, 1980; Rottcher et al., 1987). In this
study the manifestation of the acute disease could have been related to
the dose of the trypanosomes used to infect the camels (2 x 10⁷
trypanosomes/camel), the route o f infection (intravenous) or the
virulence of the trypanosome strain used. Pease (1906) noted an
extremely variable course of T.evansi infection in camels. The author
observed that in some cases the course was rapid taking only a few
months. In others he noted a more chronic form, the camels living and
remaining in fair condition for long periods. Camel keepers have
sometimes given accounts of the disease lasting only a week and seldom
exceeding 4 months. Camels under natural challenge usually receive a
lower inoculum dose from the biting flies and the route of infection is
usually intradermal. Thus, the level of parasitaemia in these field
animals is lower compared to what was shown in the current experiment.
From this study and other previous work, it is apparent that while
T.evansi infection in camels generally takes a chronic form, the acute
or subacute forms also occur.
117
Parasites disappeared following treatment within 24 hours as
demonstrated by mouse inoculation and buffy coat examination. There
were no relapse infections throughout the study period. The
disappearance of the trypanosomes from peripheral blood in this study
is similar to that reported by other workers (Otsyula et al., 1992;
Nyang’ao et al., 1992). There were no relapses in the camels in the
present experiment as in previous studies done in the field where
relapse parasitaemia occurred following treatment with Cymelarsan
(Zellecke et al., 1989; Otsyula et al., 1992). Under field conditions camels
are usually under constant exposure to trypanosome challenge from the
reservoir animals by the biting flies and therefore it may be difficult to
differentiate relapse from new infections. Relapses o f T. evansi
infections in camels treated with other trypanocides especially the
recommended drugs, quinapyramine and suramin, have been shown to
occur (Mahmoud and Osman, 1979; Luckins et al., 1979; Schillinger et al.,
1984). These other drugs do not cross into the occult sites of the body
in high enough concentrations to effect cure. Thus, the trypanosomes
remain in hiding and eventually relapse into peripheral circulation.
Cymelarsan, being an arsenical, can cross into the occult sites and clear
all the trypanosomes that could be hiding there. Thus, in this study
Cymelarsan could have crossed into the hiding sites and cleared any
trypanosomes present there as evidenced by disappearance of
parasitaemia and antigenaemia in the treated camels.
A number of workers have found normal blood values for the
dromedary camel as shown in appendix II. The pre-infection PCV values
o f 28.1 ± 0.3 determined in the present study is in reasonable agreement
with the results established in several previous studies (Lakhotia et al.,
118
1964; Abdelgadir et al., 1979; Banerjee et al., 1962; Ghodsian et al., 1978;
Higgins and Kock, 1985). However, these authors’ values and those
established in the current study are lower than those reported by
Raisinghani et al. (1980) and Soliman and Shaker (1976). Soliman and
Shaker (1976) gave a PCV range of 42.9 to 44 in the blood o f adult she
camels in India, while Raisinghani et al. (1981a) also working with Indian
camels gave a range of 30 to 31. These high PCV values could be
attributed to differences in the breed of camel and the geographic
location.
Anaemia is an inevitable consequence of trypanosome infection
(Murray and Dexter, 1988). This is well demonstrated in the present
study, where the PCV, Hb and RBC were all reduced following infection.
The best indicator for anaemia was PCV which dropped rapidly in both
groups from the pre-infection mean of 27% to 23% within 3 weeks.
Similar observations have been reported by Jatkar and Purohit (1971) in
camels and mice. According to Murray and Dexter (1988) this rapid drop
o f PCV is always correlated closely with the appearance (height and
duration) o f parasitaemia. The degree and severity of anaemia in the
current study was closely associated with the development of
parasitaemia such that in the first three weeks when parasites were
always present in the peripheral circulation, PCV drop was rapid.
Subsequent drop in the PCV of the infected non-treated camels in this
study was not as rapid as that in the first three weeks. The level of
parasitaemia was also scanty. In one review, Murray and Dexter (1988)
showed that the initial rapid fall o f PCV that accompanies the first wave
of parasitaemia is the first phase of anaemia in trypanosomiasis, while
the second phase is characterized by absence or scant parasites. In
119
the infected and treated camels the PCV levelled o ff at week 6 and
remained constant (at an average o f 24%) to the end of the experiment,
unlike in the non-treated camels where the PCV continued to fall. The
non-treated camels, thus, progressed into phase two of the disease
syndrome (Murray and Dexter, 1988). The PCV in the treated camels,
however, did not rise to pre-infection level by the end of the study as
observed in bovine that complete recovery of PCV occurs within 2 to 4
months. The slow rate of recovery of the red blood cells and PCV in
this study could be due to the susceptibility of the animals to T. evansi
infection as shown in certain cattle breeds which are susceptible to
tsetse-borne trypanosomiasis such as the zebu (Murray and Dexter,
1988).
The pre-infection RBC level o f 8.7 ± 0.5 reported in this study
follows a similar pattern and in agreement with that reported by other
workers and compares well with previously established values. Banerjee
et al. (1962) reported that the average number of erythrocytes present
in blood samples o f dromedaries they examined was 6 to 9 x 10⁶/ml. A
similar range has been recorded in the present study and by Al-Ali et
al. (1988), Abdelgadir et al. (1979), Ghodsian et al. (1964), Lakhotia et al.
(1964) and Higgins and Kock (1985). However, Majeed et al. (1980) and
Soliman and Shaker (1976) presented RBC results which were lower than
those reported here and by other workers. Majeed et al. (1980) showed
that RBC values were influenced by seasons such that during winter
they recorded a higher value of RBC levels than in other seasons.
The pre-infection Hb level (11.6 ± 0.3) presented in the current
study was lower than that established by most investigators. It is in
agreement with the values established by Lakhotia et al. (1964),
120
Ghodsian et al. (1974) and Abdelgadir et al. (1979). A significant fall in
RBC numbers and haemoglobin content was observed in group A and B
camels in the first three to four weeks after infection. The fall followed
a similar pattern to that of the drop in the PCV. The recovery o f RBC
was observed in the treated group in week 11.
Anaemia in trypanosomiasis has been attributed to various causes
such as haemodilution, extravascular hemolysis and hemolysis due to
toxins from the trypanosomes and bone marrow failure (Holmes, 1976;
Dargie et al., 1979; Murray et al., 1980; Jenkins and Facer, 1985). For
one to determine the cause of anaemia it is important to monitor
erythropoietic activities in the bone marrow, spleen and liver. Dargie et
al. (1979) showed that there was an increase in erythropoietic activity in
animals infected with trypanosomes and concluded that the anaemia
observed was due to the extravascular destruction of erythrocytes
rather than inhibition of haemopoietic activity. In the present study
bone marrow activity was not monitored hence it is difficult to determine
what the cause o f anaemia was.
Normal total WBC value of 13.6 ± 2.9 obtained in this study was in
excellent agreement with nearly all the normal values published by
previous workers. The results are only in disagreement with the values
established by Higgins and Kock (1985) who showed the normal range of
total WBC for dromedary camel to vary from 2.9 to 9.7 x lCP/ml.
According to these authors, occasionally the number of white cells in the
blood of clinically normal adult dromedary camel can be very low.
However, the camels these authors used were not kept in their
traditional environment, and this could have been the cause for the low
WBC encountered in their study. A comparison of the differential
leucocyte counts obtained in this study with those of other authors
reveal that the mean pre-infection differential counts fall within the
generally established normal ranges (Appendix II). The predominant
white blood cells in this study were the lymphocytes, followed by
neutrophils. The ratio between the lymphocytes and neutrophils was
about 1:1 (Table 6). This has also been shown by Majeed e t a l .
(1980). Monocyte and eosinophil percentages in the current study were
relatively low when compared to other previous studies. This could
have been due to environmental or breed influences.
In this study significant leukopenia was observed during the first
peak o f parasitaemia which occurred concurrently with the development
o f anaemia. The reduction in the total WBC was more pronounced in
group B camels and occurred up to the second week. This concurrent
reduction in the total WBC and onset of anaemia has been documented
by several authors in different animal species (Welde et al., 1974; Valli
and Mills, 1980). Anosa and Isoun (1980) also found that the maximum
drop in the total WBC counts of sheep and goats infected with T.vivax
took place during the acute phase of the disease. Thereafter, the
leucocyte numbers recovered steadily until the end o f the experiment.
In the present study, the leukocyte numbers recovered more rapidly
and leucocytosis which developed peaked in the fourth week. The
leucocytosis in the infected camels in the current study was due to
lymphocytosis as they are the only cellular population that increased
significantly in the observation period. Similar results have been
reported by Valli and Mills (1980) who demonstrated that lymphocytosis
was responsible for the rise in the total leucocytes in animals infected
with trypanosomes. The leucocytosis observed during this study is in
121

122
agreement with the findings o f Jatkar and Purohit (1971) in camels and
mice.
Several studies have been carried out to establish the normal
enzyme activity, but there is sparse data on values of trypanosome
infected camels. The enzymes assayed in this study included alkaline
phosphatase (AP, EC 3.1.3.1), creatine kinase (CK, EC 2.7.3.2J, alanine
aminotransferase (ALT, EC 2.6.1.2, previously SGPT), aspartate
aminotransferase (AST, EC 2.6.1.1, previously SGOT) and lactic
dehydrogenase (LDH, EC 1.1.1.27). These enzymes can be organ specific
or occur in one tissue in a much higher concentration that in another.
AP, which catalyses the dephosphorylation o f ATP, is located in
most cells, but has high specific activity in the brush borders o f the
intestines, in the bones, kidneys, placenta and liver. Serum AP activity
has diagnostic value o f hepatic and bone diseases in dogs and cats
(Cole, 1986; Duncan and Prasse, 1986). In large animals it has a broad
range o f references, and therefore may not be diagnostic. The normal
values o f AP of 8.2 IU/1 ± 2.9 in racing camels was obtained by
Beaunoyer (1992). This level of activity is in reasonable agreement with
the pre-infection value of 11.4 IU/1 ± 1.8 obtained in this work. These
values are however, higher than those established by Al-Ali et al. (1988)
of 6.3 IU/1 ± 0.1. Boid et al. (1980a) and Eldirdiri et al. (1987) obtained
much higher values (31.5 IU/1 ± 9.1 and 34.8 IU/1 + 10.3 respectively)
than that reported in the present study and by other authors. AP in
the infected camels in this study declined gradually in the first two to
three weeks after infection. The same observation was reported
previously by Goodwin and Guy (1973) and Boid et al. (1980b). The
cause o f the fall of AP during patent parasitaemia is not known. After
123
ihe fail, there was an increase in the AP activity from the third week in
the present experiment. Considering severe haemorrhage in the
intestines and cardiac muscle, there could have been damage of these
two tissues which would have resulted in the increase in the AP level as
from week 3 onwards. Beaunoyer (1992) could not show significant
changes in AP after exercise in racing camels. In the present study,
following treatment, the difference in AP between groups B and C was
not as marked as that between groups A and C. Thus, the infection
caused damage in the intestines, kidneys and liver o f the infected non-
treated group of camels as shown by the gross pathology and
histopathology of the camels that died.
Aspartate aminotransferase (AST) catalyses the transamination of
L-aspartate and 2-oxalogutarate to oxaloacetate and glutamate,
respectively. Presence of AST in many tissues makes serum levels of
this enzyme a good marker o f soft tissue damage (Cole, 1986; Kaneko,
1989). AST is considered as a diagnostic enzyme for liver and muscle
disease because of its high activity in these organs. Serum AST
activity also increases with changes in muscular permeability (sublethal
injury and necrosis) so it is used as a diagnostic aid in neuromuscular
disorders o f domestic animals (Kerr, 1989). The plasma level of AST of
5.9 IU/1 + 0.4 recorded in this study is within the normal range as that
reported by Eldirdiri et al. (1987) and Al-Ali et al. (1988), but lower
than that of 11.0 IU/1 ± 1.7 reported by Beaunoyer (1992). AST is
mostly bound to the mitochondria and therefore marked elevation in the
blood indicates serious cell damage if the cause of elevation is cell lysis
(Beaunoyer, 1992). In the current study there was a marked increase in
AST activity in group B by the third week. The rise closely followed
124
the first peak parasitaemia. Raised levels of serum AST have also been
reported in cattle infected with T.congolense (Welde et al., 1974), in
horses with myocardial lesions and in rabbits infected with T.brucei
(Goodwin and Guy, 1973). The elevated levels o f AST can thus be
attributed to the host cell damage by trypanosomes especially, as it was
closely associated with massive parasitosis. The cell damage caused by
trypanosomes of the brucei group is mainly in connective tissue,
including perivascular tissue (Goodwin, 1970). The vascular damage
probably results in a fall in pH sufficient to activate lysosomal enzymes
thereby causing further tissue damage (Goodwin, 1970). The change of
AST observed in this study seemed to relate to host parasitaemia as the
levels started to decline and return to normal after treatment of group
B with Cymelarsan, which quickly cleared the trypanosomes from
circulation. The same was observed in camels following treatment with
quinapyramine sulphate and suramin by Boid et al. (1980b). According
to Boid et al. (1980b), AST increase occurs in the second step of
pathological process that occurs after the acute crisis. The increase of
AST level in this study can be attributed partly to cellular damage
caused by trypanosomes and partly to trypanosome lysis (Gray, 1963).
The latter could be the cause of the rapid principal increase in AST
activity since it occurred immediately following treatment in group B
camels.
Alanine aminotransferase (ALT) catalyses the reversible
transamination of L-alanine and 2-oxaloglutarate to pyruvate and
glutamate (Cole, 1986). This enzyme is a specific indicator o f liver
damage in primates, dogs, cats, rabbits and rats (Cole, 1986; Kaneko,
1989). ALT in tissues of large animals is too low to be o f diagnostic
125
value. The pre-infection ALT value o f 2.02 IU/1 ± 0.01 compares well
with that o f Boid et al. (1980b) and Eldirdiri et al. (1987). The ALT
levels remained low following infection in the present study. Gray
(1963) and Boid et al. (1980b) found elevated levels of serum ALT in
cattle infected with T.vivax and camels infected with T.evansi,
respectively. According to Gray (1963) the increased serum level o f this
enzyme was due to release of trypanosomal ALT into circulation after
destruction o f the trypanosomes by the host. T.evansi contains ALT:AST
in the ratio 5:1. It would be expected that destruction of T.evansi by
the camels immune system in the two studies would produce an increase
in serum ALT that was observed by Gray (1963) and Boid et al. (1980b).
The observations made in the present study do not seem to support the
observations o f the these authors.
Creatine kinase (CK) catalyses the reversible phosphorylation of
creatine by ATP to form creatine phosphate, required by muscles. CK is
found in many types of cells, but has highest specific activity in
skeletal muscle, cardiac muscle and brain (Cole, 1986; Kaneko, 1989). CK
is a sensitive indicator o f muscle damage (Kerr, 1989). The pre-infection
CK value obtained in the present study of 54.7 IU/1 ± 1.5 was higher
than that obtained in previous studies, of 35.6 IU/1 ± 9 (Al-Ali et al.,
1988), but less than that recorded by Beaunoyer (1992) in racing camels,
of 81 IU/1 ± 7. Following infection, there was a slight decline o f CK
activity in groups A and B camels up to the second and third weeks,
respectively. Thereafter, the CK activity in these two groups of camels
was significantly higher than the pre-infection values and those of
control camels. The levels did not return to pre-infection level until
week 14 in both groups. The increase in the infected non-treated
126
group (A) was very rapid while that of infected and treated camels was
gradual. CK, being a sensitive indicator of muscle damage, the rapid
increase in its activity could imply that there was muscle damage; the
damage being more severe in group A than B camels. Studies on
exercise stress on racing camels also showed a significant increase in CK
a few hours following exercise (Beaunoyer, 1992) and the levels did not
return to pre-excrcise levels until 36 hours later.
Lactic dehydrogenase (LDH) catalyses the reversible oxidation of
pyruvate L(+)-lactate with co-factor NAD in all tissues. Elevated LDH
activity is associated with skeletal muscle, liver and heart damage
(Kaneko, 1989; Cole, 1980). The normal level of LDH recorded in the
present work was 136.6 IU/1 ± 5.8. This value is lower than that
recorded in all other previous studies. Al-Ali et al. (1988) recorded
the normal LDH value o f 262 IU/1 ± 15, Eldirdiri et al. (1987) obtained a
value o f 344 IU/1 ± 98, while Beaunoyer (1992) reported a much higher
value of 427 IU/1 ± 26. Following infection, LDH increased in camels of
groups A and B even though the increase was not statistically
significant. The increase in the infected group could mean that the
trypanosomes caused tissue damage in these two groups of camels. The
increase in group A camels was higher than that of group B camels,
which could imply that the trypanosomes in the untreated group of
camels caused protracted severe muscle damage. Group B camels were
treated, thus stopping the trypanosomes from causing further damage.
Urea nitrogen (often called blood urea nitrogen) is formed in the
liver and represents the principal end product of protein catabolism.
Clinically, urea nitrogen is commonly used as an indicator of renal
function in most animals. The main causes for increase in urea nitrogen

127
concentration are dietary and renal insufficiency (Cole, 1986; Kerr, 1989).
The dietary causes o f increased urea nitrogen levels are excess dietary
protein and carbohydrate deficiency. The causes of renal insufficiency
include poor renal perfusion due to fairly severe dehydration or cardiac
insufficiency or renal failure. Catabolic breakdown of tissues as a
consequence of fever, trauma, infection or toxaemia may also result in a
moderate increase in urea nitrogen concentration (Cole, 1986). The pre-
infection value obtained in the current experiment was comparable to
that recorded by Higgins and Kock (1985). Following infection, the urea
nitrogen levels in group A camels fell gradually to the ninth week and
then rose to above the pre-infection level up to the end of the
experiment. In group B camels there was an increase to the second
week then a gradual fall up to the end of the study. In this
experiment, the catabolic breakdown of tissues could have been the
cause of the moderate increase o f the urea nitrogen. Thus, in both
groups, there was an overall increase of urea nitrogen above the pre-
infection level and the levels in control camels. The increase in the
urea nitrogen was slight in both infected groups of camels and lasted a
few weeks. In group B camels the increase occurred during the pyrexic
period. This could mean that there was tissue breakdown during this
period that resulted in the moderate increase in urea nitrogen.
Following treatment, the urea nitrogen in group B camels fell gradually
to the pre-infection level. In group A camels there was a rise from the
ninth week to the end o f the experiment. In this group of camels the
cause of increased urea nitrogen concentration could have been damage
of kidney parenchyma that resulted in decreased renal perfusion.
Histopathological examination o f the kidneys showed some areas with

128
marked venous congestion and severe haemorrhages. This could cause
damage of kidney parenchyma which could have resulted in decreased
glomerular filtration rate and, thus, an increase in the urea nitrogen
concentration.
The pre-infection level of total proteins in this experiment of 5.4
g/dl ± 0.4 is in excellent agreement with the data of several other
authors (Ghodsian et ah, 1978). Following infection, total protein
concentration increased above the normal values. The elevation o f total
serum proteins in the present study was attributed solely to
hyperglobulinaemia, since the level of albumin in the infected camels
remained nearly constant, with very slight increase compared to the
controls. There was elevated globulin concentration from the second
week. This elevation of globulins could be attributed to the antibody
response stimulated by the trypanosomal antigens. This is further
supported by the high levels o f total proteins in the infected camels
when compared to the control camels from the second week which is the
time taken for free antibodies to be detected in circulation (Boid et al.,
1980b). The globulin levels increased significantly during infection and
this agrees with the observations of Jatkar et al. (1973) and Boid et al.
(1980a). The increased total protein levels in the present study refutes
earlier studies by Jatkar et al. (1973) that indicated no changes in total
protein.
In general, even though the established pre-infection biochemical
and haematological values in this study are broadly in agreement with
the normal values reported by other workers in literature, the few
discrepancies in present findings and those o f other authors could be
attributed to age, sex, breed of camels used, nutrition, husbandry and

129
geographical location, since these are some of the factors that have been
shown to influence haematological and biochemical profiles of animals.
Other factors that could cause the differences are variations in sampling
procedures and analytical techniques for determining these parameters,
especially the techniques used for enzyme assay. Following infection,
there was a marked increase of some enzyme activity notably AP, AST,
CK and LDH. These enzymes have been shown to increase in other
studies and may be regarded as the most important diagnostic enzymes
during pathological changes in the dromedary camels. The increase of
the enzyme activity in this study was recorded from the third and
fourth week. This could be the time when trypanosomes are invading
various tissues from peripheral circulation.
Circulating antigens were detected as early as one week after
infection. Rae and Luckins (1984) found that in goats experimentally
infected with T.vivax, T.brucei and T.evansi circulating antigens were
found within 10 to 14 days which is in agreement with the present
study. Other authors have demonstrated circulating antigens as early
as 6 days post infection (Nantulya et al., 1989a). During the first peak
o f parasitaemia (first week) circulating antigens were demonstrated in
only three camels. This is the phase when trypanosomes are dividing
and no sufficient parasite degradation occurs to produce detectable
antigens (Nantulya et al., 1989b). This could have been the reason why
antigens were not detected in the first week after infection in camel 156
that died during the acute disease and in the other five camels in which
the antigens were demonstrated in the second, third and fourth weeks.
After the acute phase, circulating antigens were initially detected in low
levels and increased with time in the two surviving camels in group A

130
and all the camels in group B. The peak OD Ag-ELISA value coincided
with the time of maximum parasite destruction. In the acute phase of
the disease, when parasitaemia is high and parasites are easily
demonstrated by microscopic examination, antigen ELISA test may not be
a very useful diagnostic tool because the antigens are usually
insufficient in circulation (Nantulya et al., 1989b). Ag-ELISA is most
important as a diagnostic tool in the chronic stage o f the disease
because that is when the parasites are scarce or even absent in the
peripheral circulation and are hard to detect. Thus, for diagnostic
purposes, parasitological diagnosis and Ag-ELISA assay should be used
to complement one another (Nantulya, 1990).
Following treatment o f group B camels there was a high elevation
o f circulating antigens. This was followed by a gradual decline of Ag-
ELISA OD values to pre-infection levels by an average of 63 days.
Several authors have found different periods o f the disappearance of
the antigens after treatment. Olaho-Mukani et al. (1992b) found no
detectable antigens in goats and camels 12 and 41 days after treatment,
respectively, while Rae and Luckins (1984) did not detect circulating
antigens 7 days following treatment in rabbits, and Liu et al. (1988)
observed that in treated monkeys antigens could not be detected as
early as 27 days. Individual camels had different periods of
disappearance of antigens in this study such that in some camels
antigens were not detectable by the third week and in one camel they
persisted to week 10 following treatment. It appears that after
treatment trypanosomes die releasing antigens into circulation. Many
are strong immunogens and immediately react with antibodies which had
been produced against them to form immune complexes. However, the
131
less immunogenic antigens or antigens whose epitopes remain exposed
are then detectable in circulation for some time after treatment (Olaho-
Mukani, 1989). Thus it would be expected that the serum levels o f such
antigens will be elevated for some time after the treatment of infected
animals. These are the antigens detected by Ag-ELISA. Sequential
assays of serum from such animals gives a decreasing profile of
antigens and thus a better post-treatment picture. The decline in
antigens to negative values after treatment in this study shows the
usefulness of the Ag-ELISA test in predicting chemotherapeutic success.
In the current study Ag-ELISA was successfully used to assess the
efficacy o f Cymelarsan in treatment of T.evansi infection in the
dromedary camels as shown in group B. Persistently detectable
circulating immune complexes in infected and treated animals for a long
period of time could indicate that there is impairment of clearance
mechanisms for immune complexes in this disease (Nantulya and
Lindqvist, 1989). This could have been the case in camel number 162
that had detectable antigens for about 10 weeks after treatment. In the
non-treated group, antigens remained detectable and above pre—infection
level until the end of the experiment. Antigenaemia in this group of
camels correlated well with parasitological findings, similar to
observations by Nantulya and Lindqvist (1989).
The negative Ag-ELISA OD values following treatment showed the
ability o f Cymelarsan to effect cure by clearing parasites in the
peripheral circulation and in the occult sites where other trypanocides
fail to reach in therapeutic concentrations (Jennings et al., 1979).
Antibodies were detected starting from the first week following
infection in some animals. The antibody levels showed less fluctuation

132
in group A camels while in group B camels there was a slight decline in
the Ab-ELISA values towards the end of the experiment but the level
remained higher than the pre-infection values. This indicates that
antibodies persisted over 100 days following treatment. This has been
documented by several workers (Olaho-Mukani et al., 1992b; Luckins et
al., 1978, 1979). Due to the persistence of antibodies to over 100 days
post-treatment, they are not a useful indicator of therapeutic efficacy.
The general post mortem picture in this study was a haemorrhagic
syndrome, especially in the camels that died o f the acute disease.
Generalized lymphadenopathy, enlarged spleen, depletion of fat from the
subcutaneous tissue and the coronary groove and the haemorrhages in
the cardiac muscles and the mucosa of the intestines have been reported
in camels by several other authors (Rottcher et al., 1987) and in horses
and donkeys (Ilemobade, 1971). Pease (1906) also recorded similar post
mortem findings which included considerably large quantities o f fluid in
the peritoneal and pericardial cavities, oedema of lungs, depletion of fat
in the usual fat depots and yellow gelatinous exudate under the skin.
Thus, in acute T.evansi infection, the expected pathological picture is
that o f haemorrhagic syndrome while in the chronic disease, it is a
wasting syndrome. Similar histological changes, especially in the brain,
have been recorded by Ilemobade (1971).

133
5.2 Conclusions
i ) The present study has established fairly comprehensive baseline
data for biochemical and haematological values o f the normal Kenyan
dromedary.
ii) The study has highlighted the salient feature o f the clinical
disease in the dromedary camel caused by T. evansi infection which can
be used to provide a provisional diagnosis of surra.
Hi) This study has demonstrated that T.evansi infection in camels
is fatal and that the disease can manifest itself as an acute syndrome
with camels dying within the first three weeks o f infection.
iv ) Anaemia was the main sequel of T.evansi infection in camels in
this study as demonstrated by a rapid fall in PCV, RBC and Hb within
the first three weeks following infection. Leucopenia was observed after
the acute disease. Post the acute disease leucocytosis, mainly due to
lymphocytosis, developed. Treatment reverted the haematological values
to normal.
v) There was evidence that the acute disease does not cause
marked changes in the biochemical profile, but that there is increased
activity of AP, AST, CK and LHD from the third week. This increase
could signify that it is during this time that the trypanosomes are
invading the tissues, thereby causing tissue damage which resulted in
increased enzyme activity. Total proteins and globulin were noted to
increase from the second week in all infected camels. Treatment caused
the levels of the biochemical parameters to return to normal.

134
vi) The main diagnostic enzymes in the dromedary as indicated by
this study are AP, AST, CK and LDH. Alanine aminotrasferase (ALT) is
not a very useful diagnostic enzyme in the dromedary due to its low
activity.
vii) Cymelarsan, the novel trypanocide used in this study, is
effective in the treatment of camels infected with T.evansL This was
indicated by the disappearance o f parasites, antigens and the animals
remained aparasitaemic for over 100 days following treatment. The
efficacy of Cymelarsan was further supported by improvement of the
health status, haematological and biochemical parameters o f the camels
subsequent to treatment.
viii) Antigen ELISA (Ag-ELISA) was shown to be an efficient test
in assessing the patent state of infection in camels and in evaluating
the success of therapeutic intervention.

135
REFERENCES
Abdelgadir S.E., Wahbi A.A. and Idris O.F. (1979). In Camels. Report No. 6, International Foundation for Science Provisional, Sweden, pp 348.
Al-Ali A.K., Husayni H.A. and Power D.M. (1988). A comprehensive biochemical analysis of the blood of the camel ( Camel us dromedarius). Comp. Biochem. Physiol. 89B. (1): 35-37.
Ali B.H., Hassan T. and Malik K.H. (1985). A Clinical evaluation of samorin in T.evansi infections in Camelus dromedarius. J. Vet. Pharmacol. Therap. 8: 208-210.
Alongi G. and Balboni A (1935). Clinical Vet. Milano. 58:110-131 (Cited by Gatt-Rutter 1967).
Anon. (1979). Manual o f Veterinary Parasitological Laboratory Technique. Technical Bulletin No. 18 Min. of Agric., Fisheries and Food, Agric. Dev. and Advisory Serv. HMSO, London.
Anosa V.O. and Isoun T.T. (1986). Haematological studies on T. vivax infection o f goats an intact and splenectomised sheep. J. Comp Pathol. 90: 155-168.
Arowolo R.D. and Ikede B.O. (1977). Susceptibility o f a rodent-adapted strain of T. vivax to berenil, suramin and novidium. Acta trop. 34: 61-64.
Balis J. and Richard D. (1977). Action trypanocide du chlorhydrate de chorure di’isometamidium sur Trypanosoma evansi et essai ole traitement de la trypanosomaise du dromadaire. Rev. Elev. Med. vet. Pays trop. 30: 369-372.
Banerjee S., Bhattacharjee R.C. and Singh T.I. (1962). Haematological studies in the normal adult Indian camel ( Camelus dromedarius). Am. J. Physiol. 203, (1): 1185-1187.
Barnett B.F. (1947). Bovine trypanosomiasis in Kenya with specialreference to its treatment with phenanthridium 897. Vet. Rec. 59: 459-463.
Beaunoyer D.E. (1992). Changes in serum enzyme activities after maximal exercise. In: Proceedings o f F irst International Camel Conference. 2nd-6th Feb. 1992, Dubai. (Eds. Allen W.K., Higgins A.J., Mayhew I.G., Snow D.H. and Wade, J.F.). R.W. Publications (Newmarket Ltd), pp. 331-333.
Bennett S.C.J. (1933). The control o f camel trypanosomiasis. J. Comp. Path, and Therap. 46: 67-77; 174-185.
Bennett S.C.J. and Kenny P.A.C. (1928). Mercuric chloride as adiagnostic agent for trypanosomiasis in camels: J. Comp. Path. Therap. 41: 341-353
136
Bidwell D.E. and Voller A. (1981). Malaria diagnosis by Enzyme-linked immunosorbent assay. Brit. Med. J. 284: 174-1748.
Boehringer E.G. and Prosen A.F. (1961). Transmission experimental del Mai de Caderas. An. Inst. Med. Region (Argentina) 5: 69.
Boid R., Mahmoud M.M. and Gray A.R. (1980a). Changes in the levels of some serum enzymes in dromedary camels infected with T. evansu Res. Vet. Sci. 28 (3): 336-340
Boid R., Luckins A.G., Rae P.F., Gray A.R., Mahmoud M.M. and Malik K.H. (1980b). Serum immunoglobulin levels and electrophoretic patterns o f serum proteins in camels infected with Trypanosoma evansL Vet. Parasit. 6: 333-345.
Boid R. Jones T.W. and Luckins A.G. (1985). The camel in Health andDisease. 3. Protozoal diseases of camels. Brit. Vet J. 141: 87-105.
Chand K. and Singh R.P. (1971). A study o f the clinical course o ftrypanosomiasis in goats, donkeys, dogs and rabbits experimentally infected with Trypanosoma evansL J. Res. (Ludhiana) 8(2): 270- 274.
Cole E.H. (1986). In Veterinary Clinical Pathology 4th Edition W. B. Saunders Company Philadelphia.
Cross H.E. and Patel P.G. (1922). Camel surra. Punjab Dept.Agricultural Veterinary Bulletin No. 8: 1-19
Currason G. (1943). Traite de protozoologie Veterinaore et comparee. 1 Trypanosomes. Paris (cited by Hoare, 1972).
Currason G.(1947). In Le chemae et ses Maladies vigot Freres. Paris.
Dargie J.D., Murray P.K., Murray Max, McIntyre W.I.M., (1979). The blood volumes and erythrokinetics o f N’Dama and Zebu cattle experimentally infected with Trypanosoma bruceL Res. Vet. Sci. 26: 245-247.
Davey D.G. (1950). Experiments with "Antrycide" in the Sudan and East Africa. Trans. R. Soc. trop. Med. Hyg. 43: 583-616.
Davey D.G. (1957). Chemotherapy o f animal trypanosomiasis withparticular reference to the trypanosomal disease of domestic animal in Africa. Vet. Rec. 3: 15.
De Jesus Z. (1951). Studies on the control of 'Surra’, V. Experiments on surra transmission. Natural Applied Science Bulletin 11: 191-207.
Dirie F.M., Wallbanks K.R., Aden A.A., Bornstein S. and Ibrahim M.D.(1989). Camel trypanosomiasis and its vectors in Somalia. Vet. Parasitol. 32: 285-291.

137
Duncan, J.R. and Prasse K.W. (1986). In Vetrinary Laboratory Medicine: Clinical Pathology. 2nd Ed. Iowa State University Press, Ames.
Dwivedi S.K., Gautam O.P. and Verma B.B. (1977). Study on serum transaminase activities in experimental Trypanosoma evansi infection if dogs. Ind. Vet. J. 54 (2): 108-110
Eldirdiri K.I., Suliman H.B. and Shommein A.M. (1987). Normal serum activities of some diagnostic enzymes in dromedary camel in Sudan. Vet. Res. Comm. 11: 201-203.
Evans G. (1880). Report on "surra" disease in Dera Ismail Khan district. Punjab Government Military Department, No. 493 pp 446. (Cited by Mahmoud and Gray, 1980)
FAO Animal Health Yearbook (1982). FAO Production and Health Book No. 19. Rome. Food and Agriculture Organization of the United Nations
Fazil M.A. (1977). The Camel. Bull. Anim. Hlth. Prod. Afric. 25: 434-442.
Gatt-Rutter T.E. (1967). Disease o f Camels: Protozoan diseases: Vet. Bulletin 37,(9): 611-618.
Ghodsian I., Nowrouzian I. and Schels H.F. (1978). A study on somehaematological parameters o f the Iranian Camels. Trop. Anim. Hlth. Prod. 10: 109-110.
Gibson W.C., Wilson A.J. and Moloo S.K. (1983). Characterization ofTrypanosoma (Trypanozoon) evansi from camels in Kenya using isoenzyme electrophoresis. Res. Vet. Sci. 34: 114-118.
Gill B.S. (1971). Resistance of Trypanosoma evansi to quinapyramine, suramin, stilbamidine and tryparsamide and analysis o f cross- resistance. Trans. R. Soc. trop. Med. Hyg. 65: 352-357.
Gill, B.S; Sen D.K. (1971). Studies on 'Surra’ VI: Therapeutic activity of Mel B, Diaminazene and 'T85’ in the equine infection ( T.evansi).Ind. J. Anim. Sci. 41: 743-746.
Godfrey D.G. and Killick-Kendrick R. (1962). Trypanosoma evansi ofcamels in Nigeria: A high incidence demonstrated by inoculationof blood into rats. Ann. Trop. Med. Parasit. 56: 14-19.
Goel S.K. and Singh R.P. (1970). J. of Research (Ludhiana) 7: 557-569. (cited by Mahmoud and Gray, 1980).
Goodwin L.G. (1970). The pathology of African Trypanosomiasis. Trans. R. Soc. Trop. Med. Hyg. 64 (5): 797-812.
Goodwin L.G. and Guy M.W. (1973). Tissue fluids in rabbits infected with Trypanosoma (Trypanozoon) brucei. Parasitology 66: 499-513.
Gray A.R. (1963). Exp. Parasitol. 14: 374. (cited by Boid et al., 1980a).

138
Henning D. and Nielsen K. (1987). Peroxidase labelled monoclonalantibodies for use in enzyme immunoassay. J. Immunoassay 81: 297-309.
Higgins A.J. (1983). Observation on diseases of the Arabian Camel( Camel us dromedarius) and their control - A review. Vet. Bull. 53 (12): 1089-1100.
Higgins A.J. and Kock R.A. (1985). A guide to the clinical examination, chemical restraint and medication of the camel. In The camel in health and disease, (ed. Higgins A.) Baillier Tindal, England, pp. 21-40.
Hoare C.A. (1954). The loss o f kinetoplast in trypanosomes with special reference to Trypanosoma evansL J. of Protozool. 1: 28-33.
Hoare C.A. (1956). Morphological and Taxonomic studies on mammalian trypanosomes. VIII. Revision on Trypanosoma evansL Parasitol. 46: 130-172.
Hoare C.A. (1965). Vampire bats as vectors and hosts of equine and bovine trypanosomes. Acta trop. 22: 204
Hoare C.A. (1972). In Trypanosomes o f Mammals: A zoological monograph. Blackwell Scientific Publication, pp. 555-593.
Holmes P.H. (1976). The use of radioisotopes tracer techniques in the study o f the pathogenesis of trypanosomiasis. In: International Atomic Energy Agency, Nuclear Techniques in Animal Production and Health, pp. 463-474. IAEA, Vienna.
Homeida A.M., El Amin E.A., Adam S.E.I. and Mahmoud M.M. (1981).Toxicity o f diminazene aceturate (Berenil) to camels. J. Comp. Path. & Therap. 91: 355-360.
Horchner F., Schonefeld A. and Wust B. (1983). Experimental infection of horses with Trypanosoma evanst Parasitological and clinical results. Ann. Soc. beige Med. trop. 63: 127-135.
Horgan E.S. and Bennett S.C.J. (1929). The mercuric chloride test for trypanosomiasis in camels. Mechanism of the reaction. J. Comp. Path. 34: 211-240.
Hunter A.G. (1986). Urine odour in a camel suffering from surra ( T.evansi). Trop. Anim. Prod. 18: 146-148.
Uemobade A.A. (1971). Studies on the incidence and Pathogenicity ofTrypanosoma evansi in Nigeria: II the Pathogenicity o f T.evansi for equine and bovine species. ISCTRC Publication No. 105. pp. 107-114
Jatkar P.R. and Purohit M.S. (1971). Pathogenesis of anemia intrypanosome infection. 1: Haematology. Ind. Vet. J. 48: 239
139
Jatkar P.R. and Singh M. (1971). Diagnosis of surra in camels by the passive haemagglutination test. Brit. Vet. J. 127: 283-288
Jatkar P.R. and Singh M. (1974). Pathogenesis of anaemia intrypanosome infection. IV. Blood Glucose studies. Ind. Vet J. 51: 710-714.
Jatkar P.R., Ghosal A.K. and Singh M. (1973). Pathogenesis o f anaemia in trypanosome infection III: Studies on serum proteins (Camelus dromedarius). Ind. Vet. J. 50 (7): 634-638.
Jatkar P.R., Rao P.V. and Singh M. (1977). Diagnosis of surra; capillary agglutination test. Ind. Vet. J. 54: 795.
Jenkins G.C. and Facer C.A. (1985). Haematology of African Trypanosomiasis. In Immunology and pathogenesis o f Trypanosomiasis. (Ed. I. Tizard) CRC Press, Inc. pp. 13-44.
Jennings F.W. Whitelaw D.D. and Urquhart G.M. (1979). The brain as a source of relapsing Trypanosoma brucei infection in mice after chemotherapy. Int. J. Parasit. 9: 381-387.
Jordan A.M. (1986). Trypanosomiasis control an African rural development. Longman, London
Kaneko J.J. (1989). In Clinical Biochemistry o f Domestic Animals (Ed. Kaneko J.J.) 4th Ed. Academic Press Inc.
Kelly S. and Schillinger D.(1983). Improved field diagnostic techniquefor trypanosomiasis by use o f a minicentrifuge. Vet. Rec. 113: 219.
Kerr M.G. (1989). In Veterinary Laboratory Medicine: ClinicalBiochemistry and Haematology. Blackwell Scientific Publications Oxford, pp. 67-137.
Khasanov F. and Ivanitskaya E.D. (1974). Experimental Nyi tripanomoz Melkogoragalogoskota. Trudy Uzbekskogo Naucho-Issledovatel skogo Veterinarnogo Instituta, 22: 98-100.
Killick-Kendrick R. (1964). The apparent loss of the kinetoplast ofTrypanosoma evansi after treatment o f an experimentally infected horse with berenil. Ann. trop. Med. Parasit. 58 (4): 481-490.
Killick-Kendrick R. (1968). The diagnosis of trypanosomiasis of livestock: A review o f current techniques. Vet. Bull. 38: 191-197.
Killick-Kendrick R. and Godfrey D.G. (1963). Bovine trypanosomiasis inNigeria II: The incidence among some migrating cattle. Ann. TropMed. Parasit 57: 117.
Kirmse P. and Taylor-Lewis G. (1978). Ticks as possible vectors o ftrypanosomes. In Tick borne diseases and their vectors (ed Dr. J. K. H. Wilde) University of Edinburgh, Lewis Printer Ltd, pp 177— 180.
140
Knowles R.H.Y. (1924). The formol-gel test as applied to camels affected with Trypanosoma soudanense. J. Comp. Path. & Therap. 37: 37-44.
Kraneveld F.C. and Djaenoedin R.(1949). Enige gegevens over het moment van binnendrigen van Trypanosoma evansi in de cerebrospinaal vloeistof bij paarden. Hemera Zoa 56:39-45. (cited by Horchner et al., 1983).
Lakhotia R.L., Bhargava A.K. and Mehrotra P.N (1964). Normal Ranges of some blood constituents of the Ind. Camel. Vet. Rec. 76:(4) 121— 122.
Lanham S.M. and Godfrey D.G. (1970). Isolation of salivariantrypanosomes from man and other mammals using DEAE-cellulose. Exp. Parasit. 23: 521-534.
Leach T.M. (1961). Observations on the treatment o f Trypanosoma evansi infection in camels. J. Comp. &. Therap. 71: 109-117.
Leese A. S. (1927): In A treatise on the one humped camel in health and in disease. Haynes and Son, Stamford, Lincolnshire.
Liu M.K., Pearson T.W., Sayer P.D., Gould S.S., Waitumbi J.N. and Njogu A.R. (1988). The detection o f circulating antigens in vervet monkeys infected with Trypanosoma brucei rhodesiense: a sensitive antigen trapping ELISA for immunodiagnosis of African sleeping sickness. Acta trop. 45: 321-330.
Losos G.J. (1980). Diseases caused by Trypanosoma evansi: a review.Vet. Res. Com. 4: 165-181.
Luckins A.G. (1992). Protozoal diseases of the camels. In: Proceedings o f First International Camel Conference. 2nd-6th Feb. 1992, Dubai. (Eds. Allen W.K., Higgins A.J., Mayhew I.G., Snow D.H. and Wade, J.F.). R.W. Publications (Newmarket Ltd), pp. 23-27.
Luckins A.G., Gray A.R. and Rae P. (1978). Comparison of the diagnostic value o f serum immunoglobulin levels, and enzyme linked immunosorbent assay and fluorescent antibody test in experimental infections with Trypanosoma evansi in rabbits. Ann. trop. Med. Parasit. 72 (5): 429-441.
Luckins A. G., Boid R., Rae P.F., Mahmoud M.M., El-Malik K.H. and GrayA.R. (1979). Serodiagnosis o f infection with T. evansi. in camels in Sudan. Trop. Anim. Hlth. Prod. 11: 1-12
Lumsden W.H.R., Kimber C.D., Evans D.A. and Doig S.J. (1979).Trypanosoma brucei miniature anion-exchange centrifugation technique for detection of low parasitaemia: adaptation for field use. Trans. R. Soc. trop. Med. Hyg. 73: 312-317.
Mahmoud M.M. and Gray A.R. (1980). Trypanosomiasis due toTrypanosoma evansi (Steel, 1885) Balbiani, 1888. A review o f recent research. Trop. Anim. Hlth. Prod. 12: 35-47.

141
Mahmoud M.M. and Osman O.M.(1979). A note on trypanosomiasis in Sudan camels. In Camels. Report No. 6, International Foundation for Science. Sweden, pp. 431-439.
Majeed M.A., Hur G., Rahman Z. and Ahmad A. (1980). Effect of sex and season on 10 haematological values of normal adult one humped camel. Rev. Elev. Med. vet. Pays. Trop. 33: 135-144.
Malik K.H. and Mahmoud M.M. (1978). Experimental Trypanosomacongolense and T. evansi infection: Diagnosis by immunofluorescent antibody test in Sudan. Sudan Vet. ScL Anim. Husb. 12: 35-57.
Molyneux D.H. (1975). Diagnostic methods in animal trypanosomiasis.Vet. Parasit. 1: 5-17.
Molyneux D.H. and Ashford R.W. (1983). In The biology o f Trypanosoma and Leishmania parasites o f man and animals, (eds. Taylor and Francis). London.
Murray M. and Dexter T.M. (1988). Anaemia in bovine African trypanosomiasis. A. review. Acta trop. 45: 389-432.
Murray M., Murray P.K. and McIntyre W.I.M. (1977). An improved parasitological technique for the diagnosis o f African Trypanosomiasis. Trans. R. Soc. Trop. Med. Hyg. 71: 325-326.
Murray Max, Morrison W.I., Emery D.L., Akol G.W.O., Masake R.A. and Moloo S.K. (1980). Pathogenesis of trypanosome infections in cattle. In: Isotope and radiation research on animal diseases and their vectors. International Atomic Energy Agency, IAEA-SM- 240/19, pp. 15-32.
Nakane P.K. and Kawoi A. (1974). Peroxidase labelled antibody. A new method of conjugation. J. Histochem. Cytochem. 22: 1084-1091.
Nantulya V.M. and Lindqvist K.J. (1989). Antigen-detection enzyme immunoassays for the diagnosis of Trypanosoma vivax, T. congolense and T.brucei infections in cattle. Trop. Med. Parasit. 40: 267-272.
Nantulya V.M., Bajyana-Songa E. and Hamers R. (1989a). Detection ofcirculating trypanosomal antigens in Trypanosoma evansi-infected animals using T.brucei group-specific monoclonal antibody. Ann. Trop. Med. Parasit. 40: 263-266.
Nantulya V.M., Lindqvist K.J., Diall O. and Olaho-Mukani W. (1989b). Two simple antigen-detection enzyme immunoassays for diagnosis of Trypanosoma evansi infection in the dromedary camel ( Camelus dromedarius). Trop. Med. Parasit. 40: 415-418.
Nantulya V.M. (1990). Trypanosomiasis in domestic animals: The problemof diagnosis. Rev. Sci. techn. off. int. Epiz. 9: 357-367.
142
Nieschulz, O. (1930) Surrauebertragungs versuche auf Java und Sumatra. Veeartsenijk meded. (Utreccut) No. 75 (cited by Mahmoud and Gray 1980).
Nyang’ao J.M.N., Olaho-Mukani W., Jeffries P.J., Omuse J.K. and Mutugi M.W. (1992). Efficacy o f the recommended therapeutic dose of CymelarsanH in treatment of natural Trypanosoma evansi infection in the dromedary camels ( Camel us dromedarius). In Kenya Vet.Ass. Annual Scientific Conference, April 1992, Nairobi, Kenya.
Olaho-Mukani W. (1981). Studies on epidemiology o f Trypanosoma evansi infection in selected areas o f Kenya. M.Sc. Thesis, University of Nairobi.
Olaho-Mukani W. (1989). Development and characterization o f monoclonal antibodies (MCABS) to Trypanosoma (Trypanozoon) brucei evansi and their application as immunodiagnostic reagents. PhD. Thesis, University o f Nairobi.
Olaho-Mukani W., Munyua W.K., Njogu A.R., Mutugi M.W and Otsyula M.(1992a). Trypanosomal antigen and antibody levels in field camels following treatment with two trypanocidal drugs. Trop. Med. Parasit. 43: 170-172.
Olaho-Mukani W., Munyua W.K. and Njogu A.R. (1992b). An enzyme-linked immunosorbent assay (ELISA) for the detection of trypanosomal antigens in goat serum using a monoclonal antibody. J. Immunoassay 13: 217-229.
Otieno L.H and Darji N. (1985). Characterization o f potential man-infective Trypanosoma brucei from an endemic area of sleeping sickness in Kenya. Trop. Med. Parasit. 36: 123-126.
Otsyula M., Kamar K., Mutugi M. and Njogu A.R. (1992). Preliminaryefficacy of Cymelarsan, a novel trypanocide, in camels naturally infected with Trypanosoma evansi in Kenya. Acta trop. 50: 271-273.
Ouchterlony O. (1964). Gel diffusion techniques. Immunological Methods (ed. J.F.Ackroyd). Blackwell Scientific Publication, Oxford, pp. 55- 75.
Pease H.T. (1906). Trypanosomiasis in camel. J. Trop. Vet. Sci. 4272: 70- 90. (cited by Olaho-Mukani, 1981).
Pegram R.G. and Scott J. M. (1976). The prevalence and diagnosis of Trypanosoma evansi infection in camels in southern Ethiopia.Trop. Anim. Hlth. Prod. 8: 20-27.
Pellegrini E. (1948). T. simiae ( Brucei) infection in camels. East African Agriculture J. 13: 207-209.
Rae P.F. and Luckins A.G. (1984). Detection of circulating antigens by enzyme immunoassay. Ann. Trop. Med. Parasit. 78: 587-596.
143
Raisinghani P.M., Bhatia J.S., Vyas U.K., Arya P.L. and Lodha K.R. (1980). Pathology of experimental surra in camels. Ind. J. of Anim. Sci.50: 966-969.
Raisinghani P.M., Lodha K.R., Bhatia J.S., Dwarkanath P.K. and Vyas U.K. (1981a). Variation in haematological and electrolyte levels during first 20 bouts of experimental surra in camels. Ind. J. Anim. Sci. 51: 724-729.
Raisinghani P.M., Lodha K. R., Bhatia J. S., Dwarkanath P. K. and Vyas U.K. (1981b). Note on some haematological & biochemical studies in experimental surra in camel. Ind. J. Anim. Sci. 51: 1108-1112.
Raynaud J.P., Sones K.R. and Friedheim E.A.H. (1989). A review of Cymelarsan* - a new treatment proposed for animal trypanosomiasis due to T. evansi and other trypanosomes o f the T. brucei group. In Proceedings of 20th meeting of ISTRC, April, 1989. Mombasa, Kenya.
Reveron I., Aso P.M., Herrera E.A., Giardina S., Sanso B. and Badaracco M.T. (1992). Isolation and serological studies o f Trypanosoma evansi from capybara (Hydroechoerus hydrochaeris). In First International Seminar on non-tsetse transmitted animal trypanosomes. Oct. 14-16, 1992. Annecy, France.
Richard D. (1979). Pathology and production of camels. In Camels.Report No. 6, International Foundation for Science. Sweden, pp. 409-430.
Rogers L. (1901). Transmission of Trypanosoma evansi by horse-flies and other experiments. Proceedings of Royal Society VLM LXVIII pp. 163-170.
Rottcher D., Schillinger D. and Zweygarth E. (1987). Trypanosomiasis in the camel. Rev. Sci. tech. off. int. Epiz. 6: 463-470.
Rutagwenda T. (1982). An attempt to introduce a comprehensive disease control package on specific disease and evaluation of the control on camel productivity in Ngurunit, Marsabit District, Northern Kenya. M.Sc. Thesis, University of Nairobi.
Salaheldin E.A., Abdelgadir A. W. and Idris O.F. (1979). A note onhaematology o f adult Sudanese Camels. In Camels. Report No 6, International Foundation for Science, Sweden.
Schillinger E., Maloo S.H. and Rottcher D. (1982). Chemotherapy o f camel trypanosomiasis: A report on field trials. Nairobi Cluster Seminar, ILRAD, June 1982.
Schillinger D., Maloo S.K and Rottcher D. (1984). Trypanosoma evansi endemic in dromedary herds in Kenya - drug resistance and chemotherapy. Tropenmedizin. Parasitologie, Gemeinsame Tangung, 22-23 April 1983 pp. 41-47.

144
Schillinger D., Maloo S.H. and Rottcher D. (1985). The toxic effect o fintravenous application o f isometamidium (samorin). Zlb. Vet. Med. A 32: 234-239.
Schwartz H.J., Dolan R. and Wilson A.J. (1983). Camel production in Kenya and its constraint: I. Productivity. Trop. Anim. Hlth. Prod. 15: 169-178.
Scott J.M. (1973). An interim report on bovine and camel situation inthe Negele Borana Region Sidamo. Addis Ababa Min. of Agric, Vet Dept pp. 7-51.
Sergent E., Sergent E.T. and Donatien A. (1920). Deuxieme note surI ’heredite de I ’ infection et de I ’ immunit’e dans la trypanosomiase des dromadaires. Bull. Soc. Path. Exot. 13: 525. (cited by Rottcher et al., 1987)
Shaw J.J. (1977). The epidemiology o f American surra with specialreference to Lower Amazon Region ( in Felis pedalis). Protozool.3: 119-128
Singh R.P., Vashishta M.S. and Kala C. (1980). In Diseases o f camels. India Seven Seas Hyderabad, pp 9.
Snedecor, G.W. and Cochran, W.G. (1982). "Statistical Methods". The Iowa State University Press - U.S.A.
Soliman M.K. and Shaker M. (1976). Cytological and biochemical studies on the blood o f adult she-camel. Ind. Vet. J. 44 (12): 989-995.
Soni B.K. and Aggrawala A.C. (1958). Studies in the physiology of the camel, Camelus dromedarius, Part I: Cellular blood constituents.Ind. Vet. J. 35: 209-214
Soulsby E.J.L. (1986). In Helminths, Arthropods and Protozoa of Domesticated Animals. 7th Ed. Bailliere Tindall, pp. 514-543
Srivastava R.P. and Alhuwalia S.S. (1972). Clinical observation on pigs experimentally infected with Trypanosoma evansu Ind. Vet. J. 49: 1184-1186.
Srivastava R.P. and Alhuwalia S.S. (1973). A note on the efficacy ofhomidium bromide and pyrithridium bromide against Trypanosoma evansi infection in the dog. Vet. Rec. 92: 260.
Stephen L.E. (1970). Clinical manifestation of trypanosomiasis in livestock and other domestic animals. In: The African Trypanosomiasis (ed H. W. Mulligan). George Alen and Unwin, pp. 784-786.
Thalhamer J. and Freund J. (1984). Cascade immunization a method ofobtaining polyspecific antisera against crude fractions of antigens. J. Immunol. Methods 66: 245-251.

145
Theiler A. (1906). Trypanosomiasis in camels. J. Trop. Vet. Sci. I: 295- 300. (cited by Olaho-Mukani, 1981).
Toro M., Leon M., Loper R., Pallot F., Garcia J.A. and Ruiz A. (1983).Effect o f isometamidium on infection of Trypanosoma vivax and T. evansi in experimentally infected animals. Vet. Parasit. 13: 35-43.
Valli V.O.E and Mills J.N. (1980). The quantitation o f Trypanosoma congolense in calves. I: Haematological changes. Tropenmed.Parasit. 31: 215-231.
Verma B.B. and Gautam O.P. (1977). Serological serodiagnosis ofexperimental Bovine surra ( Trypanosoma evansi infection). A comparison o f the passive haemagglutination, gel diffusion and indirect fluorescent antibody tests. Ind. Vet. J. 54 (10): 809-813.
Verma B.B. and Gautam O.P. (1978). Studies on experimental surra( Trypanosoma evansi infection) in buffalo and cow calves. Ind. Vet. J. 55 (8): 648-653.
Voller A. and De Savigny D. (1981). Diagnostic serology of tropical diseases. J. Immunol. Methods 46: 1-29.
Welde B.T., Lotzsch R., Deindl G., Sadun E., Williams J. and Warui G. (1974). Trypanosoma! congolense I. Clinical observation of experimentally infected cattle. Expt. Parasitol. 36: 6-19.
Wilson A.J. Dolan R. and Olaho M.W. (1981). Important camel diseases in selected areas of Kenya. IPAL/UNESCO Report E-6; Nairobi.
Wilson A.J. Schwartz H.J. Dolan R. and Olaho W.M. (1983). A simpleclassification o f different types of trypanosomiasis occurring in four camel herds in selected areas of Kenya. Tropen. medizin und Parasitologie 34: 220-224.
Wilson R.T. (1981). Management for Health and productivity, Diseasesand Parasites. In The Camel Longman group UK. Ltd. pp. 118-133.
Woo P.T.K. (1969). The haematocrit centrifuge for detection of trypanosomes in blood. Can. J. of Zool. 47: 921-923.
Yagi A.I. and Razig M.T.A. (1972). Seasonal abundance of Tabanidae(Diptera) in southern Darfur District of Sudan. Revu. Zool. Bot. Afri. Brux 86: 293-301.
Yagil R. (1982). Camels and Camel Milk. FAO Animal Production and Health paper No. 26. pp. 42, Rome.
Zellecke D., Kassa B. and Abebe S. (1989). Efficacy of RM 110 a novel trypanocide in treatment of Trypanosoma evansi infections in camels. Trop. Anim. Hlth. Prod. 21: 223-226.

146
Zweygarth E., Rottcher D. and Schillinger D. (1987). Failure ofTrypanosoma (N ) simiae to infect camels (Camelus Dromedarius). Acta trop. 44: 97-98.

147
APPENDICES
Appendix I: Mean daily temperature (°C) (±SD)of infected and control camels throughout the study.
Camel Groups
, Days P I A ( n=4 ) B ( n=5) C (n = 2 )
O.
3 6 .6 + .1 3 6 .9 + .4 3 6 .6 + .3
3 3 6 .7 + .5 3 6 .7 + .6 3 7 .2 + .8
4 3 7 .0 1 .6 3 7 .1 1 .9 3 6 .61 .4
5 3 7 .2 + .7 3 7 .5 + 1 .2 3 7 .5 1 .3
6 3 7 .2 + .2 3 7 .6 + .9 36 .9 1 .4
7 3 7 .5 + .5 3 7 .6 + .9 3 7 .6 1 .3
8 3 8 .4 + .9 3 7 .6 + .7 3 7 .6 1 .2
9 3 8 .6 + 1 .2 3 8 .0 + 1 .3 37 .41 .1
10 3 8 .9 + 1 .2 38 .2+1 .1 3 7 .41 .1
11 3 7 .8 + .9 38 .1+1 .1 3 6 .8 1 .3
12 3 7 .7 + .5 3 7 .4 + 1 .3 3 6 .6 1 .3
P 7 ”3 7 .1 1 .9 3 7 .3 + .7 3 6 .9 1 .1
14 3 8 .0 1 .4 3 6 .7 + .4 3 6 .1 1 .0
15L
3 8 .0 + 1 .0 3 6 .9 + .9 3 6 .41 .1
16 3 6 .4 + .4 3 7 .0 + 1 .0 3 6 .8 1 .3
17L
36. H . 4 37 .3 +1 .3 3 6 .7 1 .1
18L
3 6 .5 + .3 37 .4 +1 .3 3 6 .81 .1r
19 3 6 .8 + .7 3 6 .9 + .5 3 6 .41 .1
20|
3 7 .7 + .7 3 6 .2 + .6 3 6 .91 .1
21l—
3 8 .0 + 1 .3 3 6 .6 + .6 3 6 .8 1 .3
22u
3 6 .4 + .1 3 6 .4 + .5 3 6 .9 + .1
24 3 6 .5 + .1 3 6 .1 + .0 3 7 .21 .4
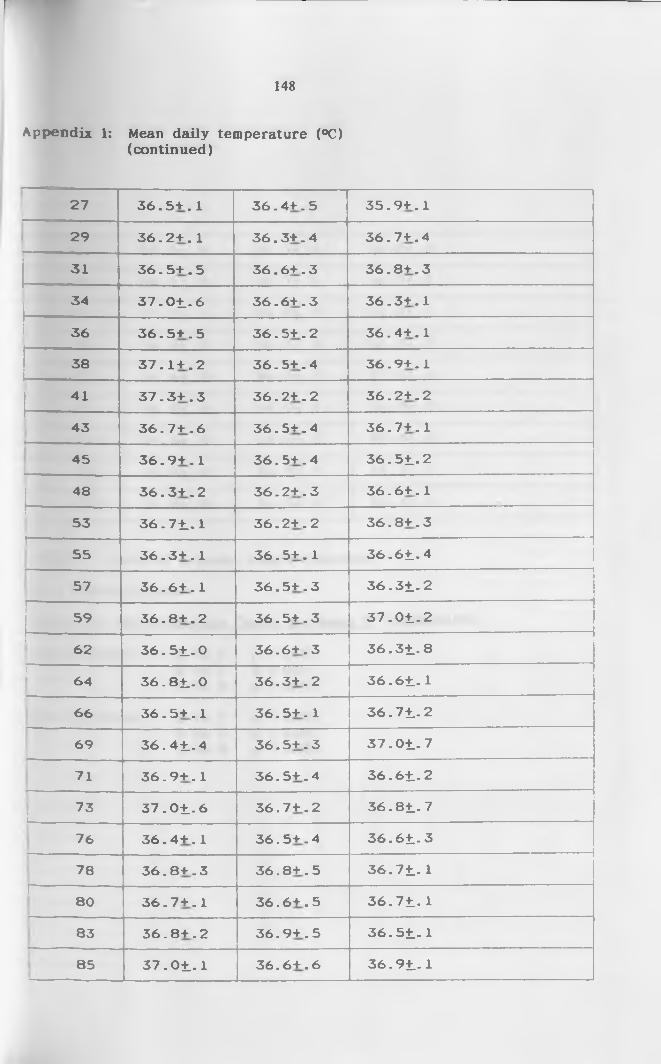
148
Appendix 1: Mean daily temperature (°C)(continued)
27 3 6 .5 + . 1 3 6 .4 + . 5 3 5 .9 + . 1
29 3 6 .2 + . 1 3 6 .3 + . 4 3 6 .7 + . 4
31 3 6 .5 + . 5 3 6 .6 + . 3 3 6 .8 + . 3
34 3 7 .0 1 . 6 3 6 .6 + . 3 3 6 .3 + . 1
36 3 6 .5 + . 5 3 6 .5 + . 2 3 6 .4 + .1
38 3 7 .1 + . 2 3 6 .5 + . 4 3 6 .9 + . 1
j__ li_ 3 7 .3 + . 3 3 6 .2 + . 2 3 6 .2 + . 2
43|
3 6 .7 + . 6 3 6 .5 + . 4 3 6 .7 + .1
45 3 6 .9 + . 1 3 6 .5 + . 4 3 6 .5 1 . 2
! 48 3 6 .3 + . 2 3 6 .2 + . 3 3 6 .6 + . 1—53 3 6 .7 1 . 1 3 6 .2 + . 2 3 6 .8 + . 3
I '----55 3 6 .3 + . 1 3 6 .5 + . 1 3 6 .6 1 . 4
57 3 6 .6 + . 1 3 6 .5 + . 3 3 6 .3 1 . 2
59 3 6 .8 + . 2 3 6 .5 + . 3 3 7 .0 1 . 2
62 3 6 .5 1 . 0 3 6 .6 + . 3 3 6 .3 1 . 8
1--------64 3 6 .8 1 . 0 3 6 .3 + . 2 3 6 .6 1 . 1
66 3 6 .5 + . 1 3 6 .5 + . 1 3 6 .7 1 . 2
69 3 6 .4 1 . 4 3 6 .5 + . 3 3 7 .0 1 . 7—71 3 6 .9 + . 1 3 6 .5 + . 4 3 6 .6 1 . 2
73I—
3 7 .0 1 . 6 3 6 .7 + . 2 3 6 .8 1 . 7
76 3 6 .4 + . 1 3 6 .5 + . 4 3 6 .6 1 . 3
78 3 6 .8 + . 3 3 6 .8 + . 5 3 6 .7 1 . 1r
80 3 6 .7 + . 1 3 6 .6 + . 5 3 6 .7 1 . 1
83 3 6 .8 + . 2 3 6 .9 + . 5 3 6 .5 1 . 1
85 3 7 .0 1 . 1 3 6 .6 + . 6 3 6 .9 1 . 1
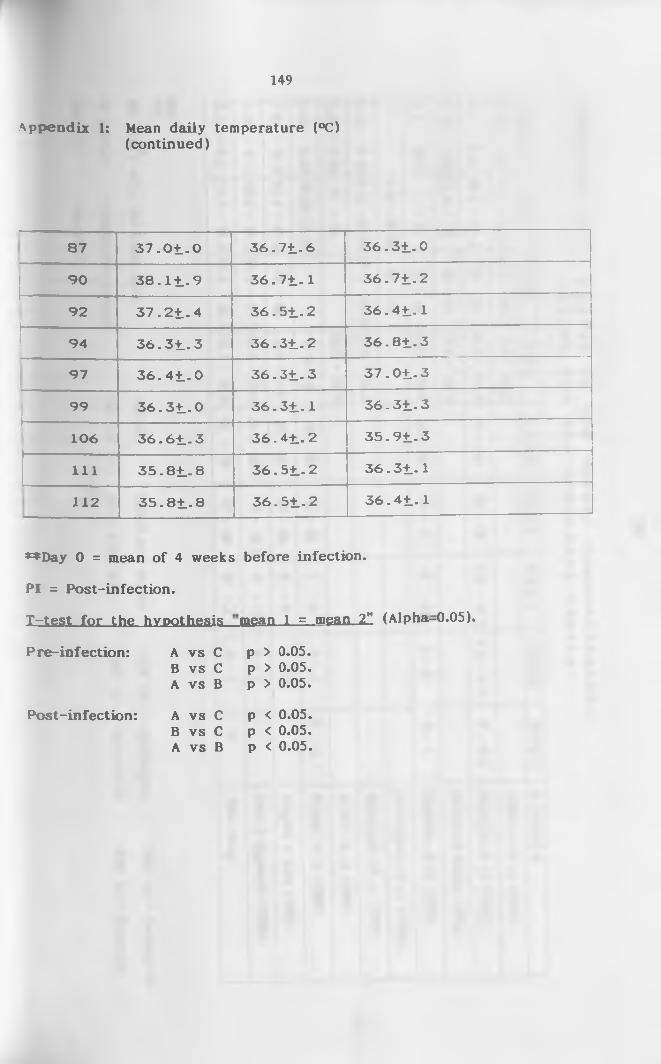
149
Appendix 1: Mean daily temperature (°C)(continued)
87 3 7 . 0 1 . 0 3 6 . 7 1 . 6 3 6 . 3 1 . 0
90 3 8 . 1 1 . 9 3 6 . 7 1 . 1 3 6 . 7 1 . 2
92 3 7 . 2 1 . 4 3 6 . 5 1 . 2 3 6 . 4 1 . 1
1 94 3 6 . 3 1 . 3 3 6 . 3 1 . 2 3 6 . 8 1 . 3
97 3 6 . 4 1 . 0 3 6 . 3 1 . 3 3 7 . 0 1 . 3
99 3 6 . 3 1 . 0 3 6 . 3 1 . 1 3 6 . 3 1 . 3I “ ----------------
106 3 6 . 6 1 . 3 3 6 . 4 1 . 2 3 5 . 9 1 . 3
111 3 5 . 8 1 . 8 3 6 . 5 1 . 2 3 6 . 3 1 . 1
112 3 5 . 8 1 . 8 3 6 . 5 1 . 2 3 6 . 4 1 . 1
♦♦Day 0 = mean of 4 weeks before infection.
PI = Post-infection.
X=tes.t_ for the hypothesis
Pre-infection: A vs CB vs C A vs B
Post-infection: A vs CB vs C A vs B
mean 1 = mean 2" (Alpha-0.05).
p > 0.05. p > 0.05. p > 0.05.
p < 0.05. p < 0.05. p < 0.05.
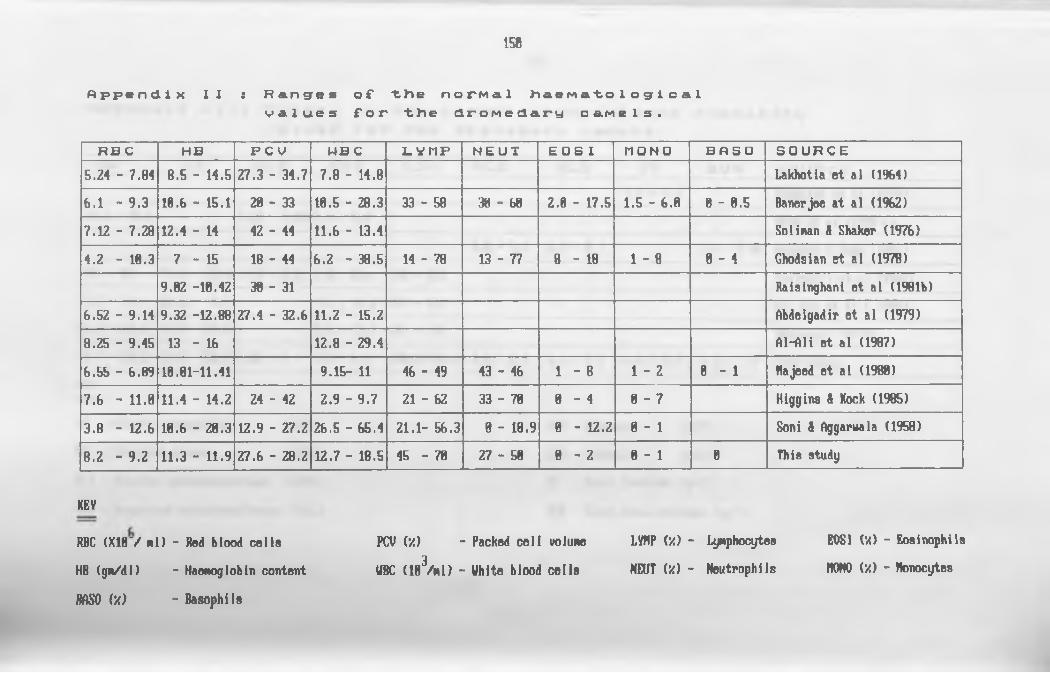
150
A p p e n d i x I I : R a n g e s of * - th e n o P M a l h a e M a t o l o g i c a lv a l u e s f o r "t)te d r o M e d a r y c a r t e l s .
R B C H B P C V M B C L V ( 1 P N E U T E O S I M O N O B f l S O S O U R C E5 .2 4 - 7 .8 4 8 .5 - 1 4 .5 2 7 .3 - 3 4 .7 7 .8 - 1 4 .8 L ak hotia e t a l (1964)6 .1 - 9 .3 1 0 .6 - 1 5 .1 2 0 - 3 3 1 0 .5 - 2 8 .3 3 3 - 5 8 3 8 - 6 8 2 .8 - 1 7 .5 1 .5 - 6 .0 0 - 0 .5 B an erjee a t a l (1962)
7 .1 2 - 7 .2 8 1 2 .4 - 14 42 - 44 1 1 .6 - 1 3 .4 S o lin a n 8 Shaker (1 9 7 6 )
4 .2 - 1 8 .3 7 - 1 5 18 - 44 6 .2 - 3 8 .5 1 4 - 7 8 1 3 - 7 7 8 - 1 8 1 - 8 0 - 4 G hodsian e t a l (1978)9 .0 2 -1 0 .4 2 3 0 - 3 1 R a is in g h an i e t a l (1981b )
6 .5 2 - 9 .1 4 9 .3 2 -1 2 .8 8 2 7 .4 - 3 2 .6 1 1 .2 - 1 5 .2 A b d elgad ir e t a l (1979)
8 .2 5 - 9 .4 5 13 - 16 1 2 .8 - 2 9 .4 A l-A li e t a l (1987)
6 .5 5 - 6 .8 9 1 0 .8 1 -1 1 .4 1 9 .1 5 - 11 46 - 49 43 - 46 1 - 8 1 - 2 0 - 1 H ajeed e t a l (1980)
7 .6 - 1 1 .0 1 1 .4 - 1 4 .2 24 - 42 2 .9 - 9 .7 21 - 62 33 - 78 0 - 4 0 - 7 H ig g in s 8 Kock (1985)
3 .8 - 1 2 .6 1 0 .6 - 2 0 .3 1 2 .9 - 2 7 .2 2 6 .5 - 6 5 .4 2 1 .1 - 5 6 .3 0 - 1 8 .9 0 - 1 2 .2 0 - 1 Soni 8 A ggaruala (1 9 5 8 )
8 .2 - 9 .2 1 1 .3 - 1 1 .9 2 7 .6 - 2 8 .2 1 2 .7 - 1 8 .5 4 5 - 7 0 2 7 - 5 0 0 - 2 8 - 1 0 T h is stu d y
KEV
RBC (X18V Ml) - Red blood cells PCV (•/) - Packed cell volume LVHP (•/) - Lymphocytes E0S1 (V.) - Eosinophils
HR (gm/dl) - Haemoglobin content UBC (1B3/m 1) - White blood cells NEUT (•/) - Neutrophils MONO {'/.) - Itenocytes
m o ('/) - Basophils

151
A p p e n d i x I I I : R a n g e s o f -tine n o r M a l s e r u M / p 1 a s m a o h e w i s t r yv a l u e s f o r "tKe d r o M e d a r y c a r t e l s .
A P C K A L T A S T L D H A L B GL B T P B U N S O U R C E
5 .1 - 9 .3 G hodsian e t a l (1978)2 1 .5 - 4 1 .5 1 .2 4 - 2 .0 4 2 .5 - 5 .0 Boid e t a l (1980 a )
3 .0 - 4 .4 6 .3 - 8 .7 2 .6 - 8 .0 5 H ig g in s 8 Kock (1 9 8 5 )
17 - 51 1 1 .3 - 7 5 .4 1 .0 - 3 .3 2 .0 - 8 .5 198 - 522 E ld ir d ir i e t a l (1987)
5 .2 - 7 .4 2 5 .5 - 4 4 .5 4 .4 - 1 1 .8 211 - 313 A l- A li e t a l ( 1988)
5 .3 - 1 1 .1 7 4 .0 - 8 7 .0 9 .3 - 1 2 .7 401 - 453 Beaunoyer (1992)
9 .7 - 1 3 .2 5 3 .2 - 5 5 .2 1 .0 2 - 4 5 .5 - 6 .3 1 3 0 .8 -1 4 2 .4 2 .6 - 3 .0 2 .3 - 2 .9 5 .0 - 5 .9 5 .3 - 7 .9 T h is stu d y
KEY
AP - Alkaline phosphatase (IU/L)
CK - Creatine kinase (IU/L)
ALT - Alanine aminotransferase (IU/L)
AST - Aspartate aminotransferase (IU/L)
ALB - Albumin (g/I)
GLB - Globulin (g/1)
TP - Total Proteins (g/1)
BUN - Blood urea nitrogen (mg/1)

152
Appendix IV: Buffers.
(a ) 0.01M PBS pH 7.2.
Solution A: 0.2M NaH2P04 14.0ml.
Solution B: 0.2M Na2HP04 36.0ml.
Solution C: 1.5M NaCl 100.0ml.
To make 0.01m PBS pH 7.2, mix 14ml of solution A, 36 ml of
solution B and 100 ml o f solution C. Add 850ml distilled water to make
up to 1 litre. Adjust pH to 7.2.
(b ). 0.01 M PBS-Tween 20, pH 7.4 (Washing buffer).
Solution A: 0.2M NaH2P04 9.5ml
Solution B: 0.2M Na2HP04 40.5ml
Solution C: 1.5M NaCl 100.0ml
Solution D: Tween-20 0.5ml
To make 0.01M PBS-Tween 20, pH 7.4 (washing buffer) mix 9.5ml of
solution A, 40.5ml o f solution B, 100ml of solution C and 0.5ml of Tween
20. Add 850ml of distilled water to make up to 1 litre. Adjust pH to 7.4
(c). Carbonate/Bicarbonate buffer pH 9.6 (Coating/Coupling).
NaCOa 1.59g
NaHC03 2.93g
To make coating buffer pH 9.6, dissolve A and B in 1000ml of
distilled water.

153
(d ). 0.01 M PBS - Tween 20, pH 7.4 and 1% BSA (Blocking buffer).
Solution A: 0.2M NaH2P04 9.5ml
Solution B: 0.2M Na2HP04 40.5ml
Solution C: 1.5M NaCl 100.0ml
Solution D: Tween-20 0.5ml
Bovine serum albumin (BSA) lOg
To make blocking buffer ph 7.2, mix 9.5ml o f solution A, 40.5 ml
solution B, 100ml o f solution C and 0.5ml of Tween-20 then add lOg of
bovine serum albumin and make the solution up to 1000ml using distilled
water.
(e ). Substrate buffer
Sodium acetate 8.2g
Citric acid 266g
Add distilled water to 8.2g o f sodium acetate and 266g o f citric
acid to make 1000ml. 50mg of tetramethylbenzidine (TMB) is dissolved in
5ml dimethyl sulfoxide (DMSO) to prepare the substrate. To 10ml of
substrate buffer, 4pl of TMB and 40pl of H2O2 are added and used for
one micro-titre plate.
(f ). Phosphate buffered glucose saline (PSG), pH 8.0.
A: Na0H2P04
B: Na2HP04
C: NaCl
0.414g
8.088g
2.550g
D: Glucose (Dextrose) lO.OOg
Dissolve compounds A, B, C and D in 1000ml of distilled water and adjust
the pH to 8.0.
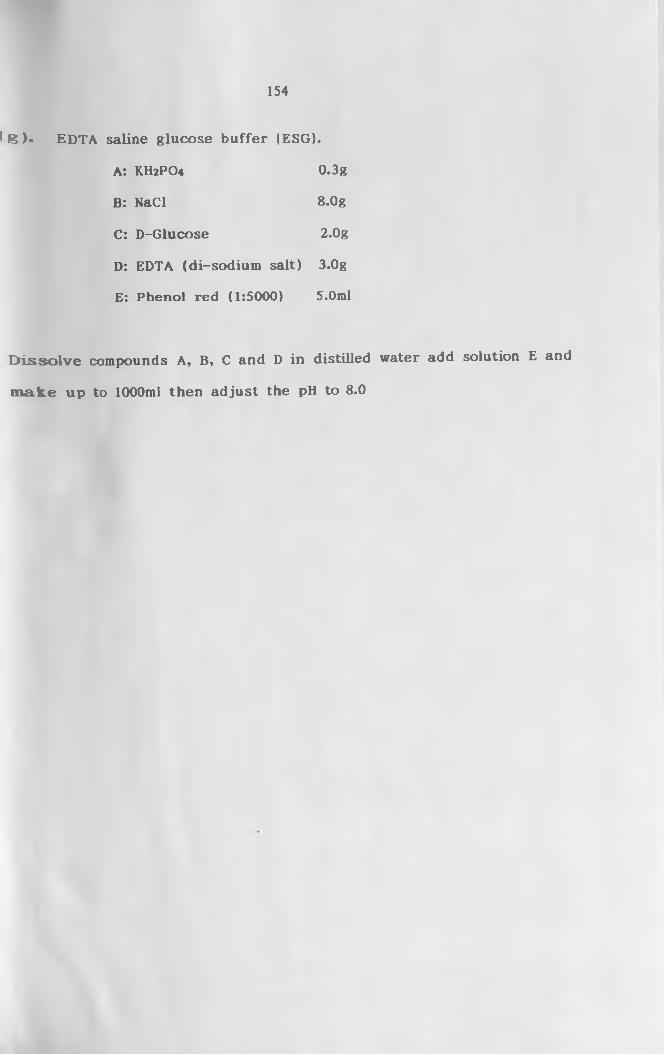
154
( g ) . EDTA saline glucose buffer (ESG).
A: KH2PO4 0.3g
B: NaCl 8.0g
C: D-Glucose 2.0g
D: EDTA (di-sodium salt) 3.0g
E: Phenol red (1:5000) 5.0ml
D isso lv e compounds A, B, C and D in distilled water add solution E and
m ake up to 1000ml then adjust the pH to 8.0