Embed Size (px)
Citation preview
Cost-Effectiveness Analysis:Academic curiosity or practical means to get
more “bang” for our “buck”?
• R Scott Braithwaite, MD, MSc, FACPChief, Section of Value and Effectiveness Research
Division of General Internal Medicine
NYU School of Medicine
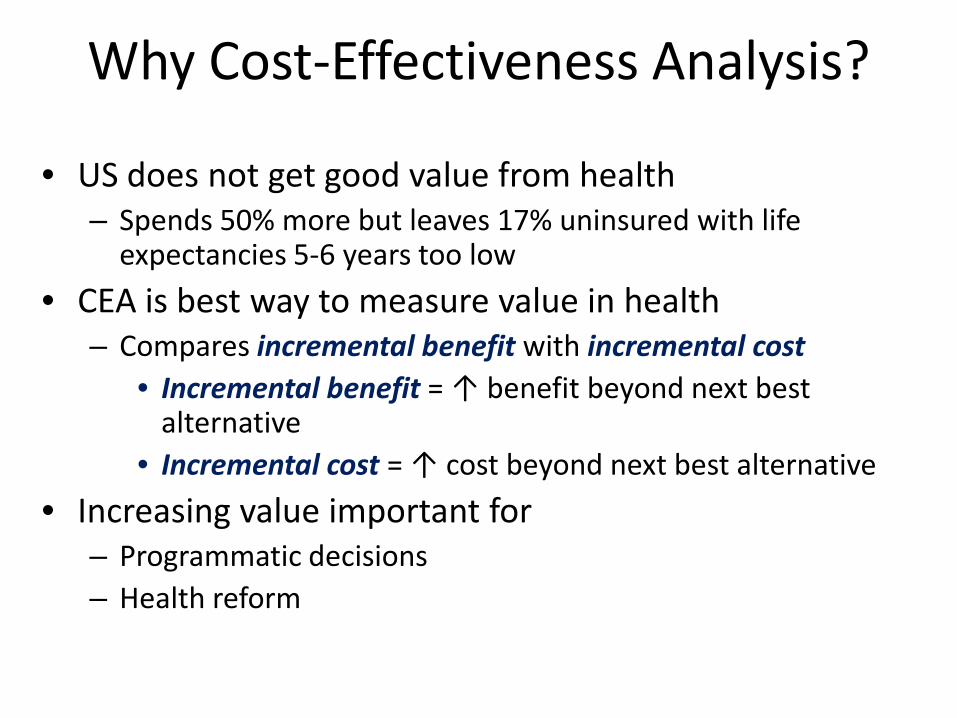
Why Cost-Effectiveness Analysis?
• US does not get good value from health – Spends 50% more but leaves 17% uninsured with life
expectancies 5-6 years too low
• CEA is best way to measure value in health– Compares incremental benefit with incremental cost
• Incremental benefit = ↑ benefit beyond next best alternative
• Incremental cost = ↑ cost beyond next best alternative
• Increasing value important for– Programmatic decisions– Health reform

Why Cost-Effectiveness Analysis?
• Value impacts generalizability and scalability– Resources used for study intervention may be
resources not available for alternative interventions
– Does study intervention deliver more health benefit than alternative uses?
• Explicit, systematic, “level playing field”

Why Not Cost-Effectiveness Analysis?
• Difficult to synthesize evidence from different cost-effectiveness studies
• Assumptions in cost-effectiveness not transparent – An analysis based on a high-quality study may appear to
have same certitude as analysis based on expert opinion
• A policy tool in search of U.S. policy “levers” – Other countries use it (e.g. Canada, U.K., Australia,
Netherlands) but U.S. stakeholders usually don’t

Research to address limitations of cost-effectiveness analysis
• Synthesizing cost-effectiveness evidence
• Making assumptions underlying cost-effectiveness studies more transparent
• Making cost-effectiveness results more actionable for stakeholders– Program planning
– Incentive design

Cost-effectiveness analysis IS:*The use of formal analysis to assist decision makers in choosing from among competing alternatives, in situations of limited resources.

Cost-effectiveness analysis is NOT:
• Indiscriminate cost-cutting
• Downsizing
• Bean counting
• The one and only answer

Cost-Consequence Space
+
−
+ −
IncrementalHealth Effect
Incremental Cost
Yes
NoEvaluate
C/ERatio
EvaluateC/ERatio
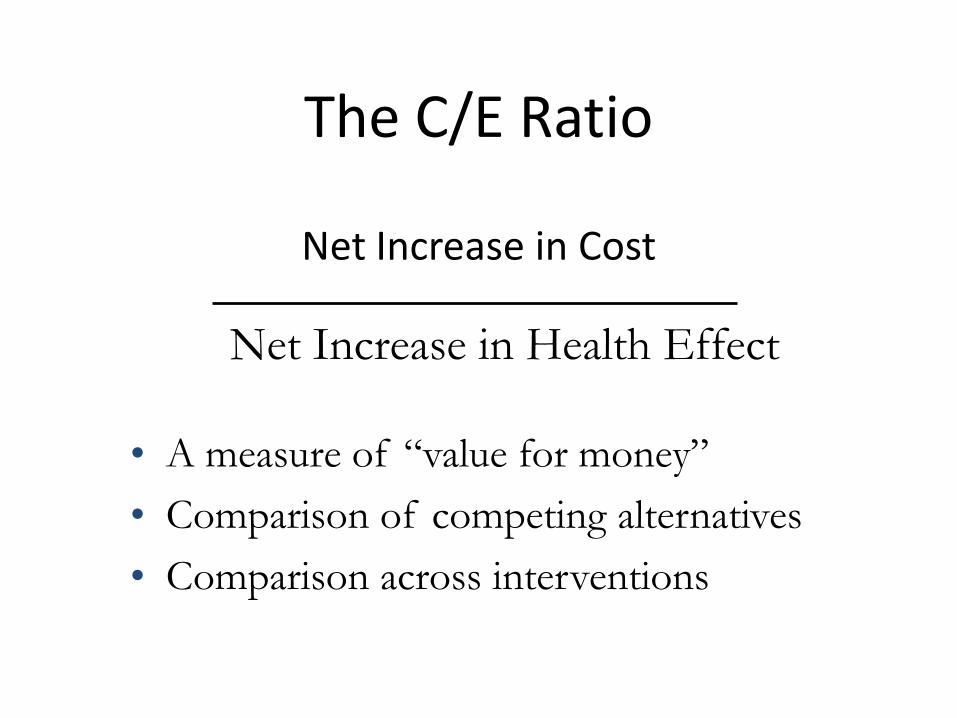
The C/E Ratio
Net Increase in Cost
Net Increase in Health Effect
• A measure of “value for money”• Comparison of competing alternatives• Comparison across interventions

Cost-effectiveness Primer
• C/E ratios expressed in – Cost per life-year
– Cost per QALY (quality-adjusted life-year)
• Higher numbers are less favorable – $1,000,000/QALY means society would pay one million
dollars for an additional year of life
• Lower numbers are more favorable – $100/QALY means society would pay only one hundred
dollars for an additional year of life

Cost-effectiveness Analysis Primer
• Analyses require evidence about benefit and cost
• Evidence may come from one study but often from mix of different studies and opinion
• Sensitivity Analyses evaluate impact of uncertainty about evidence– Smaller study = larger 95% CI = more uncertainty
Research to address limitations of cost-effectiveness analysis
• Synthesizing cost-effectiveness evidence
• Making assumptions underlying cost-effectiveness studies more transparent
• Making cost-effectiveness results more actionable for stakeholders– Program planning
– Incentive design

Objective
• Research objective– Synthesize cost-effectiveness evidence to identify
high-value cardiovascular health services
• Decision-centered goal: – Inform consumers to
• Engage in more informed health discussions • Seek health plans offering high-value services
without financial or administrative barriers

Methods – evidence synthesis• Guiding principles
– Define “services” broadly• Prevention
• Diagnosis
• Treatment
• Management.
– Limit group using standards of • Quality of CEA study
• Non-obsolescence
• Consistency of evidence
• Relevance to consumers

Identifying CV services
• Query National Registry of Cost-Effectiveness Analysis (CEA) Results – Summarizes and reviews published, original, English-
language cost-utility analysis articles
– Search for “cardiovascular services” in “U.S.”
• Supplementary searches – Published literature
– Guidelines of national medical and scientific societies
• Published in peer-reviewed scientific journals
• Used explicit standardized evidence syntheses.

Definition of “value”
• Value = additional benefit per additional cost – “Bang for buck”– Inverse of incremental cost-effectiveness ratio– Not the same as cost-saving
• High-value = Value better than what we know US willing to pay for – ≥ $100,000 per year of good-quality life (QALY)
• Low-value = Value worse than what we know US not willing to pay for– ≤ $300,000 per QALY
Braithwaite RS et al, Medical Care, 2008

Quality of CEA Study
• Obtain original publications
• Apply the Quality of Health Economic Studies
– Validated instrument for measuring the quality of cost-effectiveness analyses.
• 75 is a commonly-used cutoff for high quality
– Each study was reviewed by at least one reviewer
• Reviewers had inter-rater kappa of 0.68

Non-obsolescence• Recommendation by up-do-date guideline(s) of
clinical or scientific society.– Search National Guideline Clearinghouse
• Only considered guideline if – Published in peer-reviewed journals– Used explicit evidence rating scales
• High-value service must receive – Highest grade of supporting evidence
• e.g. AHA “Level A”
– Strongest recommendation in favor • e.g. AHA “Level 1”
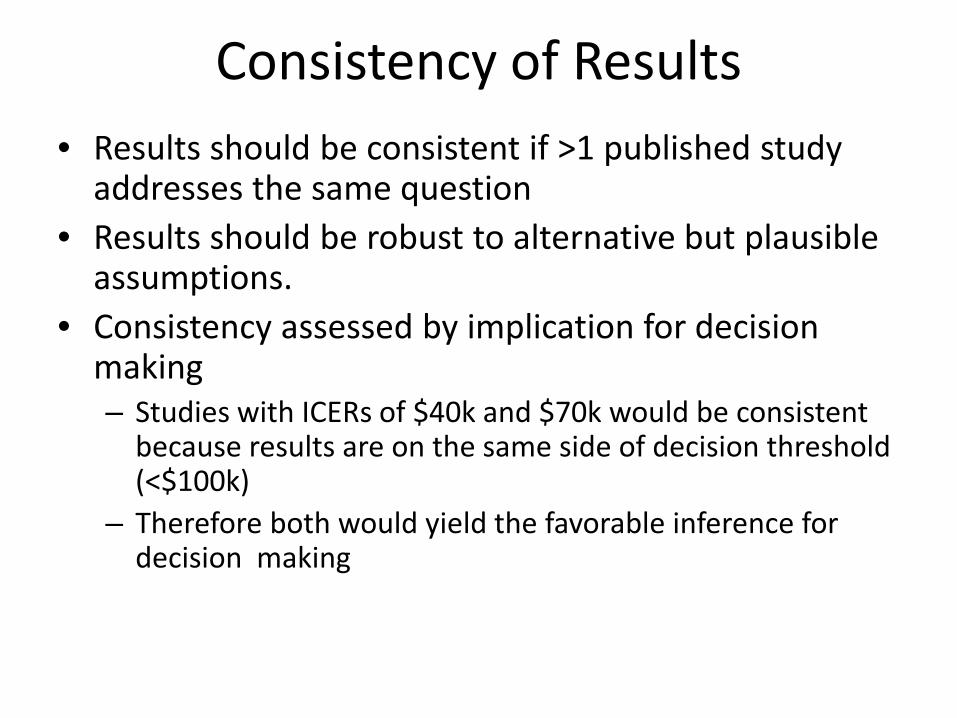
Consistency of Results• Results should be consistent if >1 published study
addresses the same question• Results should be robust to alternative but plausible
assumptions. • Consistency assessed by implication for decision
making– Studies with ICERs of $40k and $70k would be consistent
because results are on the same side of decision threshold (<$100k)
– Therefore both would yield the favorable inference for decision making
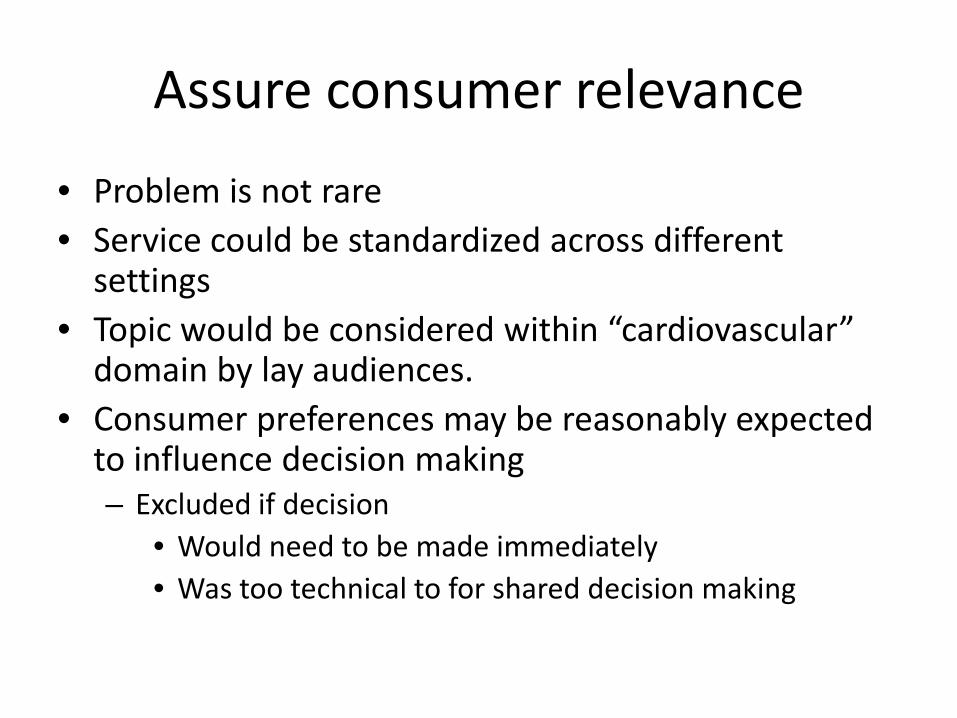
Assure consumer relevance
• Problem is not rare• Service could be standardized across different
settings • Topic would be considered within “cardiovascular”
domain by lay audiences. • Consumer preferences may be reasonably expected
to influence decision making– Excluded if decision
• Would need to be made immediately • Was too technical to for shared decision making
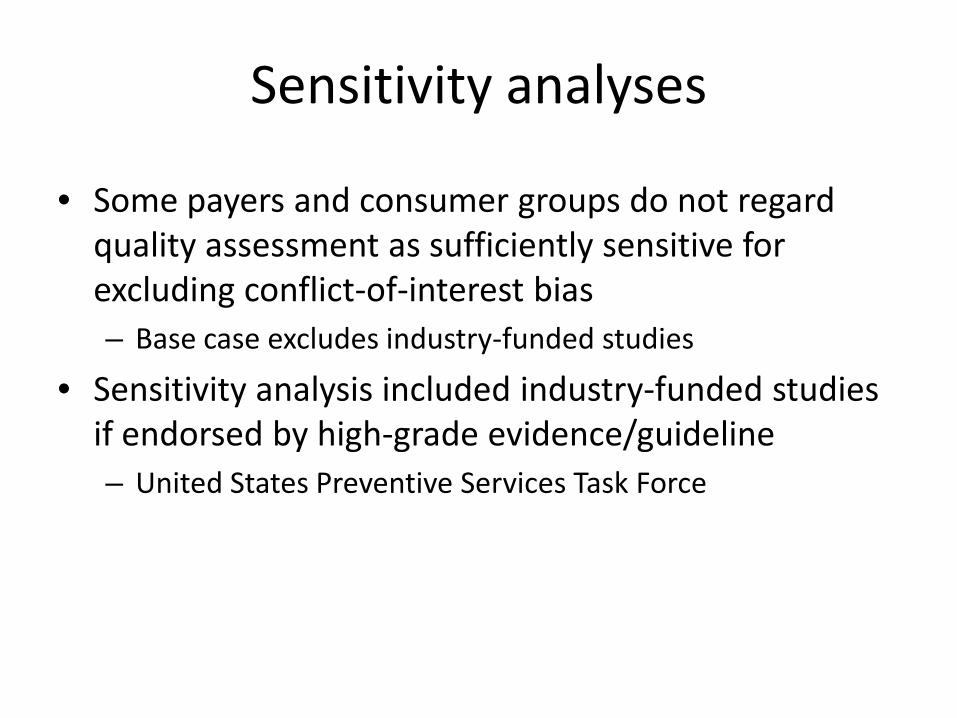
Sensitivity analyses
• Some payers and consumer groups do not regard quality assessment as sufficiently sensitive for excluding conflict-of-interest bias– Base case excludes industry-funded studies
• Sensitivity analysis included industry-funded studies if endorsed by high-grade evidence/guideline– United States Preventive Services Task Force
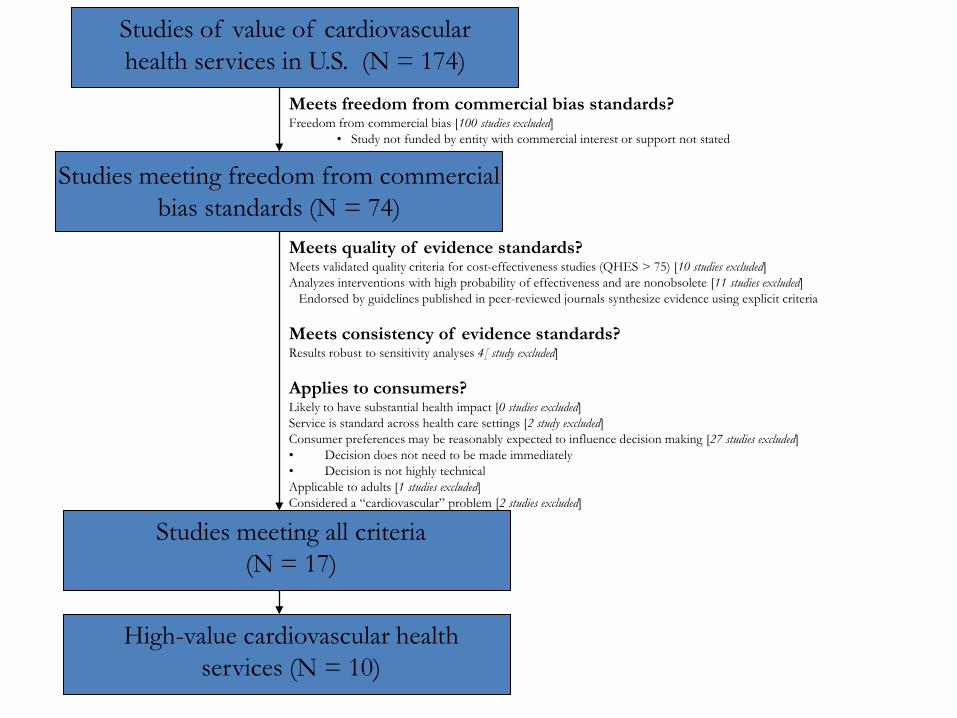
Meets freedom from commercial bias standards?Freedom from commercial bias [100 studies excluded]
• Study not funded by entity with commercial interest or support not stated
Studies of value of cardiovascular health services in U.S. (N = 174)
Studies meeting freedom from commercial bias standards (N = 74)
Studies meeting all criteria (N = 17)
High-value cardiovascular health services (N = 10)
Meets quality of evidence standards?Meets validated quality criteria for cost-effectiveness studies (QHES > 75) [10 studies excluded]Analyzes interventions with high probability of effectiveness and are nonobsolete [11 studies excluded]
Endorsed by guidelines published in peer-reviewed journals synthesize evidence using explicit criteria
Meets consistency of evidence standards?Results robust to sensitivity analyses 4[ study excluded]
Applies to consumers?Likely to have substantial health impact [0 studies excluded]Service is standard across health care settings [2 study excluded]Consumer preferences may be reasonably expected to influence decision making [27 studies excluded]• Decision does not need to be made immediately • Decision is not highly technical Applicable to adults [1 studies excluded]Considered a “cardiovascular” problem [2 studies excluded]

Results: High-value CV servicesHigh-value health
serviceGoal of service
People for whom value is likely high
Cholesterol-lowering medication (statin)
Prevent heart attacks
Known coronary heart disease
Cholesterol-lowering medication (statin)
Prevent heart attacks
LDL > 130 and 10-year CHD risk > 5%
Screening for high blood pressure and tx with diuretic, b-bl or ACE
Prevent heart attacks and strokes
Known hypertension
Oral blood-thinning medication (warfarin)
Prevent blood clot to lung
First blood clot without known reason
Injectable blood-thinning medication (low molec-weight heparin)
Prevent blood clot to lung
Just diagnosed with blood clot
Mentor SM and Braithwaite RS, Am J Managed Care, 2011

Results: High-value CV servicesHigh-value health
serviceGoal of service People for whom value is
likely high Implantable cardiac defibrillator
Prevent “sudden death”
Congestive heart failure because of a heart attack (EF < 30%)
Blood-thinning medication (aspirin)
Prevent future heart attacks
Coronary heart disease
Anti-platelet medication (clopidogrel) for 12 months
Prevent future heart attacks
After heart attack or other acute coronary events
Medication that reduces strain on heart (beta-blocker)
Prevent future heart attacks
Coronary heart disease
Oral blood-thinning medication (warfarin) and necessary labs
Prevent future strokes
Non-valvular atrialfibrillation and >=1 stroke risk factors
Mentor SM and Braithwaite RS, Am J Managed Care, 2011

Studies meeting all criteria (N = 7)
High-value cardiovascular health services (N = 3)
Meets quality of evidence standards?Meets validated quality criteria for cost-effectiveness studies (QHES > 75) [1 studies excluded]Analyzes interventions with high probability of effectiveness and are nonobsolete [0 studies excluded]
Endorsed by guidelines published in peer-reviewed journals synthesize evidence using explicit criteria
Meets consistency of evidence standards?Results robust to sensitivity analyses and consistently suggest ICER < $100,000 per LY or per QALY [3 studies excluded]
Applies to consumers?Likely to have substantial health impact [0 studies excluded]Service is standard across health care settings [0 study excluded]Consumer preferences may be reasonably expected to influence decision making [0 studies excluded]• Decision does not need to be made immediately • Decision is not highly technical Applicable to adults [0 studies excluded]Considered a “cardiovascular” problem [0 studies excluded]
Industry funded studies with strong support of guidelines (N = 10)
Sensitivity Analyses

Sensitivity Analyses: High-value CV services
High-value cardiovascular health
service
Goal of service People for whom value is likely high
Smoking cessation counseling, NRT, and pharmacotherapy
Stop smoking All smokers
Stroke prevention with anti-platelet drugs (aspiring or clopidogrel)
Prevent stroke People who have had a stroke or TIA (“mini-stroke”)
Aspirin for primary prevention of cardiovascular in men
Prevent heart attacks
Middle-age men with 10 year CHD risk >5% without increased bleeding risk

Limitations
• Does not evaluate an exhaustive list of cardiovascular services
• Very few services have been studied in all relevant patient groups.
• Relatively sparse results highlight the importance of expanding comparative effectiveness research

Conclusions
• Many common cardiovascular services are identifiable as high-value– Expensive as well as cheap
• Identifying high-value services may help– Engage in more informed health discussions
– Seek health plans that offer services without financial or administrative barriers
• Approach can be applied to other services

Research to address limitations of cost-effectiveness analysis
• Synthesizing cost-effectiveness evidence
• Making assumptions underlying cost-effectiveness studies more transparent
• Making cost-effectiveness results more actionable for stakeholders– Program planning
– Incentive design

Objective• Research Objective
– Can we augment standard cost-effectiveness analysis methods to develop a sensitivity analysis based on quality of evidence?
• Decision centered goal– Clinicians and policy-makers often wonder “what
goes into the model”– Make the uncertainty from low-quality evidence
transparent to model users so they know whether to “trust the model” for their particular question

Methods
• Basic concept of our approach– When potential information sources have
insufficient quality of evidence, don’t use them
– Instead, assume that little is known by using uninformative distributions over wide range
– Don’t obscure questionable data under a “false veneer of mathematical certitude”
• Warning! If you set evidence standards very high, not much of the available evidence may qualify.

Methods
– Assess quality of evidence using USPSTF guidelines
• Study design
–Design differs from controlled experiment
• Internal validity
–Results represent truth in study population
• External validity
–Results represent truth in target population
– Our approach can be used with any evidence-evaluation hierarchy
• We chose USPSTF guidelines because of ubiquity not because of rigor

Methods
• Set minimum standard in each evidence domain– These can be “dialed” up or down at will
• Evaluate each possible source of evidence • If source meets evidence criterion, use its 95%
confidence interval in the analysis• If evidence does not meet criterion, do not use
it in the analysis – Instead use uninformative (“wide”) distribution

Test Case: Directly observed therapy for HIV antiretrovirals
• Base Case: No evidence criteria – All 17 data sources eligible for parameter estimation
• Study Design set to highest standard (“1”)– 13 out of 17 sources were eligible
• Internal Validity set to highest standard (“good”)– 9 out of 17 sources were eligible
• External Validity set to highest standard (“high”)– 5 out of 17 sources were eligible
• All three criteria set to highest standards– 3 out of 17 sources were eligible

Cost-Effectiveness Plane PrimerIncremental Cost
Incremental Benefit
Each dot shows distinct run of model
Confidence Ellipse analogous to 95% Confidence Interval (wider = less precise) (narrow = more precise)
Separates unfavorable (above) from favorable (below)
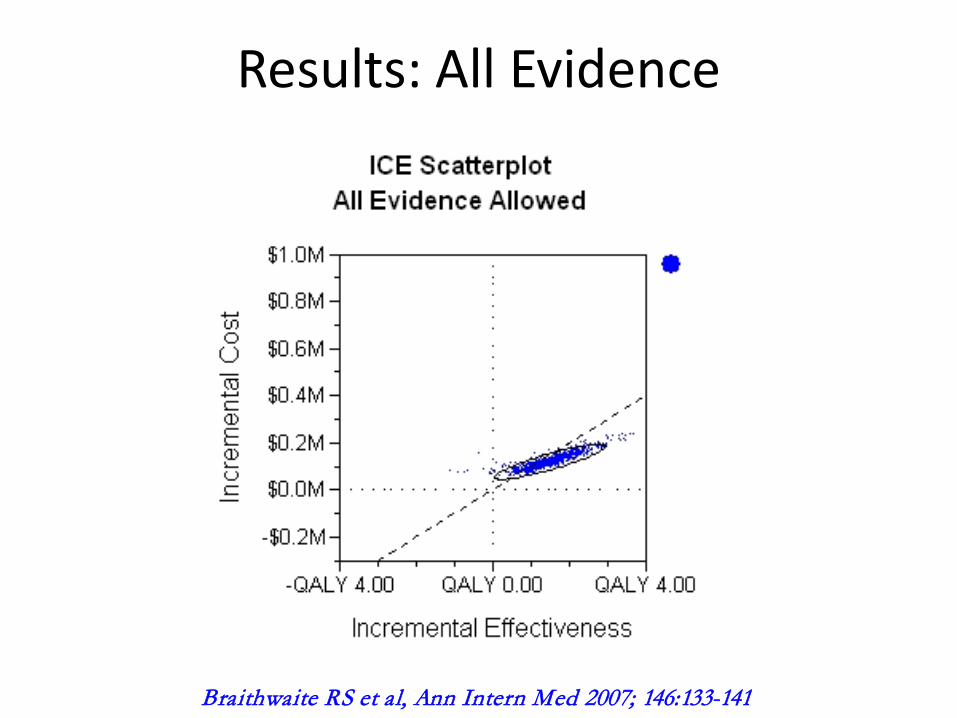
Results: All Evidence
Braithwaite RS et al, Ann Intern Med 2007; 146:133-141

Results: Internal Validity “Good”
Braithwaite RS et al, Ann Intern Med 2007; 146:133-141

Results: Study Design “1”
Braithwaite RS et al, Ann Intern Med 2007; 146:133-141

Results: External Validity “High”
Braithwaite RS et al, Ann Intern Med 2007; 146:133-141

Results: All 3 Criteria
Braithwaite RS et al, Ann Intern Med 2007; 146:133-141
Conclusions
• Quality of evidence may have profound impact on the precision and estimates of CEAs
• Stricter evidence criteria may produce more uncertain results because there are fewer studies to base assumptions on
• Approach shows when evidence is not good enough for decision making– Need higher-quality information on HIV DOT

Research to address limitations of cost-effectiveness analysis
• Synthesizing cost-effectiveness evidence
• Making assumptions underlying cost-effectiveness studies more transparent
• Making cost-effectiveness results more actionable for stakeholders– Program planning
– Incentive design

Background
• Cost-sharing becoming a standard “volume knob” to control utilization in U.S.
• Cost-sharing has– Great potential to control costs
– Great potential to cause harm
• Increasing calls to link cost-sharing to value (e.g. value-based insurance design)– No cost-sharing for high-value services
– Same or increased cost-sharing for low-value services

Purpose
• Research Objective– To estimate the impact of value-linked cost-
sharing if it were applied systematically across US health system
• Decision-centered Goal– To determine whether value-based insurance
design should be scaled up or rolled back

Methods
Cost-sharing 0% 18%(Current)
30% 100%
Relative utilization
1.06 1.00 0.85 0.65
• From RAND, we can estimate the impact of cost-sharing amount on health service demand
• Results confirmed by >100 observational studies

Age NHealth
expenditure
New year = new “pull” from cost-effectiveness distribution
Insured Uninsured Insured, value-based cost-sharing
High cost-sharing
lowers health expenditures
Prevailing cost-sharing
maintains health
expenditures
Value increases, lowers, or maintains
health expenditures
Age N+1
Mortality

Methods
• Possible way to link cost-effectiveness results to cost-sharing– > $300K/QALY: Increase cost-sharing
– $100K-300K/QALY: No Δ cost-sharing
– < $100K/QALY: Waive cost-sharing
– Cost-saving: Reverse cost-sharing?
Braithwaite RS et al, Ann Intern Med. 2007

4.5
4.6
4.7
4.8
4.9
5
5.1
5.2
5.3
Current cost-shar Current insurance
Current cost-shar Expand insurance
Value-based cost-sharCurrent insurance
Value-based cost-sharExpand insurance
20% 30% 40% 50% Copayment if low-value
No cost-shar, Expand insurance
Life Expectancy Gain (Years)
Braithwaite RS et al, PLoS Medicine, 2010

Current cost-shar Current insurance
Current cost-shar Expand insurance
Value-based cost-sharCurrent insurance
Value-based cost-sharExpand insurance
20% 30% 40% 50% Copayment if low-value
No cost-shar, Expand insurance
Annual per-capita cost (2003 $)
Braithwaite RS et al, PLoS Medicine, 2010
4800
5000
5200
5400
5600
5800
6000
6200
6400

Conclusions
• Value-linked cost-sharing may increase life expectancy from health care while reducing costs
• Costs may be lowered sufficiently to offset incremental expenditures from expanding health insurance coverage
Research to address limitations of cost-effectiveness analysis
• Synthesizing cost-effectiveness evidence
• Making assumptions underlying cost-effectiveness studies more transparent
• Making cost-effectiveness results more actionable for stakeholders– Program planning
– Incentive design
Modeling HIV Prevention Priorities in New York City
• Research Objective• Construct an operations research model to
assist HIV prevention planners determine the optimal combination of prevention strategies that will maximize the number of new infections averted, within funding limits.
• Decision-centered goal: • How much additional money to ask for, and
what to spend it on?

Modeling HIV Prevention Priorities in New York City
• Model Features:– Includes 11 required and 8 recommended, or 19/24
interventions/strategies outlined by CDC in ECHPP – Allows decision maker to prioritize HIV prevention
strategies based upon strength of evidence, budget, and feasibility constraints.
– Explores the interplay between various HIV prevention strategies.
– Accounts for complex behavioral heterogeneity (social network characteristics, partner mixing, etc.)
– Includes behavioral feedback loops that may influence transmission risk.
Limitations
• Preliminary results– Additional sensitivity analyses needed
– Some inputs need further verification
– Formal optimization of portfolio in progress
• Evidence limitations
• Only considers the ECHPP interventions– Future work to consider broader range of
interventions and targets

Conclusions• Potential to reduce HIV incidence by 60%
– Focus on HIV-infected
– What is effective may not be low cost/infection averted
• Future work– Develop and evaluate new targeting for high-value
interventions
– Virtuous cycle for public health/academic partnership• Use inferences from models to inform decisions
• Evaluate impact of decisions
• Update model with new data
• Repeat

Research to address limitations of cost-effectiveness analysis
• Synthesizing cost-effectiveness evidence
• Making assumptions underlying cost-effectiveness studies more transparent
• Making cost-effectiveness results more actionable for stakeholders– Program planning
– Incentive design
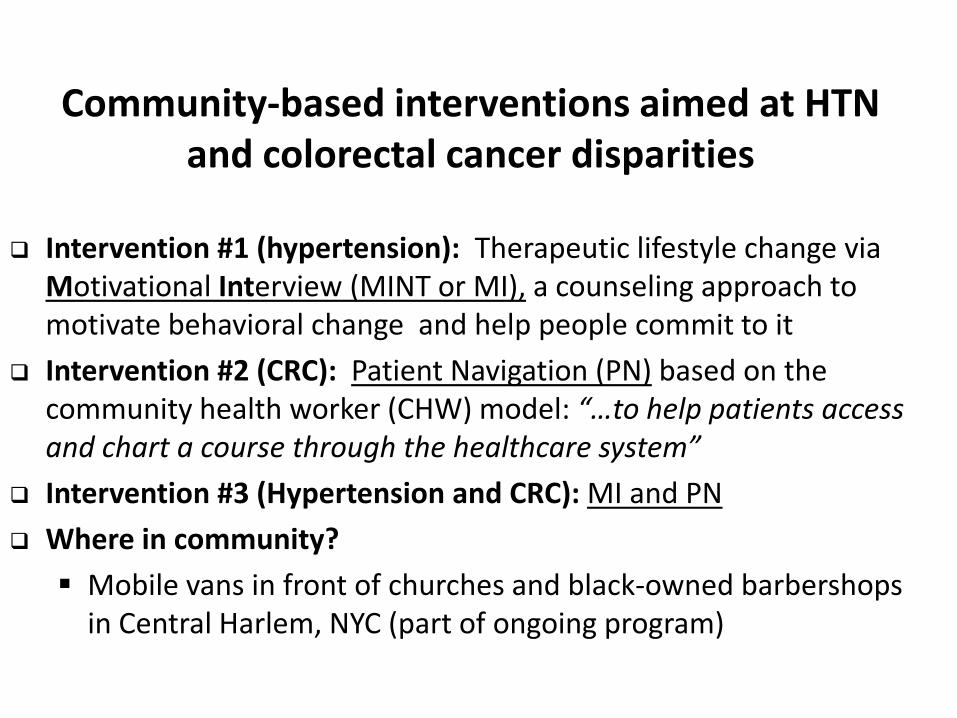
Community-based interventions aimed at HTN and colorectal cancer disparities
Intervention #1 (hypertension): Therapeutic lifestyle change via Motivational Interview (MINT or MI), a counseling approach to motivate behavioral change and help people commit to it
Intervention #2 (CRC): Patient Navigation (PN) based on the community health worker (CHW) model: “…to help patients access and chart a course through the healthcare system”
Intervention #3 (Hypertension and CRC): MI and PN
Where in community?
Mobile vans in front of churches and black-owned barbershops in Central Harlem, NYC (part of ongoing program)

CEA and Community-based research
•Research Objectives•What is cost-effectiveness of these community-based interventions?•Is value sufficient for scaling?•Will it deliver more “health” for the money compared to alternative uses?
•Decision Goal: •Should one or both interventions be rolled out, and given funding priority relative to other interventions addressing important health disparities in urban black men?
Methods
• Computer simulation for African-American men who reside in NYC incorporating two distinct outcomes:
– Blood pressure control and the consequences of high BP over a period of time
– Colorectal cancer screening and the long-term consequences of screening and the disease if left untreated.

Hypertension Model-Part I

Colorectal Cancer Model

Results• Models were created while data is collected
– Like “cartridges" into which data can be inserted, once it is collected and analyzed
• After data is inserted:– What is long-term effect of these 2 community-based
intervention on life expectancy and high-quality life expectancy?
– What is their value? • How much “health” would be bought if they were
rolled-out, and how would this compare to the health that could be “bought” by spending the same money on alternative programs?

Research to address limitations of cost-effectiveness analysis
• Synthesizing cost-effectiveness evidence
• Making assumptions underlying cost-effectiveness studies more transparent
• Making cost-effectiveness results more actionable for stakeholders– Program planning
– Incentive design

Conclusions
• Methods exist to– Assess whether sufficient cost-effectiveness evidence
could possibly impact a decision
– Make evidence uncertainty transparent to inform whether cost-effectiveness should impact a decision
• Decision suitable for impact involve– Getting the most “health” from a portfolio of
interventions by scaling up or down funding
– Impacting incentives as well as coverage

Questions ??????